An ER translocon for multi-pass membrane protein biogenesis
- Department of Biochemistry and Molecular Biology, The University of Chicago, United States
- Department of Molecular Genetics and Cell Biology, The University of Chicago, United States
- Department of Pharmaceutical Chemistry, University of California, San Francisco, United States
- Center for Research Informatics, The University of Chicago, United States
Figures
Figure 1 with 1 supplement

Natively isolated TMCO1-ribosome complexes contain multiple transmembrane components.
(A) Emetine- and micrococcal nuclease-treated membranes from wild-type (WT) or 3xFlag-TMCO1 (Flag) HEK293 cells were digitonin-solubilized, immunoprecipitated via the 3xFlag tag on TMCO1, and the eluate sedimented through a sucrose cushion to isolate the ribosome-associated fraction for analysis. (B) Proteins enriched in the ribosomal fraction after immunoprecipitation from 3xFlag-TMCO1 or wild-type membranes. (C) Top hits were confirmed by western blotting. The catalytic STT3A subunit of the OST complex is not detected. (D) Topology and domain structure for the top hits, based on Uniprot annotation, homology modeling, de novo structure prediction (in RaptorX-Contact), and experimental mapping; the Sec61 complex is not shown. Distinguishing features include the large globular luminal domain of Nicalin (in contrast with the flexible luminal domains of NOMO and CCDC47), the large globular cytosolic domain of CCDC47 (with a conserved C-terminal coiled-coil), and a conserved cytosolic coiled-coil between the first two TMDs of TMCO1. TMEM147 is the core, multi-pass subunit of the Nicalin-TMEM147-NOMO complex Dettmer et al., 2010; note that the short extra-membrane loops of TMEM147 make it difficult to detect by mass spectrometry.
Figure 1—figure supplement 1

Additional interaction analysis of the TMCO1 translocon components.
(A) Comparison of co-purifying components in the ribosome-bound fraction (“Pellet”), following immunoprecipitation from digitonin-solubilized microsomes isolated from HEK293 cells stably expressing 3xFlag-TMCO1 or 3xFlag-Nicalin. (B) Digitonin-solubilized microsomes from 3xFlag-TMCO1 HEK293 cells were cleared of ribosomes by sedimentation. The ribosome-free fraction (“Input”) was then subjected to affinity purification using anti-Flag or anti-NOMO antibodies. Immunoprecipitation of 3xFlag-TMCO1 recovers only trace amounts of the other components, and NOMO1 immunoprecipitation fails to recover either TMCO1 or CCDC47. However, as shown previously (Dettmer et al., 2010), Nicalin is efficiently recovered by NOMO immunoprecipitation.
Figure 2 with 8 supplements
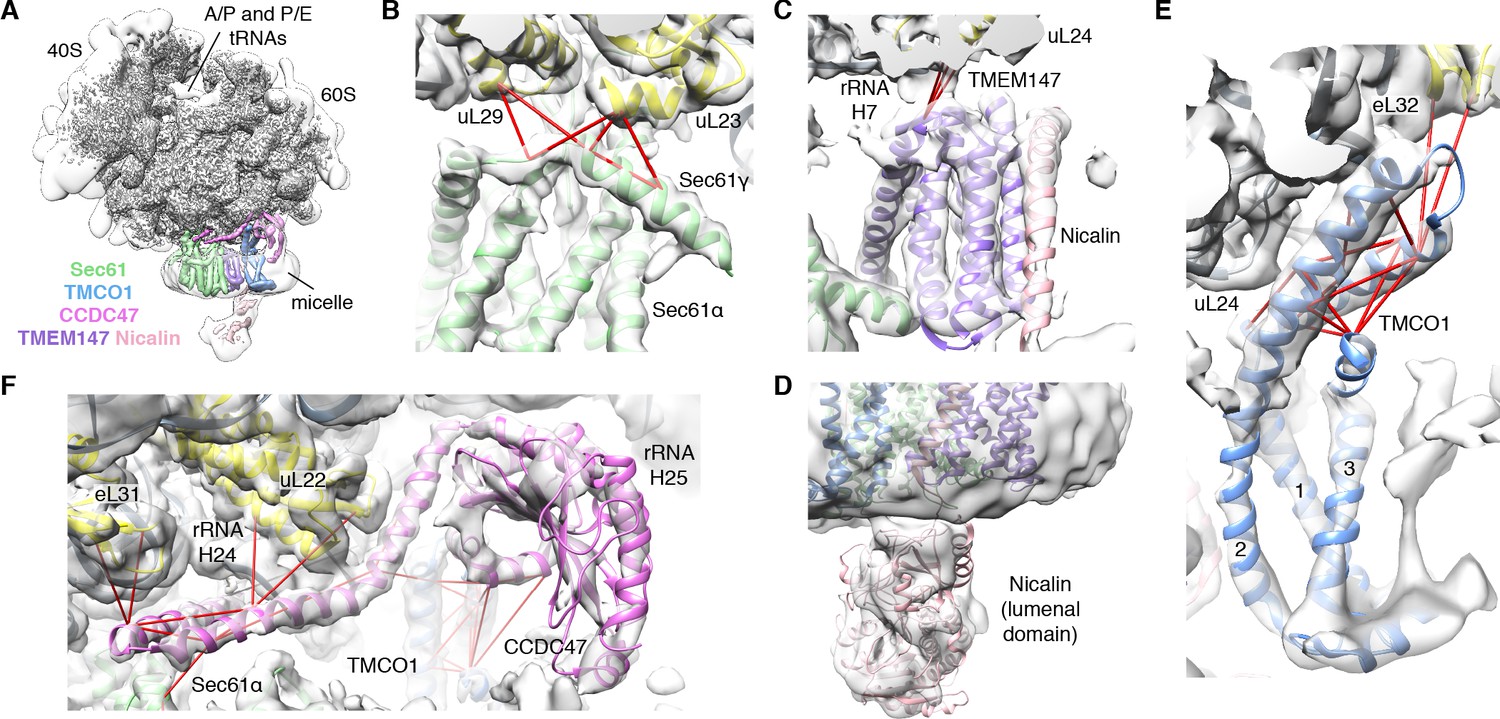
CryoEM structure of the ribosome-TMCO1 translocon complex.
(A) Density for the 80S ribosome, A/P and P/E tRNAs is from the sharpened global map after low-pass filtering by local resolution. The translocon density is from the unsharpened focused map after low-pass filtering by local resolution; isolated densities for Sec61 (green), TMEM147 (purple), TMCO1 (blue) and CCDC47 (violet) are shown at a single threshold. The focused map is also shown at a lower threshold (transparent) to highlight luminal density and the micelle. (B) Closeup of the Sec61 complex, including experimentally observed cross-links (red) between Sec61γ and the indicated ribosomal subunits (yellow). (C) Closeup of the TMEM147-Nicalin complex (purple, pink), and cross-links between uL24 and the conserved TM3-TM4 loop of TMEM147. (D) The luminal domain of Nicalin (pink) extends below TMEM147 in a large lobe of density. (E) Closeup of TMCO1, and multiple intra- and inter-molecular cross-links. (F) Closeup of the cytosolic domain of CCDC47 and cross-links to the indicated ribosomal subunits, Sec61α, and the TMCO1 coiled coil; a cross-link that exceeds the distance cutoff of 35 Å is in black. Density in panels B-F is from the unsharpened signal-subtracted map after low-pass filtering by local resolution.
Figure 2—figure supplement 1
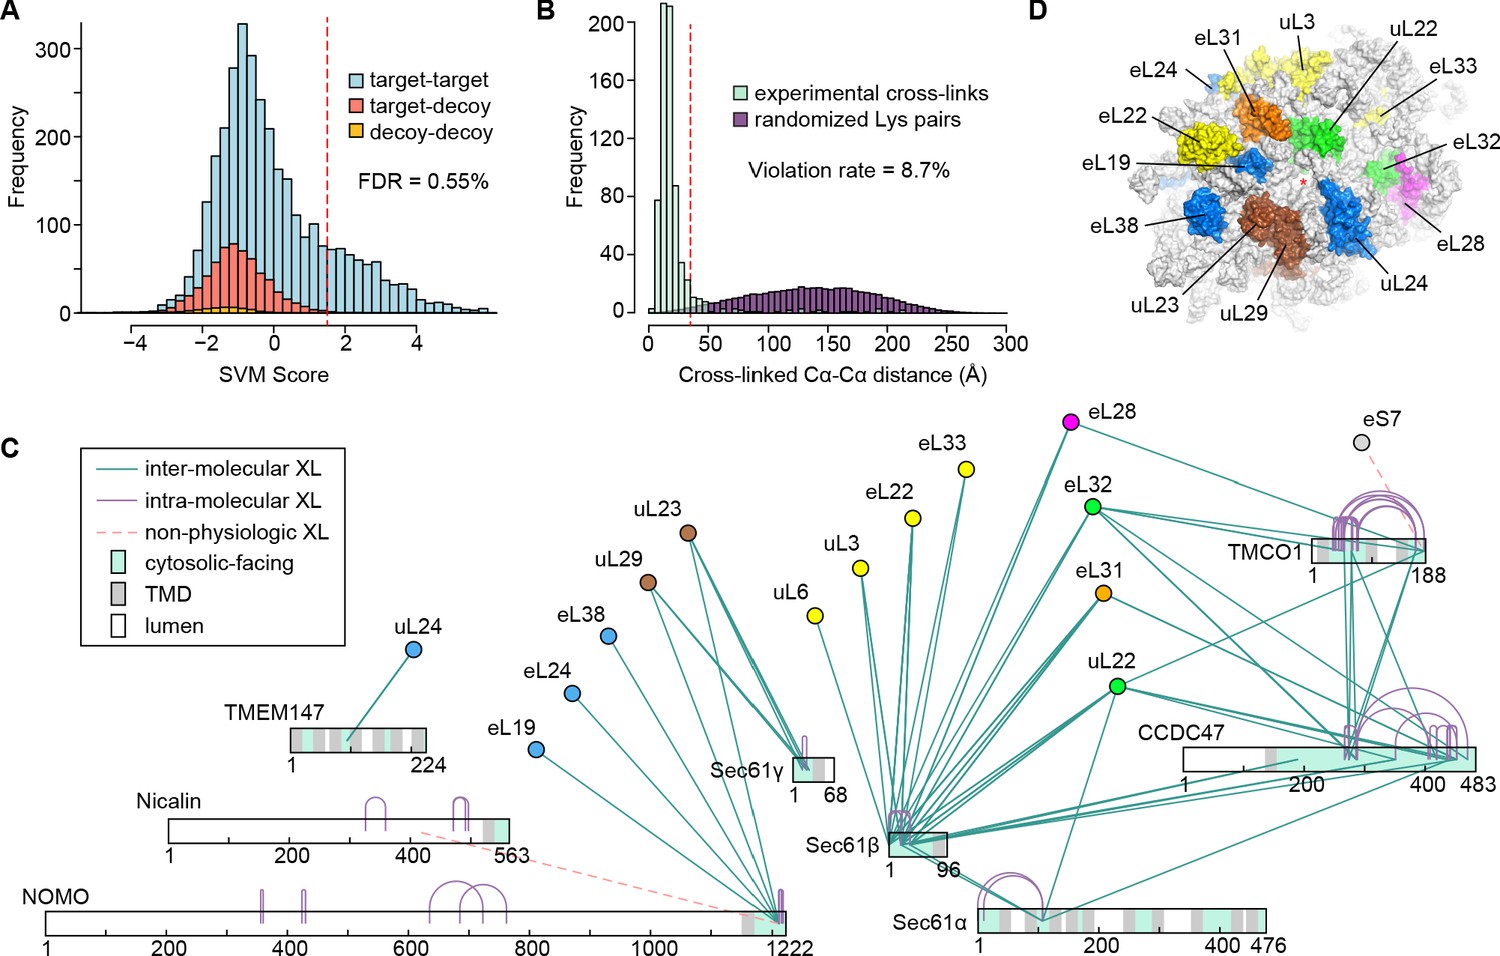
Cross-linking and mass spectrometry analysis of TMCO1-associated ribosomes.
(A) Classification of cross-linked residue pairs. Crosslinks are reported at a false discovery rate of 0.55% corresponding to a classification score threshold of 1.5 (dashed red line). FDR was determined by modeling the distributions of crosslinks with zero (blue), one (red) or two (yellow) peptides randomly matching at given score using a decoy database (see methods). (B) Distance distributions for all ribosome-ribosome crosslinks mapping to a high-resolution cryo-EM structure of the human ribosome (PDB ID 4UG0) (Khatter et al., 2015). After applying a conservative cutoff (SVM score ≥ 1.5), 715 crosslinks could be mapped to the structure with the majority (91.3%) of crosslink Cα-Cα distances lying within the 35 Å upper limit (red dashed line). A distribution sampled from all possible Lys-Lys pairs on the ribosome (purple) is shown for comparison. (C) Network diagram of the 130 strongest (SVM score ≥ 1.5) intra- (purple lines) and inter-molecular (cyan lines) unique cross-linked residue pairs involving the membrane components. Luminal (white), transmembrane (grey) and cytosolic (cyan) regions of the membrane components are indicated. Crosslinks between the luminal domain of Nicalin and the cytosolic domain of NOMO, and between the C-terminus of TMCO1 and eS7, are likely non-physiologic (dashed red lines). (D) Surface representation of the human ribosomal large subunit highlighting the locations of proteins crosslinked to one or more of the membrane components. Ribosomal subunits are colored as in (C), and the exit tunnel is marked with a red asterisk.
Figure 2—figure supplement 2
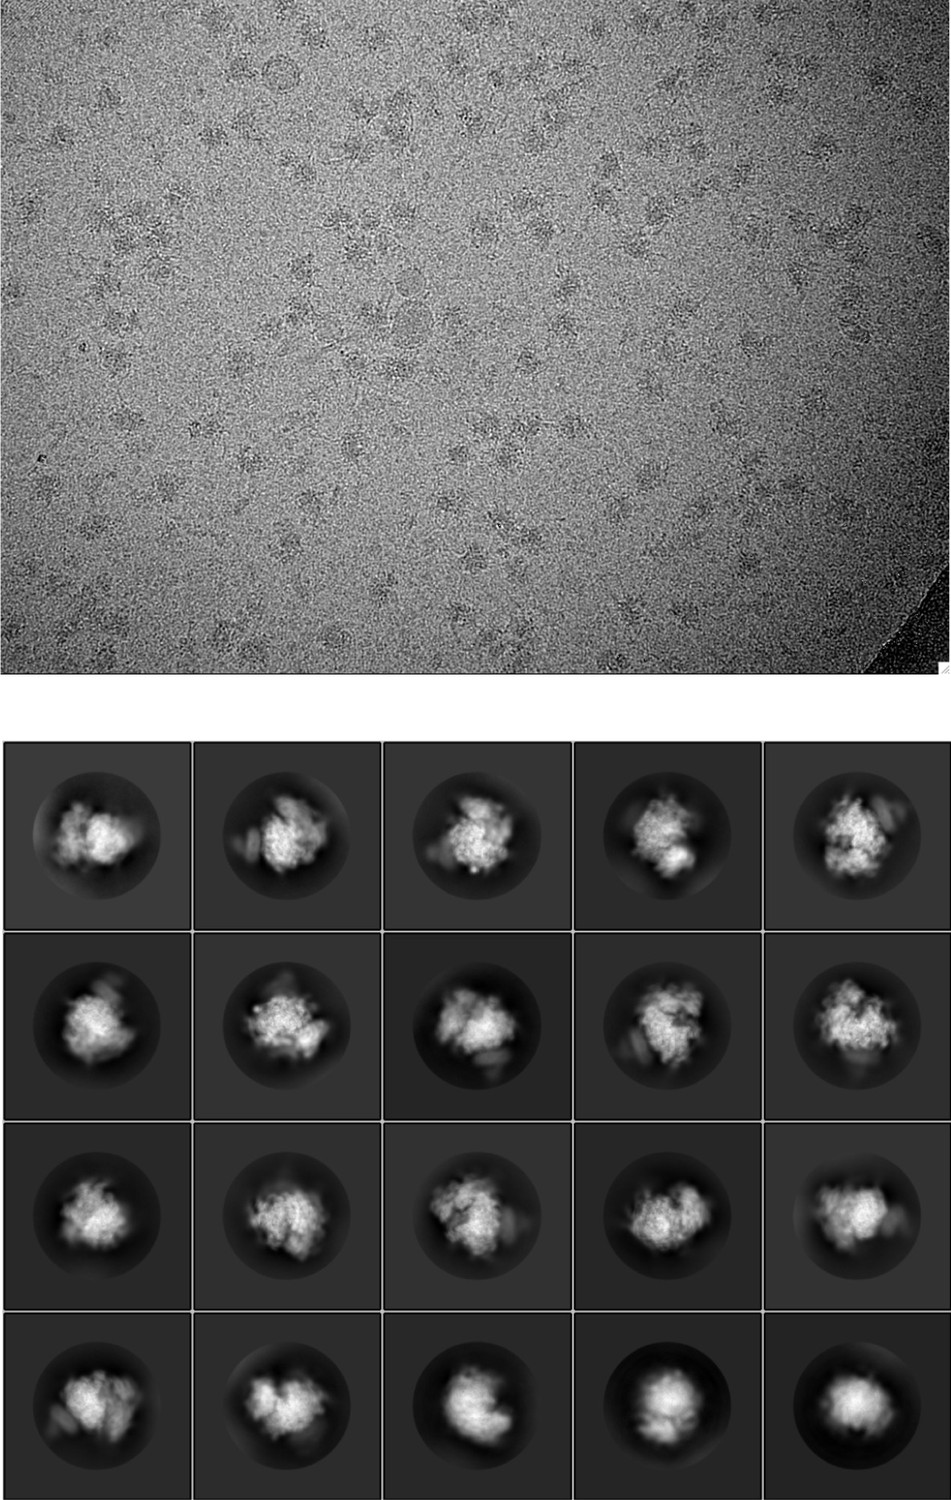
Representative cryo-EM image and 2D class averages for the natively purified ribosome-TMCO1 translocon complex.
Figure 2—figure supplement 3
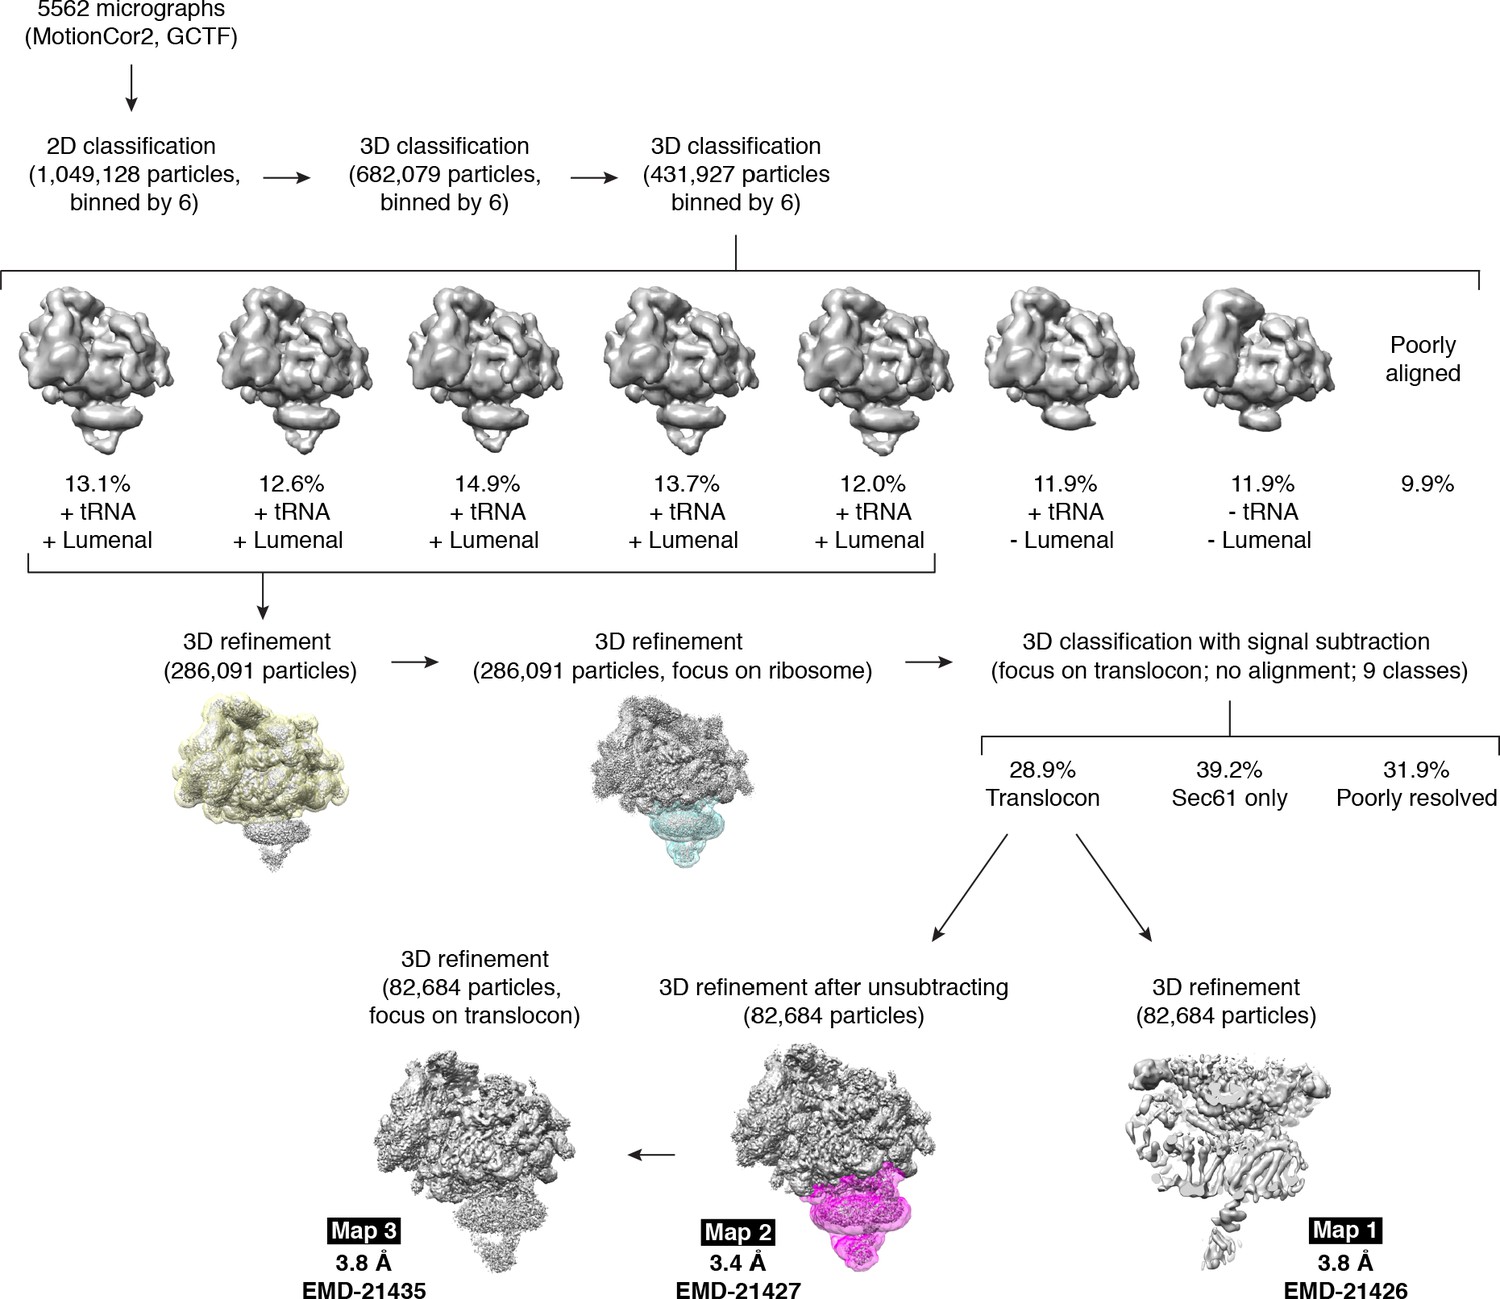
Cryo-EM data processing workflow.
Initial rounds of 3D classification yielded five classes containing tRNA density and luminal density extending below the detergent micelle. These were subjected to additional 3D refinement followed by 3D classification with signal subtraction, using a mask encompassing the translocon and part of the ribosomal large subunit (cyan). 3D refinement of the major translocon-containing class was performed with the signal subtracted particles (Map 1), or with unsubtracted particles subjected first to global refinement (Map 2), followed by focused refinement (Map 3) using a mask around the translocon (magenta). The three final maps are shown with their resolutions and EMD deposition codes.
Figure 2—figure supplement 4
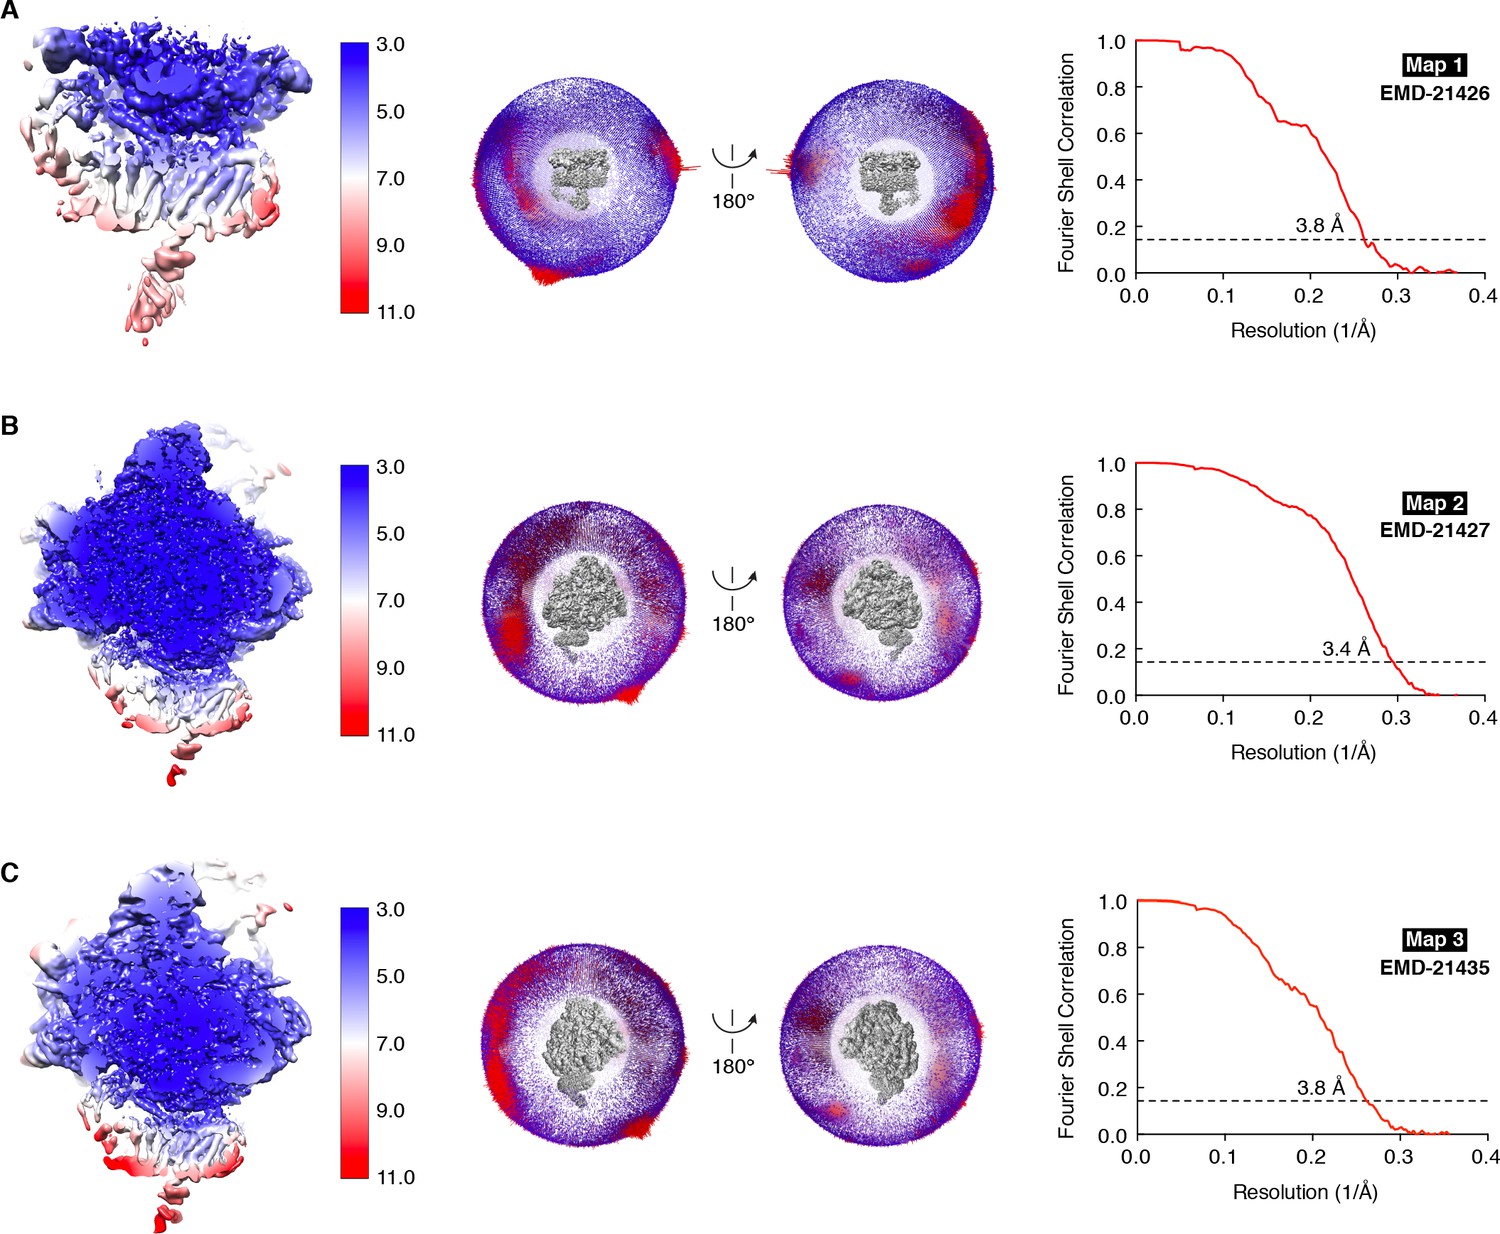
Resolution estimates for the TMCO1-ribosome complex.
Three maps were used for the final analysis: (A) Translocon map after signal subtraction (Map 1), (B) Global map calculated with unsubtracted particles (Map 2) and (C) Focused map calculated with unsubtracted particles (Map 3). Left, Maps colored by local resolution as estimated by Relion; middle, angular particle distribution in two views; right, gold-standard Fourier shell correlation (FSC) curve with indicated resolution at FSC = 0.143.
Figure 2—figure supplement 5
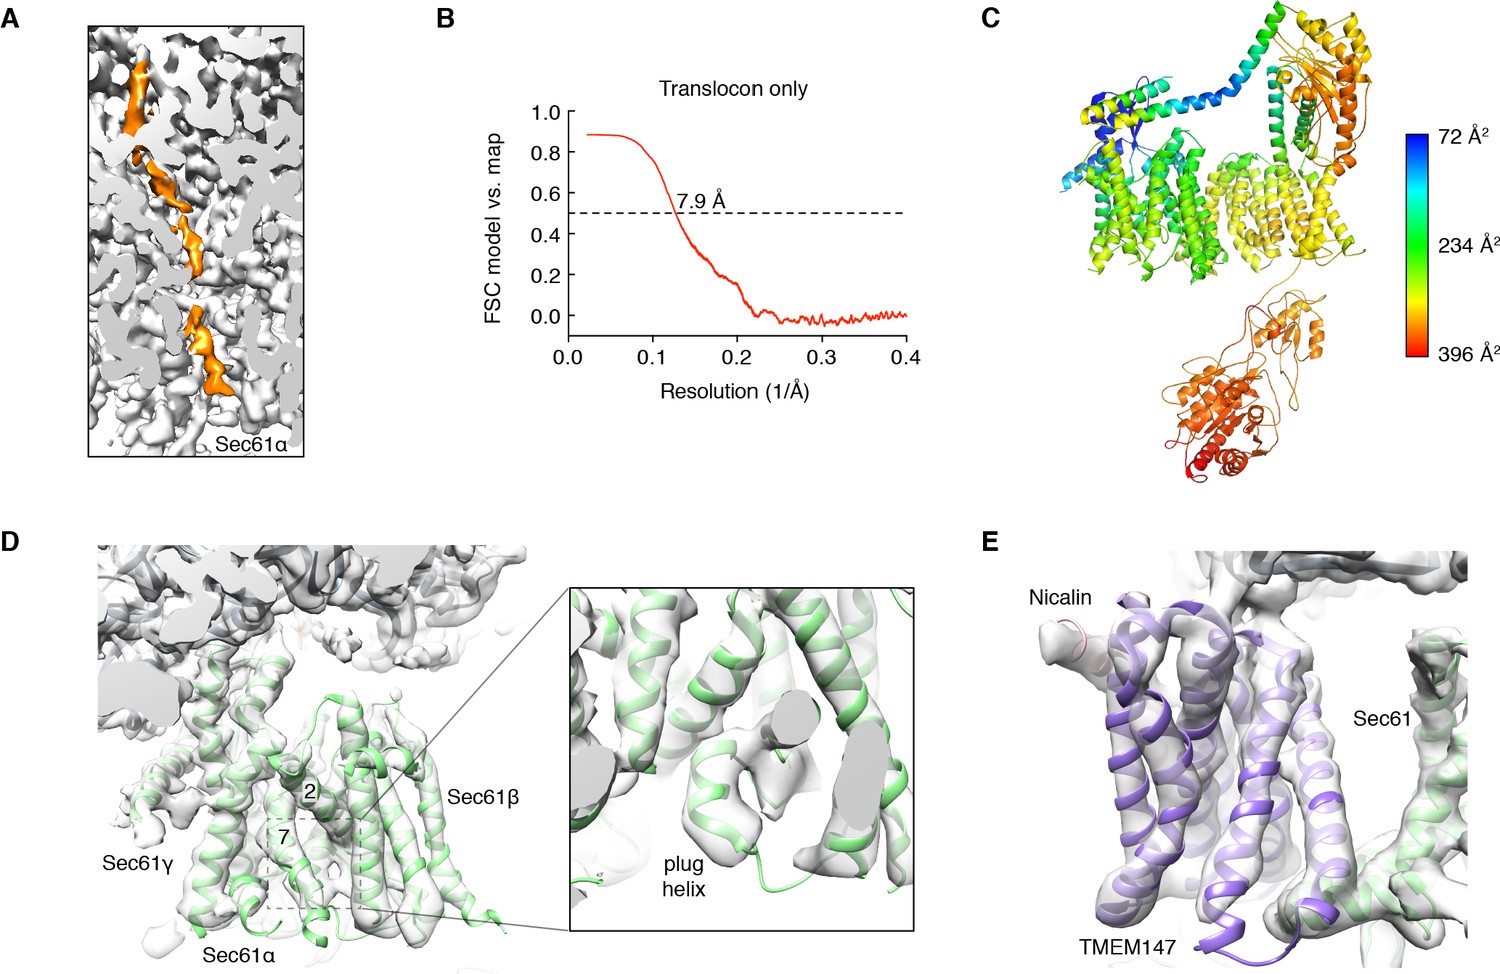
Additional views of local map and model quality.
(A) Section through a sharpened global map after low-pass filtering by local resolution, showing density for a mixture of nascent polypeptides (orange) throughout the ribosome exit tunnel. (B) Model vs. map FSC curve calculated with a masked version of the signal-subtracted Map 1 and the final translocon model. (C) Model of the translocon, colored by local B-factor. (D) Closeup of the Sec61 complex fit into the unsharpened focused map after low-pass filtering by local resolution. The lateral gate (between TM2 and TM7) of Sec61 is closed, and the plug helix occupies the central pore. (E) Closeup of the seven TMDs of TMEM147, the single-TMD of Nicalin, and the Sec61 “hinge” region, fit into the same map as in (D). This view is rotated ~180° from that shown in Figure 2C.
Figure 2—figure supplement 6
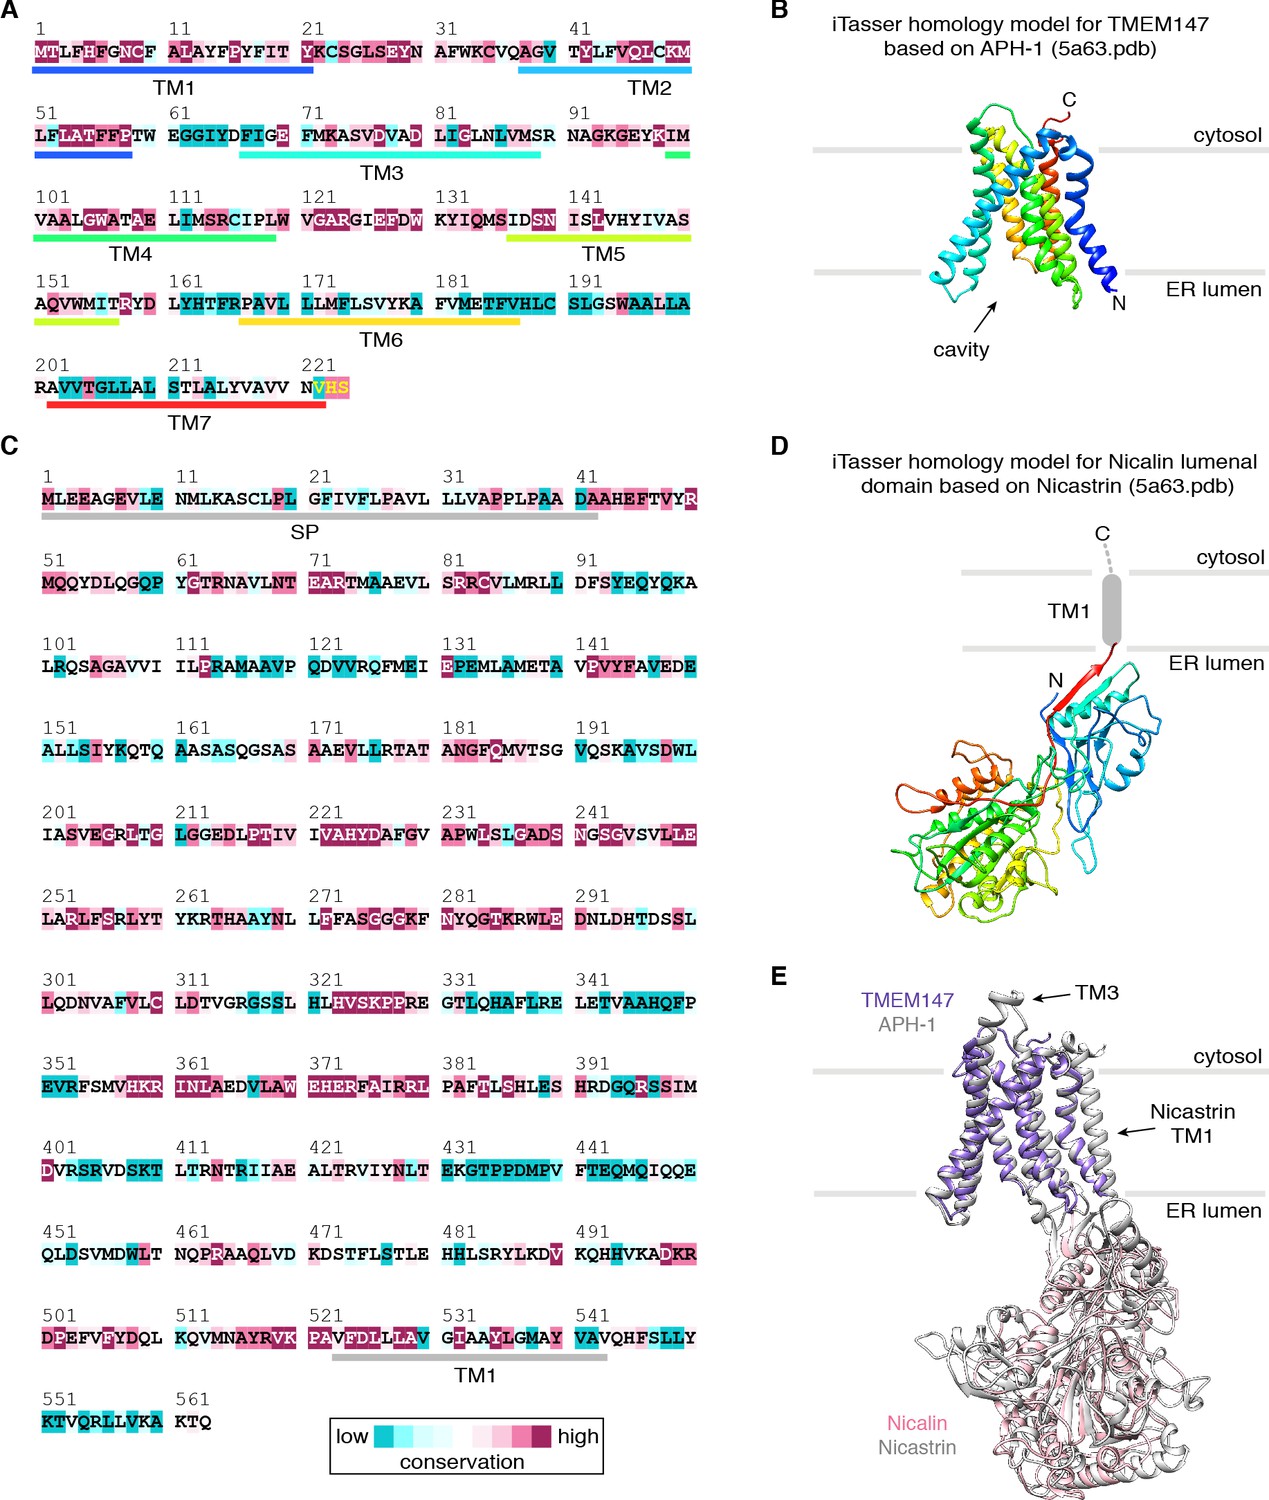
iTasser homology modeling of the human TMEM147-Nicalin complex.
(A) Amino acid sequence of human TMEM147 colored by ConSurf conservation score. Transmembrane helices (TM) are indicated. (B) Top-scoring iTasser homology model for TMEM147, based on the APH-1 subunit of human γ-secretase (PDB ID 5A63) (Bai et al., 2015), and color ramped from N- (blue) to C-terminus (red). Note the distinctive arrangement of the seven TMEM147 TMDs. (C) Amino acid sequence of human Nicalin colored by ConSurf conservation score. The N-terminal signal peptide (SP) and single transmembrane helix (TM) are indicated. (D) Top-scoring iTasser homology model for the Nicalin luminal domain, based on the Nicastrin subunit of human γ-secretase, and color ramped from N-(blue) to C-terminus (red). (E) Superposition of the Nicalin (pink) and TMEM147 (purple) homology models on the APH1-Nicastrin subunits (white) of γ-secretase. The cytosolic end of TMEM147 TM3 is ~10 residues shorter than the corresponding region in APH-1; as noted in the main text, this allows TMEM147 to approach Sec61 despite limited space available in the ribosome-membrane junction.
Figure 2—figure supplement 7
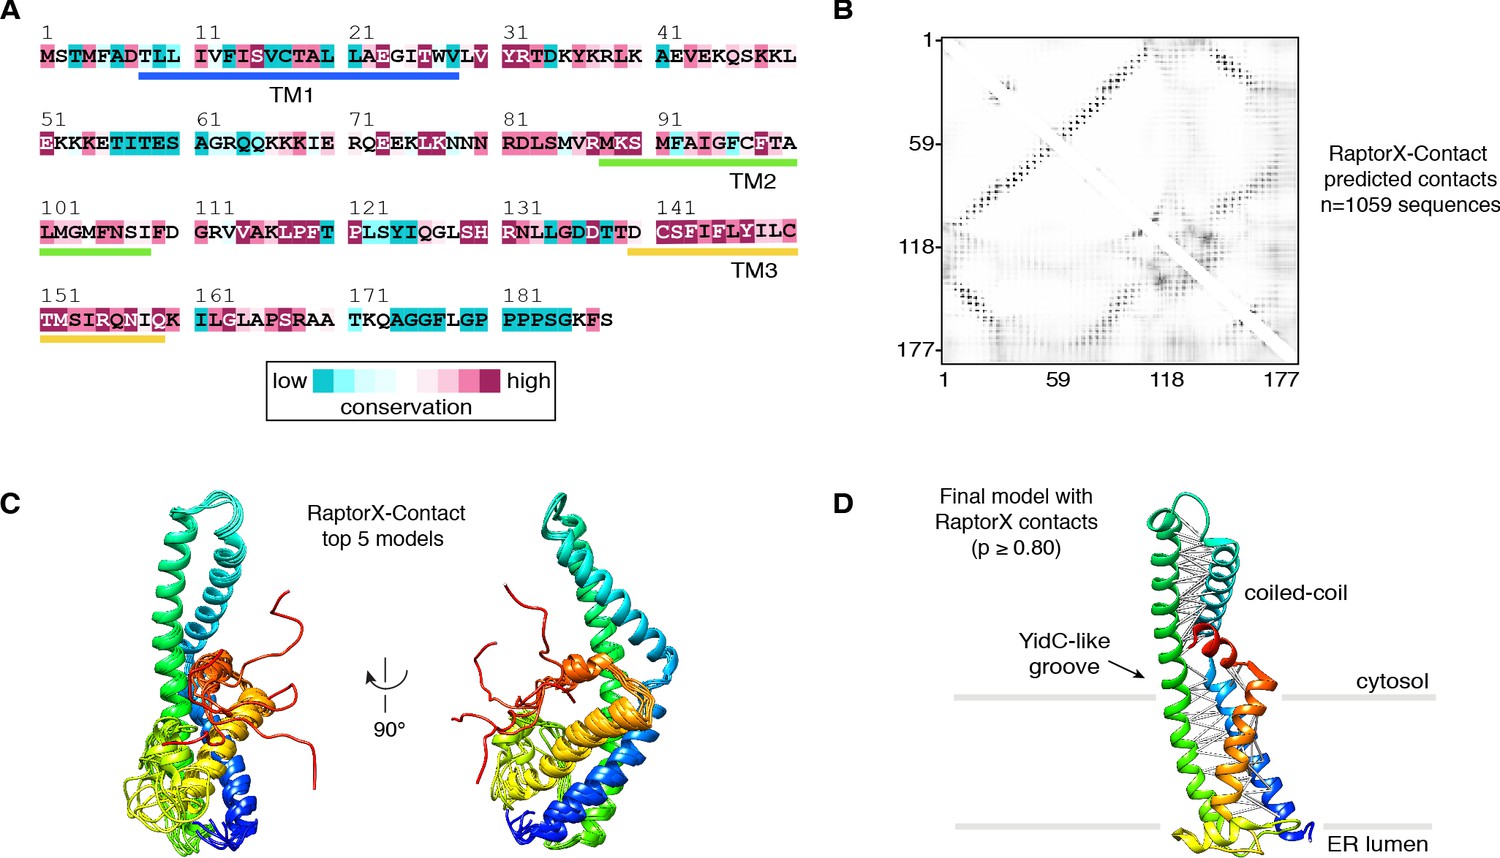
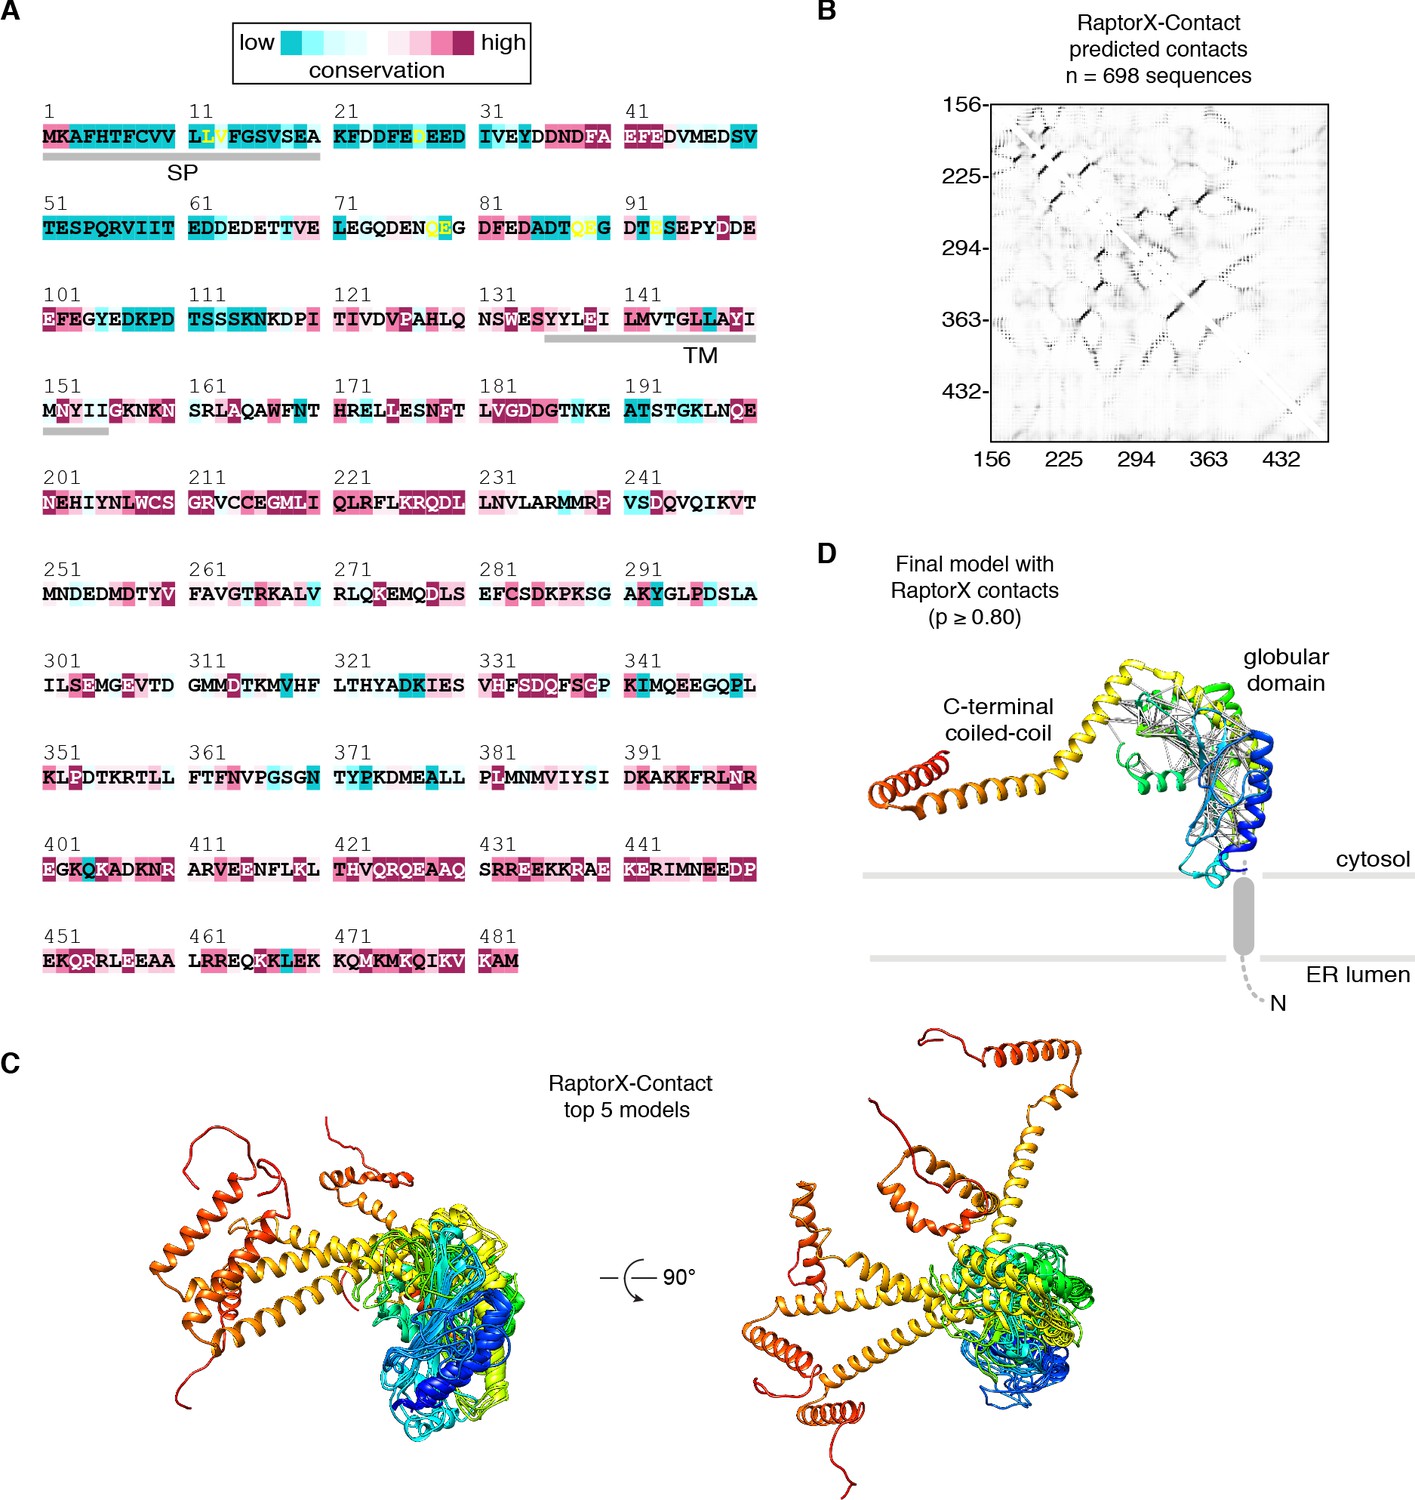
RaptorX-Contact modeling of human TMCO1.
(A) Amino acid sequence of human TMCO1 colored by ConSurf conservation score. Transmembrane helices (TM) are indicated. (B) Heat map of the RaptorX-Contact probabilities of two residues being in close proximity (Cβ-Cβ distance <8 Å); higher probabilities are darker. (C) Top five scoring models from RaptorX-Contact; each model is color ramped from the N-terminus (blue) to C-terminus (red). (D) High-probability (p ≥ 0.80) RaptorX-Contact contacts (white lines) mapped onto the final TMCO1 model after fitting into the cryo-EM density map.
Figure 2—figure supplement 8
RaptorX-Contact modeling of human CCDC47.
(A) Amino acid sequence of human CCDC47 colored by ConSurf conservation score. The N-terminal signal peptide (SP) and single transmembrane helix (TM) are indicated. (B) Heat map of the RaptorX-Contact probabilities of two residues being in close proximity (Cβ-Cβ distance <8 Å); higher probabilities are darker. (C) Top five scoring models from RaptorX-Contact; each model is color ramped from the N-terminus (blue) to C-terminus (red). (D) High-probability (p ≥ 0.80) RaptorX-Contact contacts (white lines) mapped onto the final CCDC47 model after fitting into the cryo-EM density map.
Figure 3
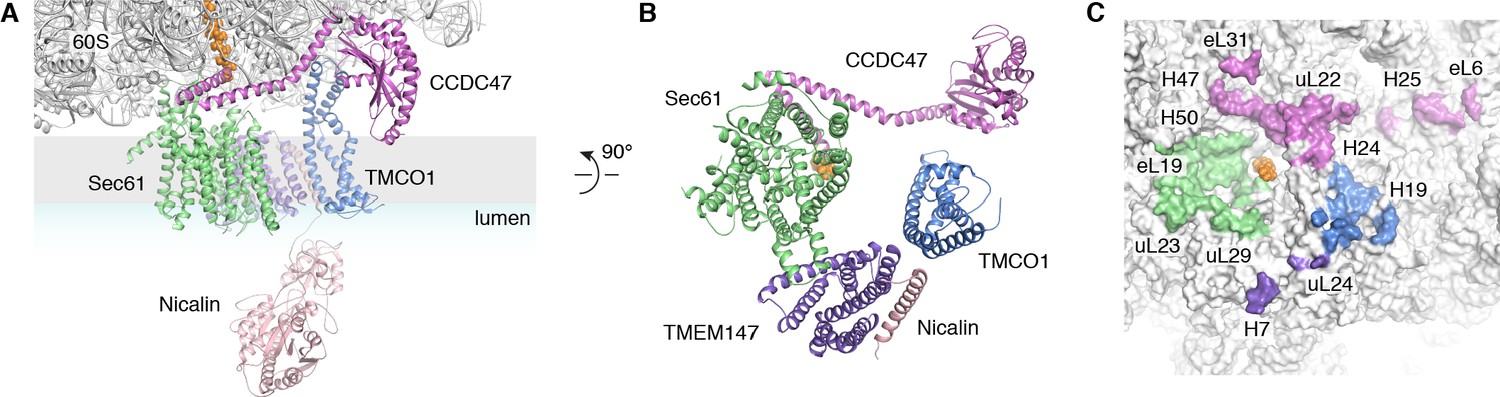
Organization of the TMCO1 translocon around the ribosome exit tunnel.
(A) Closeup view showing TMCO1 (blue), CCDC47 (violet), TMEM147 (purple), Nicalin (pink) and the Sec61 complex arranged near the nascent polypeptide (orange spheres) at the mouth of the ribosome exit tunnel. (B) View of the translocon from the membrane (the Nicalin luminal domain was omitted for clarity). (C) Surface representation of the ribosome large subunit showing regions that contact Sec61, TMEM147, TMCO1 and CCDC47.
Figure 4 with 2 supplements
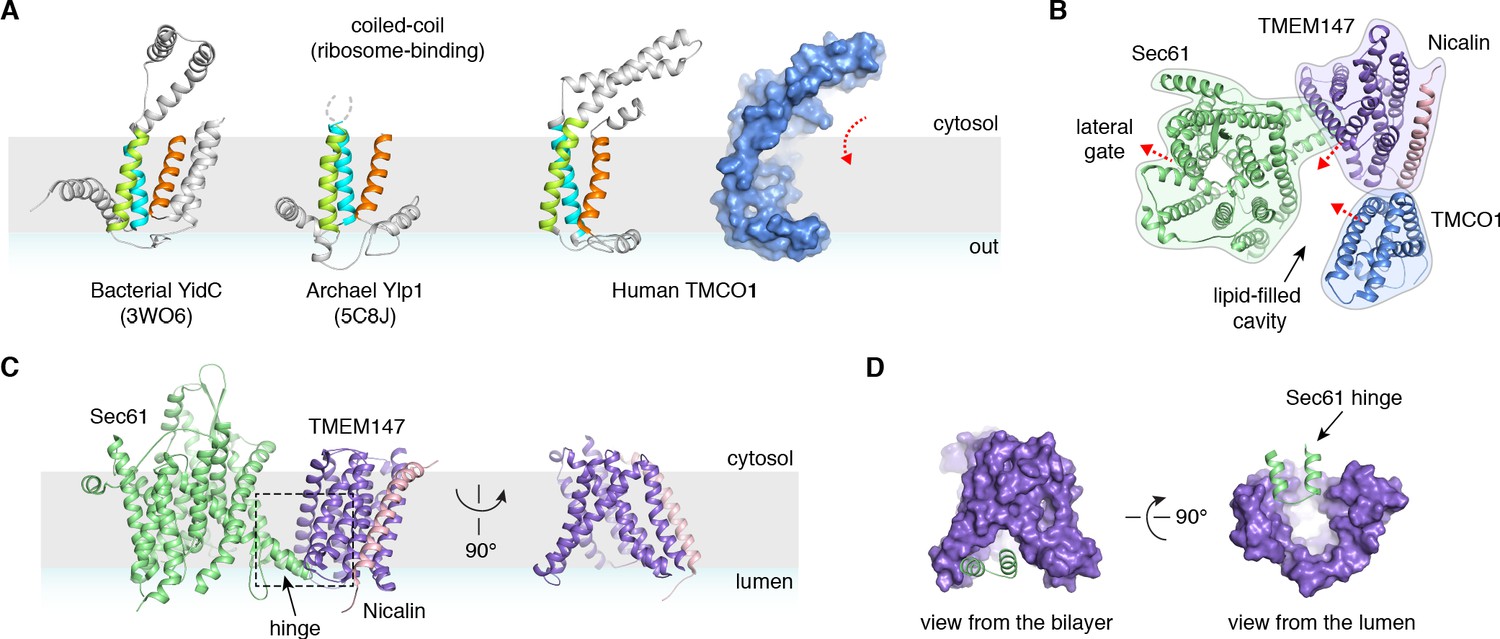
Conserved structural features suggest pathways into the membrane.
(A) Comparison of experimentally determined structures for bacterial, archaeal and human members of the Oxa1 superfamily of membrane protein biogenesis factors. The evolutionarily conserved three TMD core (cyan, lime and orange), forms a funnel extending from the cytosol into the bilayer. A surface representation of TMCO1 (blue) is shown at right. (B) Slice through the membrane of the TMCO1 translocon, viewed from the cytosol. The large lipid-filled cavity formed by Sec61, TMEM147 and TMCO1 is visible at the center of the translocon. Red arrows indicate known (via Sec61) and potential (via TMCO1 and TMEM147) routes into the membrane. (C) Closeup of the Sec61-TMEM147 interaction. The seven TMDs of TMEM147 (purple) form a large funnel that extends from the ER lumen into the lipid bilayer. (D) Surface representation of TMEM147. The hinge region of Sec61 (green) partially occludes the bilayer-exposed opening of the funnel (left), but not the luminal opening (right).
Figure 4—figure supplement 1
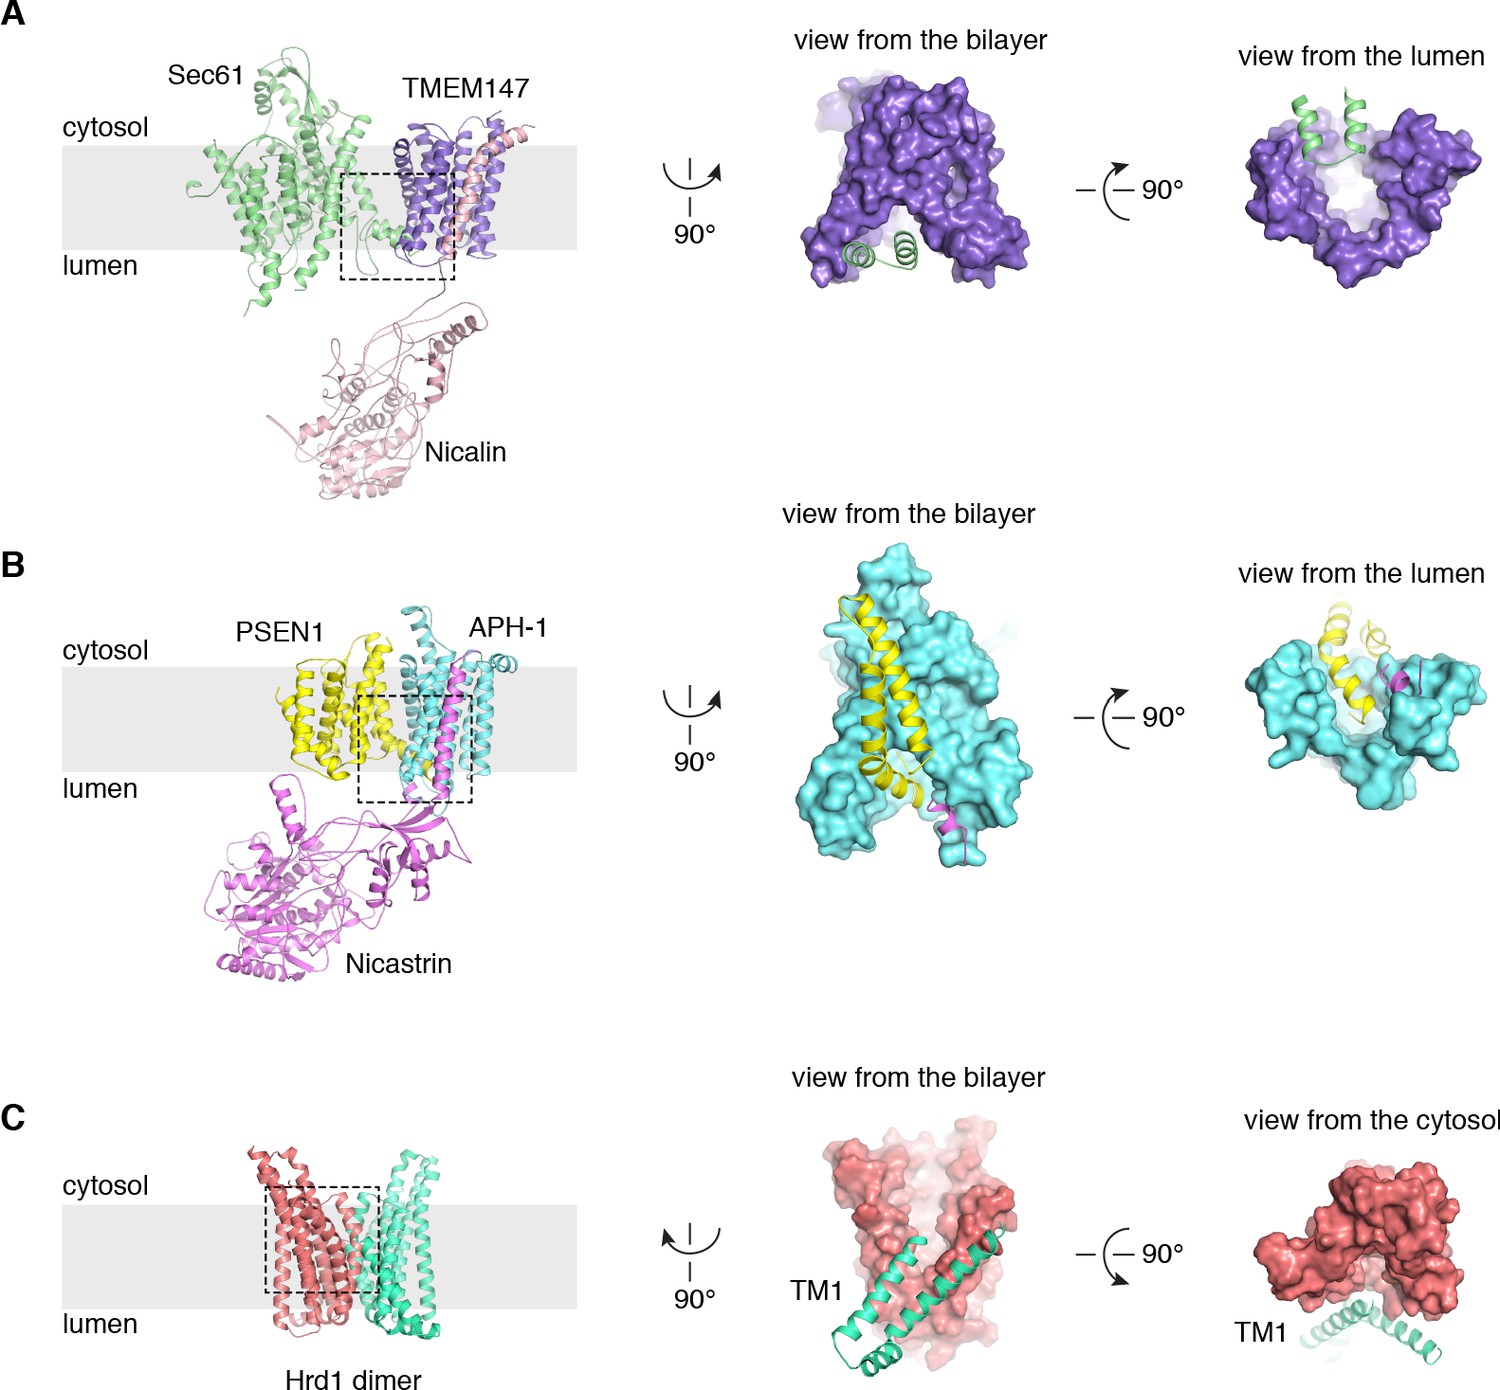
Structural comparisons with γ-secretase and the Hrd1 protein conducting ERAD channel.
(A) Arrangement of Sec61 (green) and the TMEM147-Nicalin complex (purple, pink) in the TMCO1 translocon, highlighting the Sec61 hinge region interaction with the luminal TMEM147 funnel. (B) Structurally analogous interaction of presenillin-1 (yellow) with the APH-1 subunit (cyan) of γ-secretase (PDB ID 5A63) (Bai et al., 2015). Note that the APH-1 funnel is completely occupied by presenillin-1. (C) The Hrd1 protein conducting ERAD channel (PDB ID 5V6P) (Schoebel et al., 2017) contains a large cytosolic funnel that opens to the bilayer. TM1 of a neighboring Hrd1 subunit (green) is proposed to gate access to the cytosolic leaflet of the bilayer.
Figure 4—figure supplement 2

Structural comparison of the TMCO1- and OST translocons.
Orthogonal views of the (A) TMCO1- (B) OST translocons (PDB ID 6FTI) (Braunger et al., 2018), aligned on the Sec61 complex. The primary ribosome contacts are mediated by CCDC47 (violet), TMCO1 (blue) and TMEM147 (purple) in the TMCO1 translocon, and by RPN1 (orange) in OST; these binding sites are non-overlapping. By contrast, there are extensive steric clashes between the luminal domains of Nicalin (pink) and STT3A (yellow). In addition, TMDs of TMCO1, TMEM147 and Nicalin overlap with TMDs of the STT3A (catalytic subunit), DC2 and OST4 in the OST complex. Note the presence of an unassigned helix in the OST structure, proposed to belong to the opsin substrate TMD (red), which resides near the large, lipid-filled cavity observed in the TMCO1 translocon.
Figure 5 with 1 supplement
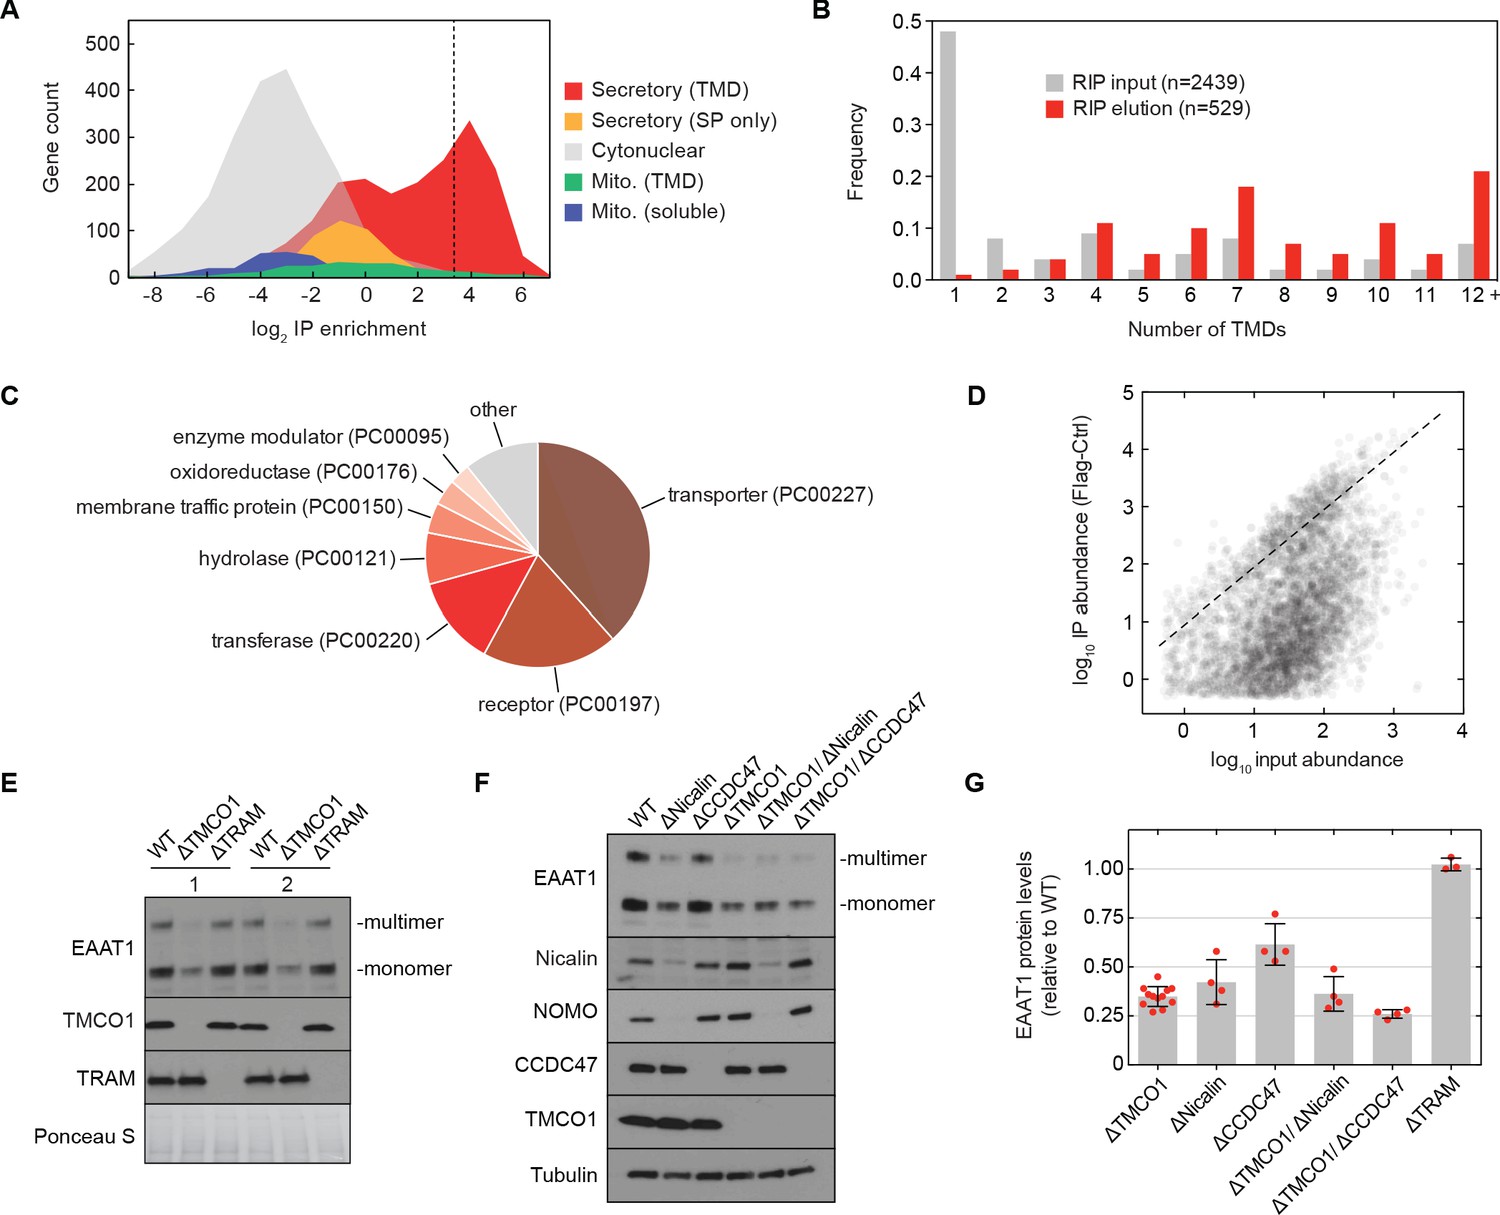
The TMCO1 translocon acts on multi-pass membrane proteins.
(A) Log2 enrichment of transcripts encoding proteins of the indicated categories according to Uniprot annotation. Enrichment was calculated as (Flag IP - Ctrl IP)/Input, where “Flag IP” and “Ctrl IP” are the average transcript levels in the ribosome fraction following anti-Flag immunoprecipitation from digitonin-solubilized wild-type (Ctrl) or 3xFlag-TMCO1 (Flag) HEK293 membranes (n=3), and “Input” is the average transcript abundance in the total membrane fraction (n=2). More than 98% of the most enriched transcripts (right of the dashed line) encode secretory pathway transmembrane proteins. (B) Proportion of secretory pathway transmembrane proteins containing the indicated number of Uniprot-predicted TMDs in the input (gray), and in the 529 most enriched membrane-protein encoding transcripts from the elution (red). (C) PANTHER classification for the enriched set of membrane proteins. (D) Transcript levels in the TMCO1 immunoprecipitated sample (“IP abundance”) plotted against transcript levels in total HEK293 membranes (“input abundance”). Enrichment (above the dashed line) is seen across three orders of magnitude of input mRNA abundance. (E) Representative western blot of total HEK293 lysate from wild-type (WT) and knockout (ΔTMCO1 and ΔTRAM) cells, in duplicate. Expression of the multi-pass membrane protein EAAT1, is decreased in the TMCO1 knockout cells, but is unaffected by deletion of the unrelated Sec61 accessory factor, TRAM. Note that the EAAT1 “multimer” band is from SDS-induced aggregation. (F) As in (E), for the indicated single- and double-knockout cells. Tubulin serves as a loading control. Note that disruption of Nicalin reduces the expression levels of its binding partner, NOMO, as shown previously (Dettmer et al., 2010). The faint band migrating just above Nicalin in the ΔNicalin cells is a cross-reacting band. (G) Quantification of protein expression levels for EAAT1 (monomer and multimer), showing mean and S.D., relative to WT cells.
Figure 5—figure supplement 1
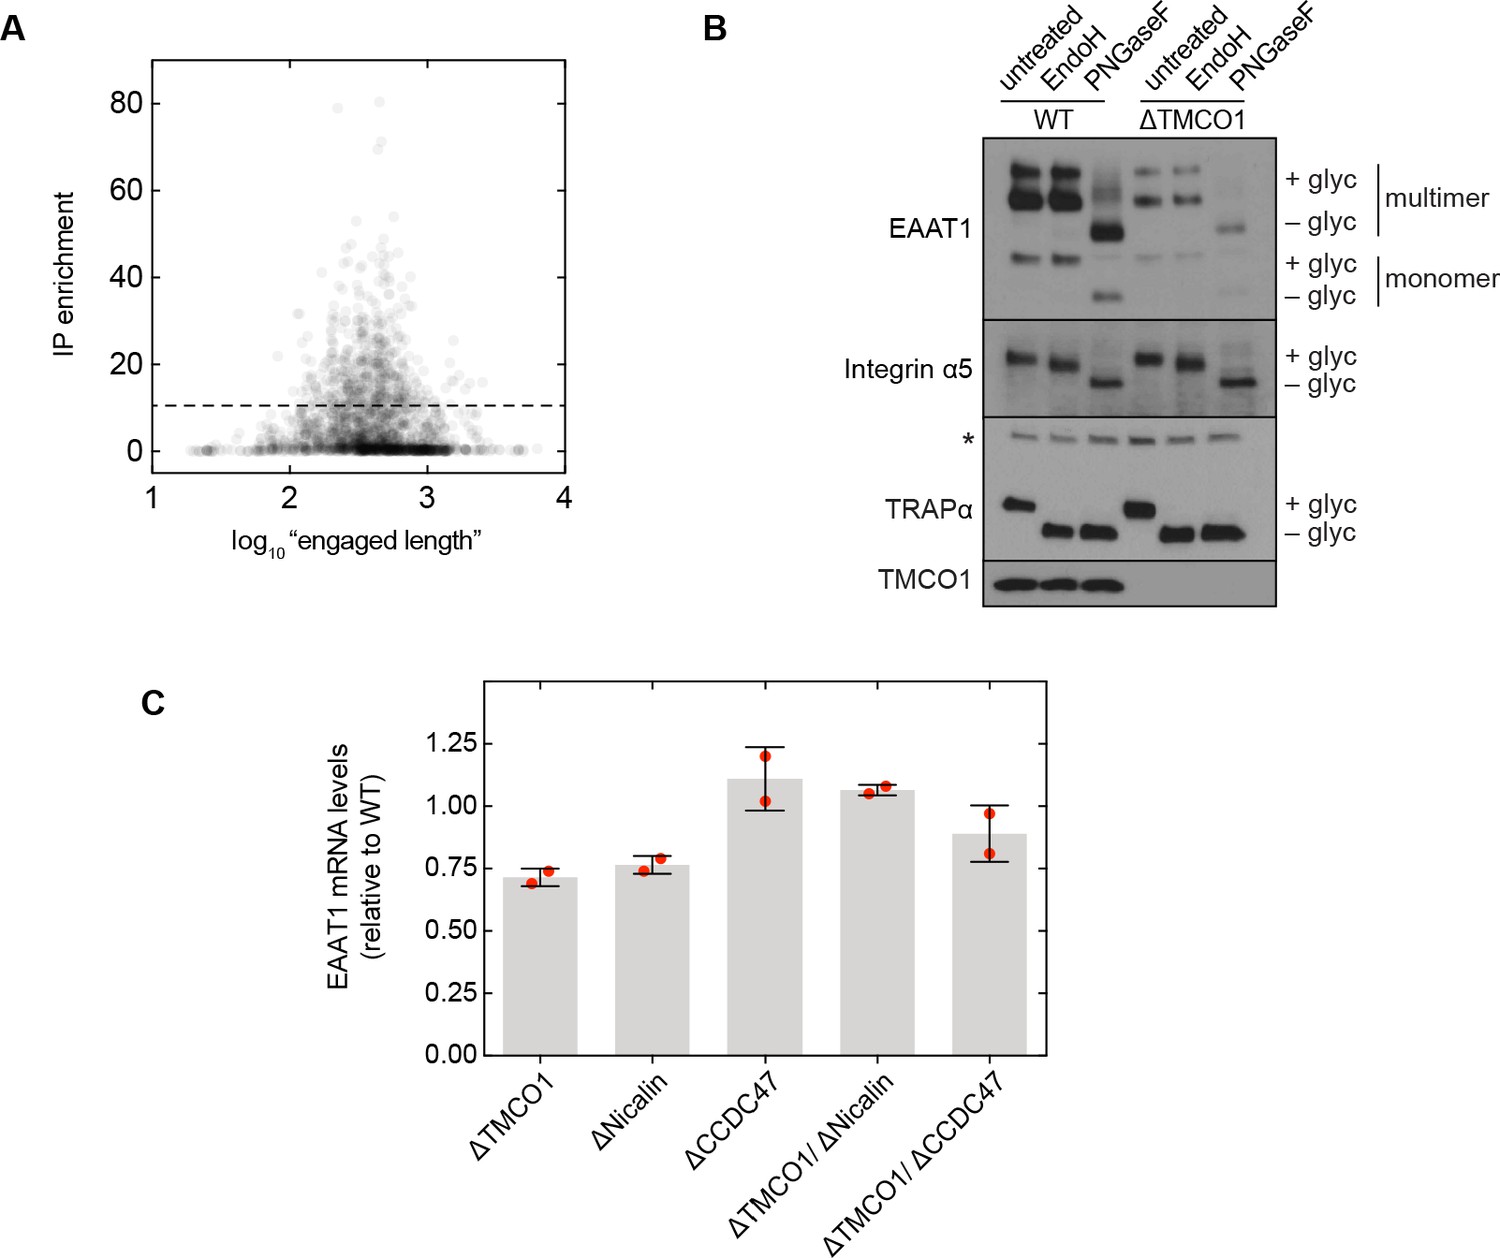
Additional functional analysis.
(A) Plot of RIP-seq transcript enrichment (“IP enrichment”) vs. protein “engaged length” for all observed secretory pathway transmembrane proteins. Here, “engaged length” is defined as the number of residues following the signal peptide or first transmembrane domain. No correlation is observed between the engaged length and enrichment. (B) Steady-state expression levels and glycosylation patterns of the multi-pass protein EAAT1, and two single-pass proteins, integrin α5 and TRAPα. EAAT1 and integrin α5 are plasma membrane proteins, and TRAPα is an ER membrane protein. The 'multimer' bands visible in the EAAT1 blot are from SDS-induced aggregation, exacerbated here by the denaturing conditions used for deglycosylation (compare with Figure 5E, F). The asterisk indicates a cross-reactive band. (C) Quantification of EAAT1 mRNA levels by qRT PCR analysis. GAPDH-normalized EAAT1 mRNA levels (mean, S.D.) in the indicated cell lines, relative to wild-type cells. In each case, EAAT1 mRNA levels change by less than 1.5-fold.
Tables
Table 1
Cryo-EM data collection and refinement statistics.
| Data collection and processing | |||
|---|---|---|---|
| Magnification | 64,000 | ||
| Voltage (kV) | 300 | ||
| Electron exposure (e–/Å2) | 50 | ||
| Defocus range (μm) | −1.0 to −2.5 | ||
| Pixel size (Å) | 0.68 | ||
| Symmetry imposed | C1 | ||
| Micrographs used | 5562 | ||
| Initial particle images (no.) | 1,049,128 | ||
| Final particle images (no.) | 82,684 | ||
| Map 1 (EMD-21426) | Map 2 (EMD-21427) | Map 3 (EMD-21435) | |
| Map resolution (Å) | 3.8 | 3.4 | 3.8 |
| FSC threshold | 0.143 | 0.143 | 0.143 |
| Map resolution range (Å) | 3.3 to 10.3 | 3.0 to 15.4 | 3.2 to 13.1 |
| Refinement and validation | 60S–translocon PDB ID 6W6L | ||
| Resolution for refinement (Å) | 3.8 | ||
| FSC threshold | 0.143 | ||
| Model composition | |||
| Protein residues | 8012 (1718)* | ||
| Nucleotide bases | 3939 (0) | ||
| Average B factors (Å2) | |||
| Protein | 156 (260) | ||
| Nucleotide | 191 (N/A) | ||
| R.M.S. deviations | |||
| Bond lengths (Å) | 0.006 (0.005) | ||
| Bond angles (°) | 0.809 (1.013) | ||
| Validation | |||
| MolProbity score | 2.03 (2.43) | ||
| Clash score | 9.41 (13.66) | ||
| Rotamer outliers | 1.42 (3.39) | ||
| Ramachandran plot | |||
| Favored (%) | 93.7 (94.4) | ||
| Allowed (%) | 6.2 (5.4) | ||
| Outliers (%) | 0.1 (0.2) | ||
-
*Values in parentheses are for the translocon components only.
Key resources table
| Reagent type (species) or resource | Designation | Source or reference | Identifiers | Additional information |
|---|---|---|---|---|
| Antibody | Anti-FLAG M2 Affinity Gel (mouse monoclonal) | Sigma | Cat# A2220, RRID:AB_10063035 | |
| Antibody | Rabbit polyclonal, FLAG | Sigma | Cat# F7425, RRID:AB_439687 | WB (1:1000) |
| Antibody | Rabbit, polyclonal TMCO1 | Anghel et al., 2017 | WB (1:1000) | |
| Antibody | Rabbit, polyclonal Sec61β | Görlich et al., 1992 | WB (1:10000) | |
| Antibody | Mouse, monoclonal EAAT1 | Santa Cruz | Cat# sc-515839 | WB (1:1000) |
| Antibody | Rabbit, polyclonal Sec61α | Thermo Fisher | Cat# PA5-21773, RRID:AB_11152794 | WB (1:1000) |
| Antibody | Rabbit, polyclonal L17 | Abgent | Cat# AP9892b, RRID:AB_10613776 | WB (1:1000) |
| Antibody | Mouse monoclonal STT3A | Novus | Cat# H00003703-M02, RRID:AB_2198043 | WB (1:1000) |
| Antibody | Mouse monoclonal Tubulin | Abcam | Cat# ab7291, RRID:AB_2241126 | WB (1:1000) |
| Antibody | Rabbit polyclonal Integrin α5 | Cell Signaling | Cat# 4705, RRID:AB_2233962 | WB (1:1000) |
| Antibody | Rabbit polyclonal Nicalin | Bethyl | Cat# A305-623A-M, RRID:AB_2782781 | WB (1:1000) |
| Antibody | Rabbit polyclonal TMEM147 | Thermo Fisher | Cat# PA5-95876, RRID:AB_2807678 | WB (1:1000) |
| Antibody | Goat polyclonal Nomo1 | Thermo Fisher | Cat# PA5-47534, RRID:AB_2607776 | WB (1:1000) |
| Antibody | Rabbit polyclonal CCDC47 | Bethyl | Cat# A305-100A, RRID:AB_2631495 | WB (1:1000) |
| Cell line (H. sapiens) | Flp-In T-REx 293 | Thermo Fisher | Cat# R78007 | |
| Cell line (H. sapiens) | Flp-In T-REx 293, 3xFlag-Cas9 | Anghel et al., 2017 | 3xFlag-Cas9 integrated into FRT site | |
| Cell line (H. sapiens) | Flp-In T-REx 293, 3xFlag-Cas9, 3xFlag-TMCO1 | Anghel et al., 2017 | Obtained by CRISPR-Cas9; one nonfunctional and one N-terminally tagged TMCO1 allele | |
| Cell line (H. sapiens) | Flp-In T-REx 293, 3xFlag-Cas9, ΔTMCO1 | Anghel et al., 2017 | TMCO1 disrupted by CRISPR-Cas9 | |
| Cell line (H. sapiens) | Flp-In T-REx 293, 3xFlag-Cas9, ΔNicalin | This paper | Nicalin disrupted by CRISPR-Cas9 | |
| Cell line (H. sapiens) | Flp-In T-REx 293, 3xFlag-Cas9, ΔCCDC47 | This paper | CCDC47 disrupted by CRISPR-Cas9 | |
| Cell line (H. sapiens) | Flp-In T-REx 293, 3xFlag-Cas9, ΔTMCO1, ΔNicalin | This paper | Nicalin disrupted by CRISPR-Cas9 in ΔTMCO1 background | |
| Cell line (H. sapiens) | Flp-In T-REx 293, 3xFlag-Cas9, ΔTMCO1, ΔCCDC47 | This paper | CCDC47 disrupted using CRISPR-Cas9 in ΔTMCO1 background | |
| Cell line (H. sapiens) | Flp-In T-REx 293, ΔTMCO1 | This paper | TMCO1 disrupted by CRISPR-Cas9 | |
| Cell line (H. sapiens) | Flp-In T-REx 293, ΔTRAM | This paper | TRAM1 disrupted by CRISPR-Cas9 | |
| Cell line (H. sapiens) | Flp-In T-REx 293, 3xFlag-Cas9, ΔNicalin, 3xFlag-Nicalin | This paper | Randomly integrated 3xFlag-Nicalin in ΔNicalin background | |
| Cell line (H. sapiens) | Flp-In T-REx 293, 3xFlag-Cas9, ΔTMCO1, 3xFlag-TMCO1 | This paper | Randomly integrated 3xFlag-TMCO1 in ΔTMCO1 background | |
| Recombinant DNA reagent | pEGFP-n1 | Addgene | Cat# 6085–1 | |
| Recombinant DNA reagent | pEGFP-3xFlag-TMCO1 | This paper | Human TMCO1 with an N-terminal 3xFlag tag | |
| Recombinant DNA reagent | pEGFP-3xFlag-Nicalin | This paper | Human Nicalin with an N-terminal 3xFlag tag following the signal peptide | |
| Recombinant DNA reagent | pX330 | Addgene | Cat# 42230 | |
| Recombinant DNA reagent | pX330-TRAM1-sgRNA | This paper | TTTGATGCCATAGTAATAAA | |
| Sequence-based reagent | sgRNA targeting Nicalin | Invitrogen | Custom Synthesis | ACGGAATGCAGTGCTGAACA |
| Sequence-based reagent | sgRNA targeting CCDC47 | Invitrogen | Custom Synthesis | TCAGTGATTATGACCCGTT |
| Sequence-based reagent | GAPDH fwd | IDT | Custom Synthesis | ACAACTTTGGTATCGTGGAAGG |
| Sequence-based reagent | GAPDH rev | IDT | Custom Synthesis | GCCATCACGCCACAGTTTC |
| Sequence-based reagent | EAAT1 fwd | IDT | Custom Synthesis | TTCCTGGGGAACTTCTGATG |
| Sequence-based reagent | EAAT1 rev | IDT | Custom Synthesis | CCATCTTCCCTGATGCCTTA |
| Peptide, recombinant protein | 3xFlag Peptide | ApexBio | Cat# A6001 | |
| Peptide, recombinant protein | micrococcal nuclease | NEB | Cat# M0247S | |
| Peptide, recombinant protein | DNAseI | Promega | Cat# M6101 | |
| Peptide, recombinant protein | EndoH | NEB | Cat# P0702 | |
| Peptide, recombinant protein | PNGaseF | Promega | Cat# 9PIV483 | |
| Commercial assay or kit | iScript gDNA Clear cDNA Synthesis Kit | Bio-Rad | Cat# 1725034 | |
| Commercial assay or kit | iTaq Universal SYBR Green Supermix | Bio-Rad | Cat# 1725120 | |
| Commercial assay or kit | RiboZero | Illumina | Cat# 20037135 | |
| Commercial assay or kit | Universal Mycoplasma Detection Kit | ATCC | Cat# 30–1012K | |
| Chemical compound, drug | digitonin | Calbiochem | Cat# 11024-24-1 | |
| Chemical compound, drug | disuccinimidyl suberate | Thermo Fisher | Cat# 21555 | |
| Chemical compound, drug | TRIzol | Ambion | Cat# 15596018 | |
| Software, algorithm | RELION, v.3.1 | Zivanov et al., 2018 | RRID:SCR_016274 | |
| Software, algorithm | MotionCor2 | Zheng et al., 2017 | RRID:SCR_016499 | |
| Software, algorithm | GCTF v.0.5 | Zhang, 2016 | RRID:SCR_016500 | |
| Software, algorithm | Protein Prospector v.5.23.0 | Trnka et al., 2014 | RRID:SCR_014558 | |
| Software, algorithm | Proteome Discoverer v.2.2 | Thermo Scientific | RRID:SCR_014477 | |
| Software, algorithm | UCSF Chimera v.1.13.1 | Pettersen et al., 2004 | RRID:SCR_004097 | |
| Software, algorithm | Pymol v.2.3 | www.pymol.org | RRID:SCR_000305 | |
| Software, algorithm | Phenix v.1.18–3845 | Afonine et al., 2018 | RRID:SCR_014224 | |
| Software, algorithm | RaptorX-Contact | Wang et al., 2017 | RRID:SCR_018118 | |
| Software, algorithm | i-Tasser | Zhang, 2008 | RRID:SCR_014627 | |
| Software, algorithm | SBGrid | Morin et al., 2013 | RRID:SCR_003511 | |
| Software, algorithm | Coot v.0.9 | Emsley et al., 2010 | RRID:SCR_014222 | |
| Other | Quantifoil 1.2/1.3 200 mesh, pre-coated with amorphous 2 nm Carbon | Ted Pella, Inc | Cat# 668–200-CU | |
| Other | Freestyle 293 Expression media | Fisher Scientific | Cat# 12-338-026 | |
| Other | 1 L PETG square media bottles | Fisher Scientific | Cat# 09-923-16C |
Additional files
Download links
A two-part list of links to download the article, or parts of the article, in various formats.
Downloads (link to download the article as PDF)
Open citations (links to open the citations from this article in various online reference manager services)
Cite this article (links to download the citations from this article in formats compatible with various reference manager tools)
An ER translocon for multi-pass membrane protein biogenesis
eLife 9:e56889.
https://doi.org/10.7554/eLife.56889


