Islet vascularization is regulated by primary endothelial cilia via VEGF-A-dependent signaling
- The Rolf Luft Research Center for Diabetes and Endocrinology, Karolinska University Hospital L1, Sweden
- Institute for Diabetes and Regeneration Research, Helmholtz Zentrum München, Germany
- Technical University Munich, Germany
- Deutsches Zentrum für Diabetesforschung, DZD, Germany
Figures
Figure 1 with 2 supplements
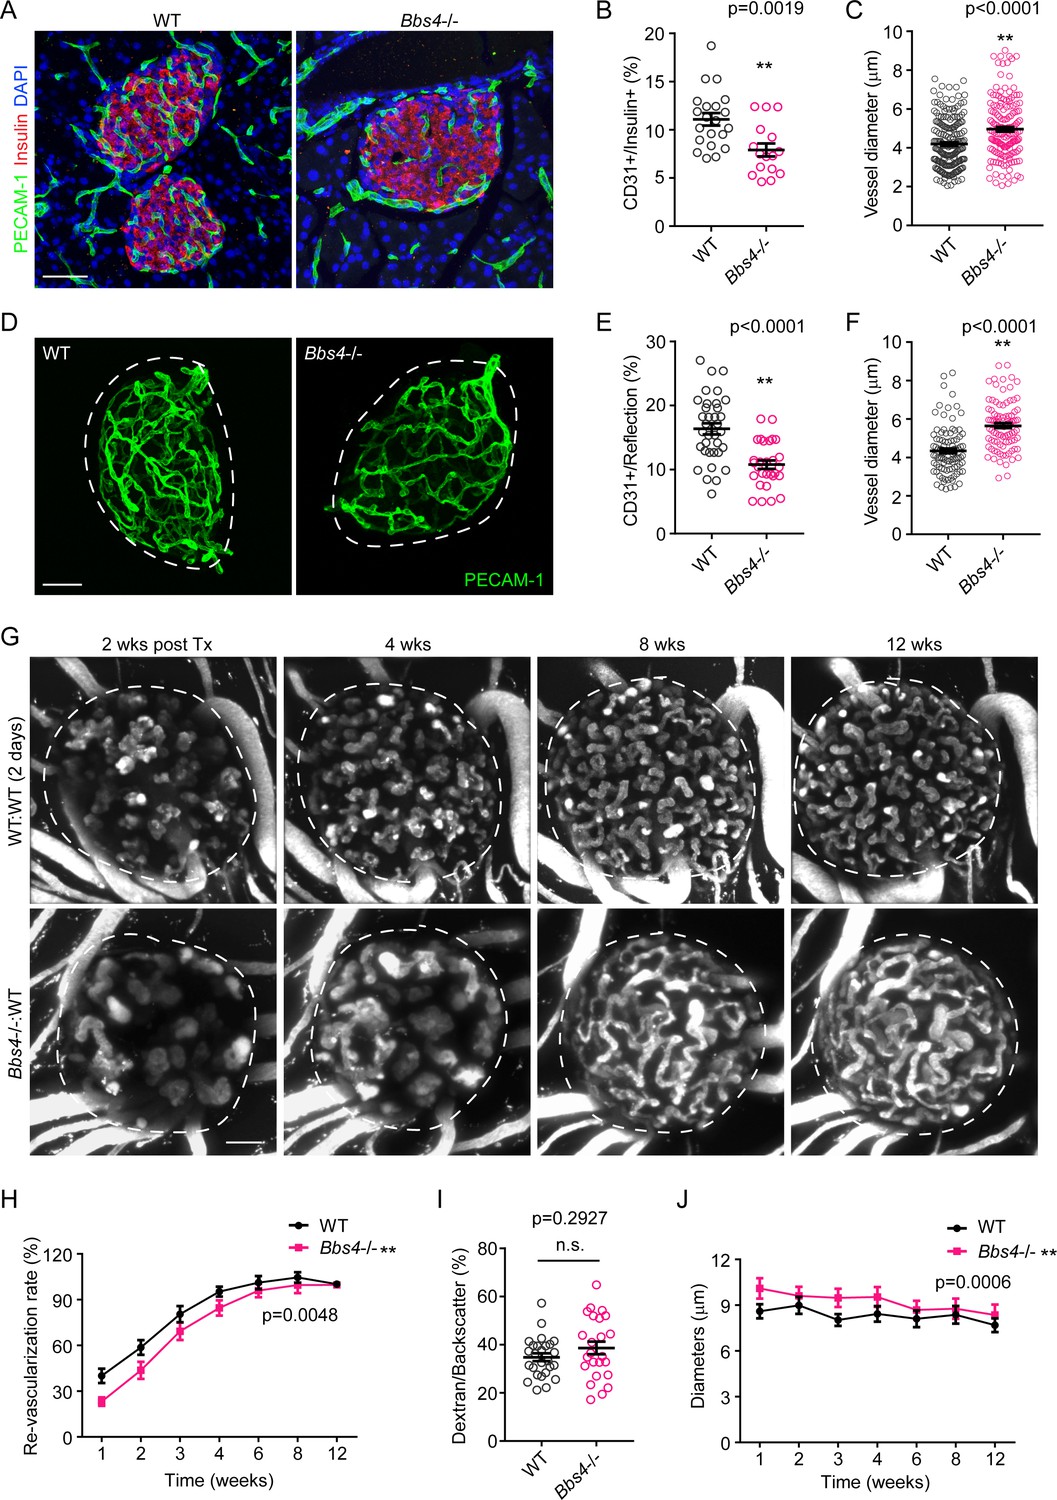
Bbs4-/- islets show delayed vascularization and enlarged capillary diameter in the pancreas and the anterior chamber of the eye upon transplantation.
(A) Immuno-fluorescence staining of pancreatic sections from 2-month-old wt and Bbs4-/- mice showing islets (insulin, red) and intra-islet capillaries (PECAM-1, green). (B–C) Quantification of relative intra-islet PECAM-1 positive volume, normalized to insulin-positive volume (B) and average intra-islet capillary diameters (C) in wt and Bbs4-/- pancreatic sections. Individual data points are shown, **p<0.01, n = 8 for animals and n = 2–3 islets per animal. (D) Immuno-fluorescence staining of freshly isolated and fixed pancreatic islets from 2-month-old wt and Bbs4-/- mice, showing PECAM-1 (green) labeled islet capillaries. (E–F) Quantification of relative PECAM-1 positive volume within each islet, normalized to islet volume estimated by backscatter signal (E) and average capillary diameters (F) in wt and Bbs4-/- islets. Individual data points are shown, **p<0.01 by Mann-Whitney test, n = 3 for animals and n = 8–12 islets per animal. (G) Re-vascularization of 2 day-cultivated wt (upper) and Bbs4-/- (lower) islets in wt recipient eyes at 2-, 4-, 8- and 12-weeks post-transplantation, visualized by intravenous injection of Texas Red-conjugated dextran. (H) Quantification of re-vascularization rates of wt and Bbs4-/- islet grafts in wt recipients. Results are shown as mean ± SEM. (I) Relative vascular density of wt and Bbs4-/- islet grafts at the end of 12 weeks post-transplantation. Individual data points are shown, n.s. means not significant by Mann-Whitney test. (J) Average diameters of newly formed capillaries in wt and Bbs4-/- islet grafts in wt recipients. Results are shown as mean ± SEM, *p<0.05, **p<0.01 by two-way-ANOVA, n = 6 for animals and n = 4–8 islets per animal. Islets were encircled by dashed lines. The same is for all the other figures. Scale bars: 50 μm.
Figure 1—figure supplement 1
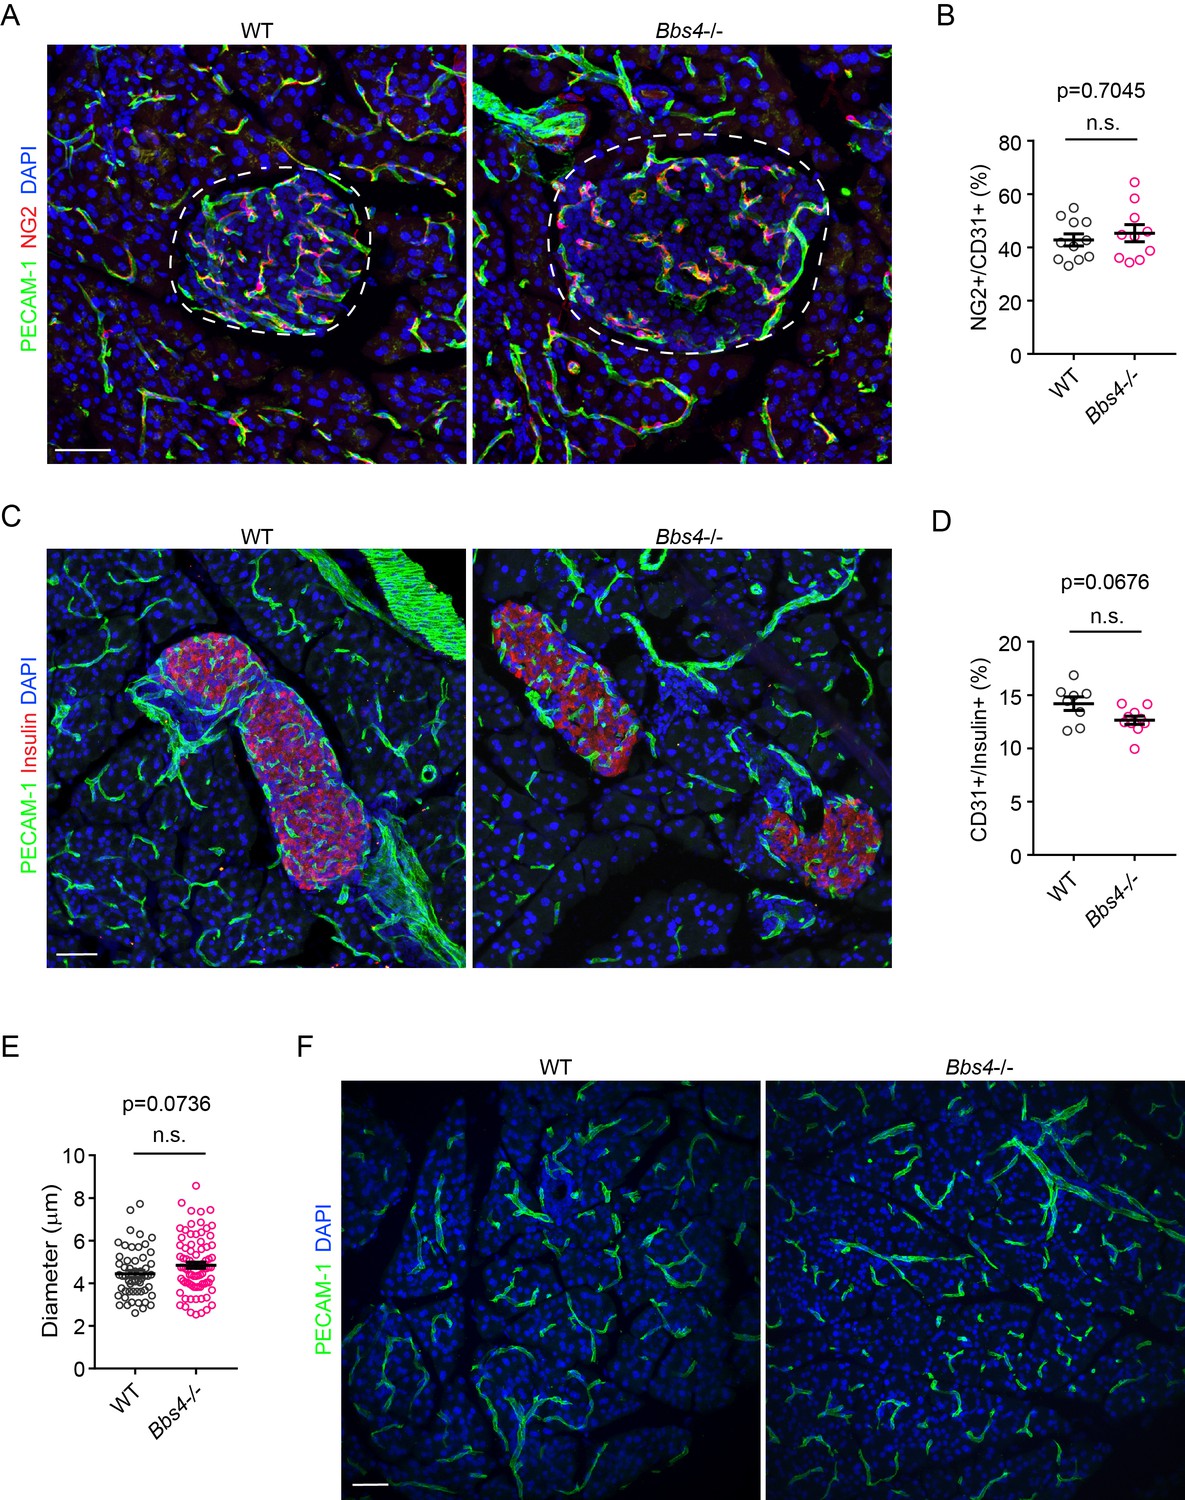
Pericyte coverage of intra-islet capillaries and capillary density in exocrine pancreas are not affected in Bbs4-/- mice.
(A) Immuno-fluorescence staining of pancreatic sections from 2-month-old wt and Bbs4-/- animals showing pericyte coverage (NG2, red) on intra-islet capillaries (PECAM-1, green). (B) Quantification of surface ratio of NG2 positive area to PECAM-1 positive area. n = 4 for animals and n = 2–4 islets per animal. (C) Immuno-fluorescence staining of pancreatic sections from 4-month-old wt and Bbs4-/- animals showing islets (insulin, red) and intra-islet capillaries (PECAM-1, green). (D–E) Quantification of relative intra-islet PECAM-1 positive volume, normalized to insulin-positive volume (D) and average intra-islet capillary diameters (E) in wt and Bbs4-/- islets from 4-month-old animals. n = 4 for animals and n = 2–4 islets per animal. (F) Immuno-fluorescence staining of pancreatic sections from 2-month-old wt and Bbs4-/- animals, showing PECAM-1 (green) labeled capillaries in exocrine pancreas. Individual data points are shown, n.s. means not significant by Mann-Whitney test. Scale bars: 50 μm.
Figure 1—figure supplement 2
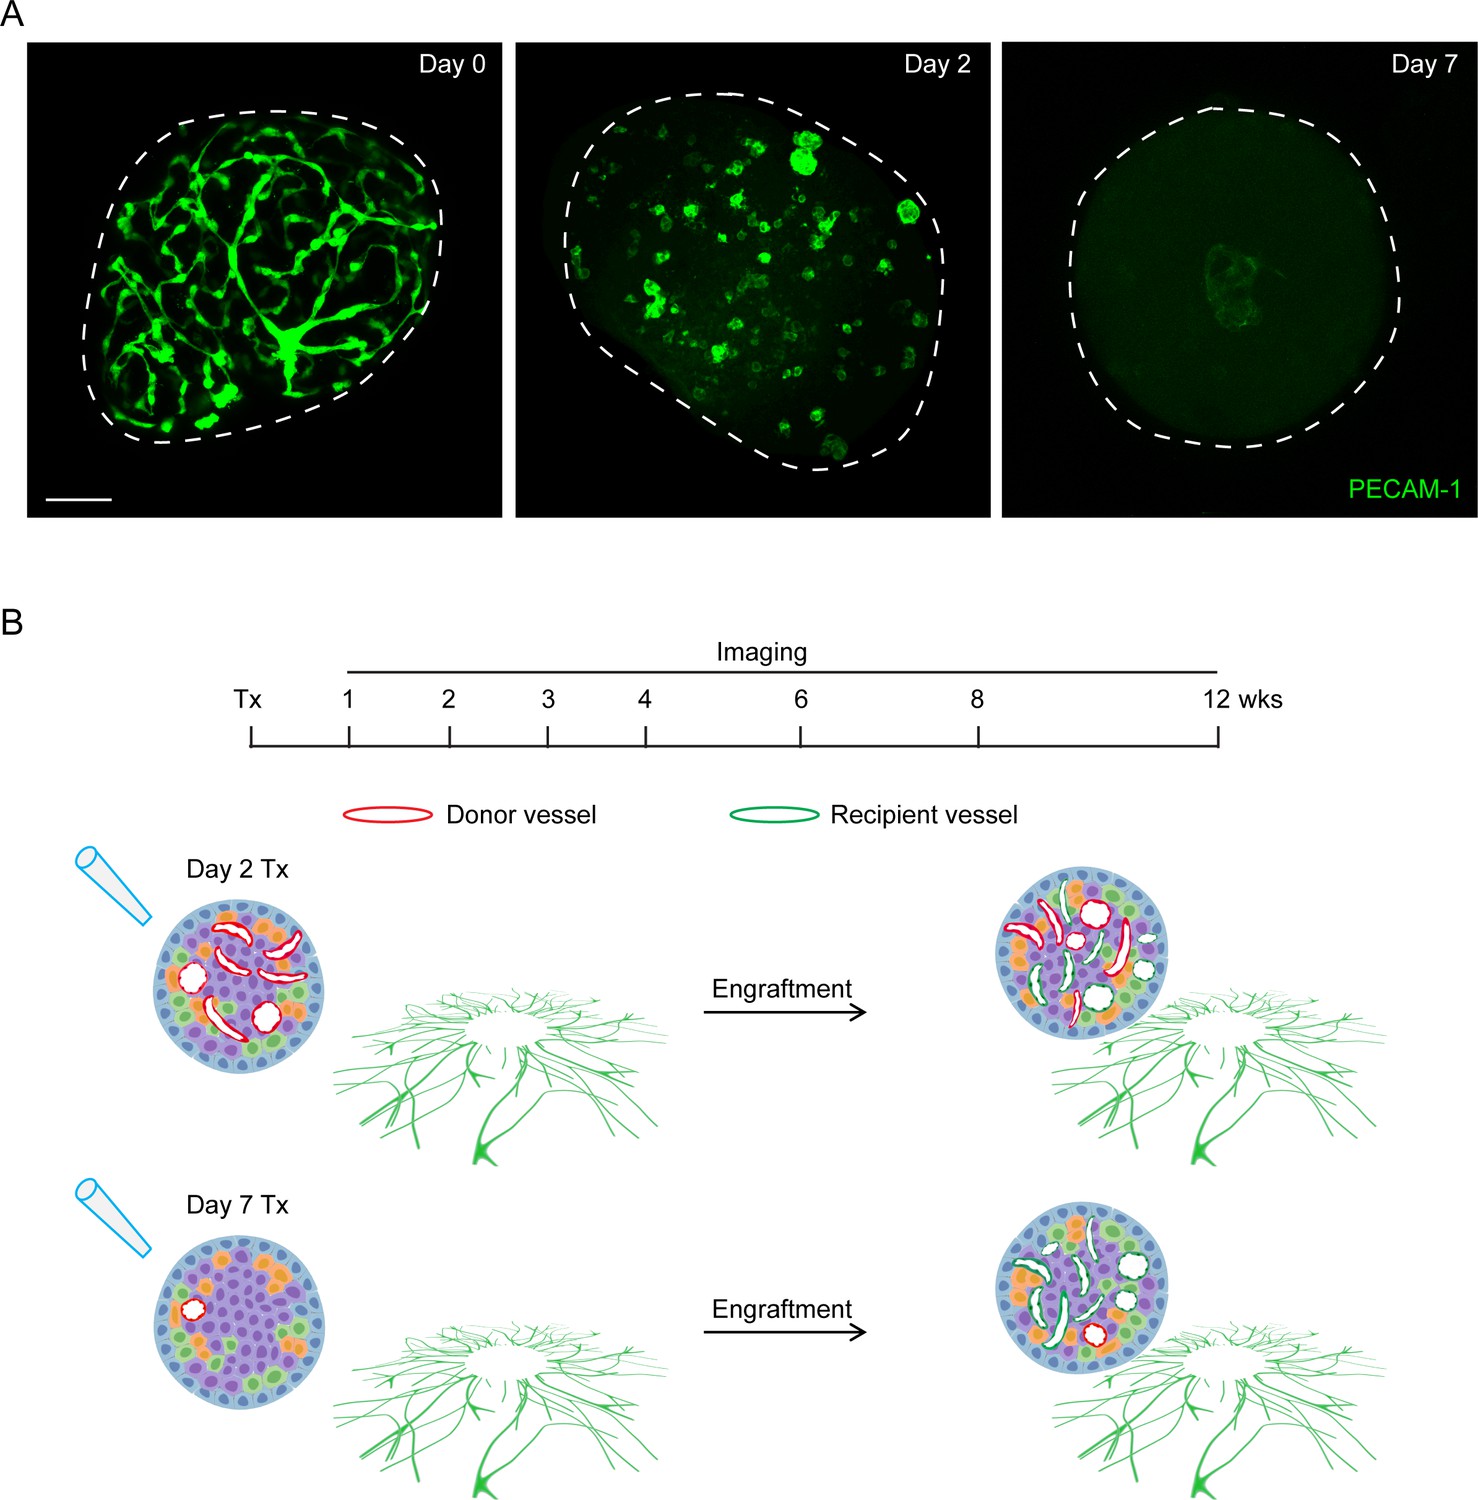
Number of donor endothelial cells participating in islet re-vascularization decreases under prolonged cultivation.
(A) Remaining endothelial cells in islets which were freshly isolated (left), or cultured for 2 days (middle) or 7 days (right), indicated by whole islet PECAM-1 staining. Scale bar: 50 μm. (B) Schematic illustration of two scenarios of islet revascularization in the anterior chamber of mouse eyes. Upper panel indicates that when transplanted after minimum in vitro culture, the newly formed islet microvasculature is composed of both donor islet vascular cells (red) and recipient cells (green). Lower panel indicates that when transplanted after prolonged culture, the number of donor islet vascular cell decreases, and islet re-vascularization is mainly derived from recipient cells.
Figure 2
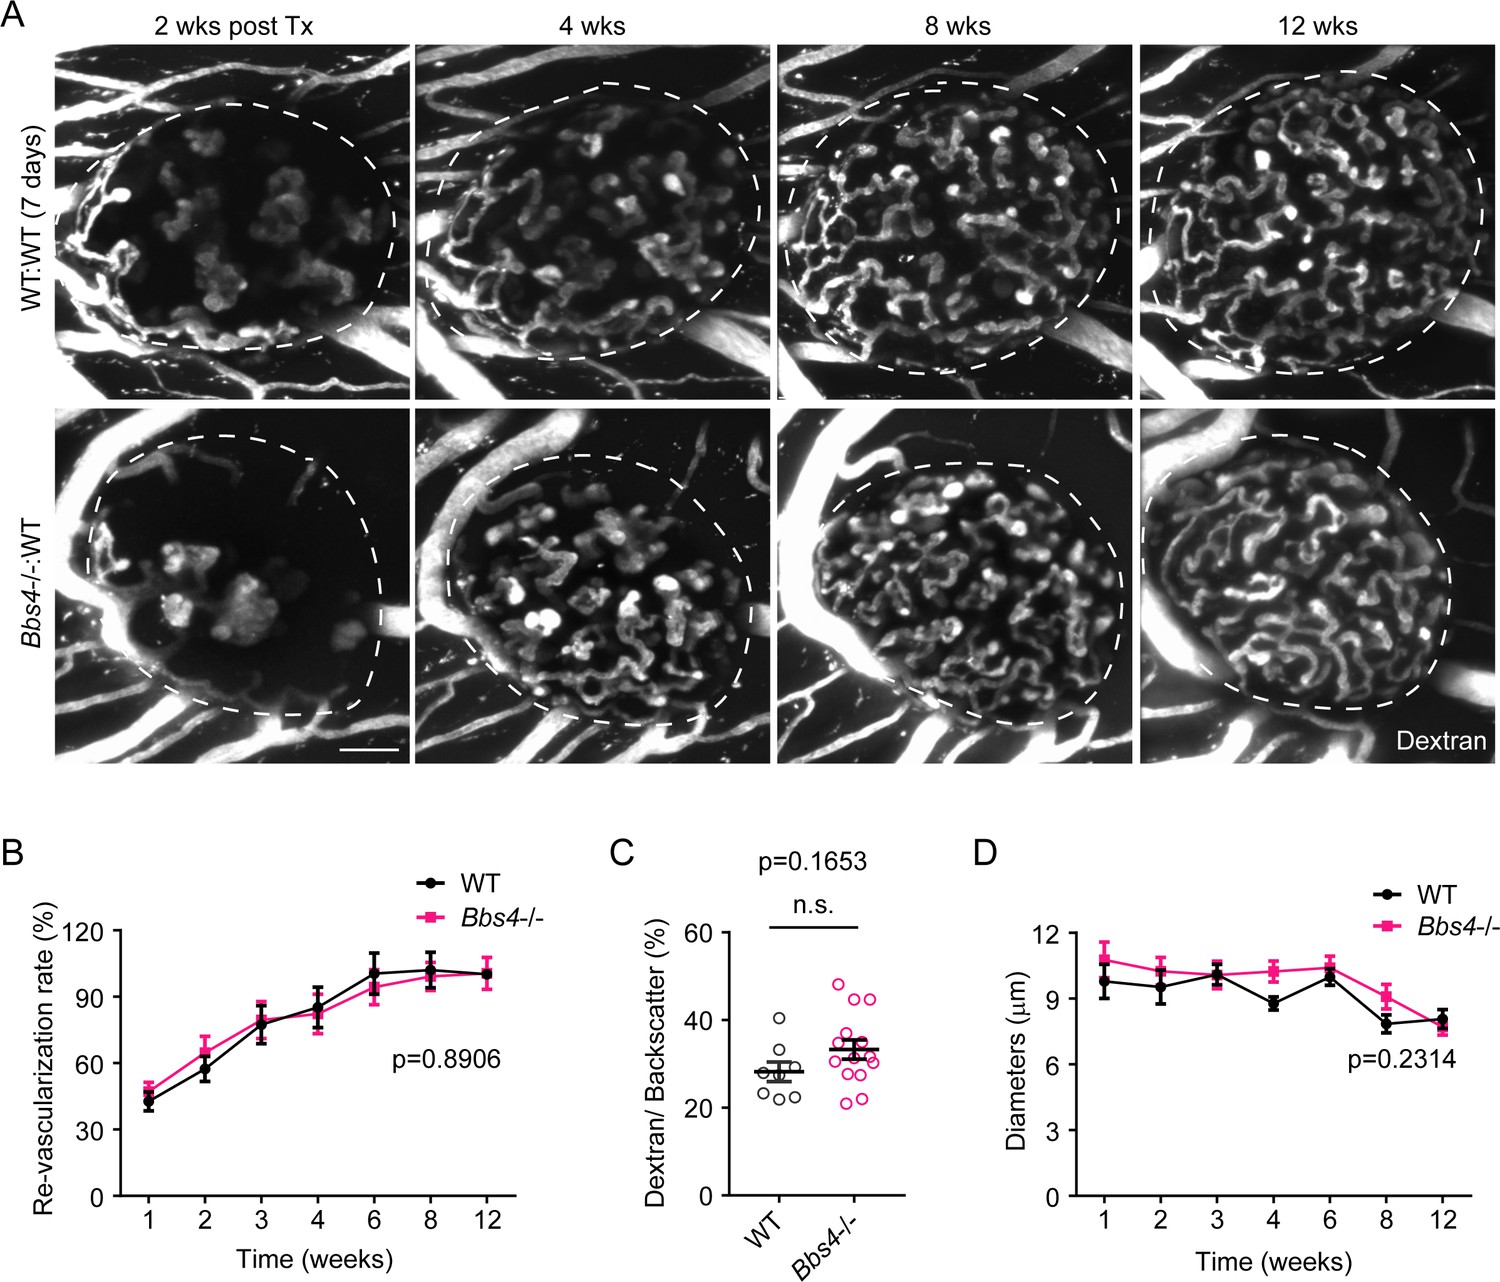
Bbs4-/- islets after prolonged culture exhibit normal re-vascularization patterns in wt recipient eyes.
(A) Re-vascularization of 7-day-cultivated wt (upper) and Bbs4-/- (lower) islets in wt recipient eyes at 2-, 4-, 8- and 12-weeks post-transplantation, visualized by intravenous injection of Texas Red-conjugated dextran. Donor islets have been cultured for 7 days prior to transplantation. (B) Quantification of re-vascularization rates of wt and Bbs4-/- islet grafts in wt recipients. Results are mean ± S.E.M. (C) Relative vascular density of wt and Bbs4-/- islet grafts at the end of 12 weeks post-transplantation. Individual data points are shown, n.s. means not significant by Mann-Whitney test. (D) Average diameters of newly formed capillaries in wt and Bbs4-/- islet grafts in wt recipients. Results are mean ± S.E.M., n = 4 for animals and n = 2–6 islets per animal. Scale bar: 50 μm.
Figure 3 with 2 supplements
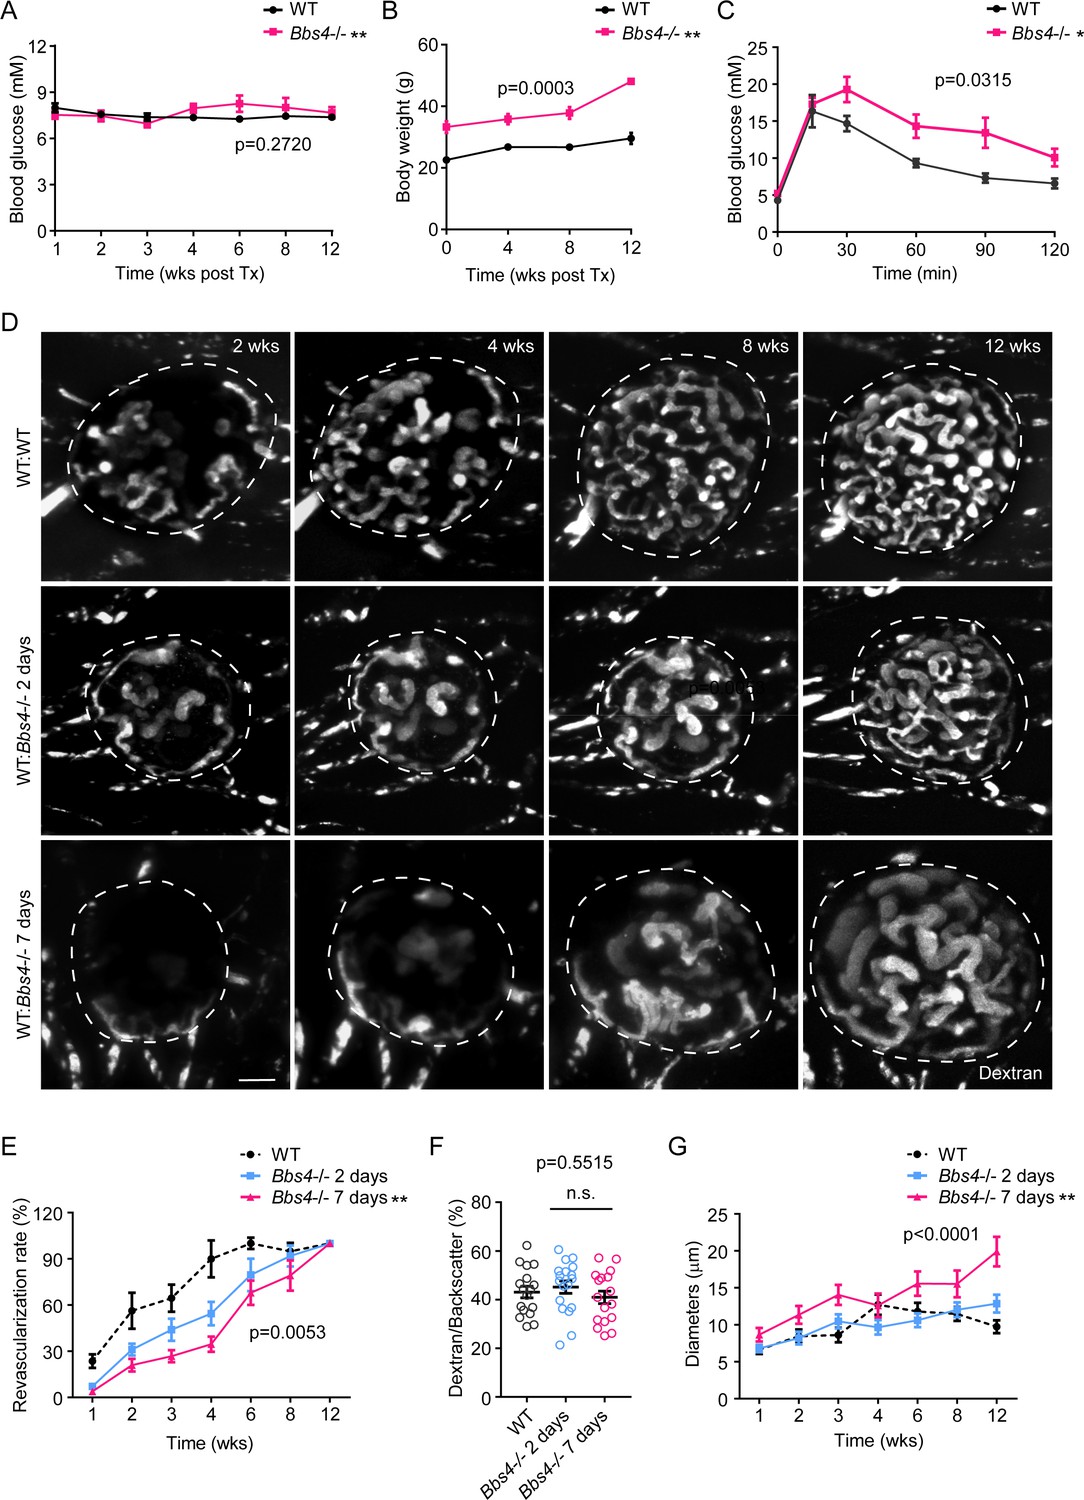
Wildtype islet grafts transplanted into Bbs4-/- recipient eyes show stronger impairment in re-vascularization.
(A) Non-fasting glycemic levels in Bbs4-/- mice during islet engraftment. (B) Body weight measurements of Bbs4-/- mice during engraftment. (C) Intraperitoneal glucose tolerance test 12 weeks post-transplantation. Results are mean ± S.E.M. *p<0.05, **p<0.01 by two-way-ANOVA, n = 5. (D) Re-vascularization of wt islets (upper) after 2 (middle) or 7 days (lower) of culture in wt or Bbs4-/- recipients at 2-, 4-, 8- and 12-weeks post-transplantation, visualized by intravenous injection of Texas Red-conjugated dextran. (E) Quantification of re-vascularization rates of wt islet grafts. Results are mean ± S.E.M. (F) Relative vascular density of wt islet grafts in different recipients at the end of 12 weeks post-transplantation. Individual data points are shown, n.s. means not significant by one-way-ANOVA. (G) Average diameters of newly formed capillaries in wt islet grafts. Results are mean ± S.E.M. Comparisons were made between 2 day and 7 day groups by two-way-ANOVA, *p<0.05, **p<0.01. n = 4 for animals and n = 2–4 islets per animal for wt recipients. n = 5 for animals and n = 1–4 islets per animal for Bbs4-/- recipients. Scale bar: 50 μm.
Figure 3—figure supplement 1
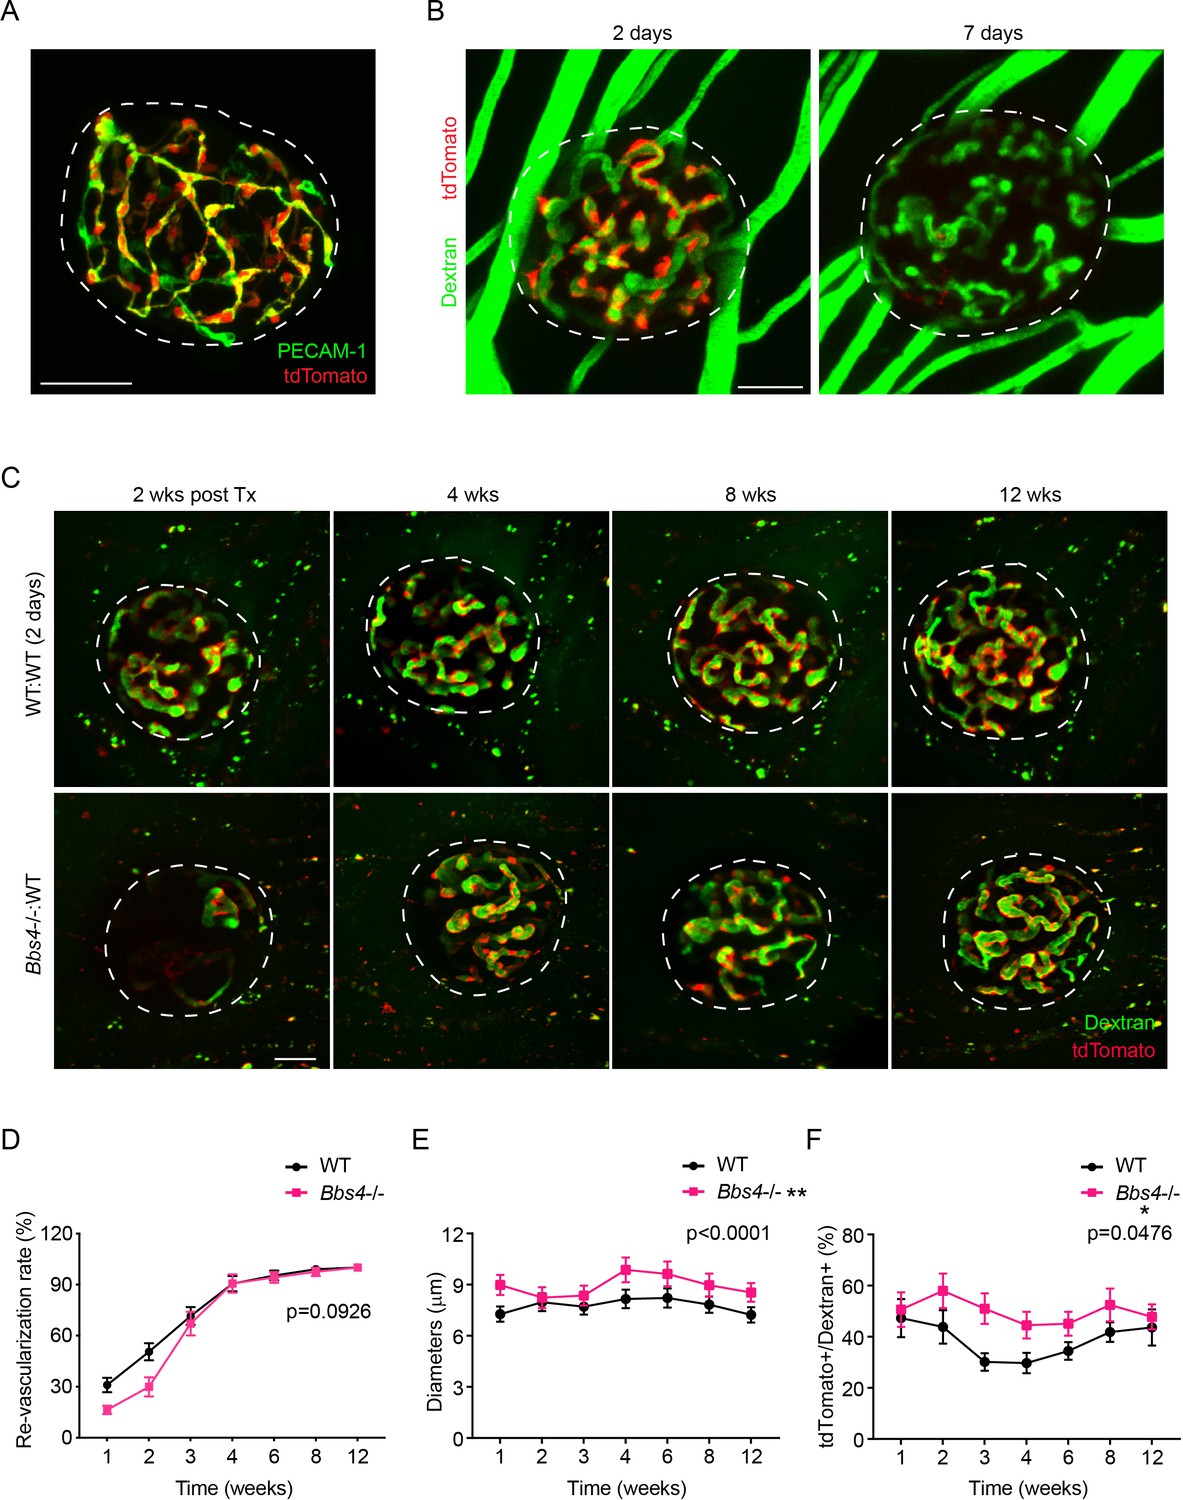
Bbs4-/- endothelial cells are less responsive to the angiogenic signals during islet re-vascularization.
(A) Immuno-fluorescence staining of a freshly isolated islet from Cdh-tdT mice showing that tdTomato fluorescence (red) and intra-islet capillaries (PECAM-1, green) overlaps. (B) Representative images showing that 2-day and 7-day cultivation of Cdh-tdT islets leads to different amounts of donor endothelial cells constituting islet vasculature after engraftment. (C) Re-vascularization of 2-day-cultivated wt (upper) and Bbs4-/- (lower) islets in Cdh-tdT recipient eyes at 2-, 4-, 8- and 12-weeks post-transplantation, visualized by intravenous injection of FITC-conjugated dextran. (D) Quantification of re-vascularization rates of wt and Bbs4-/- islet grafts in Cdh-tdT recipients. (E) Average diameters of newly formed capillaries in wt and Bbs4-/- islet grafts in wt recipients. (F) Proportion of recipient to donor endothelial cells in wt and Bbs4-/- islet grafts indicated by the surface area ratio of tdTomato labeled cells to total dextran labeled islet vessels during engraftment. Results are mean ± S.E.M. *p<0.05, **p<0.01 by two-way ANOVA, n = 5 for animals and n = 2–4 islets per animal. Scale bars: 50 μm.
Figure 3—figure supplement 2
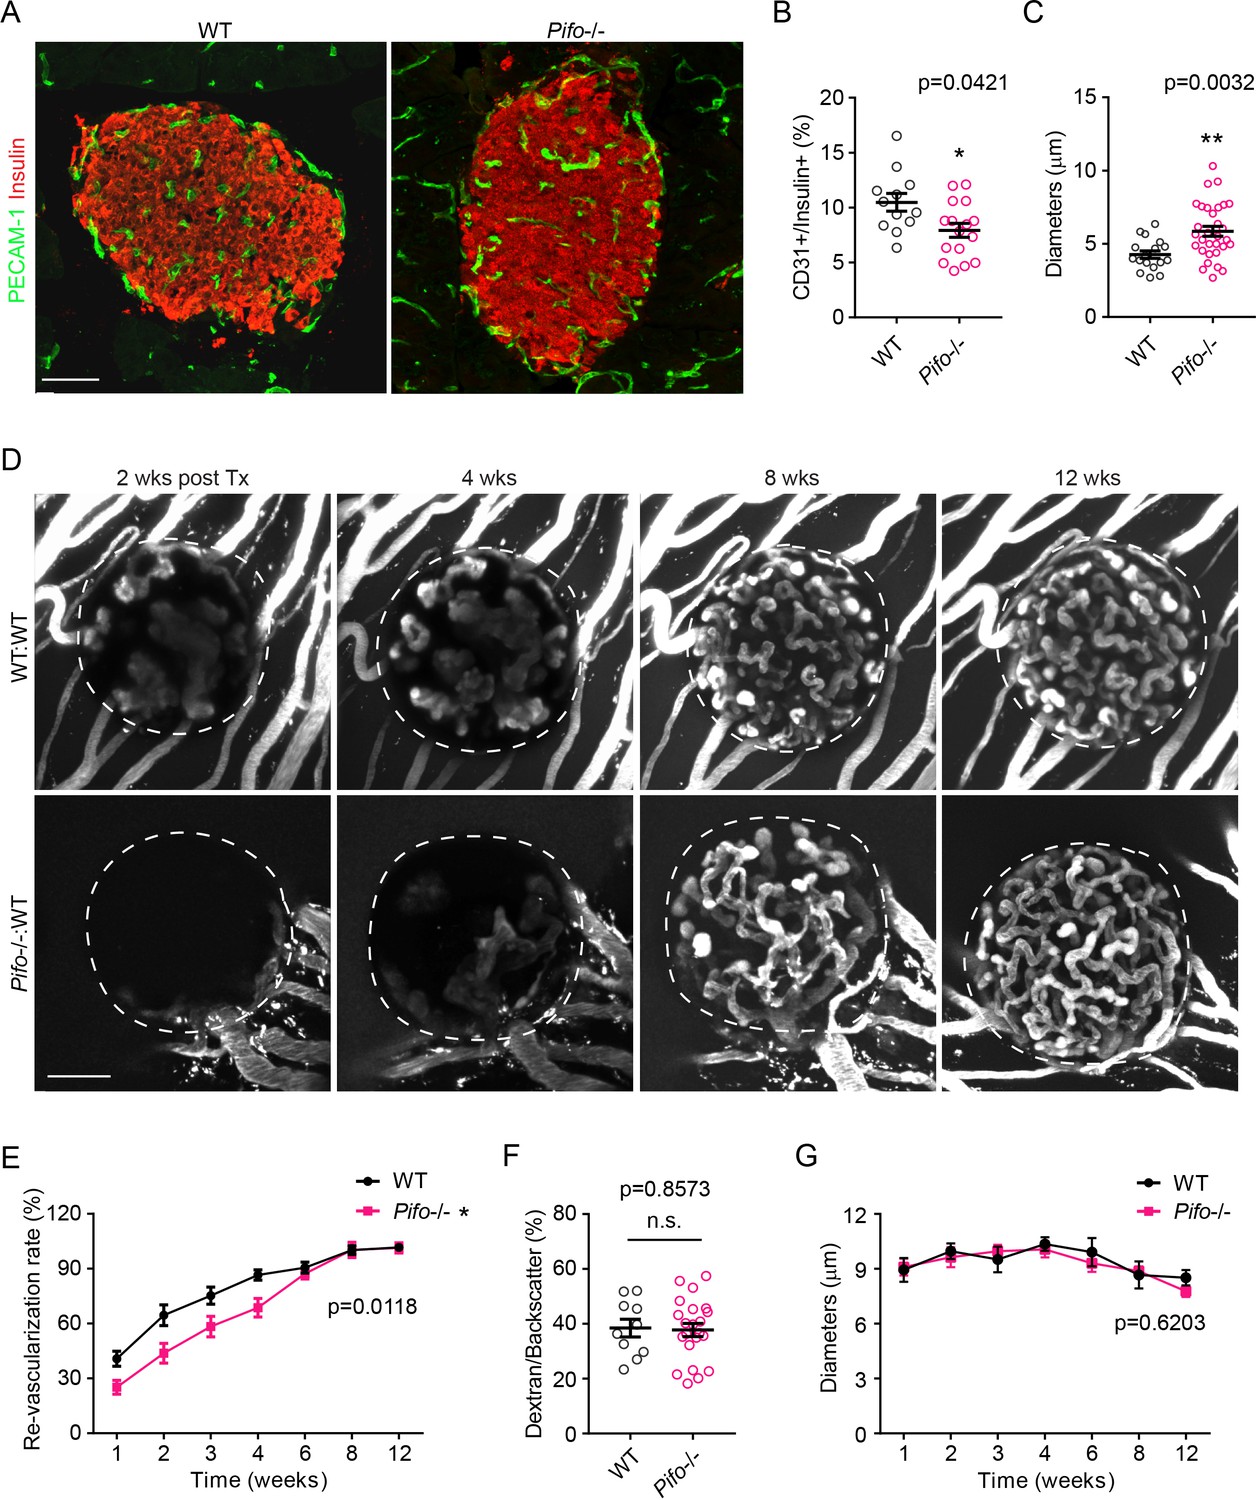
Pifo-/-mice exhibit similar islet vascular phenotypes as Bbs4-/- mice.
(A) Immuno-fluorescence staining of pancreatic sections from 3-month-old wt and Pifo-/-mice showing islets (insulin, red) and intra-islet capillaries (PECAM-1, green). (B–C) Quantification of relative intra-islet PECAM-1 positive volume, normalized to insulin-positive volume (B) and average intra-islet capillary diameters (C) in wt and Pifo-/-pancreatic sections. Individual data points are shown. *p<0.05, **p<0.01 by Mann-Whitney test, n = 3 for animals and n = 4–6 islets per animal. (D) Re-vascularization of 2-day-cultivated wt (upper) and Pifo-/- (lower) islets in wt recipient eyes at 2-, 4-, 8- and 12-weeks post-transplantation, visualized by intravenous injection of Texas Red-conjugated dextran. (E) Quantification of re-vascularization rates of wt and Pifo-/-islet grafts in wt recipients. Results are mean ± S.E.M. (F) Relative vascular density of wt and Pifo-/-islet grafts at the end of 12 weeks post-transplantation. Individual data points are shown. (G) Average diameters of newly formed capillaries in wt and Pifo-/-islet grafts in wt recipients. Results are mean ± S.E.M., **p<0.01 by two-way ANOVA, n.s. means not significant by Mann-Whitney test, n = 5 for animals and n = 2–5 islets per animal. Scale bars: 50 μm.
Figure 4
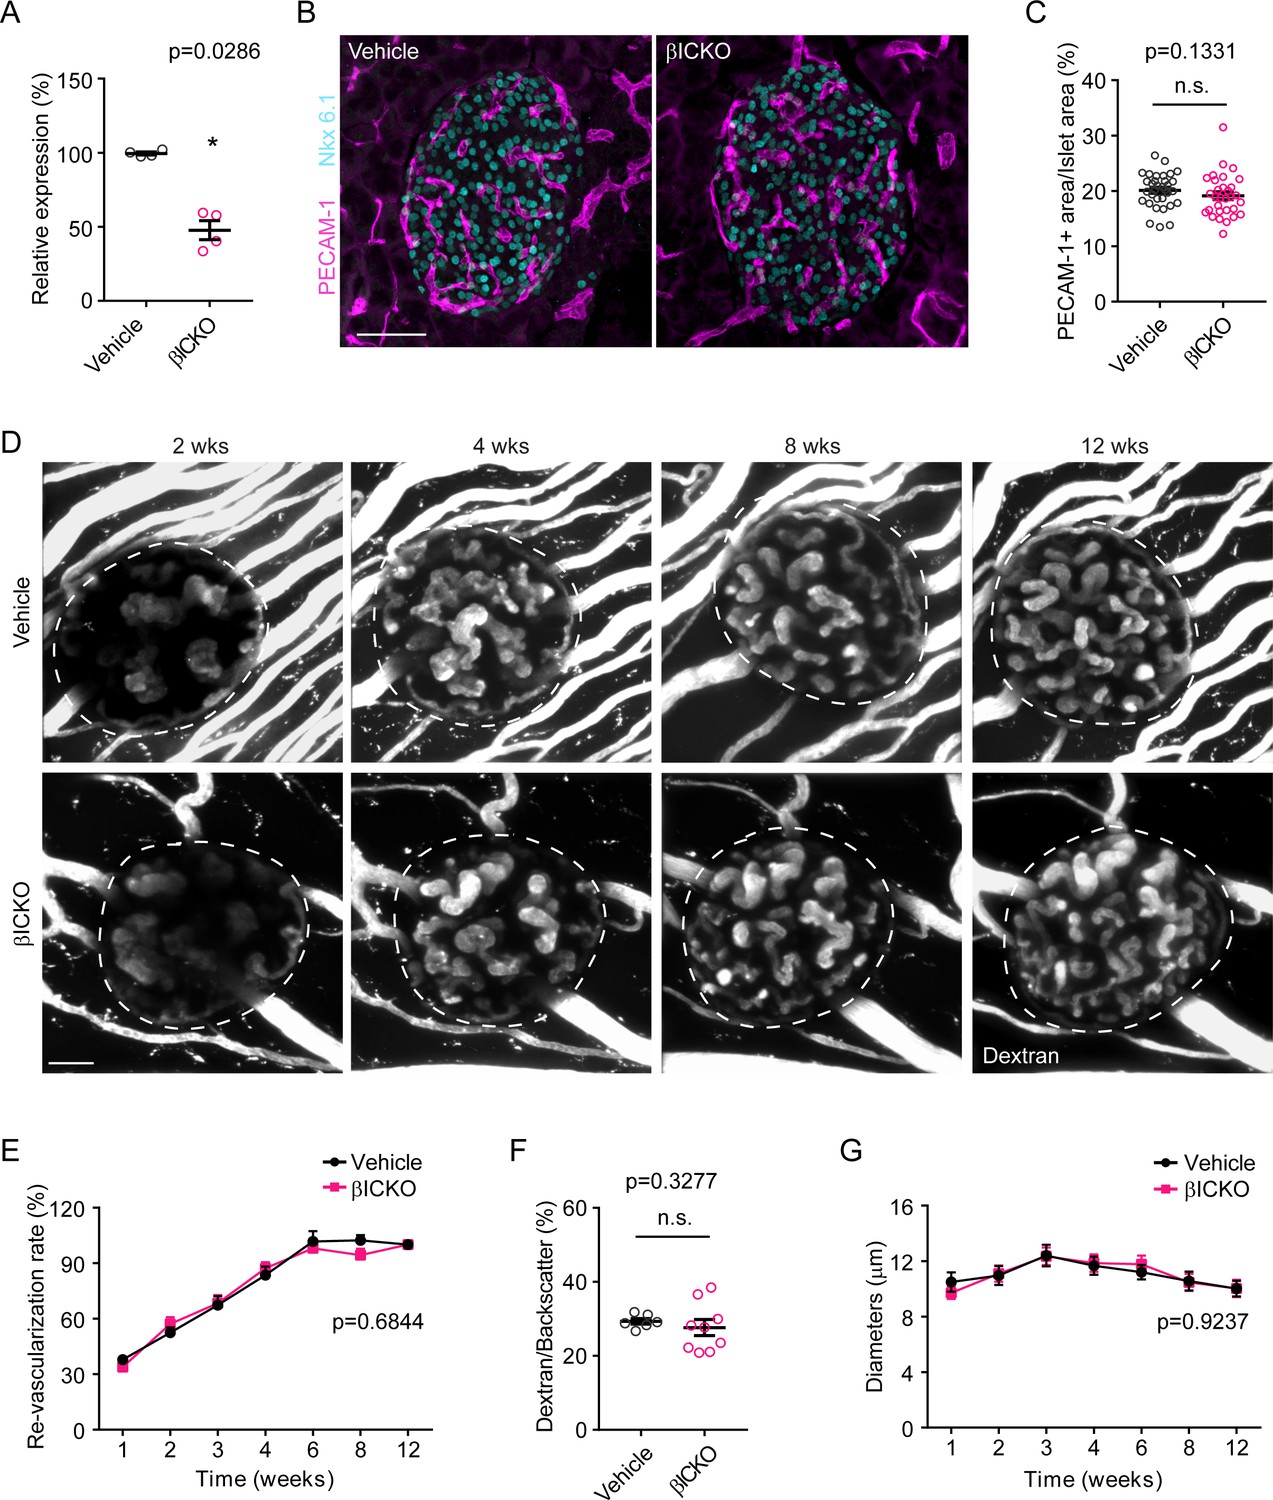
βICKO mice display no visible islet vascular phenotypes.
(A) Efficiency of Ift88 silencing by tamoxifen induction. Individual data points are shown, **p<0.01 by Mann-Whitney test, n = 4 for animals. (B) Immuno-fluorescence staining of pancreatic sections from 2-month-old control (vehicle) and βICKO mice, showing islets (Nkx 6.1, cyan) and intra-islet capillaries (PECAM-1, magenta). (C) Quantification of relative intra-islet PECAM-1 positive area, normalized to islet area in control and βICKO pancreatic sections. Individual data points are shown, n.s. means not significant by Mann-Whitney test, n = 6 for animals and n = 5–6 islets per animal. (D) Re-vascularization of overnight-cultured control (upper) and βICKO (lower) islets in wt recipient eyes at 2-, 4-, 8- and 12-weeks post-transplantation, visualized by intravenous injection of Texas Red-conjugated dextran. (E) Quantification of re-vascularization rates of control and βICKO islet grafts in wt recipients. Results are mean ± S.E.M. n = 6 for animals and n = 6–8 islets per animal. (F) Relative vascular density of control and βICKO islet grafts at the end of 12 weeks post-transplantation. Individual data points are shown. n = 3 for animals and n = 2–3 islets per animal. (G) Average diameters of newly formed capillaries in control and βICKO islet grafts in wt recipients. Results are mean ± S.E.M. and n.s. means not significant by Mann-Whitney test. n = 6 for animals and n = 6–8 islets per animal. Scale bars: 50 μm.
Figure 5 with 1 supplement
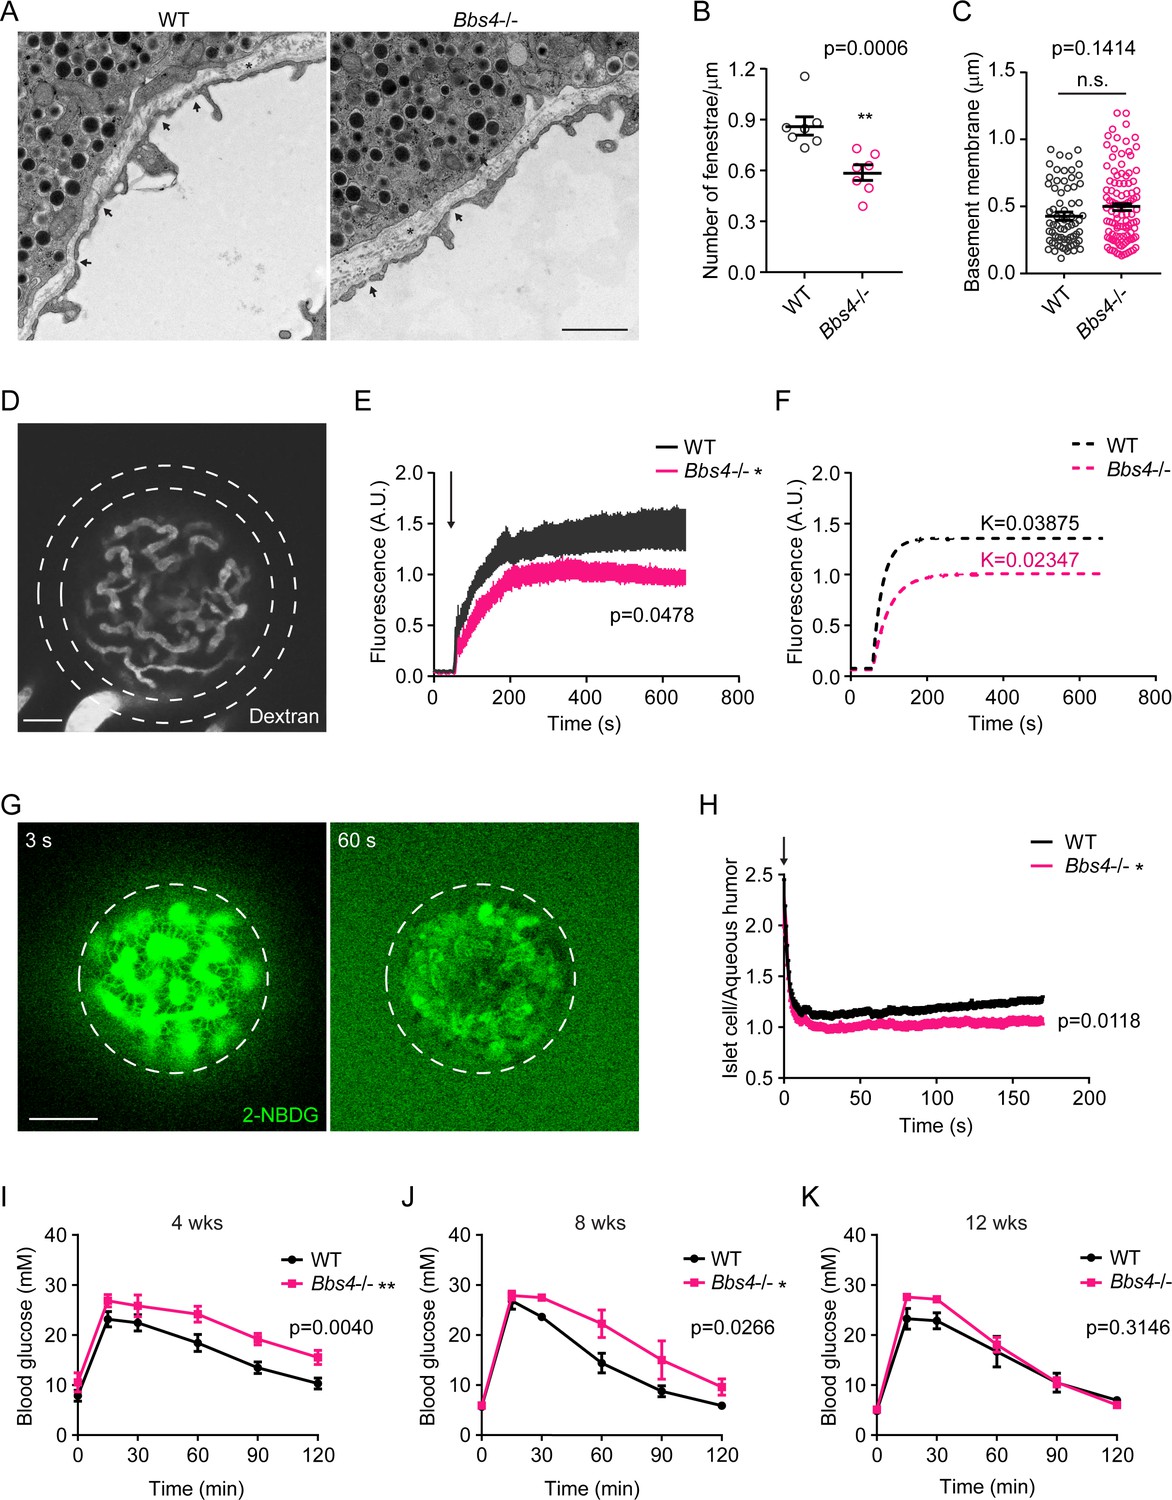
Dysfunctional intra-islet vasculature in Bbs4-/- islets undermines glucose metabolism.
(A) Electron microscopic images of wt and Bbs4-/- islet graft dissected from wt recipient eyes, showing fenestrated islet capillaries (arrows) and basement membrane (asterisks). Scale bar: 1 μm. (B–C) Quantification of average fenestrae density (B) and basement membrane thickness (C) of the capillaries in wt and Bbs4-/- islet grafts. Individual data points are shown, **p<0.01, n.s. means not significant by Mann-Whitney test, n = 7 for animals, and n = 1–2 for islets. (D) Representative image showing leakage of 40 KDa FITC-conjugated dextran from wt islet grafts in mouse eyes at 1 min after injection. Scale bar: 50 μm. (E–F) Quantification of FITC fluorescence intensity in the region circles by the dashed lines outside wt and Bbs4-/-islet grafts (E) and simulated curves showing different kinetics (F). Arrow indicates injection time point. Results are mean ± S.E.M. *p<0.05 by two-way-ANOVA, n = 12 for animals. (G) Representative image showing 2-NBDG leakage from wt islet vasculature and uptake by islet cells in vivo. Times points are 3 s (left) and 60 s (right) after injection. Scale bar: 50 μm. (H) Real-time ratio of 2-NBDG fluorescence intensity in islet cells of wt and Bbs4-/- islet grafts to aqueous humor. Arrow indicates injection time point. Results are mean ± S.E.M. *p<0.05, n = 8 for animals and n = 1–2 for islets. (I–K) Intraperitoneal glucose tolerance test of wt recipient mice which were transplanted with wt or Bbs4-/- islets, at 4 weeks (I), 8 weeks (J) and 12 weeks (K) post-transplantation. Results are mean ± S.E.M. *p<0.05, **p<0.01 by two-way-ANOVA, n = 6 for animals.
Figure 5—figure supplement 1
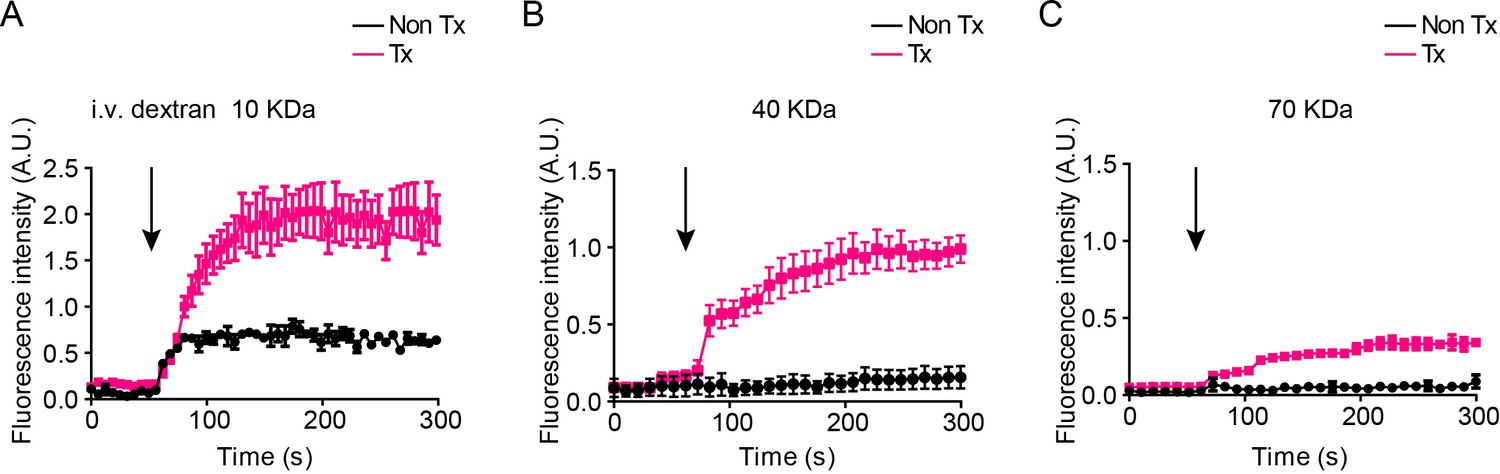
Dextran leakage kinetics from the capillaries of islet grafts or the iris vessels in mouse eyes.
Kinetics of fluorescence intensity outside islet grafts in transplanted eyes (Tx) or in the aqueous humor of non-transplanted control eyes (Non-Tx) after intravenously injection of fluorescently labeled dextran at sizes of 10 KDa (A), 40 KDa (B) and 70 KDa (C), respectively. Results are mean ± S.E.M, n = 4.
Figure 6 with 1 supplement
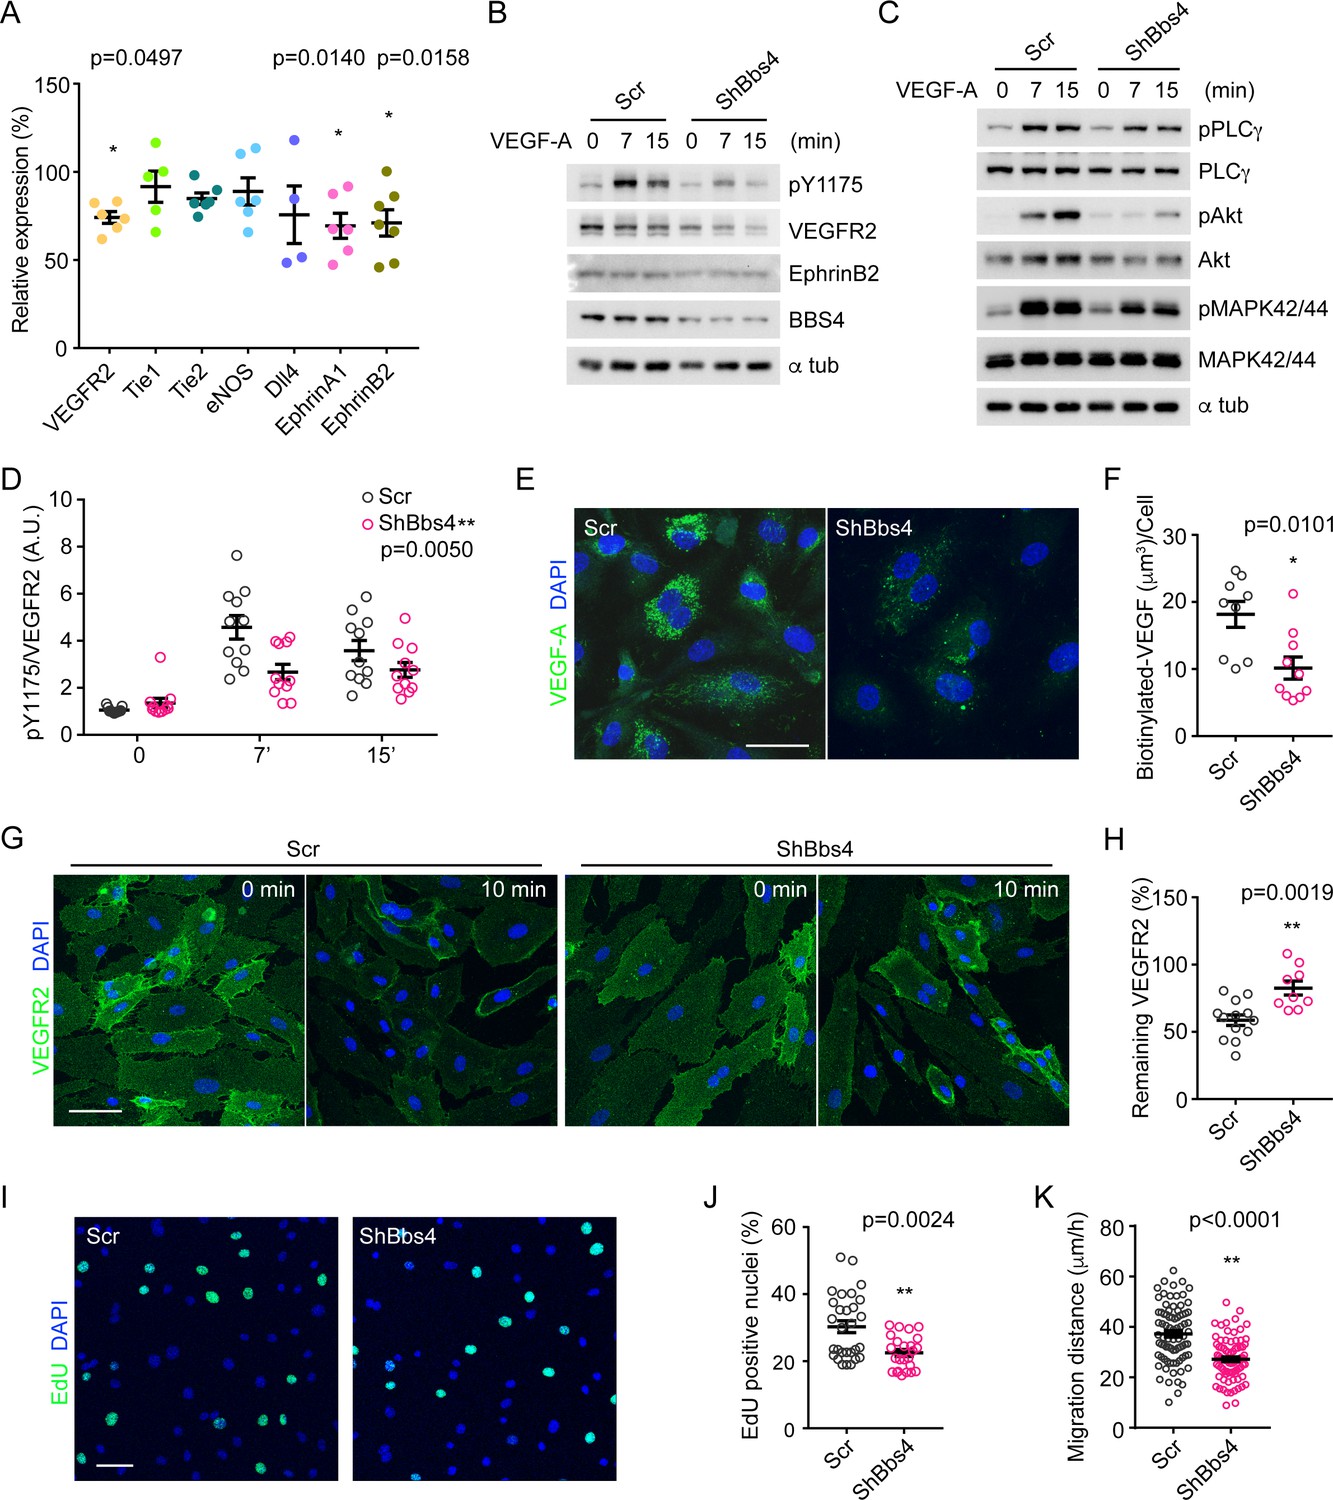
VEGFA-VEGFR2 induced signaling pathway and angiogenic response is disrupted in Bbs4 silenced endothelial cells.
(A) qPCR analysis of VEGF-A signaling related gene expression in Bbs4 silenced MS-1. Results are presented as relative mRNA levels normalized to scrambled shRNA treated cells, *p<0.05, **p<0.01 by one-way-ANOVA, n = 3. (B) and (C) Western blots showing VEGF-A signaling pathway in scrambled or shBbs4 treated HDMECs. (D) Quantification of VEGFR2 activation. (E) Representative images showing biotinylated VEGF-A uptake in scrambled or ShBbs4 treated HDMECs and quantification (F). (G) Representative cell surface staining of VEGFR2 in scrambled (Scr) or ShBbs4 treated HDMECs, prior to (0 min) and after VEGF-A stimulation (10 min). (H) Quantification of the percentage of remaining membrane-bound VEGFR2. (I) VEGF-A induced proliferation in Scr or ShBbs4 treated MS-1 by EdU assay (green) and quantification (J). (K) VEGF-A induced endothelial cell migration in Scr or ShBbs4 treated MS-1. Individual data points are shown, *p<0.05, **p<0.01 by Mann-Whitney test, n = 3. Scale bars: 50 μm.
Figure 6—figure supplement 1
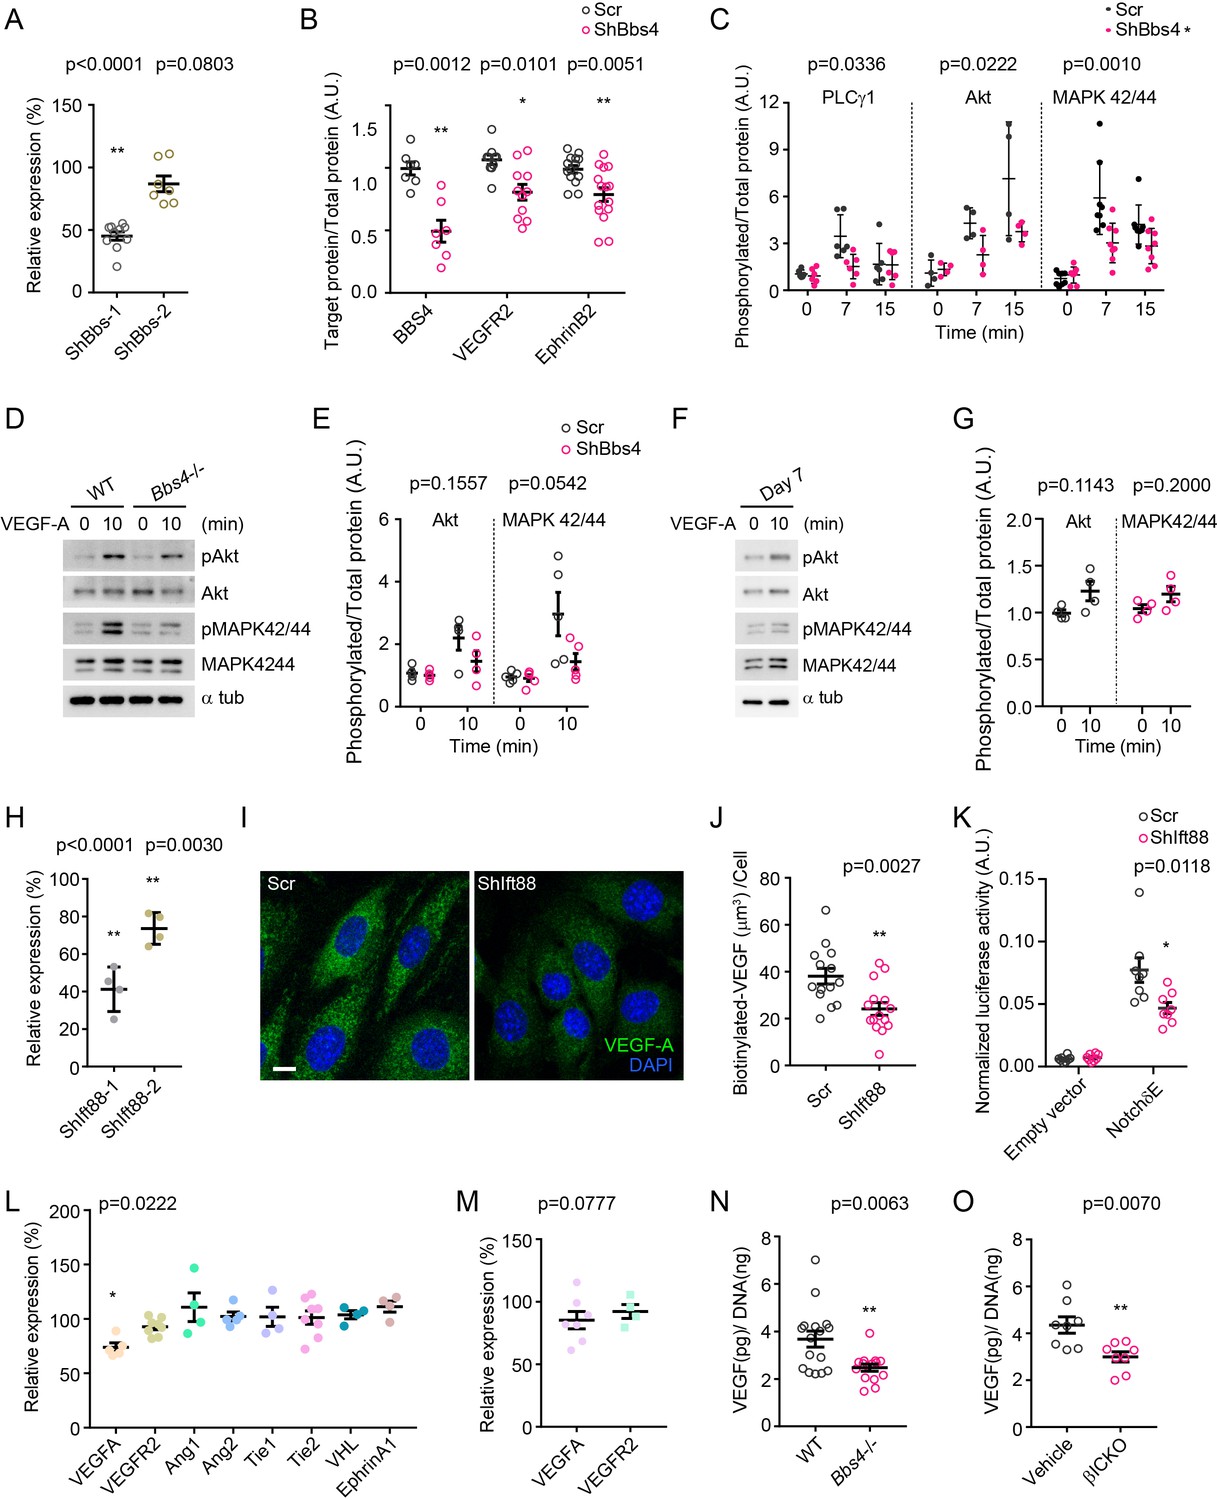
VEGF-A gene expression, secretion and signaling in Bbs4 or Ift88 depleted cells.
(A) Efficiency of shRNA silencing of Bbs4 in MS-1 endothelial cells. Individual data points are shown, **p<0.01 by one-way-ANOVA, n = 4. (B–C) Quantification of western blots showing BBS4, VEGFR2 and EphrinB2 protein levels (B), and activation of PLCγ1, Akt and MAPK 42/44 (C) in scrambled or shBbs4 treated HDMECs. *p<0.05, **p<0.01 by two-way-ANOVA, n = 3. (D) Western blots showing VEGF-A signaling pathway in freshly isolated wt and Bbs4-/- islets, and (E) quantification of activation of Akt and MAPK 42/44. *p<0.05 by two-way-ANOVA, n = 3 for animals. (F) Western blots showing VEGF-A signaling pathway in isolated wt islets cultivated for 7 days, and (G) quantification of activation of Akt and MAPK 42/44, *p<0.05 by Mann-Whitney test, n = 2 for animals. (H) Efficiency of shRNA silencing of Ift88 in MS-1 cells. **p<0.01 by one-way-ANOVA, n = 3. (I) Representative images showing biotinylated VEGF-A uptake in scrambled or ShIft88 treated MS-1 cells and quantification (J), **p<0.01 by Mann-Whitney test, n = 3. Scale bar: 10 μm. (K) Notch signaling activity in scrambled or ShIft88 treated MS-1 cells and indicated by luciferase assay. *p<0.05 by Mann-Whitney test, n = 3. (L) qPCR analysis of angiogenic gene expression in freshly isolated wt and Bbs4-/- islets. **p<0.01 by one-way-ANOVA, n = 4 for animals. (M) qPCR analysis of VEGF-A and VEGFR2 gene expression in freshly isolated control and βICKO islets. Results are presented as relative mRNA levels normalized to control. *p<0.05 by one-way-ANOVA, n = 4 for animals. (N) VEGF-A secretion from cultured wt and Bbs4-/- islets, normalized to total DNA quantity of islets. **p<0.01 by Mann-Whitney test, n = 5 for animals. (O) VEGF-A secretion from cultured control and βICKO islets, normalized to total DNA quantity of islets. **p<0.01 by Mann-Whitney test, n = 4 for animals.
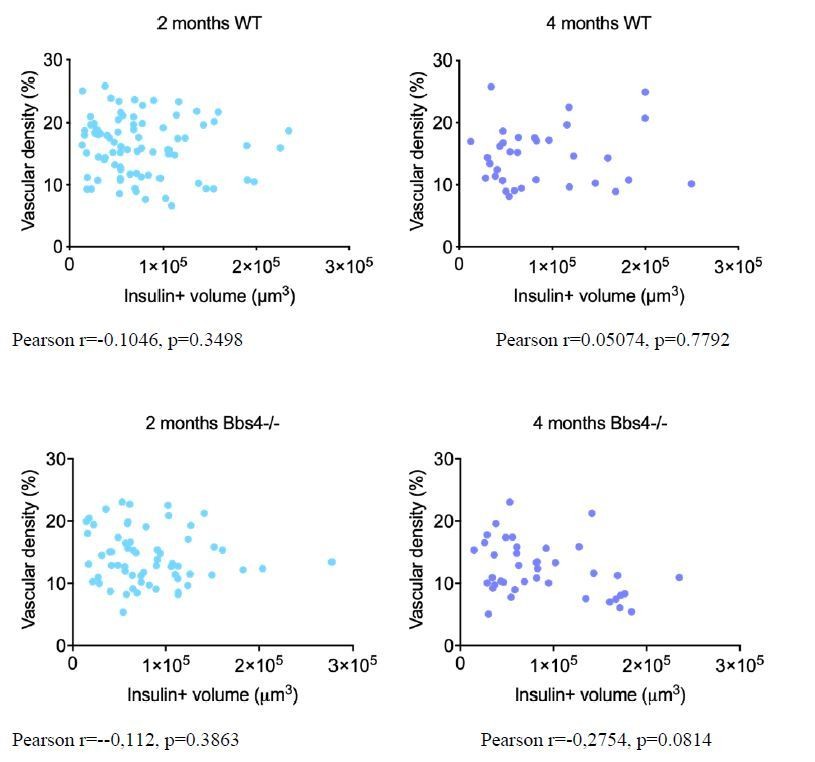
Author response image 1
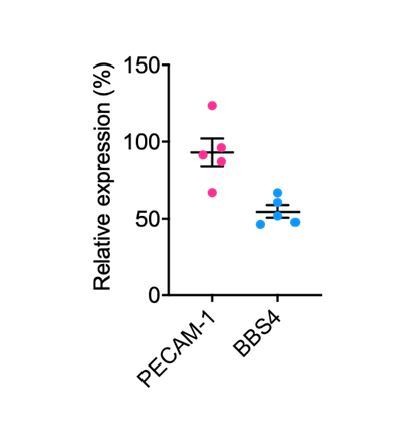
Author response image 2
Tables
Key resources table
| Reagent type (species) or resource | Designation | Source or reference | Identifiers | Additional information |
|---|---|---|---|---|
| Cell line (Homo sapiens) | HEK 293FT | Thermo Fisher Scientific | # R70007 RRID:CVCL_6911 | Human embryonic kidney |
| Cell line (Homo sapiens) | HDMEC | Promocell | C-12212 | Primary human dermal microvascular endothelium |
| Cell line (Mus musculus) | MS-1 | ATCC | #CRL-2279 RRID:CVCL_D134 | Pancreas/islet of Langerhans; endothelium |
| Antibody | Goat polyclonal anti-PECAM-1 | R&D systems | AF3628 | (IF 1:400) |
| Antibody | Rabbit polyclonal anti-NG2 | Merck | AB5320 | (IF 1:200) |
| Antibody | Guinea pig polyclonal anti-Insulin | Dako | A0564 | (IF 1:1000) |
| Antibody | Rabbit polyclonal anti-BBS4 | Proteintech | 12766–1-AP | (WB 1:1000) |
| Antibody | Rabbit polyclonal anti-EphrinB2 | Thermo Fisher Scientific | BS-10659R | (WB 1:500) |
| Antibody | Rabbit monoclonal anti-phospho-VEGFR2 Y1175 | Cell Signaling Technology | 2478 | (WB 1:1000) |
| Antibody | Rabbit monoclonal anti-VEGFR2 | Cell Signaling Technology | 9698 | (IF 1:200) (WB 1:1000) |
| Antibody | Rabbit monoclonal anti-phospho-PLCγ1 Y783 | Cell Signaling Technology | 2821 | (WB 1:1000) |
| Antibody | Rabbit monoclonal anti-PLCγ1 | Cell Signaling Technology | 2822 | (WB 1:1000) |
| Antibody | Rabbit monoclonal anti-phospho-Akt Thr308/473 | Cell Signaling Technology | 4051 | (WB 1:1000) |
| Antibody | Rabbit monoclonal anti-pan Akt | Cell Signaling Technology | 4691 | (WB 1:1000) |
| Antibody | Rabbit monoclonal anti-phospho- p44/42 MAPK Thr202/Tyr204 | Cell Signaling Technology | 4370 | (WB 1:2000) |
| Antibody | Rabbit monoclonal anti- p44/42 MAPK | Cell Signaling Technology | 4695 | (WB 1:2000) |
| Antibody | Mouse monoclonal anti-α-tubulin | Sigma-Aldrich | T8203 | (WB 1:2000) |
| Antibody | Donkey monoclonal anti-Rabbit IgG, peroxidase-linked species-specific whole antibody Secondary Antibody | GE Healthcare | 10794347 | (WB 1:6000) |
| Antibody | Sheep monoclonal anti-mouse IgG, peroxidase-linked species-specific whole antibody Secondary Antibody | GE Healthcare | 10196124 | (WB 1:6000) |
| Peptide, recombinant protein | Recombinant Human VEGF 165 | Peprotech | 100–20 | 100 μg/ml in 1XPBS |
| Peptide, recombinant protein | Recombinant Human VEGF 165, Biotinylated Protein | R&D systems | BT293 | 100 μg/ml in 1XPBS |
| Commercial assay or kit | Mouse VEGF Quantikine ELISA Kit | R&D systems | MMV00 | |
| Commercial assay or kit | PowerUp SYBR Green Master Mix | Thermo Fisher Scientific | A25742 | |
| Commercial assay or kit | Dextran, Texas Red, 70,000 MW, Neutral | Thermo Fisher Scientific | D1830 | 5 mg/ml in 1X PBS |
| Commercial assay or kit | Dextran, Fluorescein, 40,000 MW, Anionic | Thermo Fisher Scientific | D1844 | 2.5 mg/ml in 1X PBS |
| Commercial assay or kit | Click-iT EdU Cell Proliferation Kit for Imaging, Alexa Fluor 488 dye | Thermo Fisher Scientific | C10337 | |
| Chemical compound, drug | 2-NBDG (2-(N-(7-Nitrobenz-2-oxa-1,3-diazol-4-yl)Amino)−2-Deoxyglucose) | Thermo Fisher Scientific | N13195 | 5 mg/ml in 1X PBS |
| Chemical compound, drug | Streptozotocin | Sigma-Aldrich | S0130-50MG | |
| Software, algorithm | MATLAB | MathWorks | RRID:SCR_001622 | R2016a |
| Software, algorithm | Volocity | PerkinElmer (Massachusetts, USA) | RRID:SCR_002668 | |
| Software, algorithm | Fiji-ImageJ | http://imagej.net/Fiji | RRID:SCR_002285 |
Table 1
Sequences of qPCR primers.
| Gene | Sequence |
|---|---|
| 18S | L:5’-AACCCGTTGAACCCCATT-3’ R:5’-CCATCCAATCGGTAGTAGCG-3’ |
| HMBS | L:5’-CGGAGTCATGTCCGGTAAC-3’ R:5’-GGTGCCCACTCGAATCAC-3’ |
| TBP | L:5’-TGCTGTTGGTGATTGTTGGT-3’ R:5’-CTGGCTTGTGTGGGAAAGAT-3’ |
| Bbs4 | L:5’-AATGCACTGACCTACGACCC-3’ R:5’-ATGCTGATGCATACTGCTGC-3’ |
| Ift88 | L:5’-TGAAGTGGCAGCTGATGGTA-3’ R:5’-CTGTGCAGAGACGAACCAAG-3’ |
| VEGF-A | L:5’-CAGGCTGCTGTAACGATGAA-3’ R:5’-GCATTCACATCTGCTGTGCT-3’ |
| VEGFR2 | L:5’-GGCGGTGGTGACAGTATCTT-3’ R:5’-GTCACTGACAGAGGCGATGA-3’ |
| Ang-1 | L:5’-GATCTTACACGGTGCCGATT-3’ R:5’-TTAGATTGGAAGGGCCACAG-3’ |
| Ang-2 | L:5’-TCCAAGAGCTCGGTTGCTAT-3’ R:5’-AGTTGGGGAAGGTCAGTGTG-3’ |
| Tie-1 | L:5’-TCAACTGCAGCTCCAAAATG-3’ R:5’-TGACAGCTCTGTCCAAAACG-3’ |
| Tie-2 | L:5’-GTGTGAGAAAGAAGGCAGGC-3’ R:5’-GTAGGTAGTGGCCACCCAGA-3’ |
| VHL | L:5’-CAGGAGACTGGACATCGTCA-3’ R:5’-TCCTCTTCCAGGTGCTGACT-3’ |
| EphrinA1 | L:5’-CCCACATTACGAGGACGACT-3’ R:5’-GTGAAGCGCTGGAATTTCTC-3’ |
| EphrinB2 | L:5’-AGGAATCACGGTCCAACAAG-3’ R:5’-GTCTCCTGCGGTACTTGAGC-3’ |
| eNOS | L:5’-GCAAGACCTCCTGAGGACAG-3’ R:5’-TGCAAAGAAAAGCTCTGGGT-3’ |
| Dll4 | L:5’-CAGAGACTTCGCCAGGAAAC-3’ R:5’-TCATTTTGCTCGTCTGTTCG-3’ |
Additional files
Download links
A two-part list of links to download the article, or parts of the article, in various formats.
Downloads (link to download the article as PDF)
Open citations (links to open the citations from this article in various online reference manager services)
Cite this article (links to download the citations from this article in formats compatible with various reference manager tools)
Islet vascularization is regulated by primary endothelial cilia via VEGF-A-dependent signaling
eLife 9:e56914.
https://doi.org/10.7554/eLife.56914


