miRNA profile is altered in a modified EAE mouse model of multiple sclerosis featuring cortical lesions
- CEA, Fundamental Research Division (DRF), Institute of Biology Francois Jacob, Molecular Imaging Research Center (MIRCen), France
- Bioanalysis and Pharmacology of Bioactive Lipids Research Group, Louvain Drug Research Institute, UCLouvain, Université catholique de Louvain, Belgium
- Department of Precision Medicine, School of Medicine & Surgery - University of Campania "Luigi Vanvitelli", Italy
- Department of Neurosciences, Reproductive and Odontostomatological Sciences, "Federico II" University of Naples, Italy
Figures
Figure 1 with 1 supplement
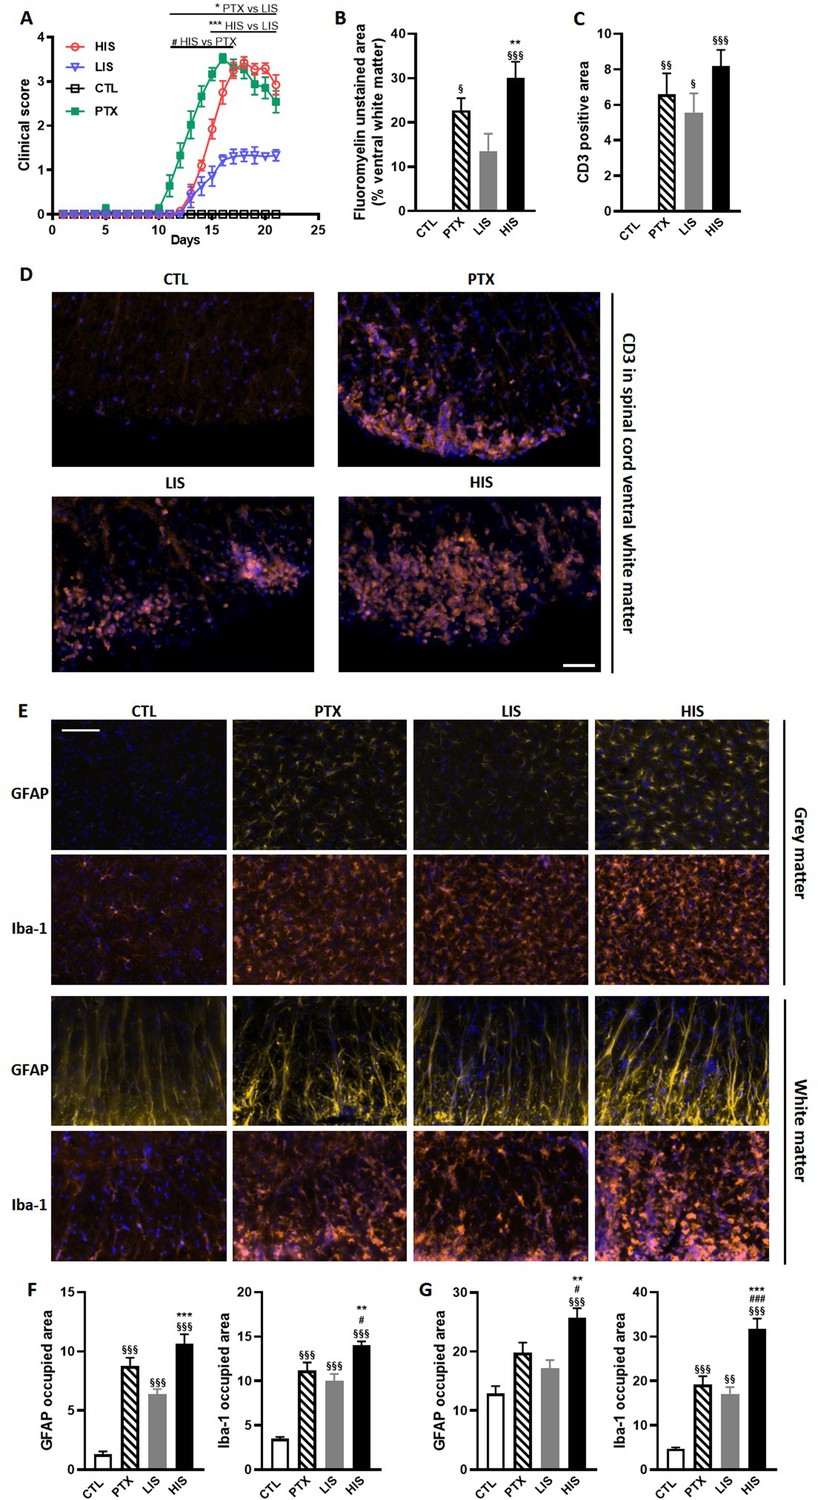
Clinical and immunohistological characterization of the EAE model with high and low clinical scores.
To induce EAE, mice received MOG35-55 and complete Freund’s adjuvant (CFA) with or without pertussis toxin (PTX). (A) Clinical score of EAE mice receiving PTX (PTX group) or no PTX and with a high clinical score (HIS) or low clinical score (LIS). (B) Quantification of fluoromyelin signal in the spinal cord ventral white matter. (C) Quantification of the CD3 positive area in the ventral white matter of the spinal cord. (D) Representative photomicrographs of CD3 positive cells (lymphocytes) infiltrating the spinal cord ventral white matter. The scale bar represents 50 µm. The quantification of the entire cohort is shown in (C). (E) Representative photomicrographs of GFAP positive cells (astrocytes) and Iba-1 positive cells (microglia, monocytes, macrophages) in the spinal cord grey and white matters of mice. The scale bar represents 50 µm. (F-G) Quantification of GFAP positive area and Iba-1 positive area in (F) the grey matter and in (G) the white matter of the spinal cord. The scale bar represents the indicated length. Data are mean ± sem. N = 7–12/group. For A, two-way ANOVA with Sidak’s post-hoc test. For B to F, one-way ANOVA with Sidak’s post-hoc test. §p≤0.05 §§p≤0.01 §§§p≤0.001 vs CTL, #p≤0.05 ### p≤0.001 vs PTX, *p≤0.05 **p≤0.01 ***p≤0.001 vs LIS.
Figure 1—figure supplement 1

Spinal cord lesions are more pronounced in mice with high clinical score (HIS) compared to mice with low clinical score (LIS).
(A) Clinical score of a mouse cohort showing EAE mice with high clinical score (HIS) or low clinical score (LIS) receiving an injection of cytokine (-C) at day 21 post-immunization. (B) Representative photomicrographs of LFB staining (with cresyl violet counterstaining) performed on the spinal cord of HIS-C and LIS-C mice. (C) Representative photomicrographs of MBP immunofluorescence in the spinal cord of HIS-C and LIS-C mice of the same cohort. N = 9/group. Data are mean ± sem. For A, two-way ANOVA with Sidak’s post-hoc test, vs LIS ***p≤0.001. For B, two-tailed t test, ***p≤0.001.
Figure 2 with 1 supplement
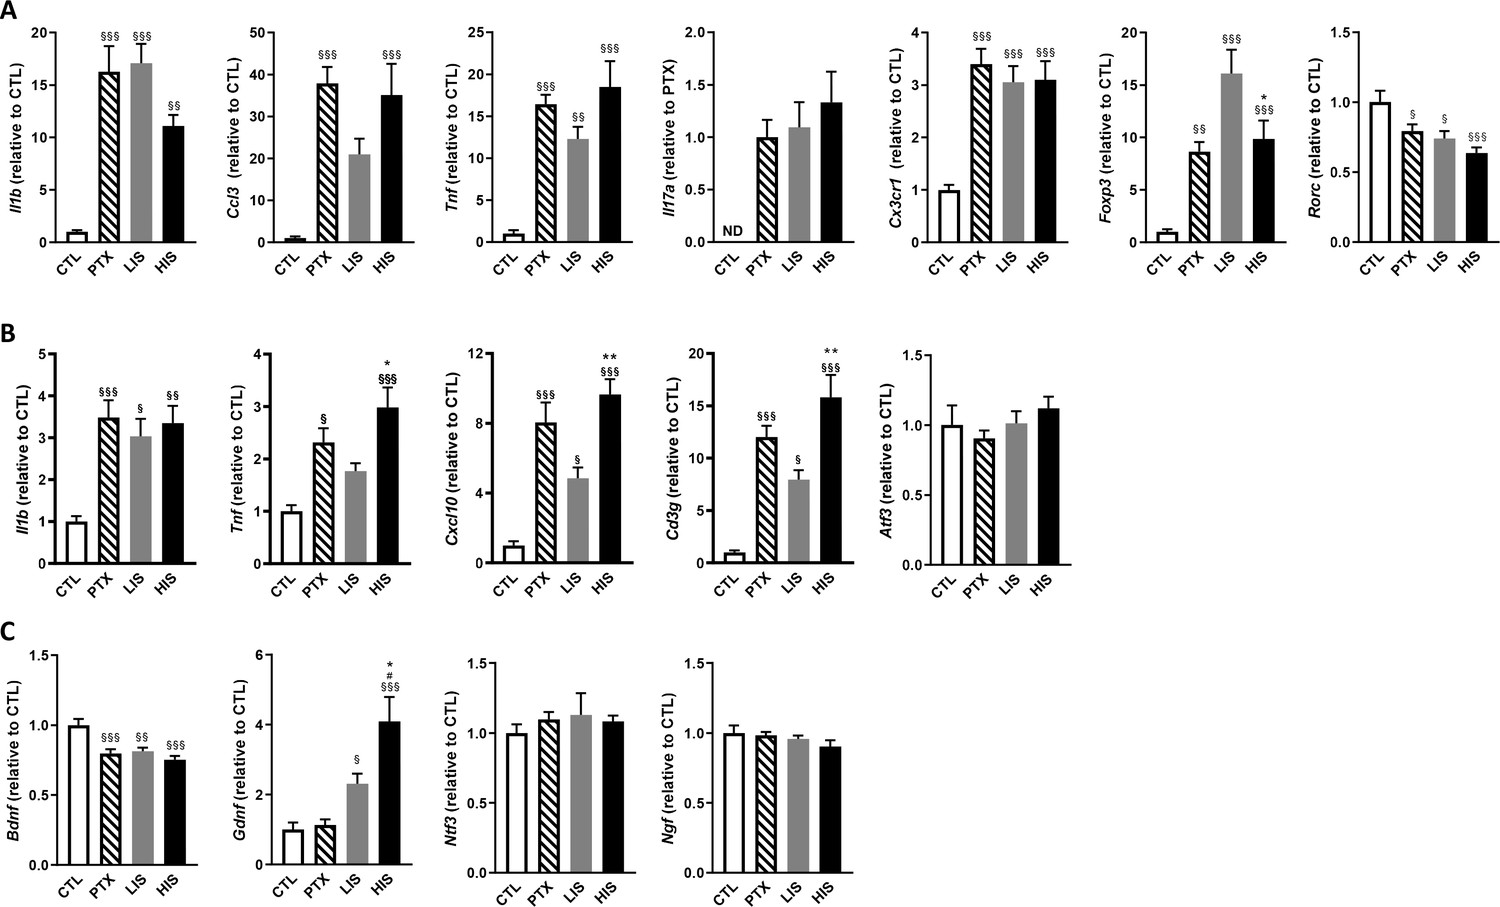
Characterization of inflammatory marker and growth factor expression in the EAE model with high and low clinical scores.
To induce EAE, mice received MOG35-55 and complete Freund’s adjuvant (CFA) with pertussis toxin (PTX) or without PTX (HIS and LIS groups). (A) mRNA expression of Il1b, Ccl3, Tnf, Il17a, Cx3cr1, Foxp3, and Rorc was assessed by RT-qPCR in the spinal cord. (B–C) mRNA expression of Il1b, Tnf, Cxcl10, Cd3g, Atf3, and (C) the neurotrophins Bdnf, Gdnf, Ngf, and Ntf3 was assessed by RT-qPCR in the cortex. Data are mean ± sem. The expression of the CTL group was set at 1, except for Il17a that was not detected in the control group (thus, the PTX group was set at 1). N = 7–12/group. One-way ANOVA with Sidak’s post-hoc test. §p≤0.05 §§p≤0.01 §§§p≤0.001 vs CTL, # p≤0.05 vs PTX, *p≤0.05, **p≤0.01 vs LIS.
Figure 2—figure supplement 1

Time-course evaluation of inflammatory plasma cytokines and chemokines.
Blood of mice treated with complete Freund’s adjuvant (CTL) in addition to MOG35-55 with PTX (PTX group) or without PTX (HIS and LIS groups) was harvested 7, 14, and 21 days post MOG35-55/CFA injection. Plasma cytokines and chemokines IL-1β, IL-6, IL-12(p40), IL-17, TNFα, IFNγ, MIP-1α, RANTES, KC and G-CSF were quantified using a Bio-Plex Multiplex kit. Data are mean ± sem. Two-way ANOVA with Dunnett’s post-hoc test. Statistical significance, if present, is shown in the table. *p≤0.05, ** *p≤0.01, *** *p≤0.001.
Figure 3
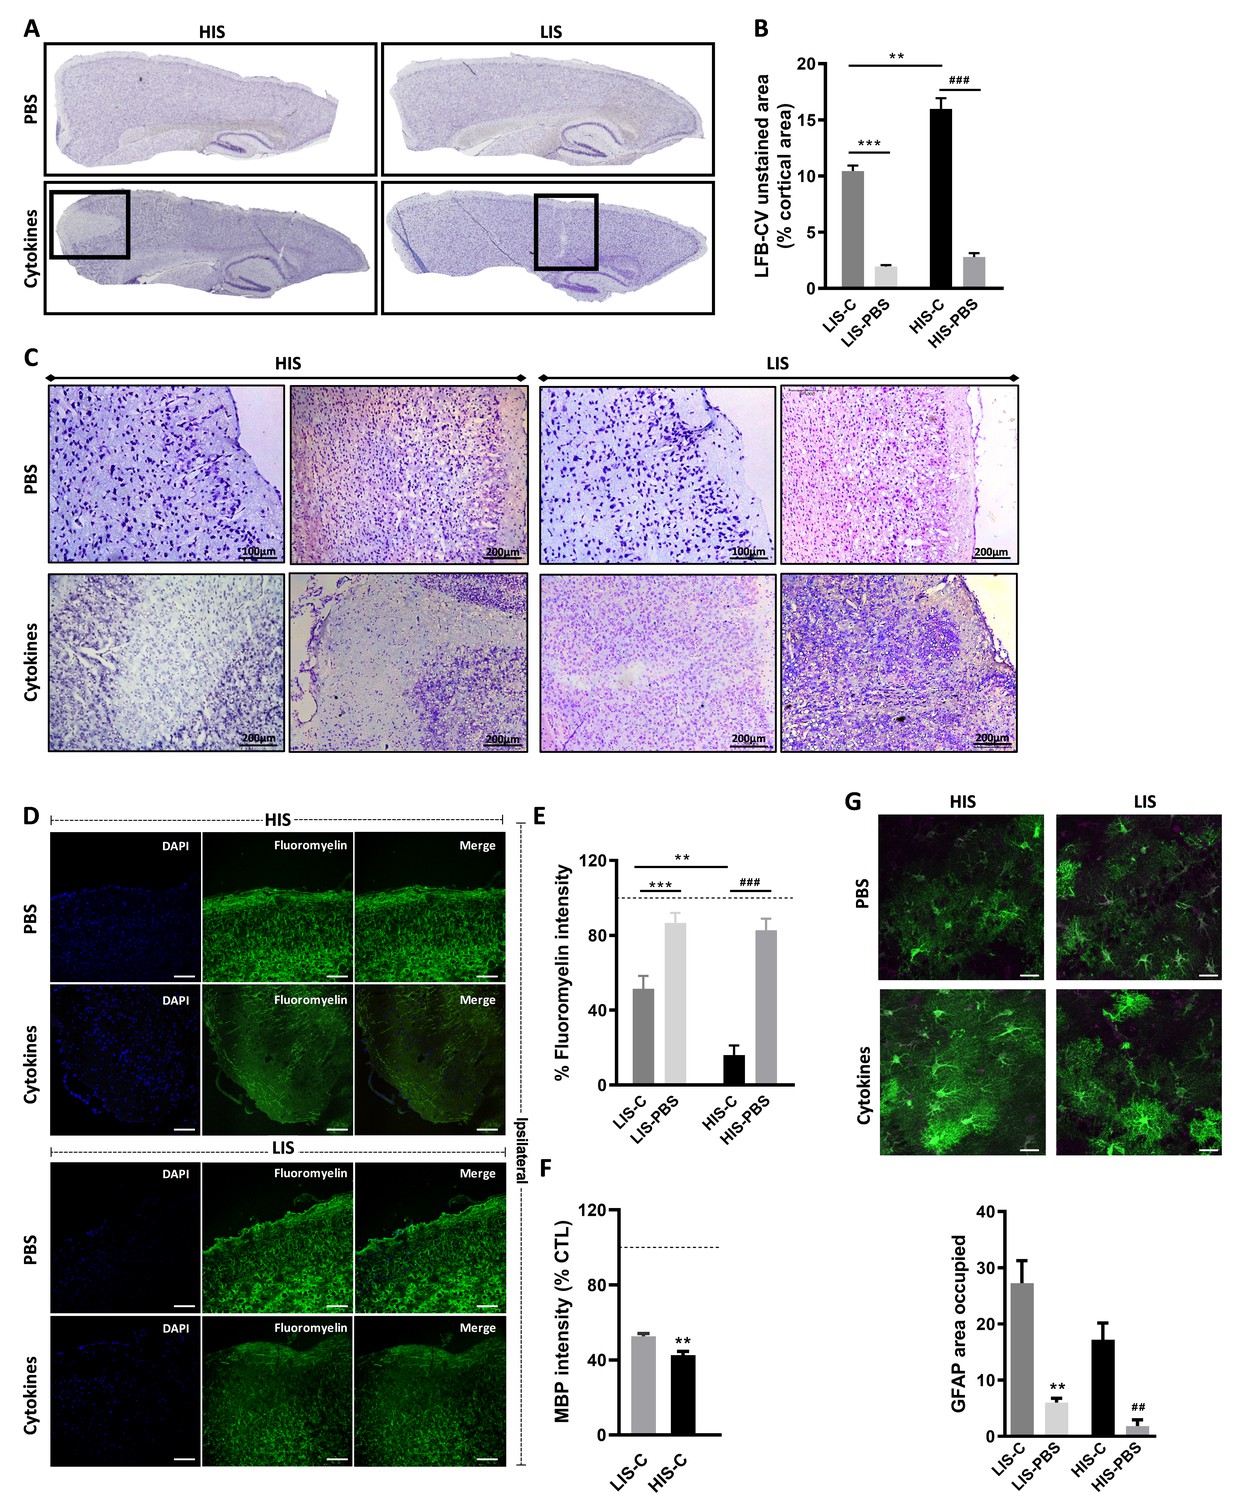
Cortical lesion extent depends on high and low clinical scores.
(A) Representative photomicrographs of cortices stained with luxol fast blue and counter-stained with cresyl violet (LFB-CV) and showing the presence of CLs. (B) Quantification of LFB-CV unstained area in mice cortices with a high clinical score (HIS) or low clinical score (LIS) receiving either an injection of the cytokine (-C) or of PBS. (C) Representative photomicrographs depicting close-ups of the ipsilateral cortex of HIS and LIS mice displayed in panel A. (D) Representative photomicrographs and (E) quantification of fluoromyelin green intensity in the ipsilateral cortex of HIS-C and LIS-C mice. (D) The scale bar represents 100 µm. (F) Quantification of MBP intensity in the ipsilateral cortex of HIS-C and LIS-C mice. The dotted line represents the intensity of (E) fluoromyelin or (F) MBP immunostaining measured in CTL mice and set at 100%. (G) Representative photomicrographs and quantification of GFAP immunofluorescence in the ipsilateral cortex of HIS and LIS mice. The scale bar represents 20 µm. HIS-C: high clinical score mice injected with the cytokine mixture; HIS-PBS: high clinical score mice injected with PBS; LIS-C: low clinical score mice injected with the cytokine mixture; LIS-PBS: low clinical score mice injected with PBS. Data are mean ± sem. For B, one-way ANOVA with Dunnett’s post-hoc test. For E and G, one-way ANOVA with Sidak’s post-hoc test, **p≤0.01, ***p≤0.001 vs LIS-C and ## p≤0.01, ### p≤0.001 vs HIS-C. For F, two-tailed t-test **p≤0.01.
Figure 4 with 2 supplements
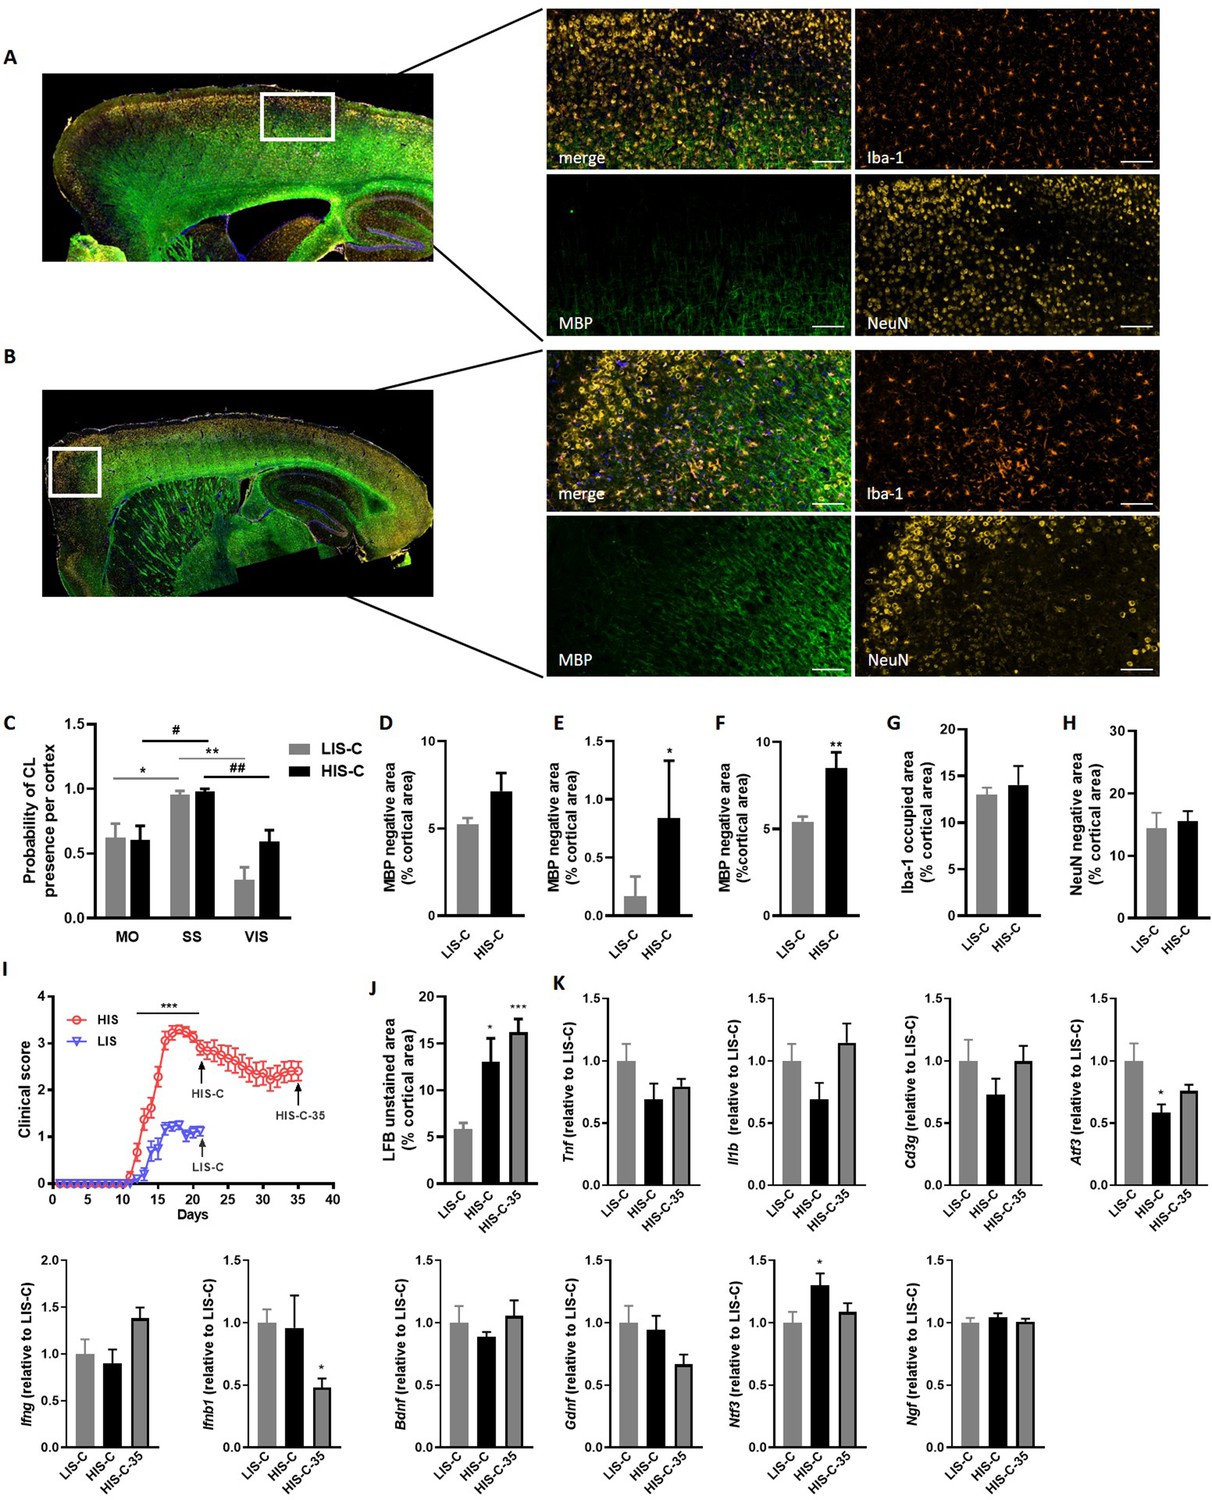
Cortical lesion distribution and extent differ between mice with a high clinical score (HIS-C) and with a low clinical score (LIS-C) after cytokine injection.
Representative photomicrographs and close-ups of the ipsilateral cortex of (A) LIS-C and (B) HIS-C mice immunostained with Iba-1, MBP, and NeuN. The scale bar represents 100 µm. (C) Quantification of the probability of CL presence in the motor cortex (MO), the somatosensory cortex (SS), and the visual cortex (VIS) in the ipsilateral cortex of LIS-C and HIS-C mice (0:never present, 1:always present). Quantification of (D) intracortical, (E) subpial, and (F) total CL size in the ipsilateral cortex of LIS-C and HIS-C mice. (G) Quantification of Iba-1 occupied area in the cortex of HIS-C and LIS-C mice. (H) Quantification of NeuN negative area in the ipsilateral cortex of HIS-C and LIS-C mice. (I) Clinical score for another cohort of EAE mice with HIS and LIS groups that received cytokine injection either at day 21 post-immunization (HIS-C and LIS-C) or at day 35 post-immunization (HIS-C-35). All mice were euthanized three days after cytokine injection. (J) Quantification of LFB unstained area in cortices for the mice in panel I. (K) mRNA expression of Tnf, Il1b, Cd3g, Atf3, Ifng, Ifnb1, Bdnf, Gdnf, Ntf3 and Ngf was measured by RT-qPCR in mice with low clinical score and injected with cytokines on day 21 (LIS-C), mice with high clinical score and injected with cytokines on day 21 (HIS-C), and in mice with high clinical score and injected with cytokines on day 35 (HIS-C-35). The expression of the LIS-C group was set at 1. Data are mean ± sem. N = 8–10/group. For C two-way ANOVA with Sidak’s post-hoc test, between cortical regions for LIS-C mice *p≤0.05, **p≤0.01; and for HIS-C mice #p≤0.05, ##p≤0.01. For D-H, two-tailed t-test *p≤0.05, **p≤0.01. For me, two-way ANOVA with Sidak’s post-hoc test, ***p≤0.001. For J-K, one-way ANOVA with Sidak’s post-hoc test *p≤0.05, ***p≤0.001 vs LIS-C.
Figure 4—figure supplement 1
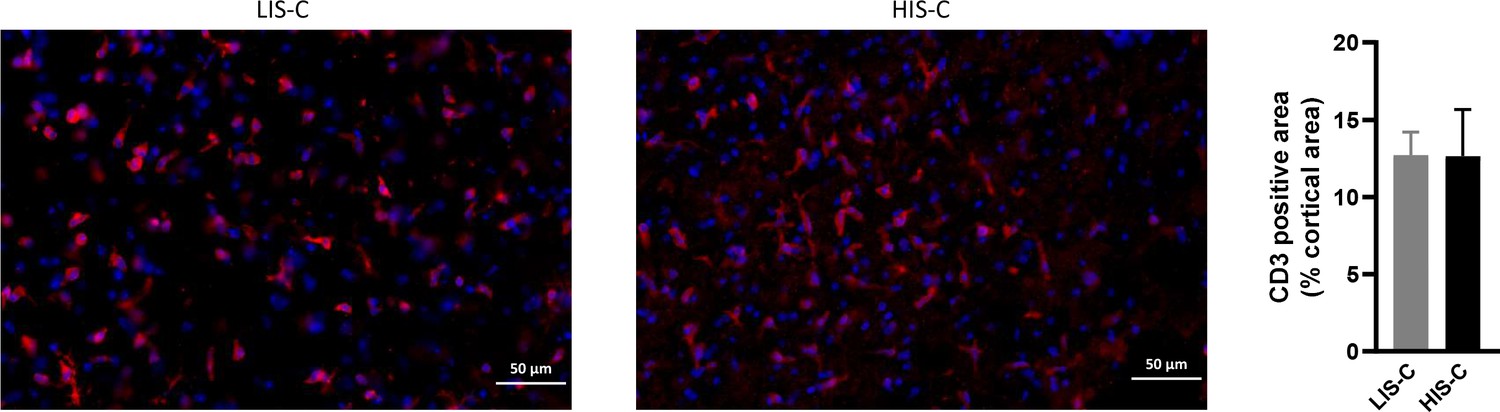
Lymphocyte infiltration and microglia activation are similar in mice with high clinical score (HIS-C) and with low clinical score (LIS-C) after cytokine injection.
Representative photomicrographs and quantification of CD3 positive area in the cortex of HIS-C (mice with high clinical score receiving a cytokine injection) and LIS-C (mice with low clinical score receiving a cytokine injection). The scale bar represents the indicated length. N = 8–10/group. Data are mean ± sem.
Figure 4—figure supplement 2
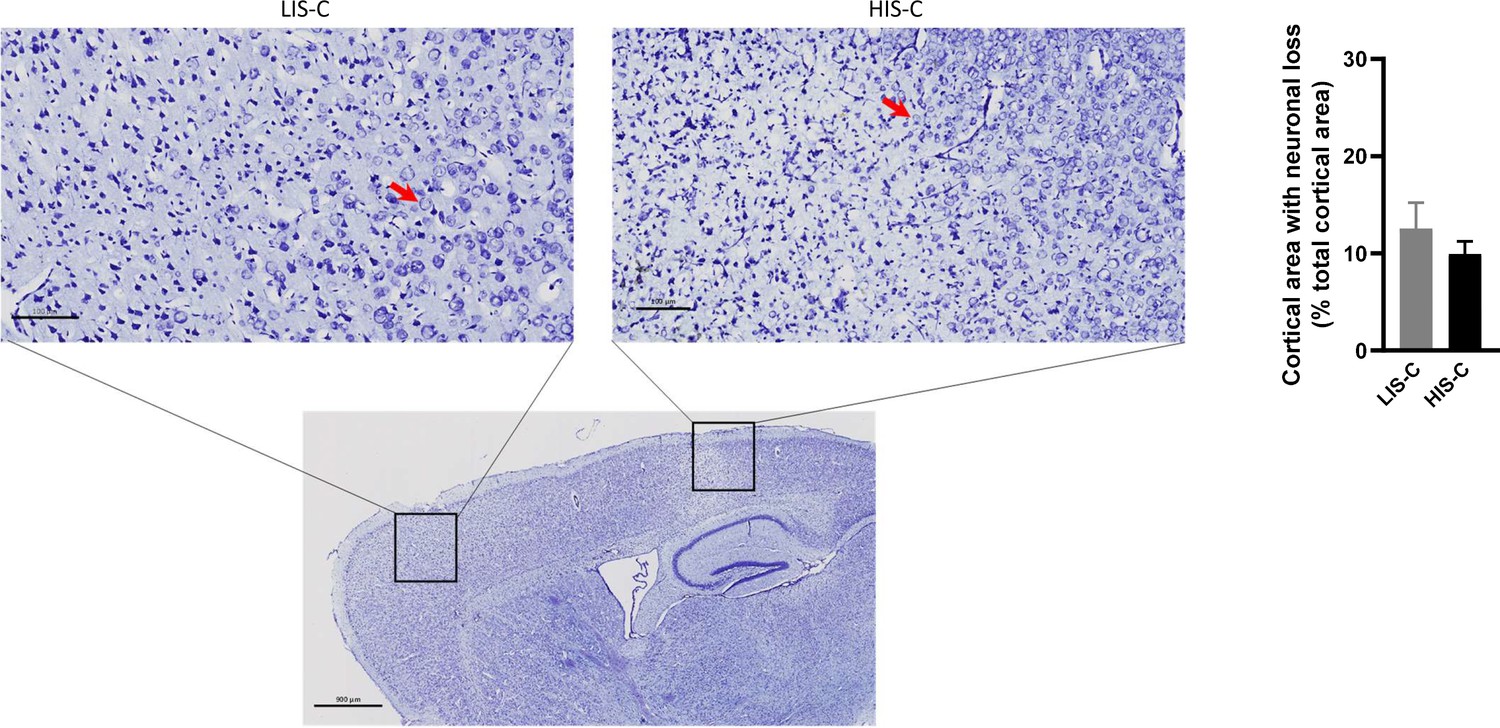
Neuronal loss evidenced by toluidine blue is similar in mice with high clinical score (HIS-C) and with low clinical score (LIS-C) after cytokine injection.
Representative photomicrograph, close-ups and quantification of the area with decreased neuron density assessed with toluidine blue in the ipsilateral cortex of HIS-C and LIS-C mice. The red arrows point to a neuron nucleus. (The scale bar represents the indicated length. N = 8–10/group. Data are mean ± sem.
Figure 5
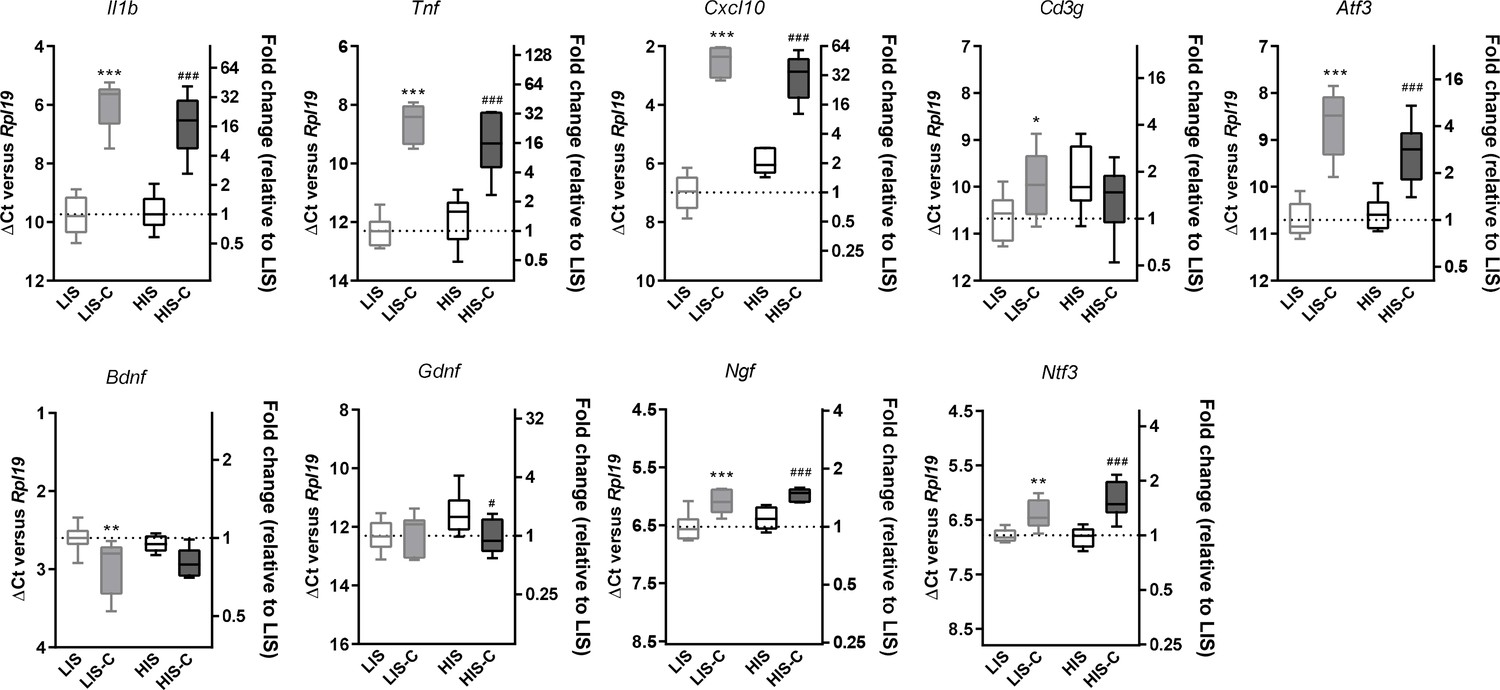
Alterations in mRNA expression in the ipsilateral cortex before and after cytokine injection.
mRNA expression of Il1b, Tnf, Cxcl10, Atf3, Cd3g, Bdnf, Gdnf, Ngf and Ntf3 measured by RT-qPCR in the ipsilateral cortex of mice with a low clinical score before (LIS) and after (LIS-C) cytokine injection and in mice with a high clinical score before (HIS) and after (HIS-C) cytokine injection. Data are plotted as ΔCt between the gene considered and the reference gene used (Rpl19) (left vertical axis) and as the fold-increase of the expression between LIS group (set at 1) and the three remaining groups (right vertical axis). The smaller the ΔCt between the gene considered and Rpl19, the more the gene is expressed, and conversely, the bigger the ΔCt the less the gene is expressed. Data are box (median) and whiskers (min to max). One-way ANOVA, *p≤0.05, **p≤0.01, ***p≤0.001 vs LIS, #p≤0.05, ###p≤0.001 vs HIS.
Figure 6
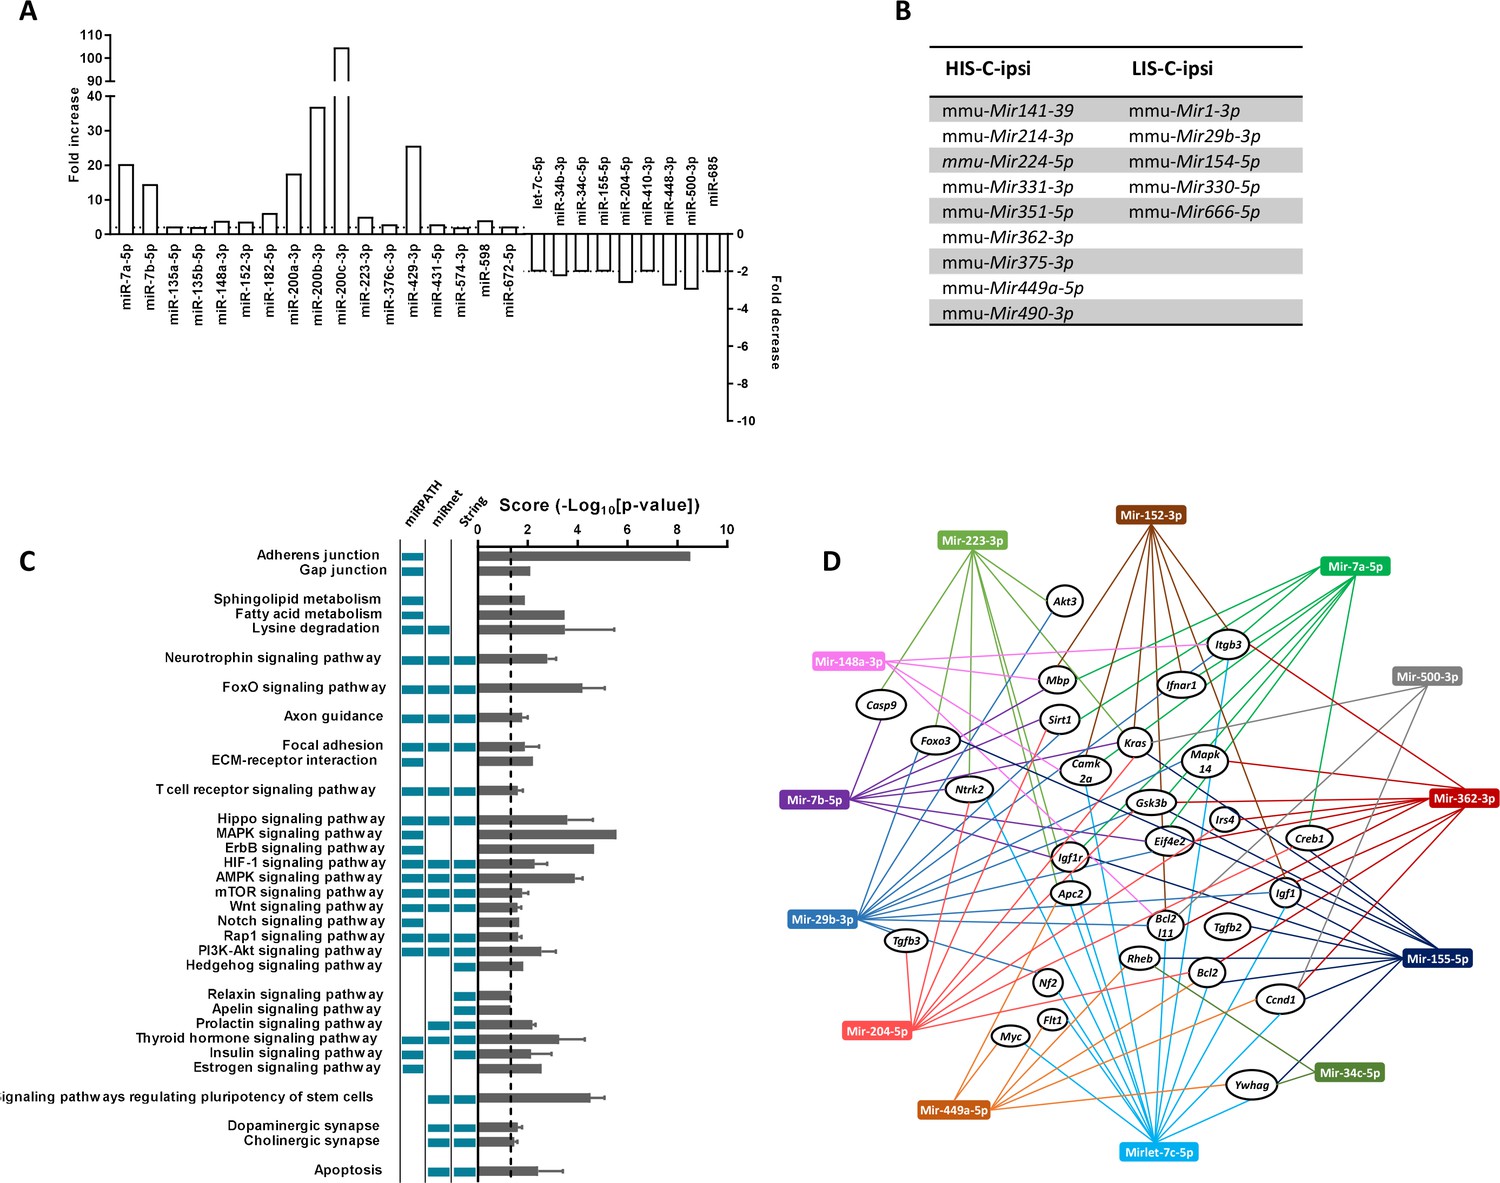
miRNA profiling and corresponding prediction of signaling pathway alterations in LIS-C and HIS-C mice.
miRNA profile was assessed using TaqMan Microfluidic Array Cards Type A in control mice and HIS or LIS mice receiving a stereotactic injection of cytokines. (A) Variations of miRNAs at the injection site of EAE mice with high clinical score receiving cytokine injection (HIS-C-ipsi) compared to the injection site of EAE mice with low clinical score receiving cytokine injection (LIS-C-ipsi). Two-fold change for upregulation (plotted on the left y-axis) and downregulation (plotted on the right y-axis) are indicated by the dotted lines. Complete miRNA variations between the HIS-C and LIS-C groups are found in Supplementary file 3. (B) miRNAs expressed in HIS-C-ipsi but not in LIS-C-ipsi and inversely. (C) Predicted functional analysis of the top enriched canonical pathways associated with the target genes related to the miRNAs dysregulated in HIS-C-ipsi vs LIS-C-ipsi and found either in HIS-C-ipsi or LIS-C-ipsi. Indicated pathways were found by performing the Kyoto Encyclopedia of Genes and Genomes analysis by miRNet, mirPath, or Cytoscape String app databases. The pathways retrieved by specific databases are indicated by the colored boxes to the left of the graph (unchecked boxes represent pathways not found in the labeled database). The results are expressed as mean ± sem of -log10 adjusted p-value between the three databases; the dotted line designates the threshold of 1.3 (representing p-value at 0.05). (D) Schematic network representation of interactions between the 13 miRNAs that were mostly found in the pathways represented in C (only the pathways found in all three databases) and controlling the most genes and a panel of the targeted genes found in at least two databases.
Figure 7
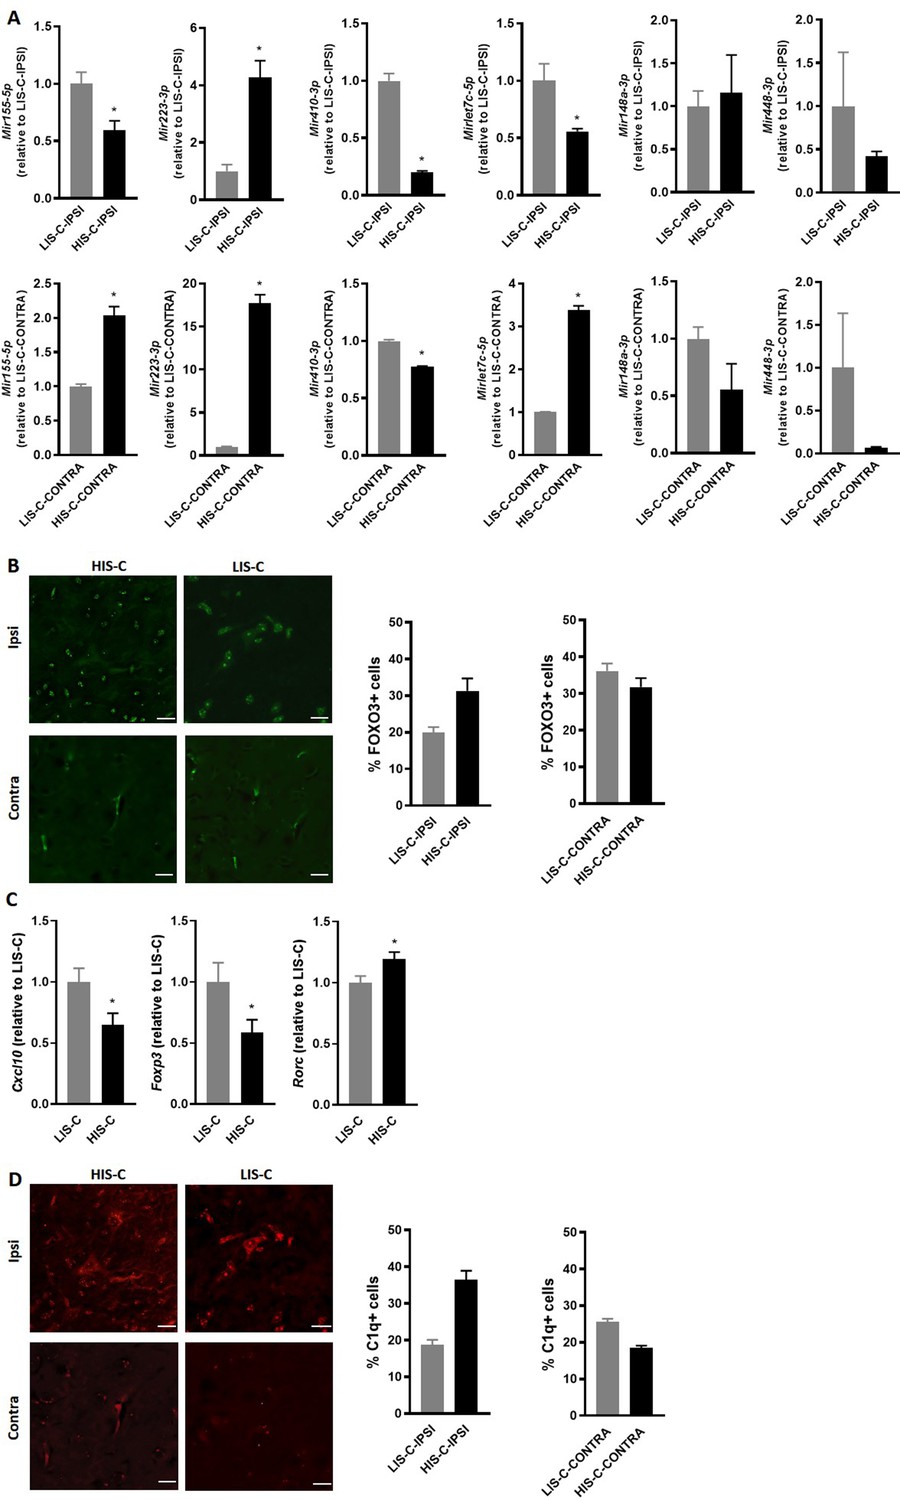
Alterations in miRNA levels are associated with variations of their regulator and targets.
(A) Mir155-5p, Mir223-3p, Mir410-3p, Mirlet7c-5p, Mir148a-3p and Mir448 expression was measured by RT-qPCR in the injection site and the corresponding contralateral structure of mice receiving cytokine injection with a high clinical score (HIS-C) and low clinical score (LIS-C). U6 was used as a reference. LIS-C ipsilateral (upper panels) or LIS-C contralateral (lower panels) levels were set at 1. N = 4–5/group. Data are presented as mean ± sem. *p≤0.05. (B) Representative confocal photomicrographs and quantification of FOXO3 (green) in HIS-C and LIS-C groups for both ipsilateral and contralateral sides of the cortex detected by immunofluorescence N = 2/group. (C) mRNA expression of Cxcl10, Foxp3, and Rorc was assessed by RT-qPCR in the ipsilateral cortex of HIS-C and LIS-C groups. (D) Representative confocal photomicrographs and quantification of C1q (red) in HIS-C and LIS-C groups for both ipsilateral and contralateral sides of the cortex detected by immunofluorescence N = 2/group. N = 9/group. Data are mean ± sem. The expression of the LIS-C group was set at 1. Two-tailed t-test, *p≤0.05.
Tables
Key resources table
| Reagent type (species) or resource | Designation | Source or reference | Identifiers | Additional information |
|---|---|---|---|---|
| Strain, strain background (female mice) | Mus musculus, female, C57BL/6JRj | Janvier Labs | SC-C57J-F | |
| Antibody | anti-mouse MBP (Chicken polyclonal) | Abcam | Ab123499 | (1:1000) |
| Antibody | anti-mouse FOXO3 (rabbit polyclonal) | Abcam | Ab177487 | (1:300) |
| Antibody | anti-mouse C1q (Mouse monoclonal) | Abcam | Ab71940 | (1:100) |
| Antibody | anti-GFAP (Rabbit polyclonal) | Dako | Z0334 | (1:1000) |
| Antibody | anti-mouse Iba-1 (rabbit polyclonal) | Wako | 019–19741 | (1:500) |
| Antibody | anti-mouse CD3 (rabbit polyclonal) | Dako | A0452 | (1:300) |
| Antibody | anti-NeuN (mouse monoclonal) | Millipore | MAB377 | (1:500) |
| Sequence-based reagent | ATF3-F | This paper | PCR primers | CGCCATCCAGAATAAACACC |
| Sequence-based reagent | ATF3-R | This paper | PCR primers | CCTTCAGCTCAGCATTCACA |
| Sequence-based reagent | BDNF-F | This paper | PCR primers | GGTCACAGCGGCAGATAAA |
| Sequence-based reagent | BDNF-R | This paper | PCR primers | TGGGATTACACTTGGTCTCGT |
| Sequence-based reagent | CD3-F | This paper | PCR primers | CCAGTCAAGAGCTTCAGACAA |
| Sequence-based reagent | CD3-R | This paper | PCR primers | GAGTCCTGCTGAGTTCACTTC |
| Sequence-based reagent | CX3CR1-F | This paper | PCR primers | AGTTCCCTTCCCATCTGCTC |
| Sequence-based reagent | CX3CR1-R | This paper | PCR primers | CACAATGTCGCCCAAATAAC |
| Sequence-based reagent | CXCL10-F | This paper | PCR primers | AGCCAAAAAAGGTCTAAAAGGG |
| Sequence-based reagent | CXCL10-R | This paper | PCR primers | CTAGCCATCCACTGGGTAAAG |
| Sequence-based reagent | DCX-F | This paper | PCR primers | GTCACCTGTCTCCATGATTTC |
| Sequence-based reagent | DCX-R | This paper | PCR primers | GACTCTGCATTCATTCTCATCC |
| Sequence-based reagent | GDNF-F | This paper | PCR primers | GTGACTCCAATATGCCTGAAGA |
| Sequence-based reagent | GDNF-R | This paper | PCR primers | GCCGCTTGTTTATCTGGTGA |
| Sequence-based reagent | IFNβ-F | This paper | PCR primers | GTGGGAGATGTCCTCAACTG |
| Sequence-based reagent | IFNβ-R | This paper | PCR primers | AGGCGTAGCTGTTGTACTTC |
| Sequence-based reagent | IFNγ-F | This paper | PCR primers | GTTTGAGGTCAACAACCCACAG |
| Sequence-based reagent | IFNγ-R | This paper | PCR primers | GCTTCCTGAGGCTGGATTC |
| Sequence-based reagent | IL-1β-F | This paper | PCR primers | TCGCTCAGGGTCACAAGAAA |
| Sequence-based reagent | IL-1β-R | This paper | PCR primers | CATCAGAGGCAAGGAGGAAAAC |
| Sequence-based reagent | IL-17-F | This paper | PCR primers | GACTACCTCAACCGTTCCAC |
| Sequence-based reagent | IL-17-R | This paper | PCR primers | CACTGAGCTTCCCAGATCAC |
| Sequence-based reagent | FoxP3-F | This paper | PCR primers | GTTCCTTCCCAGAGTTCTTCC |
| Sequence-based reagent | FoxP3-R | This paper | PCR primers | CATCGGATAAGGGTGGCATAG |
| Sequence-based reagent | MIP-1α -F | This paper | PCR primers | AGATTCCACGCCAATTCATC |
| Sequence-based reagent | MIP-1α -R | This paper | PCR primers | CTCAAGCCCCTGCTCTACAC |
| Sequence-based reagent | NGF-F | This paper | PCR primers | ATGCTGGACCCAAGCTCAC |
| Sequence-based reagent | NGF-R | This paper | PCR primers | CTGCCTGTACGCCGATCAAA |
| Sequence-based reagent | NT3-F | This paper | PCR primers | TCACCACGGAGGAAACGCTA |
| Sequence-based reagent | NT3-R | This paper | PCR primers | GTCACCCACAGGCTCTCACT |
| Sequence-based reagent | RORγ -F | This paper | PCR primers | GGATGAGATTGCCCTCTACAC |
| Sequence-based reagent | RORγ -R | This paper | PCR primers | CAGATGTTCCACTCTCCTCTTC |
| Sequence-based reagent | RPL19-F | This paper | PCR primers | GAAGGTCAAAGGGAATGTGTTCA |
| Sequence-based reagent | RPL19-R | This paper | PCR primers | CCTTGTCTGCCTTCAGCTTGT |
| Sequence-based reagent | TNF-α-F | This paper | PCR primers | CTACTGAACTTCGGGGTGATC |
| Sequence-based reagent | TNF-α-R | This paper | PCR primers | TGAGTGTGAGGGTCTGGGC |
| Sequence-based reagent | TRAF3-F | This paper | PCR primers | CAAAGACAAGGTGTTTAAGGATAA |
| Sequence-based reagent | TRAF3-R | This paper | PCR primers | GCCTTCATTCCGACAGTAG |
| Sequence-based reagent | Trail -F | This paper | PCR primers | TTTAATTCCAATCTCCAAGGATG |
| Sequence-based reagent | Trail -R | This paper | PCR primers | GATGACCAGCTCTCCATTC |
| Peptide, recombinant protein | MOG35-55 | Hooke laboratories | EK-2110 | The peptide used is prepared as emulsion in CFA and provided as reference EK-2110 by Hooke laboratories. |
| Peptide, recombinant protein | TNFα | PeproTech | 315-01A | 250 ng/2 µL |
| Peptide, recombinant protein | IFNγ | PeproTech | 315–05 | 100U/2 µL |
| Commercial assay or kit | GoScript Reverse Transcription kit | Promega | A2791 | |
| Commercial assay or kit | GoTaq qPCR Master Mix | Promega | A6002 | |
| Commercial assay or kit | Bio-Plex Pro(tm) Mouse Cytokine IL-1beta | Biorad | 171G5002M | |
| Commercial assay or kit | Bio-Plex Pro(tm) Mouse Cytokine IL-6 | Biorad | 171G5007M | |
| Commercial assay or kit | Bio-Plex Pro(tm) Mouse Cytokine IL-12p40 | Biorad | 171G5010M | |
| Commercial assay or kit | Bio-Plex Pro(tm) Mouse Cytokine IL-17A | Biorad | 171G5013M | |
| Commercial assay or kit | Bio-Plex Pro(tm) Mouse Cytokine G-CSF | Biorad | 171G5015M | |
| Commercial assay or kit | Bio-Plex Pro(tm) Mouse Cytokine IFNγ | Biorad | 171G5017M | |
| Commercial assay or kit | Bio-Plex Pro(tm) Mouse Cytokine KC | Biorad | 71G5018M | |
| Commercial assay or kit | Bio-Plex Pro(tm) Mouse Cytokine MIP-1alpha | Biorad | 171G5020M | |
| Commercial assay or kit | Bio-Plex Pro(tm) Mouse Cytokine RANTES | Biorad | 171G5022M | |
| Commercial assay or kit | Bio-Plex Pro(tm) Mouse Cytokine TNF-alpha | Biorad | 171G5023M | |
| Other | MOG in CFA emulsion | Hooke laboratories | EK-2110 | The MOG35-55 peptide is prepared as an emulsion in CFA and provided as reference EK-2110 by Hooke laboratories. |
| Other | ‘Control’ emulsion | Hooke laboratories | CK-2110 | This is the control emulsion without immunizing peptide |
| Other | Fluoromyelin Green | Invitrogen | F34651 | (1:300) |
| Other | Luxol Fast Blue | Sigma | S3382 |
Table 1
Primer sequences.
| Gene | Product | Forward primer (5’ to 3’) | Reverse primer (5’ to 3’) |
|---|---|---|---|
| Atf3 | ATF3 | CGCCATCCAGAATAAACACC | CCTTCAGCTCAGCATTCACA |
| Bdnf | BDNF | GGTCACAGCGGCAGATAAA | TGGGATTACACTTGGTCTCGT |
| Cd3g | CD3 | CCAGTCAAGAGCTTCAGACAA | GAGTCCTGCTGAGTTCACTTC |
| Cx3cr1 | CX3CR1 | AGTTCCCTTCCCATCTGCTC | CACAATGTCGCCCAAATAAC |
| Cxcl10 | CXCL10 | AGCCAAAAAAGGTCTAAAAGGG | CTAGCCATCCACTGGGTAAAG |
| Dcx | DCX | GTCACCTGTCTCCATGATTTC | GACTCTGCATTCATTCTCATCC |
| Gdnf | GDNF | GTGACTCCAATATGCCTGAAGA | GCCGCTTGTTTATCTGGTGA |
| Ifnb1 | IFNβ | GTGGGAGATGTCCTCAACTG | AGGCGTAGCTGTTGTACTTC |
| Ifng | IFNγ | GTTTGAGGTCAACAACCCACAG | GCTTCCTGAGGCTGGATTC |
| Il1b | IL-1β | TCGCTCAGGGTCACAAGAAA | CATCAGAGGCAAGGAGGAAAAC |
| Il17a | IL-17 | GACTACCTCAACCGTTCCAC | CACTGAGCTTCCCAGATCAC |
| Foxp3 | FoxP3 | GTTCCTTCCCAGAGTTCTTCC | CATCGGATAAGGGTGGCATAG |
| Ccl3 | MIP-1α | AGATTCCACGCCAATTCATC | CTCAAGCCCCTGCTCTACAC |
| Ngf | NGF | ATGCTGGACCCAAGCTCAC | CTGCCTGTACGCCGATCAAA |
| Ntf3 | NT3 | TCACCACGGAGGAAACGCTA | GTCACCCACAGGCTCTCACT |
| Rorc | RORγ | GGATGAGATTGCCCTCTACAC | CAGATGTTCCACTCTCCTCTTC |
| Rpl19 | RPL19 | GAAGGTCAAAGGGAATGTGTTCA | CCTTGTCTGCCTTCAGCTTGT |
| Tnf | TNF-α | CTACTGAACTTCGGGGTGATC | TGAGTGTGAGGGTCTGGGC |
| Traf3 | TRAF3 | CAAAGACAAGGTGTTTAAGGATAA | GCCTTCATTCCGACAGTAG |
| Tnfsf10 | Trail | TTTAATTCCAATCTCCAAGGATG | GATGACCAGCTCTCCATTC |
Additional files
-
Source data 1
miRNA expression (raw data) used for Supplementary files 1, 2, 3.
- https://cdn.elifesciences.org/articles/56916/elife-56916-data1-v2.xlsx
-
Supplementary file 1
Supplementary Table S1 : List of the miRNA expressed in the different conditions studied.
- https://cdn.elifesciences.org/articles/56916/elife-56916-supp1-v2.xlsx
-
Supplementary file 2
Supplementary Table S2: Changes in miRNA expression relative to the control.
- https://cdn.elifesciences.org/articles/56916/elife-56916-supp2-v2.xlsx
-
Supplementary file 3
Supplementary Table S3: miRNA expression in the HIS group relative to the LIS group.
- https://cdn.elifesciences.org/articles/56916/elife-56916-supp3-v2.xlsx
-
Transparent reporting form
- https://cdn.elifesciences.org/articles/56916/elife-56916-transrepform-v2.docx
Download links
A two-part list of links to download the article, or parts of the article, in various formats.
Downloads (link to download the article as PDF)
Open citations (links to open the citations from this article in various online reference manager services)
Cite this article (links to download the citations from this article in formats compatible with various reference manager tools)
miRNA profile is altered in a modified EAE mouse model of multiple sclerosis featuring cortical lesions
eLife 9:e56916.
https://doi.org/10.7554/eLife.56916


