Empathic pain evoked by sensory and emotional-communicative cues share common and process-specific neural representations
- Clinical Hospital of Chengdu Brain Science Institute, MOE Key Laboratory for Neuroinformation, University of Electronic Science and Technology of China, China
- Department of Psychological and Brain Sciences, Dartmouth College, United States
Figures
Figure 1
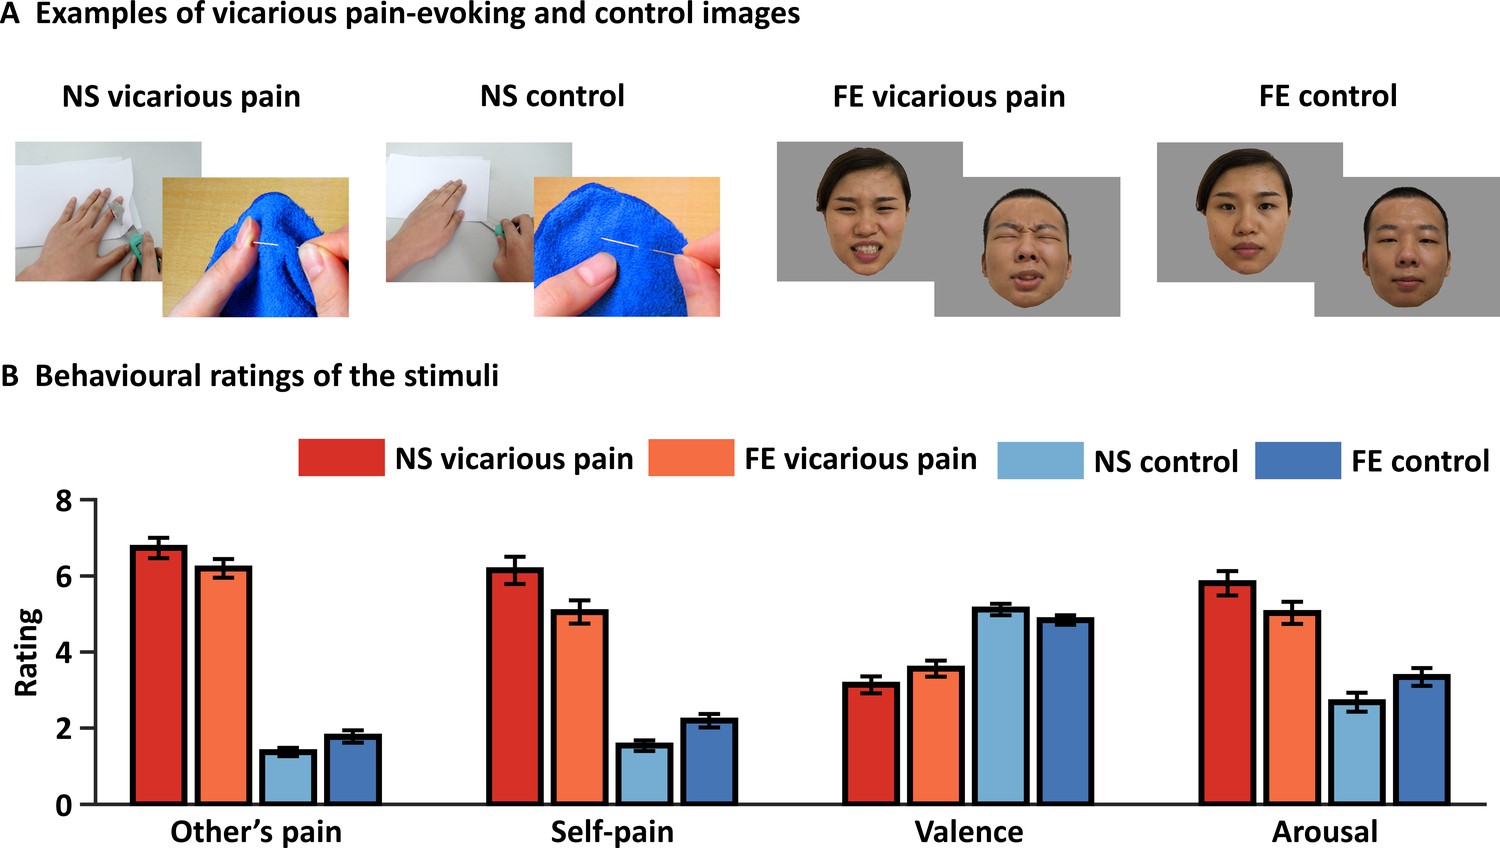
Examples and behavioral ratings of the experimental stimuli.
(A) Examples of stimuli for NS and FE vicarious pain as well as corresponding non-painful control stimuli. Of note, examples of the facial expressions (FE) were not included in the original stimulus set and written consent was obtained from the two volunteers. (B) Behavioral ratings of the stimuli from an independent sample (n = 38). Error bars represent standard errors of the mean. ‘Other’s pain’ indicates ‘how much pain do you think the person in the photo is feeling’, ‘self-pain’ indicates ‘how much pain do you experience when watching the picture’. All ratings were assessed by nine-point Likert scales ranging from ‘1 = not painful at all or very negative or very low arousing’ to ‘9 = extremely painful or very positive or very high arousing’. NS vicarious pain, observation of noxious stimulation of body limbs induced vicarious pain; FE vicarious pain, observation of facial expressions of pain induced vicarious pain; NS control stimuli depict body limbs in similar but innocuous situations, FE control stimuli show neutral facial expressions.
Figure 2
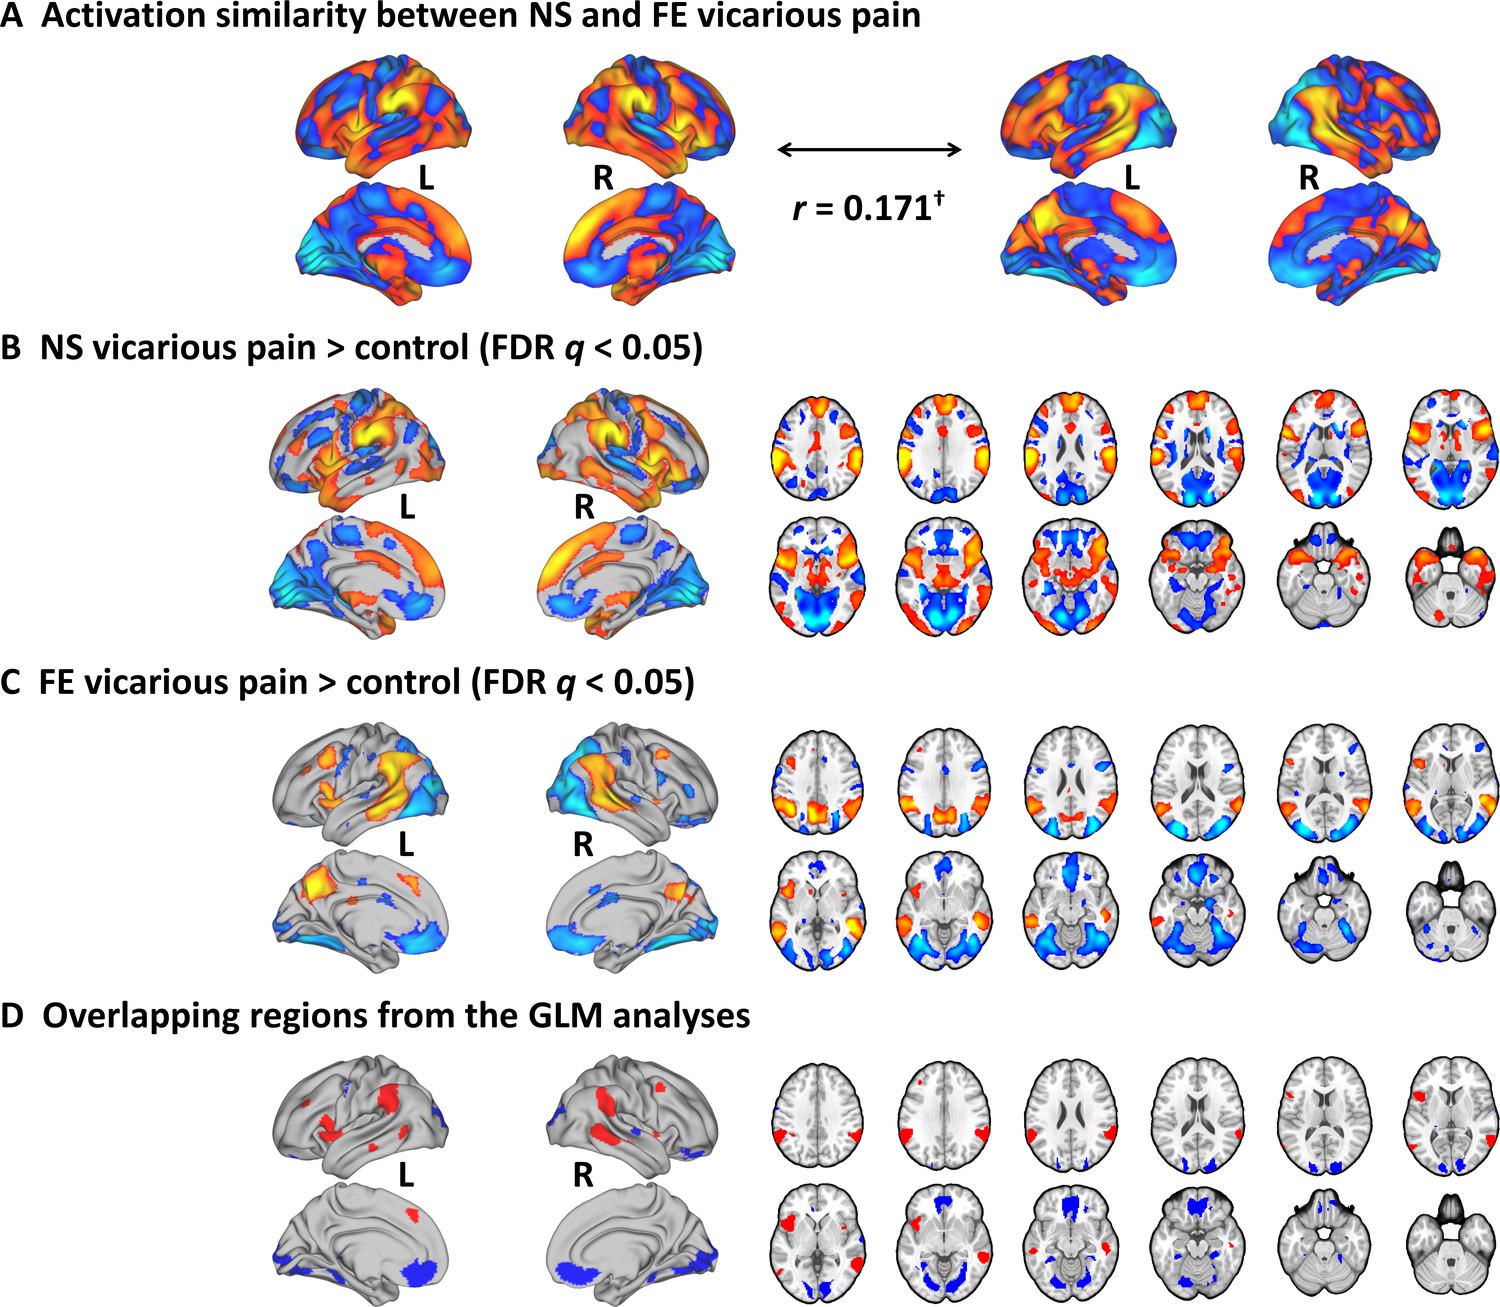
Results from the conventional univariate analyses.
(A) The NS vicarious pain activation pattern was spatially correlated with the FE vicarious pain pattern. (B) Results from the conventional univariate analysis comparing NS vicarious pain with the NS control stimuli thresholded at FDR q < 0.05 (two-tailed). (C) Results from the univariate analysis comparing FE vicarious pain with the FE control stimuli thresholded at FDR q < 0.05 (two-tailed). (D) Overlapping activation between NE and FE vicarious pain as determined by the conventional univariate approach. †p<0.1. NS vicarious pain, observation of noxious stimulation of body limbs induced vicarious pain; FE vicarious pain, observation of facial expressions of pain induced pain; NS control stimuli depict limbs in similar but innocuous situations, FE control stimuli show neutral facial expressions.
Figure 3
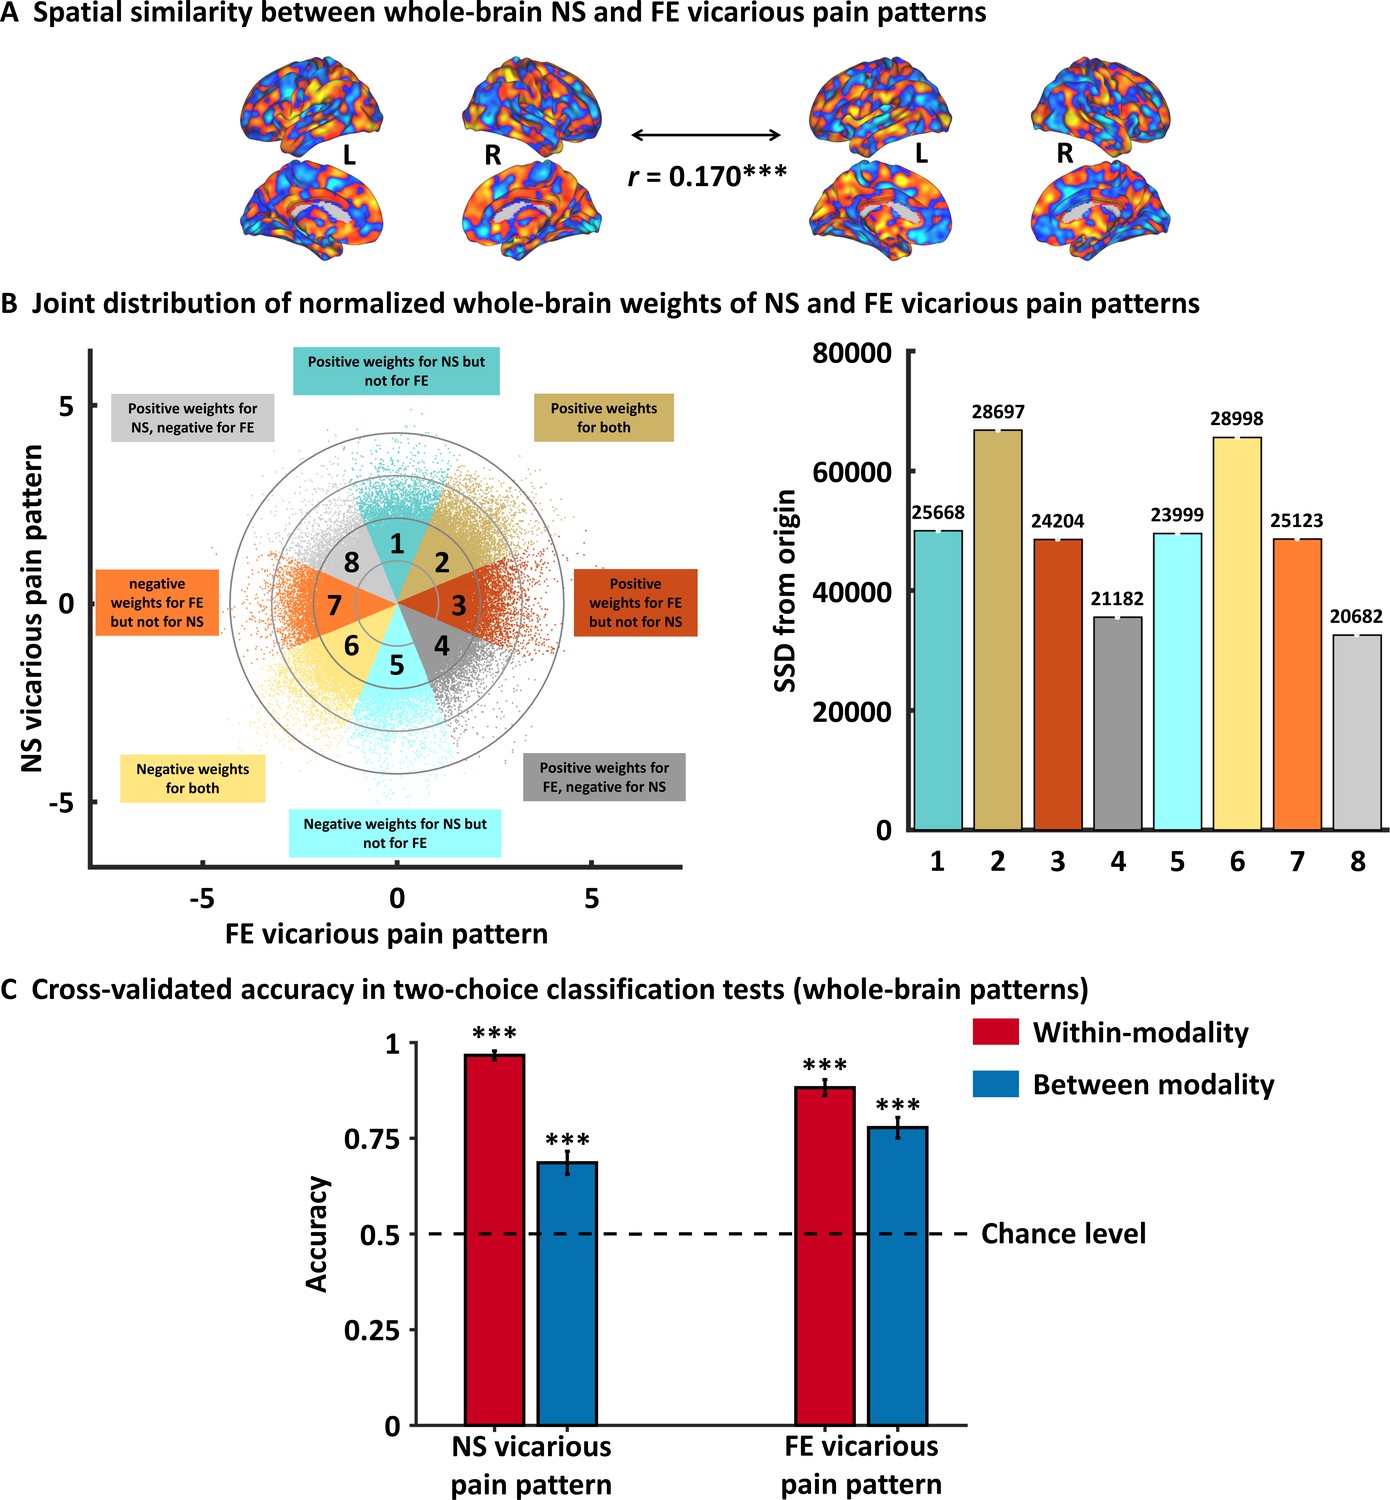
Results from the whole-brain multivariate pattern analyses.
(A) The NS vicarious pain-predictive pattern was spatially correlated with the FE vicarious pain-predictive pattern. (B) Scatter plot displaying normalized voxel weights for NS (y-axis) and FE (x-axis) vicarious pain-predictive patterns. Bars on the right represent the sum of squared distances from the origin (0,0) for each Octant. Different colors are assigned to the eight Octants that reflect voxels of shared positive or shared negative weights (Octants 2 and 6, respectively), selectively positive weights for the NS (Octant 1) or for FE (Octant 3) vicarious pain patterns, selectively negative weights for the NS (Octant 5) or FE (Octant 7) vicarious pain patterns, and voxels with opposite weights for the two neural signatures (Octants 4 and 8). The numbers on the top of each bar indicate the voxel counts for each Octant. (C) Cross-validation accuracy as determined by two-alternative forced-choice classification tests based on the whole-brain patterns. The results demonstrated significant within- and between- modality classifications for both NS and FE vicarious pain-predictive patterns. The dashed line indicates the chance level (50%), and the error bars represent the standard error of the mean across subjects. ***p < 0.001. SSD, sum of squared distances. Error bar indicates standard error. NS vicarious pain, observation of noxious stimulation of body limbs induced vicarious pain; FE vicarious pain, observation of facial expressions of pain induced pain.
Figure 4 with 1 supplement
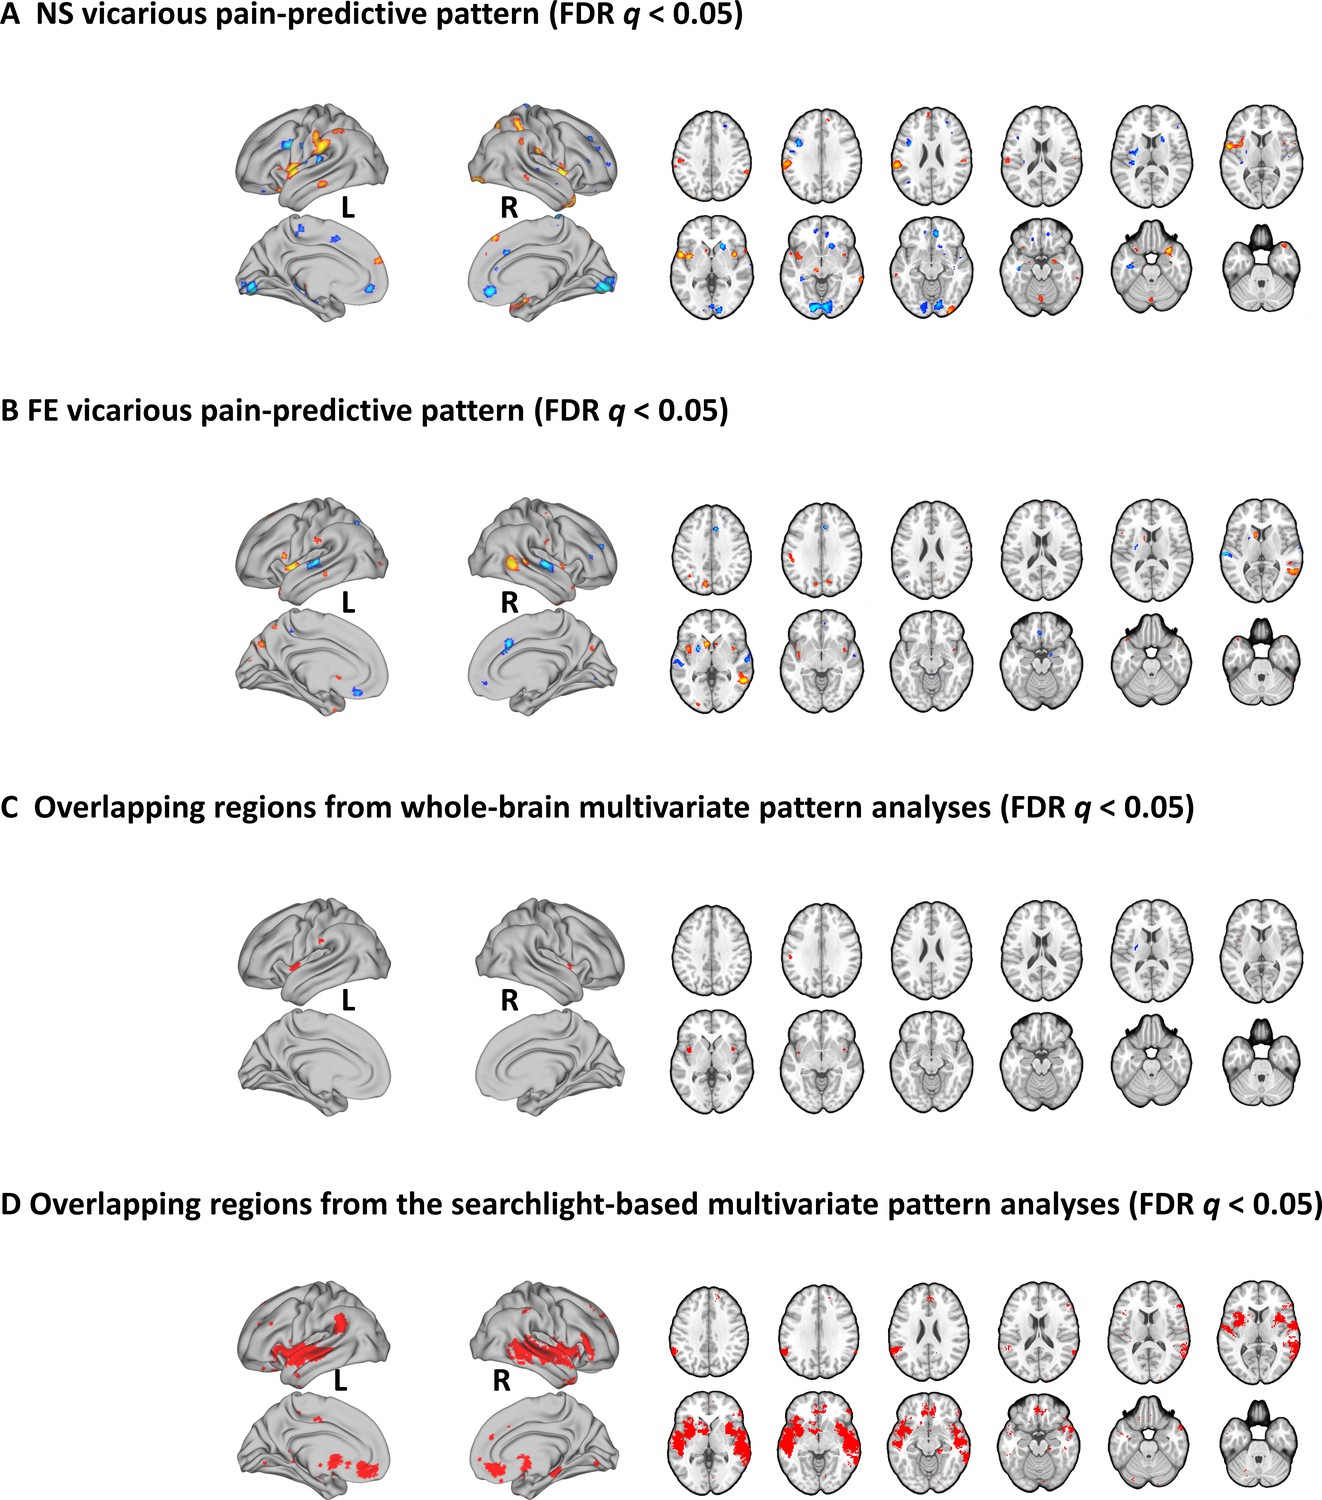
Brain regions that made reliable contributions to decoding vicarious pain.
NS (A) and FE (B) vicarious pain-predictive patterns and (C) overlapping reliable predictive voxels (bootstrap thresholded at FDR q < 0.05, two-tailed). (D) Brain regions exhibiting significant within-modality cross-validation and between-modality cross-prediction accuracies between NS and FE vicarious pain (thresholded at FDR q < 0.05, two-tailed). NS vicarious pain, observation of noxious stimulation of body limbs induced vicarious pain; FE vicarious pain, observation of facial expressions of pain induced pain.
Figure 4—figure supplement 1
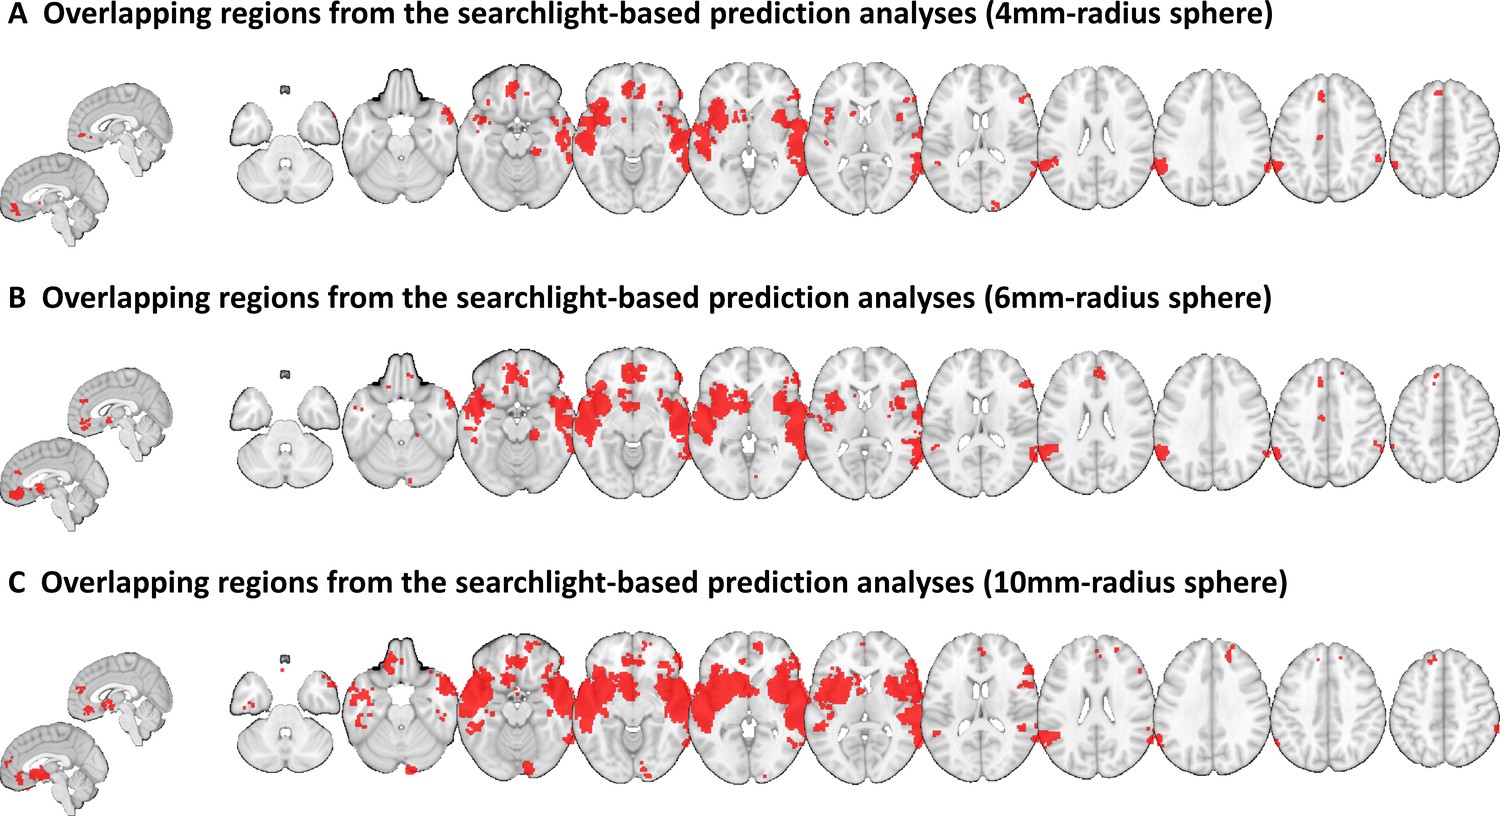
Searchlight analyses with different searchlight sizes.
This figure shows the results for the analyses in which we ran searchlight analyses with (A) 4-mm-, (B) 6-mm-, and (C) 10-mm-radius spheres.
Figure 5 with 1 supplement

Results of the mid-insula focused analyses.
(A) Mid-insula activation to NS vicarious pain was highly similar to activation to FE vicarious pain. (B) NS vicarious pain-predictive pattern in the mid-insula was spatially similar to the FE vicarious pain-predictive pattern. (C) Examining voxel-level similarity in bilateral mid-insula revealed that that the majority of mid-insula voxels exhibited shared positive or negative weights (Octants 2 and 6, respectively). Selective weights are depicted as: selective positive weights for NS (Octant 1) and for FE (Octant 3) vicarious pain patterns, selective negative weights for NS (Octant 5) and for FE (Octant 7) vicarious pain patterns. Voxels with opposite weights for the two signatures are depicted in Octants 4 and 8. (D) Cross-validation accuracy from the two-choice classification tests with mid-insula partial patterns. The results demonstrated significant within- and between-modality classifications for both NS and FE vicarious pain-predictive patterns. The dashed line indicates the chance level (50%), and error bars represent standard error of the mean across subjects. **p < 0.01; ***p < 0.001. SSD, sum of squared distances. Error bar indicates standard error.
Figure 5—figure supplement 1
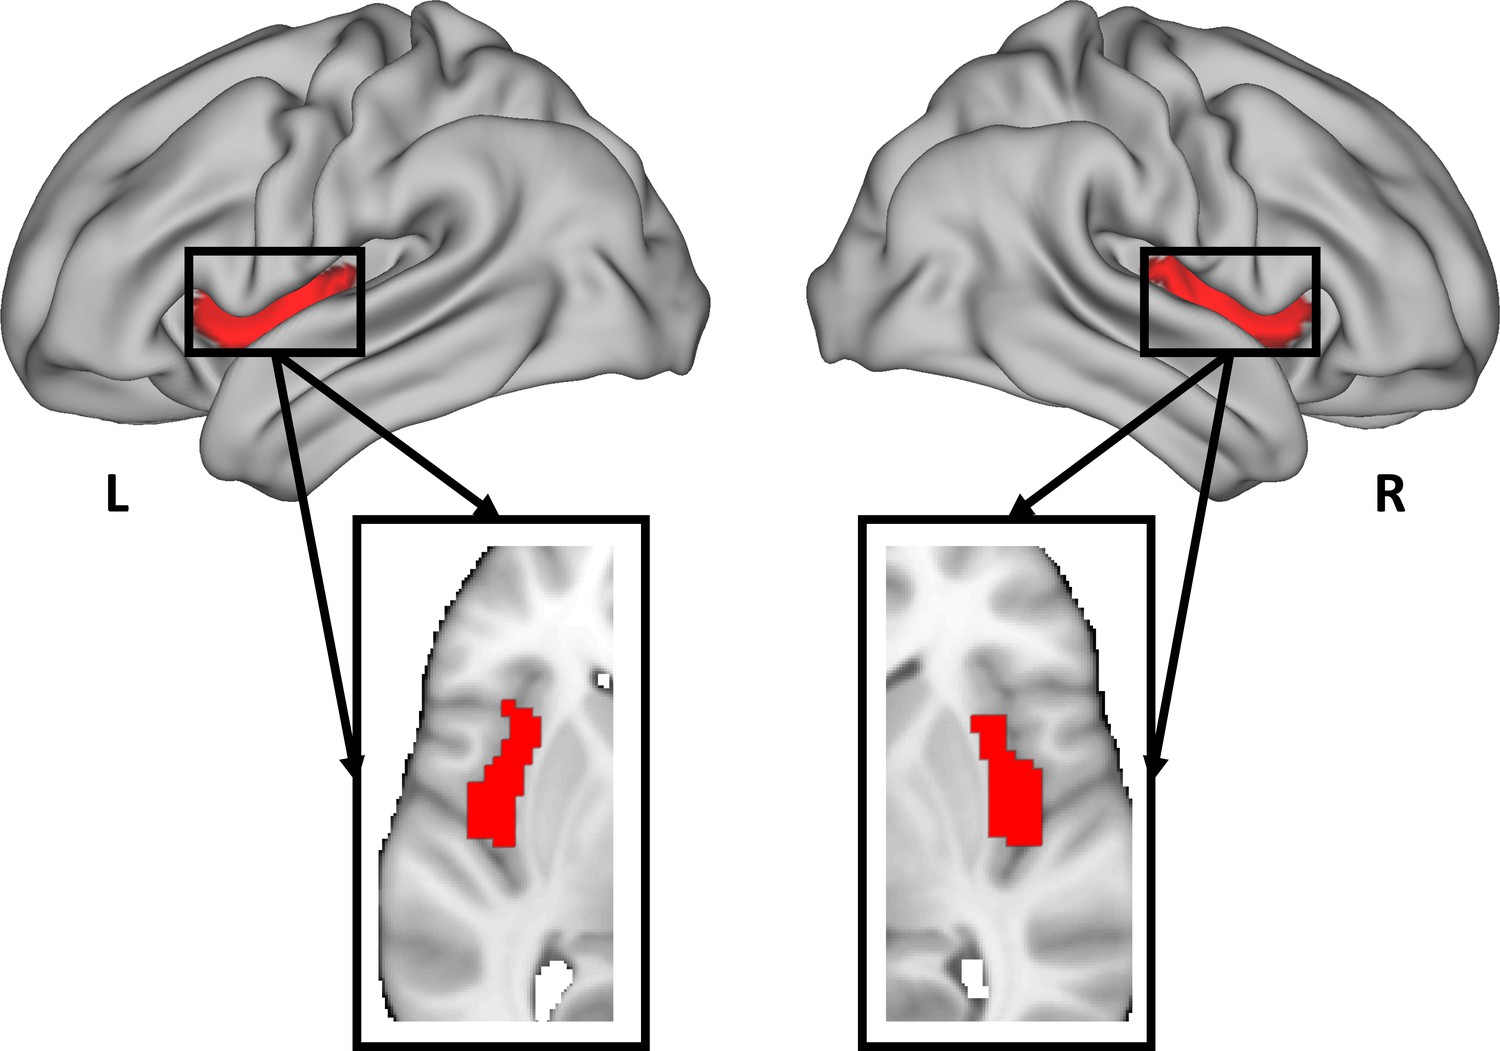
The mid-insula mask used in the current study.
Figure 6
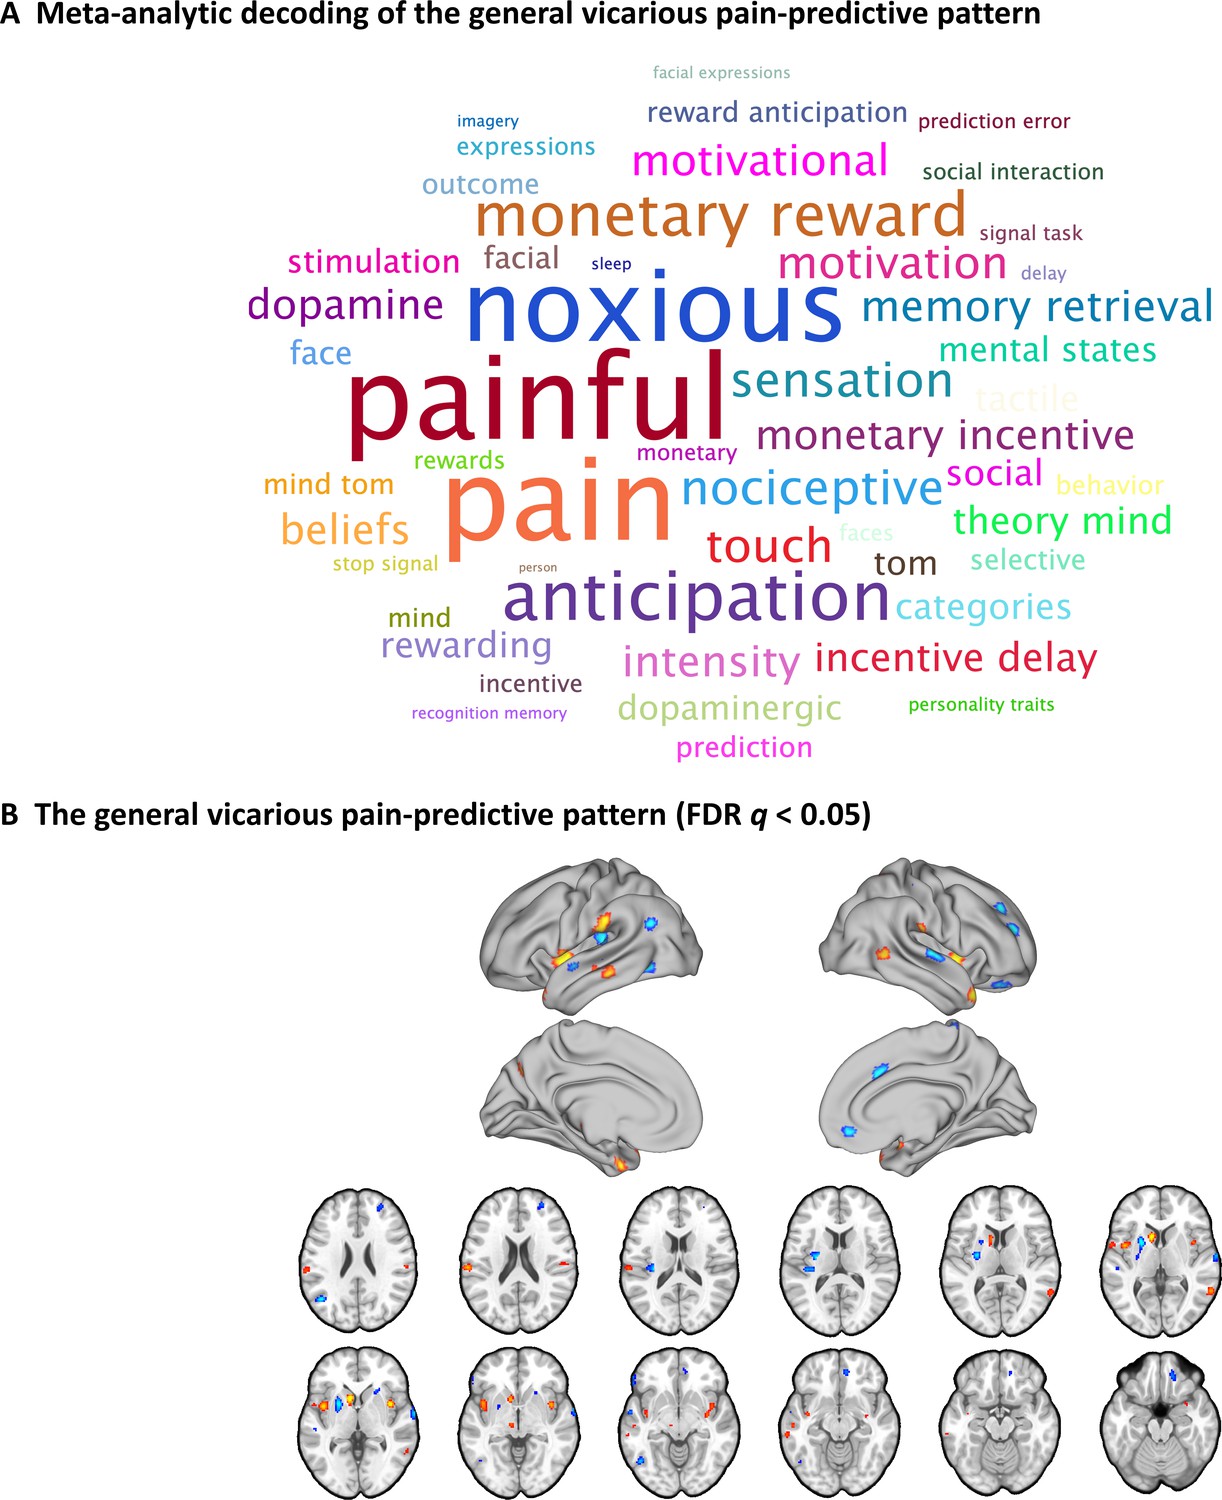
A general vicarious pain-predictive pattern which predicts both observation of noxious stimulation of body limbs and facial expressions of pain induced vicarious pain.
(A) Word cloud showing the top 50 relevant terms (excluding anatomical terms) for the meta-analytic decoding of the general vicarious pain-predictive pattern. The size of the font was scaled by correlation strength. (B) When thresholded at FDR q < 0.05, two-tailed (bootstrapped 10,000 samples) the general vicarious pain-predictive pattern revealed a distributed network of vicarious pain empathy representation including bilateral mid-insula and ventromedial prefrontal cortex.
Figure 7 with 2 supplements
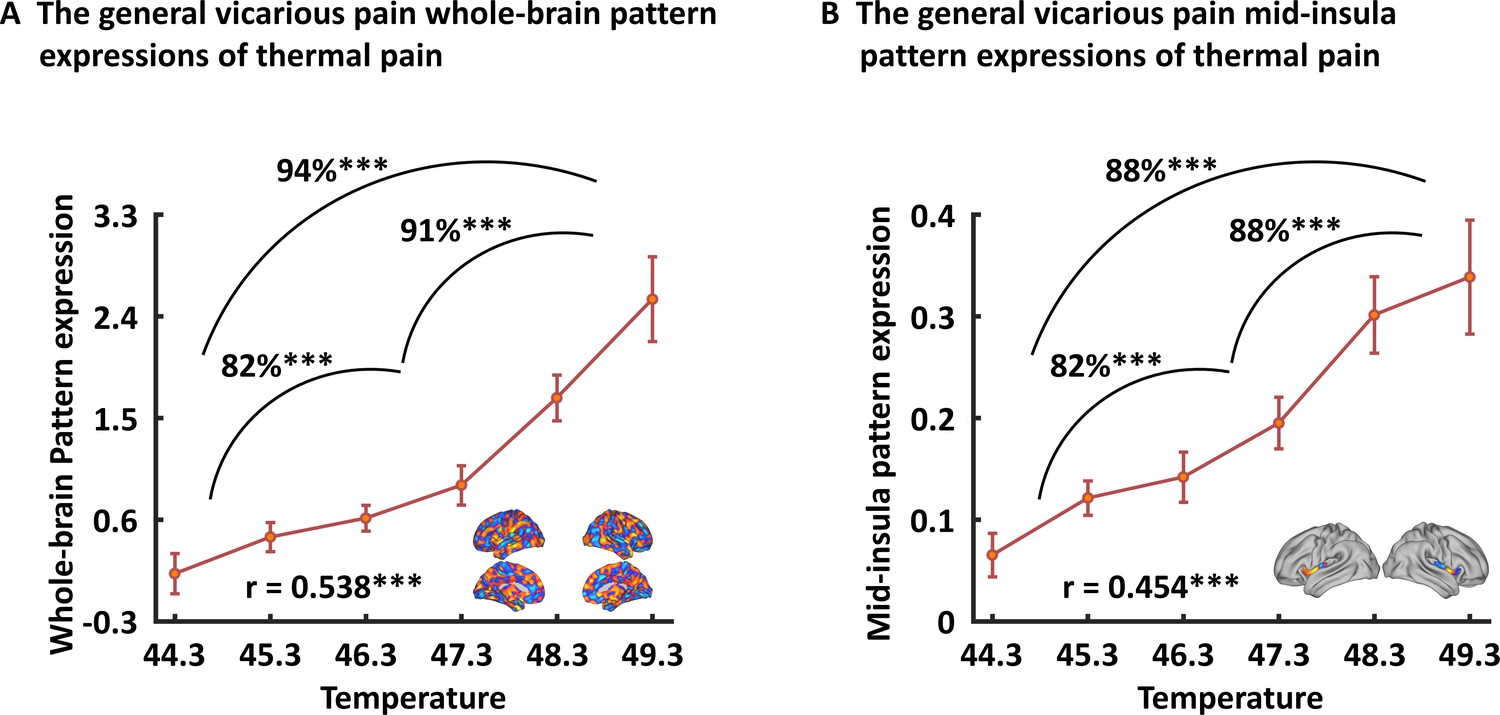
Generalizability of the general (across NS and FE) vicarious pain-predictive pattern.
Both whole-brain (A) and mid-insula (B) vicarious pain-predictive patterns could accurately predict the severity and classify the levels of self-experienced pain in an independent dataset. ***p < 0.001. Error bar indicates standard error.
Figure 7—figure supplement 1
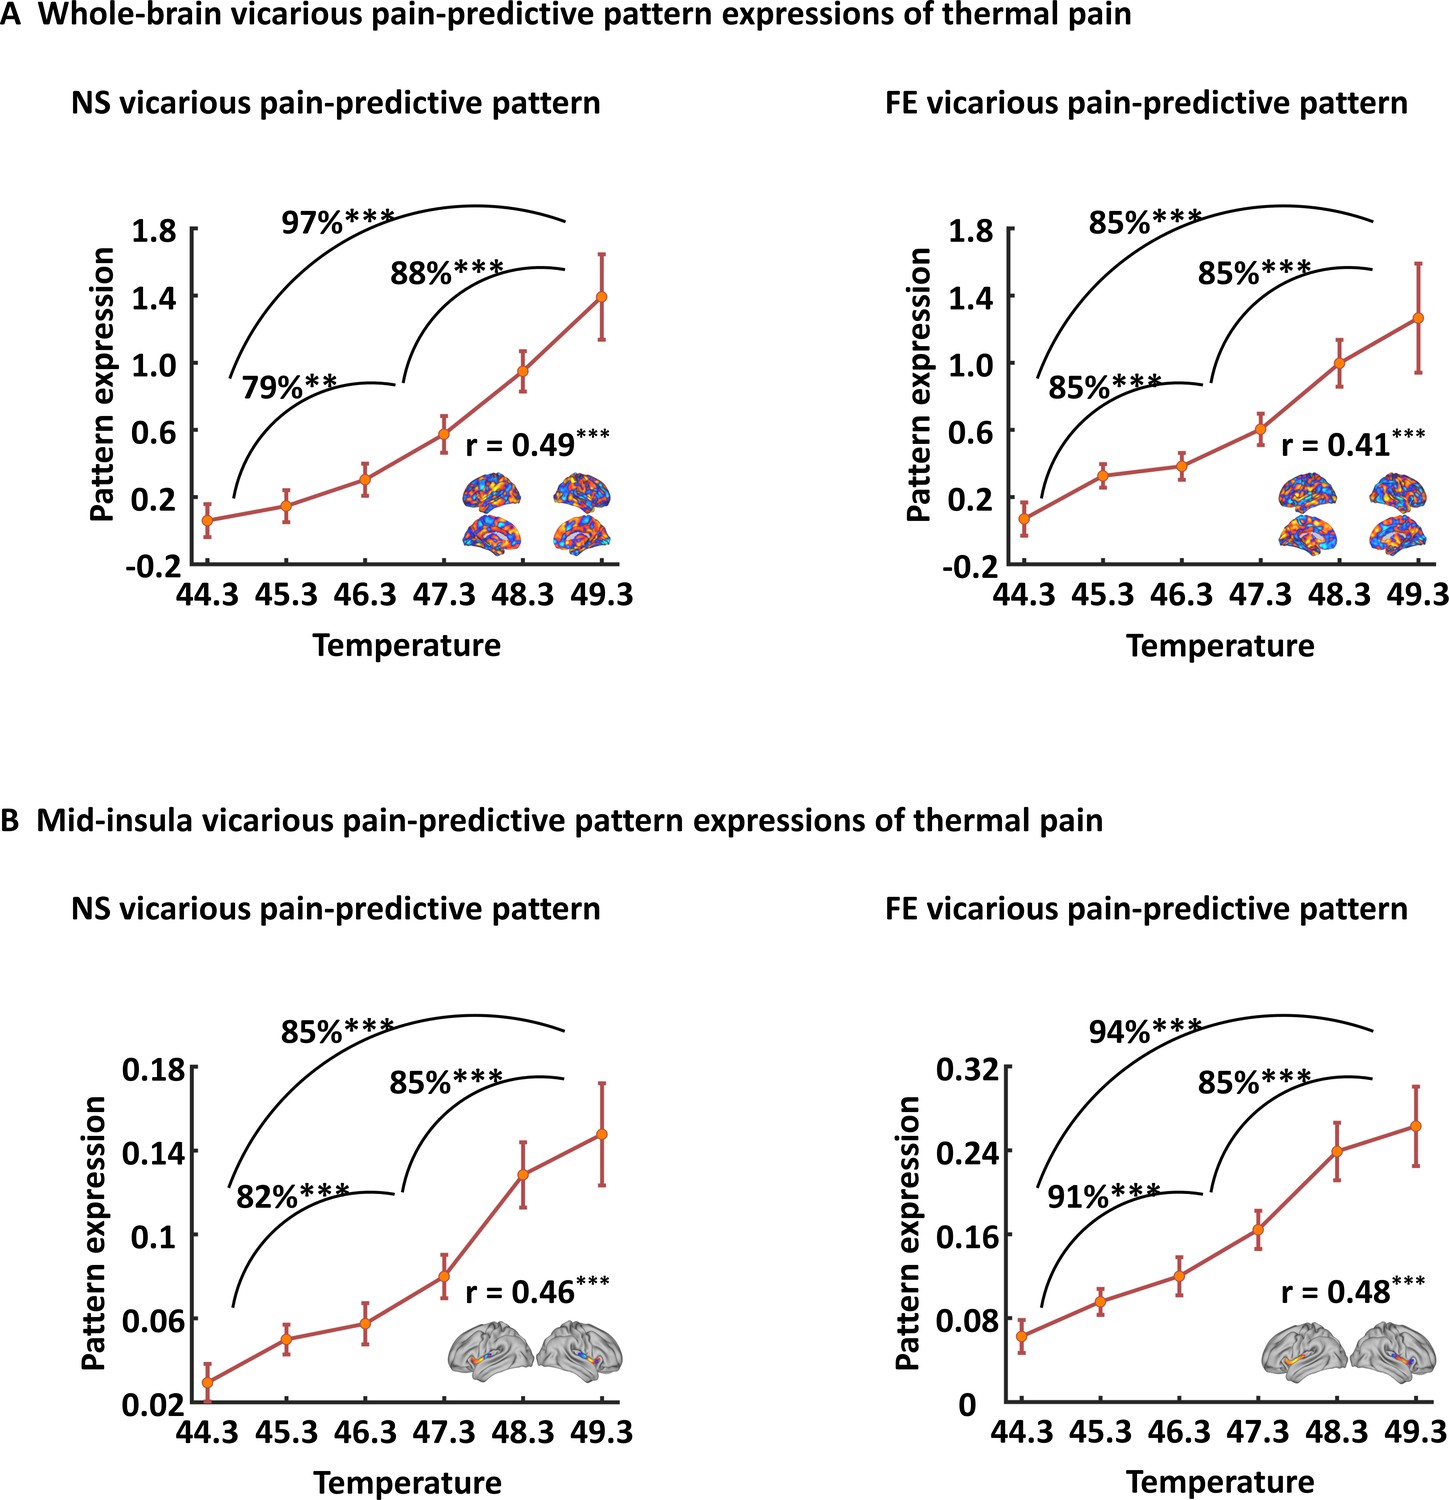
Generalizability of the NS and FE vicarious pain-predictive patterns.
Both whole-brain (A) and mid-insula (B) vicarious pain-predictive patterns could accurately predict the severity and classify the levels of self-experienced pain in an independent dataset. NS vicarious pain, observation of noxious stimulation of body limbs induced vicarious pain; FE vicarious pain, observation of facial expressions of pain induced vicarious pain. r indicates correlation coefficient between pattern expression and temperature levels. **p < 0.01; ***p < 0.001.
Figure 7—figure supplement 2
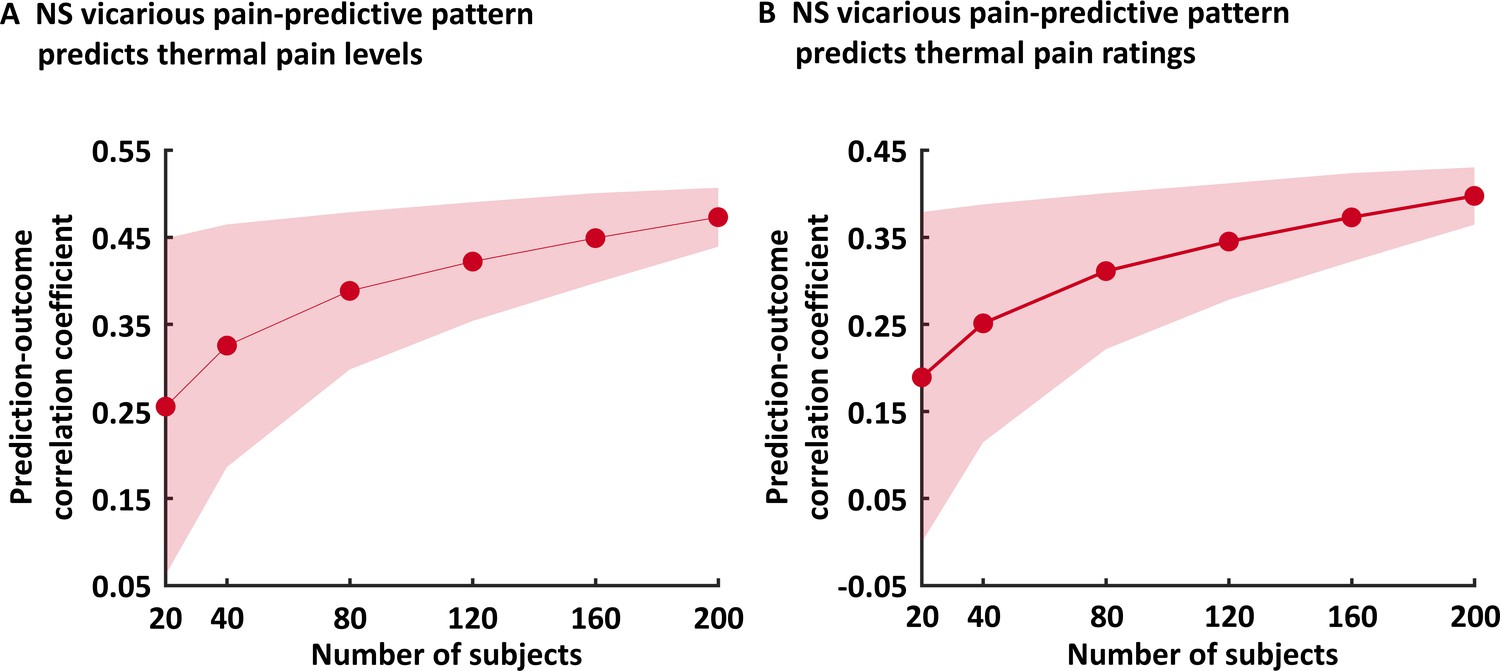
Varying sample size predictions.
This figure depicts the results for the analysis in which we predicted thermal pain levels (A) and ratings (B) using randomly selected n = 20, 40, 80, 120, 160 and 200 subjects’ NS vicarious pain data. Shaded areas indicate standard deviation. NS vicarious pain, observation of noxious stimulation of body limbs induced vicarious pain.
Tables
Key resources table
| Reagent type (species) or resource | Designation | Source or reference | Identifiers | Additional information |
|---|---|---|---|---|
| Software, algorithm | Matlab R2015b | MathWorks | RRID:SCR 001622 | |
| Software, algorithm | SPM12 | Wellcome Trust Centre for Neuroimaging | RRID:SCR_007037 | |
| Software, algorithm | CANLab Core Tools | CANlab | https://github.com/canlab | |
| Other | Thermal pain data | Wager et al., 2013 | https://ndownloader.figshare.com/files/12708989 | |
| Other | Vicarious pain signatures | This paper | https://neurovault.org/collections/6332/ | Deposited multivariate patterns |
| Other | Data and codes | This paper | https://figshare.com/articles/Vicarious_pain_dataset/11994498 | Deposited fMRI data and scripts for figures |
Additional files
-
Supplementary file 1
Table shows post-fMRI subjective ratings for vicarious pain evoking stimuli (Mean ± SD).
NS vicarious pain, observation of noxious stimulation of body limbs induced vicarious pain; FE vicarious pain, observation of facial expressions of pain induced vicarious pain; NS control stimuli depict body limbs in similar but innocuous situations, FE control stimuli show neutral facial expressions.
- https://cdn.elifesciences.org/articles/56929/elife-56929-supp1-v2.docx
-
Transparent reporting form
- https://cdn.elifesciences.org/articles/56929/elife-56929-transrepform-v2.docx
Download links
A two-part list of links to download the article, or parts of the article, in various formats.
Downloads (link to download the article as PDF)
Open citations (links to open the citations from this article in various online reference manager services)
Cite this article (links to download the citations from this article in formats compatible with various reference manager tools)
Empathic pain evoked by sensory and emotional-communicative cues share common and process-specific neural representations
eLife 9:e56929.
https://doi.org/10.7554/eLife.56929


