LKB1 coordinates neurite remodeling to drive synapse layer emergence in the outer retina
- Department of Neuroscience, Baylor College of Medicine, United States
- Huffington Center on Aging, Baylor College of Medicine, United States
- Department of Neurobiology, David Geffen School of Medicine at UCLA, United States
- United States Veterans Administration Greater Los Angeles Healthcare System, United States
Figures
Figure 1 with 2 supplements
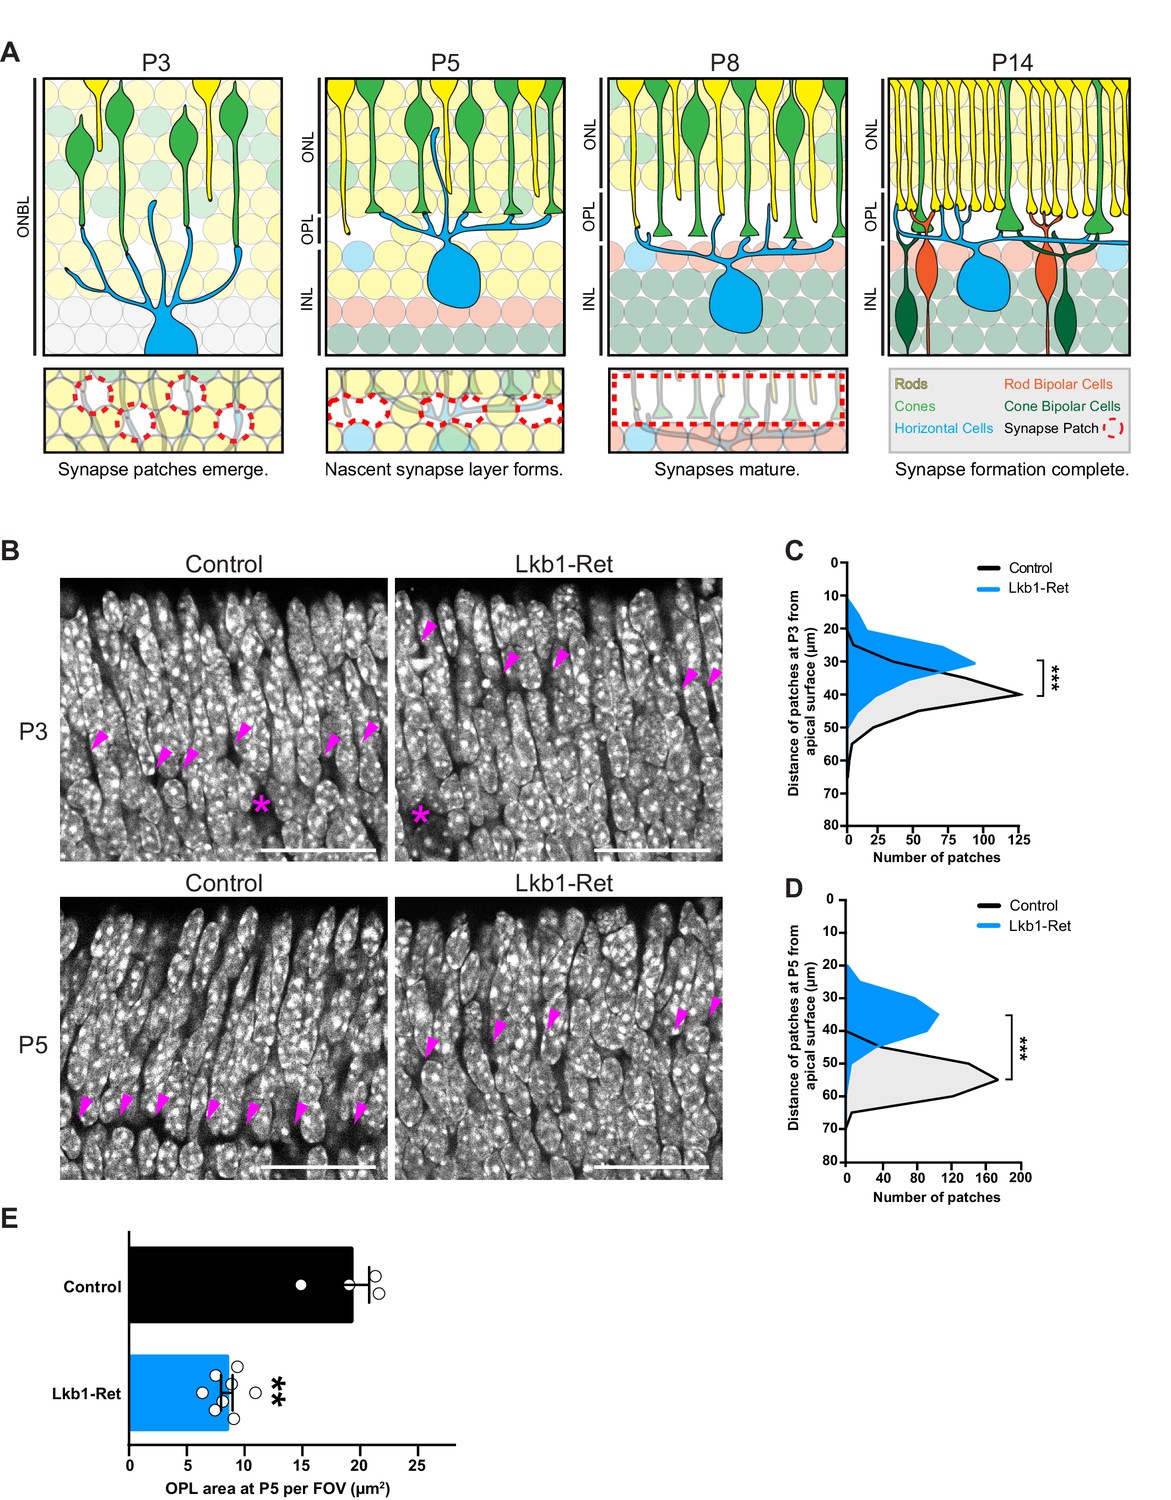
LKB1 is required for outer plexiform layer formation.
(A) Schematic of outer plexiform layer (OPL) development from P3 to P14. The outer retina contains developing rods (yellow) and cones (green) that extend axons beginning at P1. Cones form contacts with horizontal cell interneurons (blue) at P3, where nascent synapse patches emerge at sites of contact (red circles), followed by synaptogenesis beginning at P5. This corresponds with OPL formation. Rods begin to form synaptic connections with horizontal cells by P8, and bipolar cells also begin to become integrated at this time (orange, rod bipolars; dark green, cone bipolars). Ribbon synapse formation is complete and OPL sublamination begins by P14. (ONBL, outer neuroblast layer; ONL, outer nuclear layer; OPL, outer plexiform layer; INL, inner nuclear layer). (B–D) In control animals, the nascent OPL is first visible at P3 when it appears as small discontinuous gaps in the nuclear staining (DAPI, grey; arrowheads point to patches). These patches are distinct from gaps caused by horizontal cell bodies (magenta stars). In Lkb1-Ret animals, these OPL patches are small and located closer to the apical surface (B) and are reduced in number (C, n = 322 control cells and n = 252 Lkb1-Ret cells). N = 4 control and N = 4 Lkb1-Ret animals. At P5, nascent patches converge in control animals to generate a single continuous layer, forming the OPL. In Lkb1-Ret animals, the OPL was discontinuous and patches were misaligned and located closer to the apical surface (D n = 487 control cells and n = 339 Lkb1-Ret cells). This resulted in a marked decreased in total OPL area (E). N = 4 control and N = 8 Lkb1-Ret animals. Scale bars = 25 µm. Data are represented as a distribution of the distance of patches from the apical surface (B,D, ***p<0.001, unpaired two-tailed Student’s t test) or as the mean ± the s.e.m. (E, **p<0.01, non-parametric Mann-Whitney Rank Sum U-test).
Figure 1—figure supplement 1
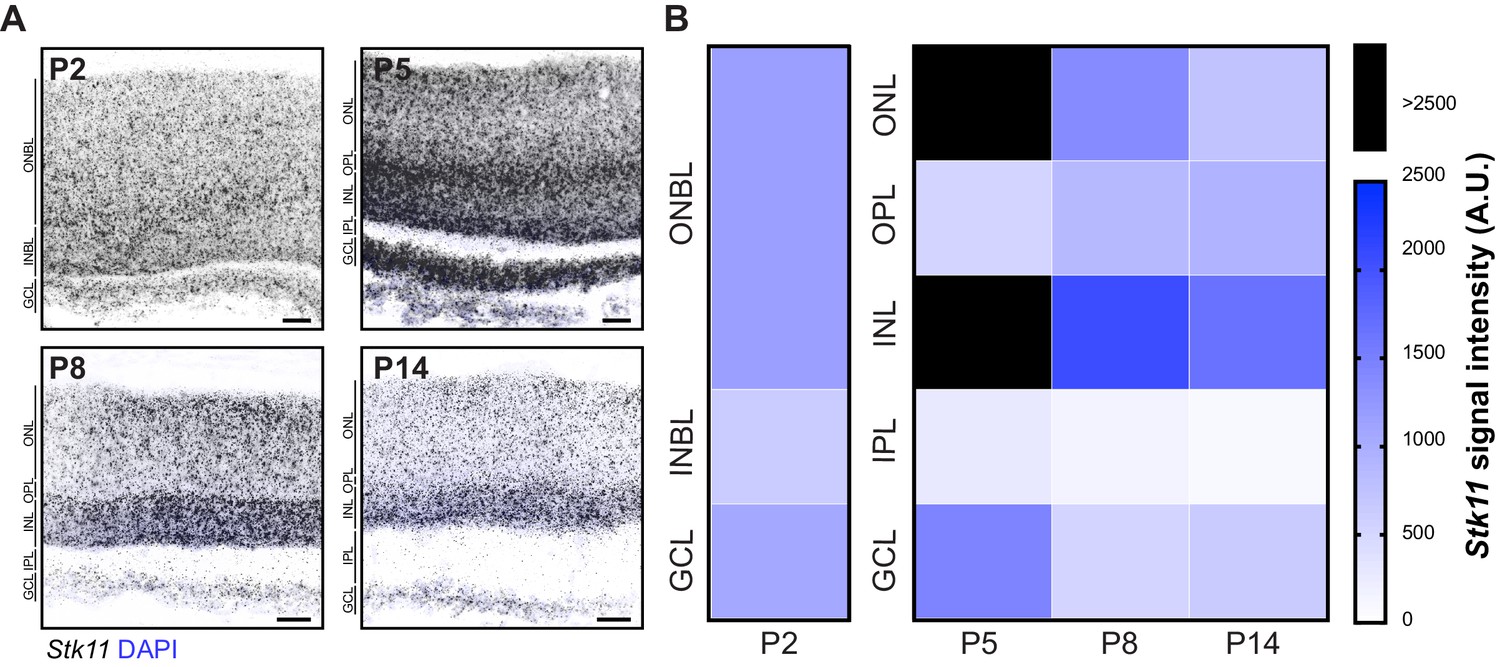
Stk11 is highly expressed throughout the retina in early development.
In situ hybridization pattern of Stk11 over retina development. (A–B) Representative fluorescent in situ hybridization images (A) and quantification (B) of Stk11 expression patterns across development at P2, P5, P8, and P14 in control mice. Data in (B) are presented as a heatmap indicating the corrected total cell fluorescence of each retinal layer occupied by the signal using a gradient scale where white to blue depicts low to high levels of fluorescent intensity (0–2500, respectively), and black indicates enrichment levels higher than 2500. Scale bars = 25 µm.
Figure 1—figure supplement 2
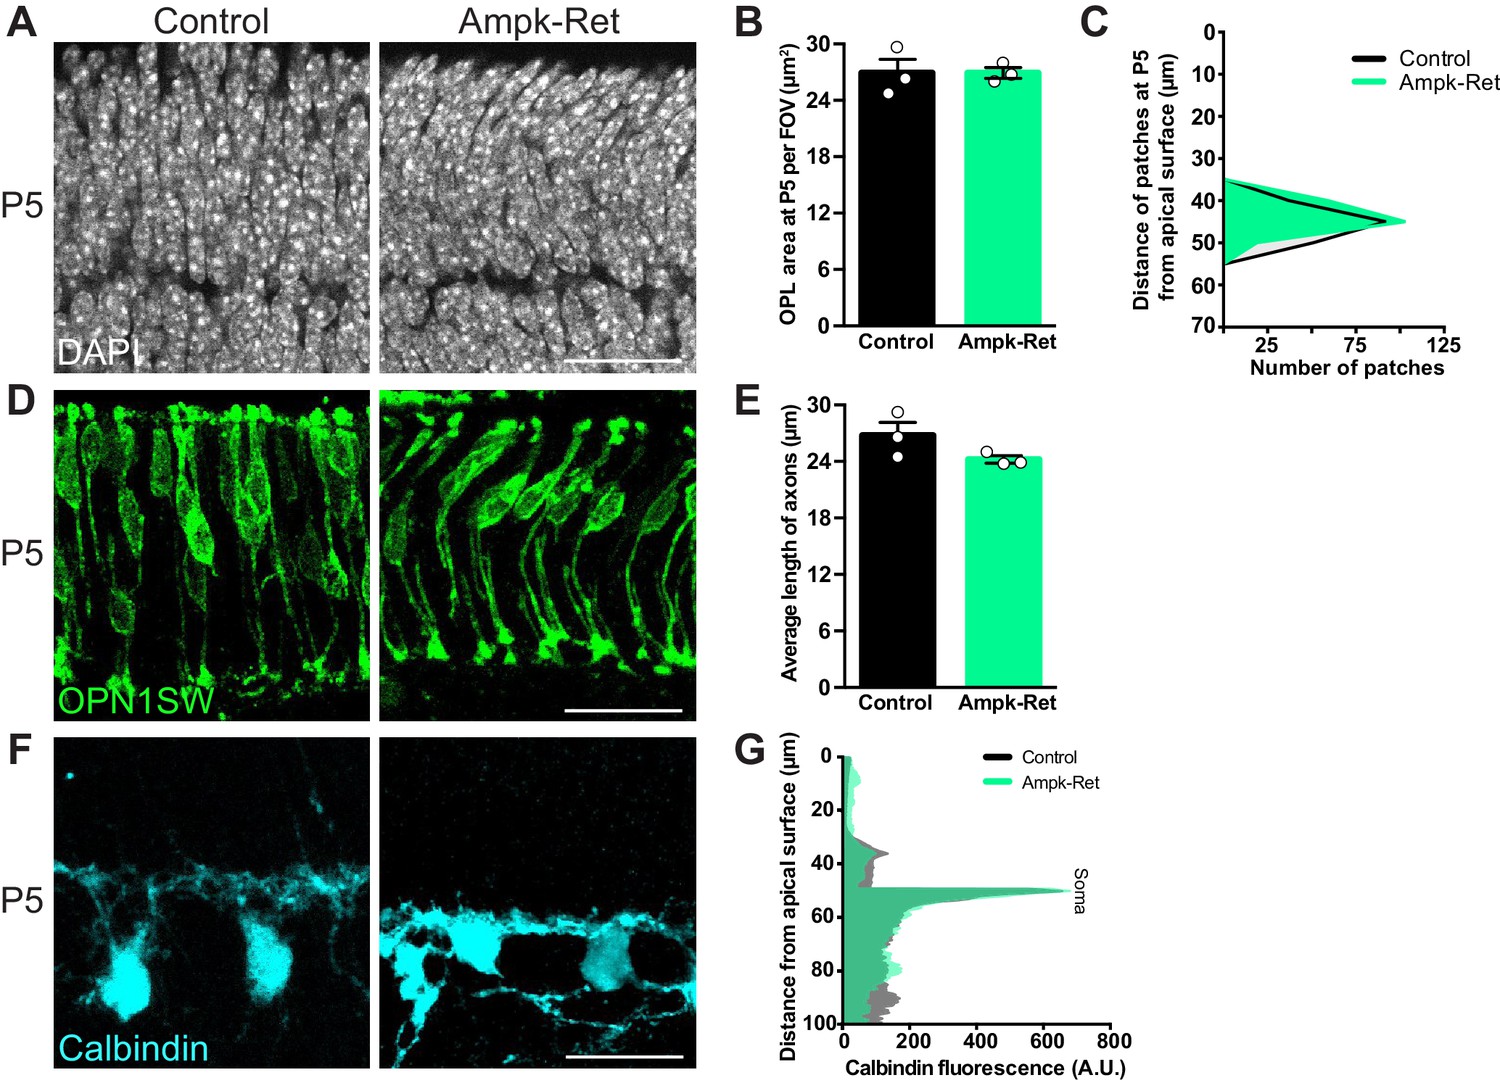
AMPK does not regulate outer retina development.
Outer retina emergence and cellular morphology were visualized in Ampk-Ret mice and littermate controls at P5. (A–C) Representative images (A) and quantification of OPL emergence (B, DAPI, grey) and distance (C) of OPL patches from the apical surface at P5 in Ampk-Ret and littermate controls. The OPL emerges at the proper time and location in Ampk-Ret animals (B) and is located the same distance from the apical surface as controls (C, n = 187 control cells and n = 182 Ampk-Ret cells). N = 3 control and Ampk-Ret animals. (D–E) Representative images (D) and quantification (E) of cone (OPN1SW, green) morphology at P5. Ampk-Ret cones extend their axons to same length as control mice. N = 3 control and Ampk-Ret animals. (F–G) Representative images (F) and quantification (G) of horizontal cell (calbindin, cyan) morphology at P5. Ampk-Ret horizontal cells restrict their arbors, spanning the same area as control mice. N = 3 control and Ampk-Ret animals. Scale bars = 25 µm. Data are represented as the mean ± the s.e.m. (B, E, p>0.05, non-parametric Mann-Whitney Rank Sum U-test), as a distribution of the distance of patches from the apical surface (C, p>0.05, unpaired two-tailed Student’s t test), or as the mean fluorescence relative to the distance from the apical surface (G, p>0.05, unpaired two-tailed Student’s t test).
Figure 2 with 1 supplement
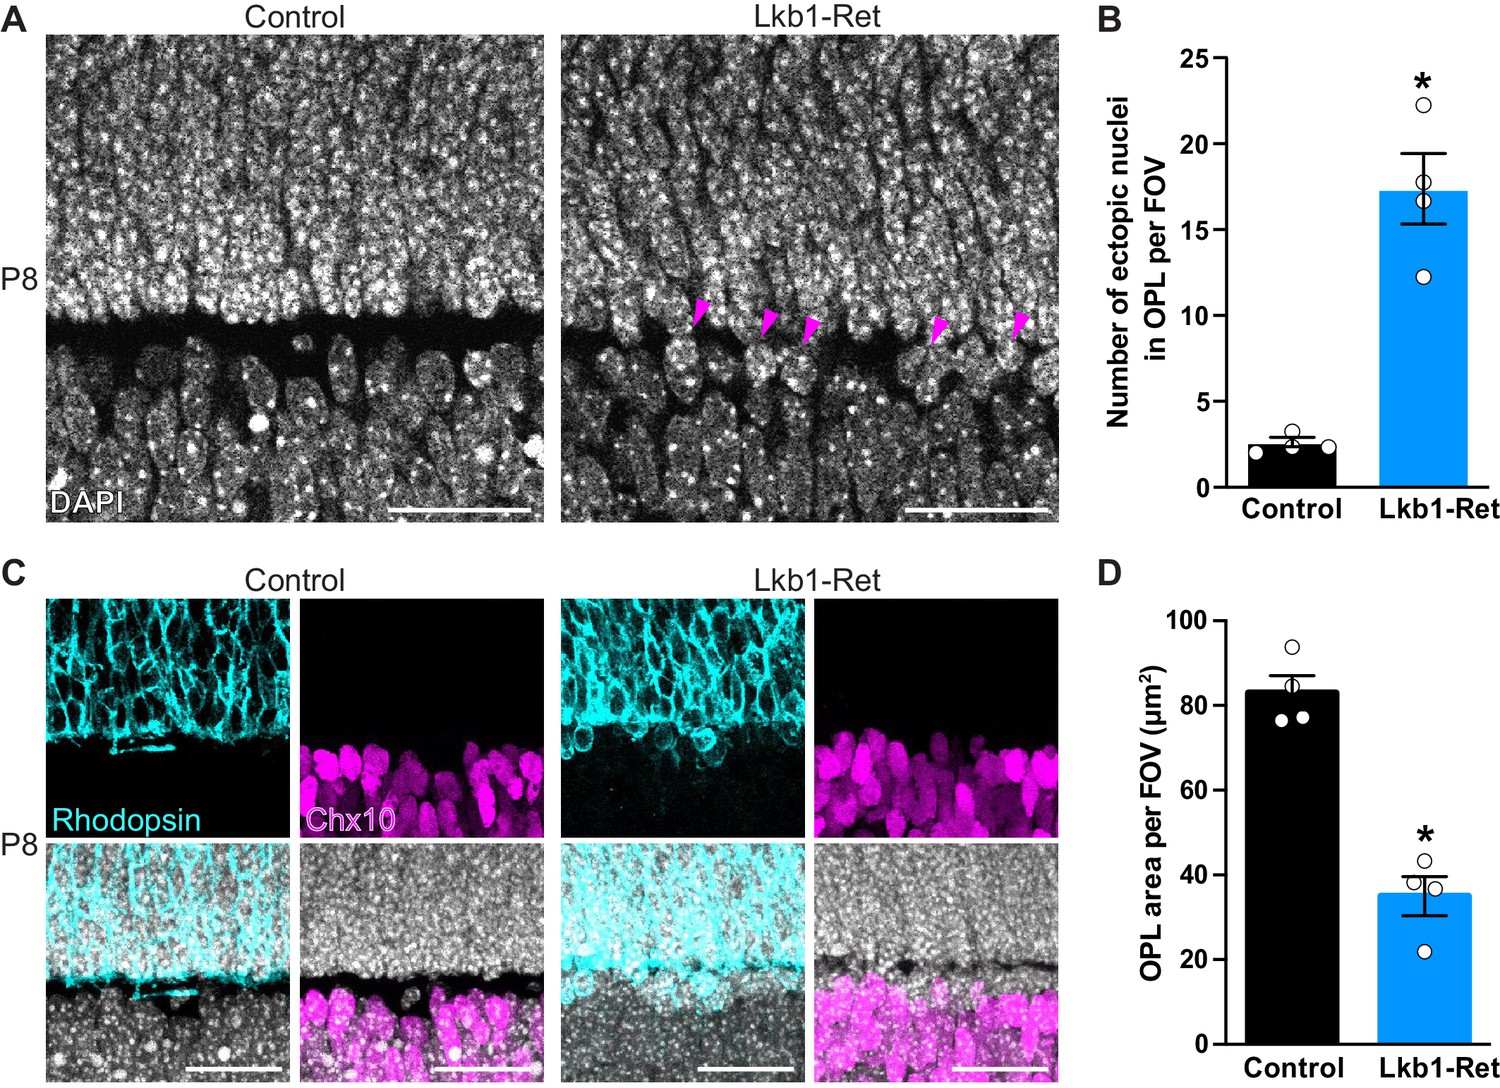
The outer plexiform layer is disorganized in LKB1 mutant animals.
(A-B) The OPL was visualized in Lkb1-Ret animals and control littermates at P8 following staining with DAPI. The OPL of Lkb1-Ret animals contains ectopic nuclei (arrows, A) that were increased in number relative to controls (B). (C–D) Cellular segregation was visualized using antibodies that demark the upper (rods, rhodopsin, blue) and lower (bipolar cells, Chx10, magenta) OPL boundaries. Lkb1-Ret animals displayed defects in neuron segregation with some rod nuclei remaining below the nascent OPL (C). The total area of the OPL (D) was also decreased in Lkb1-Ret animals relative to littermate controls. N = 4 control and N = 4 Lkb1-Ret animals. Scale bar = 25 µm. Data are represented as the mean ± the s.e.m. *p<0.05, non-parametric Mann-Whitney Rank Sum U-test.
Figure 2—figure supplement 1
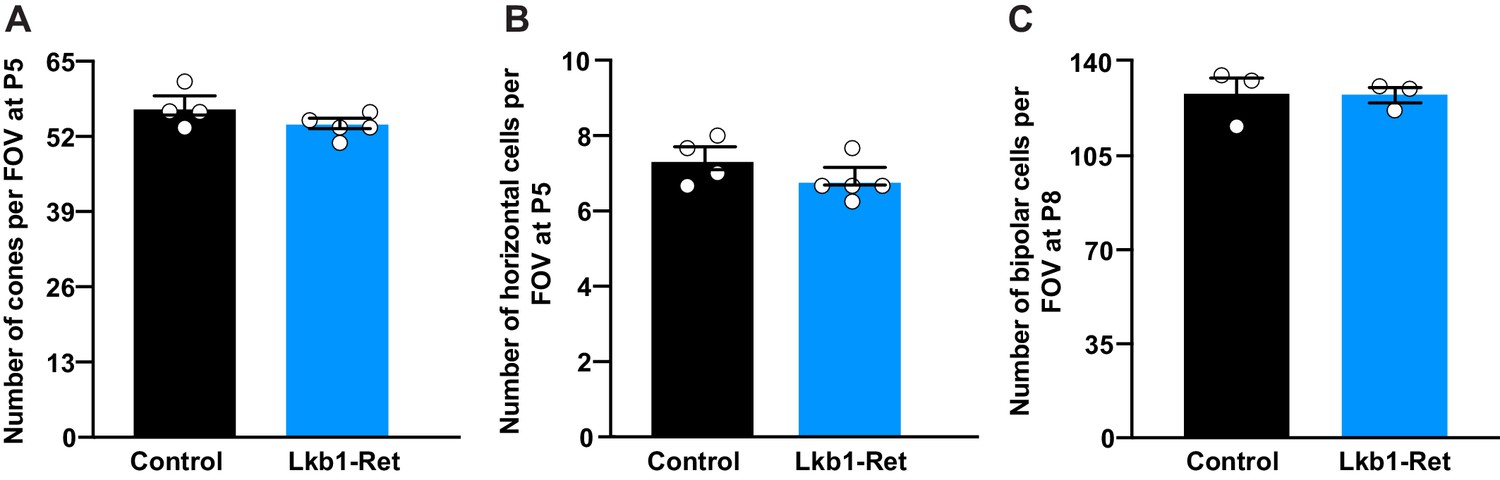
Outer retina neuron cell numbers are normal in LKB1 mutant animals.
(A–C) The number of cone photoreceptors (A) and horizontal cells (B) were quantified at P5, and the number of bipolar cells (C) were quantified at P8. There was no difference in the total number of these neuron populations between control and Lkb1-Ret mice. N ≥ 3 control and N ≥ 3 Lkb1-Ret animals. Data are represented as the mean ± the s.e.m. p>0.05, non-parametric Mann-Whitney Rank Sum U-test.
Figure 3 with 1 supplement
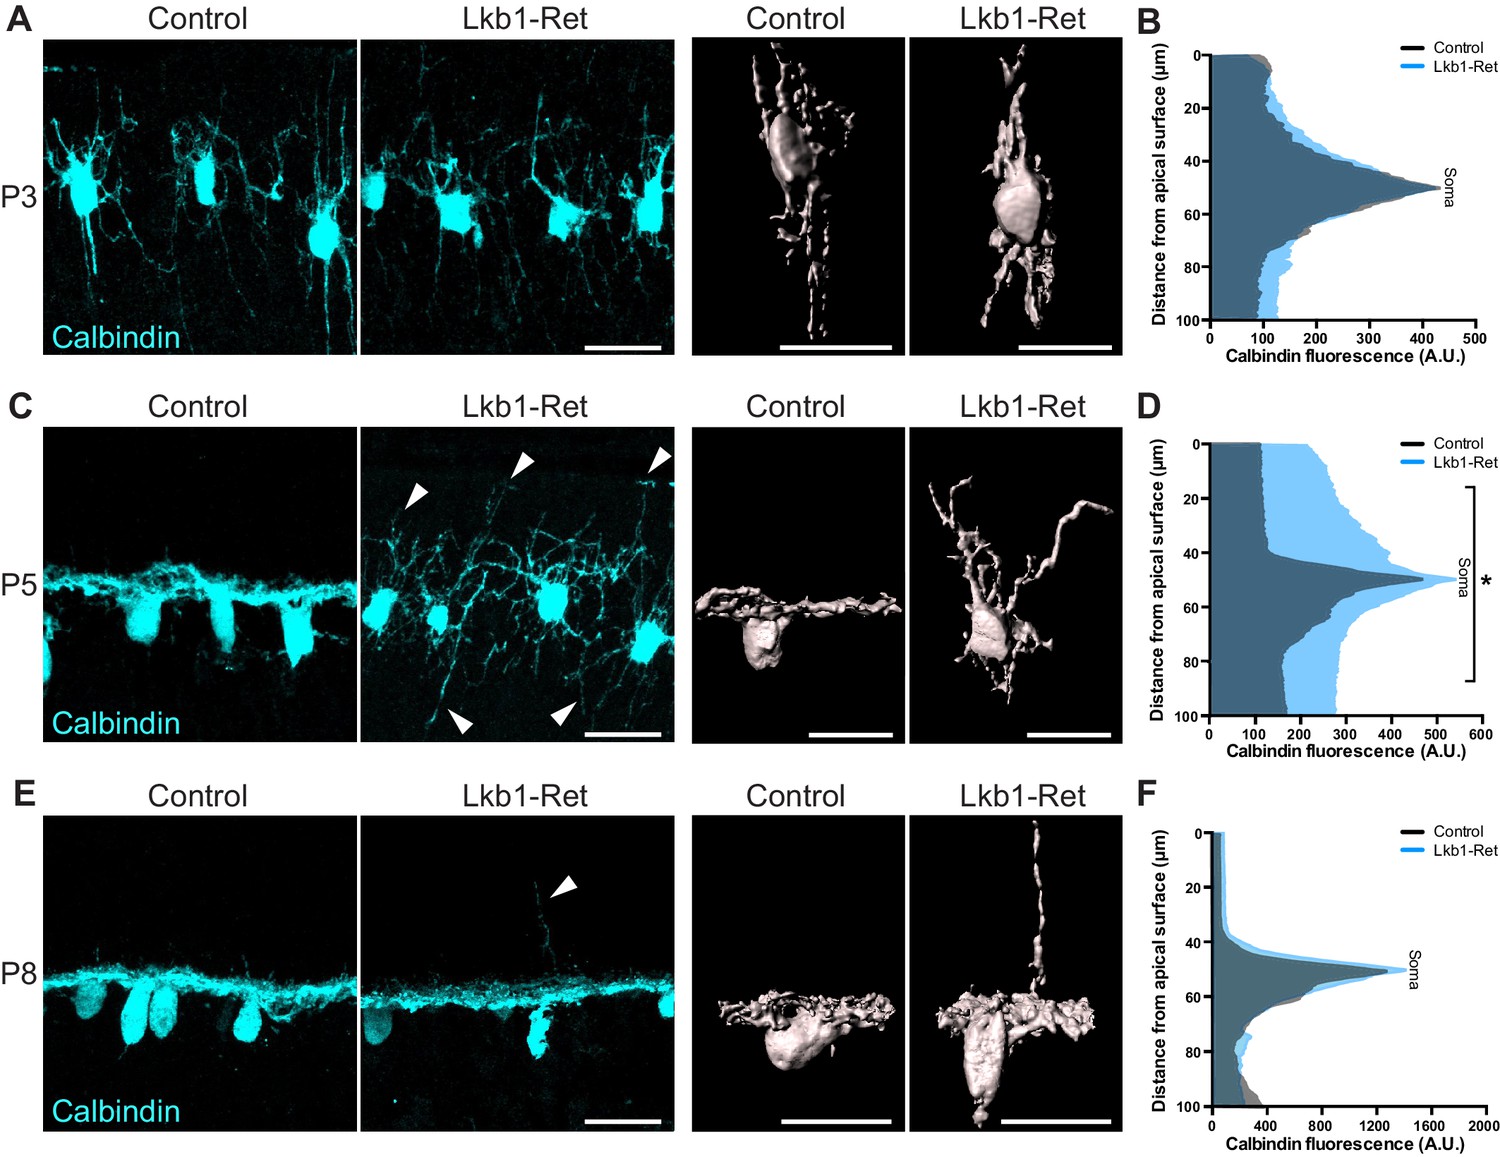
Horizontal cell neurite restriction is altered with loss of LKB1.
Horizontal cells and their neurites were identified in Lkb1-Ret and littermate controls during postnatal development using an antibody to calbindin (cyan). (A–B) Representative and reconstructed images (A) and quantification (B) of horizontal cell morphology at P3. Horizontal cells in both Lkb1-Ret and control animals exhibit stellate morphologies, and no significant structural differences were observed. N = 3 littermate controls and N = 7 Lkb1-Ret animals. (C–D) Representative and reconstructed images (C) and quantification (D) of horizontal cell morphology at P5. Lkb1-Ret horizontal cells fail to restrict their arbors at P5 (arrows) and instead display a marked radial morphology that results in horizontal processes spanning a significantly increased retinal area. N = 4 control and N = 8 Lkb1-Ret animals. (E–F) Representative and reconstructed images (E) and quantification (F) of horizontal cell morphology at P8. Horizontal cells in Lkb1-Ret animals refined their arbors, though occasional extensions into the outer retina were observed (arrow). N = 4 control and N = 4 Lkb1-Ret animals. Scale bars = 25 µm. Data are represented as the mean fluorescence relative to the distance from the apical surface. *p<0.05, unpaired two-tailed Student’s t test.
Figure 3—figure supplement 1
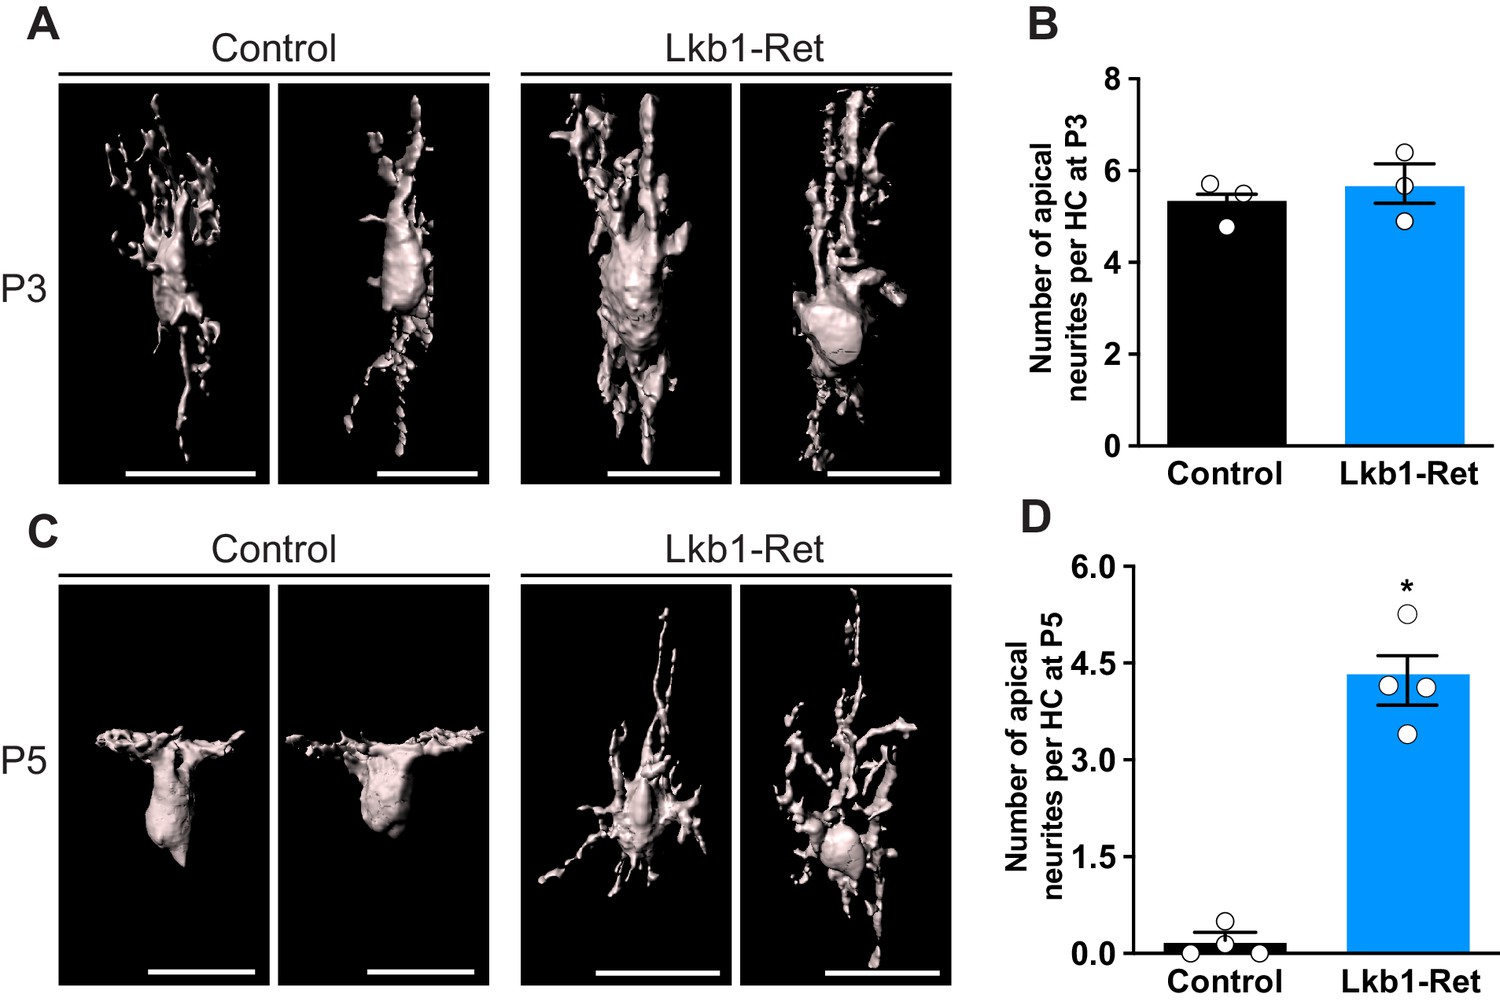
Horizontal cells fail to restrict their neurites at the appropriate developmental time.
Horizontal cells and their neurites were reconstructed in Lkb1-Ret and littermate controls during postnatal development using an antibody to calbindin (cyan). (A–B) Reconstructed images (A) and quantification (B) of the number of apical neurites per horizontal cell at P3. No significant structural differences were observed. N = 3 control and Lkb1-Ret animals. (C–D) Reconstructed images (C) and quantification (D) of the number of apical neurites per horizontal cell at P5. There is an increase in the number of apical neurites in Lkb1-Ret horizontal cells relative to controls, signifying their failure to restrict their arbors at P5. N = 4 control and N = 4 Lkb1-Ret animals. Scale bars = 25 µm. Data are represented as the mean ± the s.e.m. *p<0.05, non-parametric Mann-Whitney Rank Sum U test.
Figure 4 with 1 supplement

LKB1 is not required in horizontal cells to restrict their neurites.
Outer retina emergence and horizontal cell restriction were visualized in Lkb1-HC and littermate controls during postnatal development at P5. (A–C) Representative images (A) and quantification (B) of OPL emergence (DAPI, grey) and (C) distance of OPL patches from the apical surface at P5 in Lkb1-HC and littermate controls. The OPL emerges in Lkb1-HC animals at the proper time and location (B) and is located the same distance from the apical surface as controls (C, n = 239 control cells and n = 235 Lkb1-HC cells). N = 4 littermate controls and N = 3 Lkb1-HC animals. (D–E) Representative images (D) and quantification (E) of horizontal cell (calbindin, cyan) morphology at P5. Lkb1-HC horizontal cells restrict their arbors, spanning the same area as control mice. N = 4 control and N = 3 Lkb1-HC animals. Scale bars = 25 µm. Data are represented as the mean ± the s.e.m. (B, p>0.05, non-parametric Mann-Whitney Rank Sum U-test), as a distribution of the distance of patches from the apical surface (C, p>0.05, unpaired two-tailed Student’s t test), or as the mean fluorescence relative to the distance from the apical surface (E, p>0.05, unpaired two-tailed Student’s t test).
Figure 4—figure supplement 1
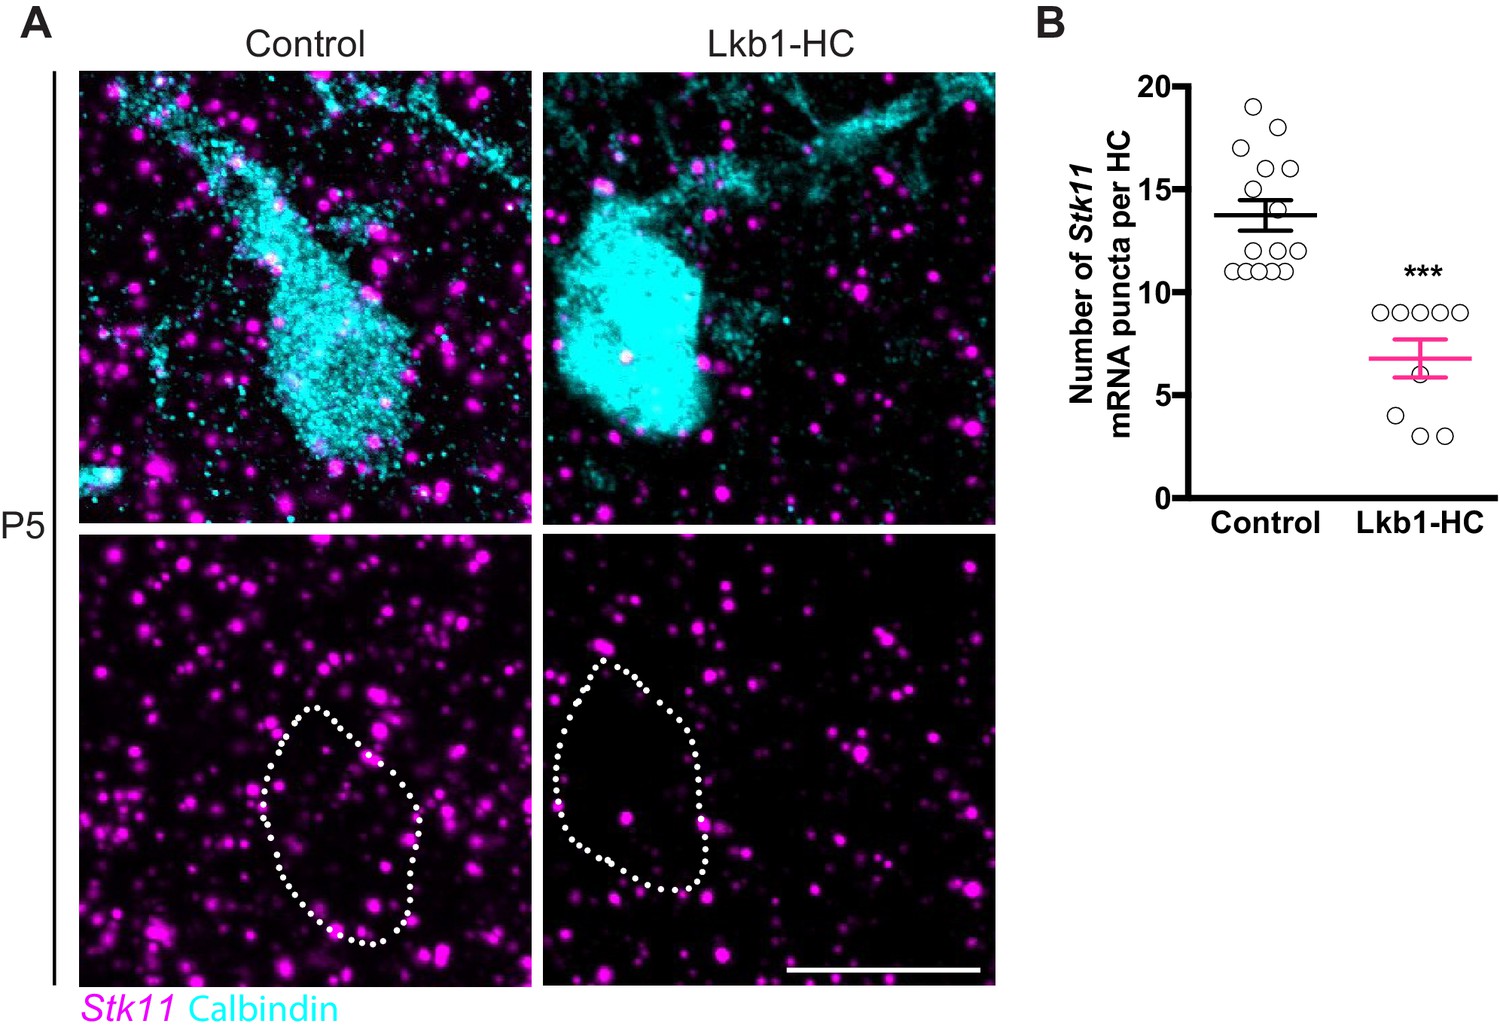
Stk11 is lost in horizontal cells in Lkb1-HC animals.
In situ hybridization of Stk11 in horizontal cells. (A–B) Representative fluorescent in situ hybridization images (A) and quantification (B) of Stk11 co-stained with calbindin to label horizontal cells in control and Lkb1-HC mice at P5. A significant reduction in Stk11 puncta in Lkb1-HC mice compared to control is observed. N = 2 control and Lkb1-HC animals (15 and 9 cells, respectively). Scale bars = 25 µm. Data are represented as the mean ± the s.e.m. ***p<0.0001, non-parametric Mann-Whitney Rank Sum U-test.
Figure 5

Cone axon extension requires LKB1.
Cones and their axons were identified in Lkb1-Ret animals and littermate controls during postnatal development using an antibody to OPN1SW (green). (A–B) Representative images (A) and reconstructed cones (B) over development. (C–F) The distribution of the length of cone axons in control and Lkb1-Ret animals was quantified at P1 (C, n = 376 control cells and n = 515 Lkb1-Ret cells), P3 (D, n = 488 control cells and n = 478 Lkb1-Ret cells), and P5 (E, n = 572 control cells and n = 505 Lkb1-Ret cells). At each time point, Lkb1-Ret cones were shorter, and many also lacked axons. By P8, the distribution of length of cone axons in control and Lkb1-Ret animals was normal (F, n = 560 control cells and n = 552 Lkb1-Ret cells). (G) Quantification of cone axons over development. Lkb1-Ret animals displayed defects in cone axon extension beginning at P1 that persisted at P3 and P5, resulting in a significant decrease in axon length (N ≥ 4 control and N ≥ 5 Lkb1-Ret animals). (H) OPL localization of cone terminals was quantified at P8. There was a significant increase in the number of cones that failed to reach the OPL (N = 4 control and N = 4 Lkb1-Ret). Scale bars = 25 µm (A) and 5 µm (B). Data are represented as the mean ± the s.e.m. (G–H) or as the distribution of the length of cone axons (C–F). ***p<0.001, **p<0.01, *p<0.05, non-parametric Mann-Whitney Rank Sum U-test.
Figure 6
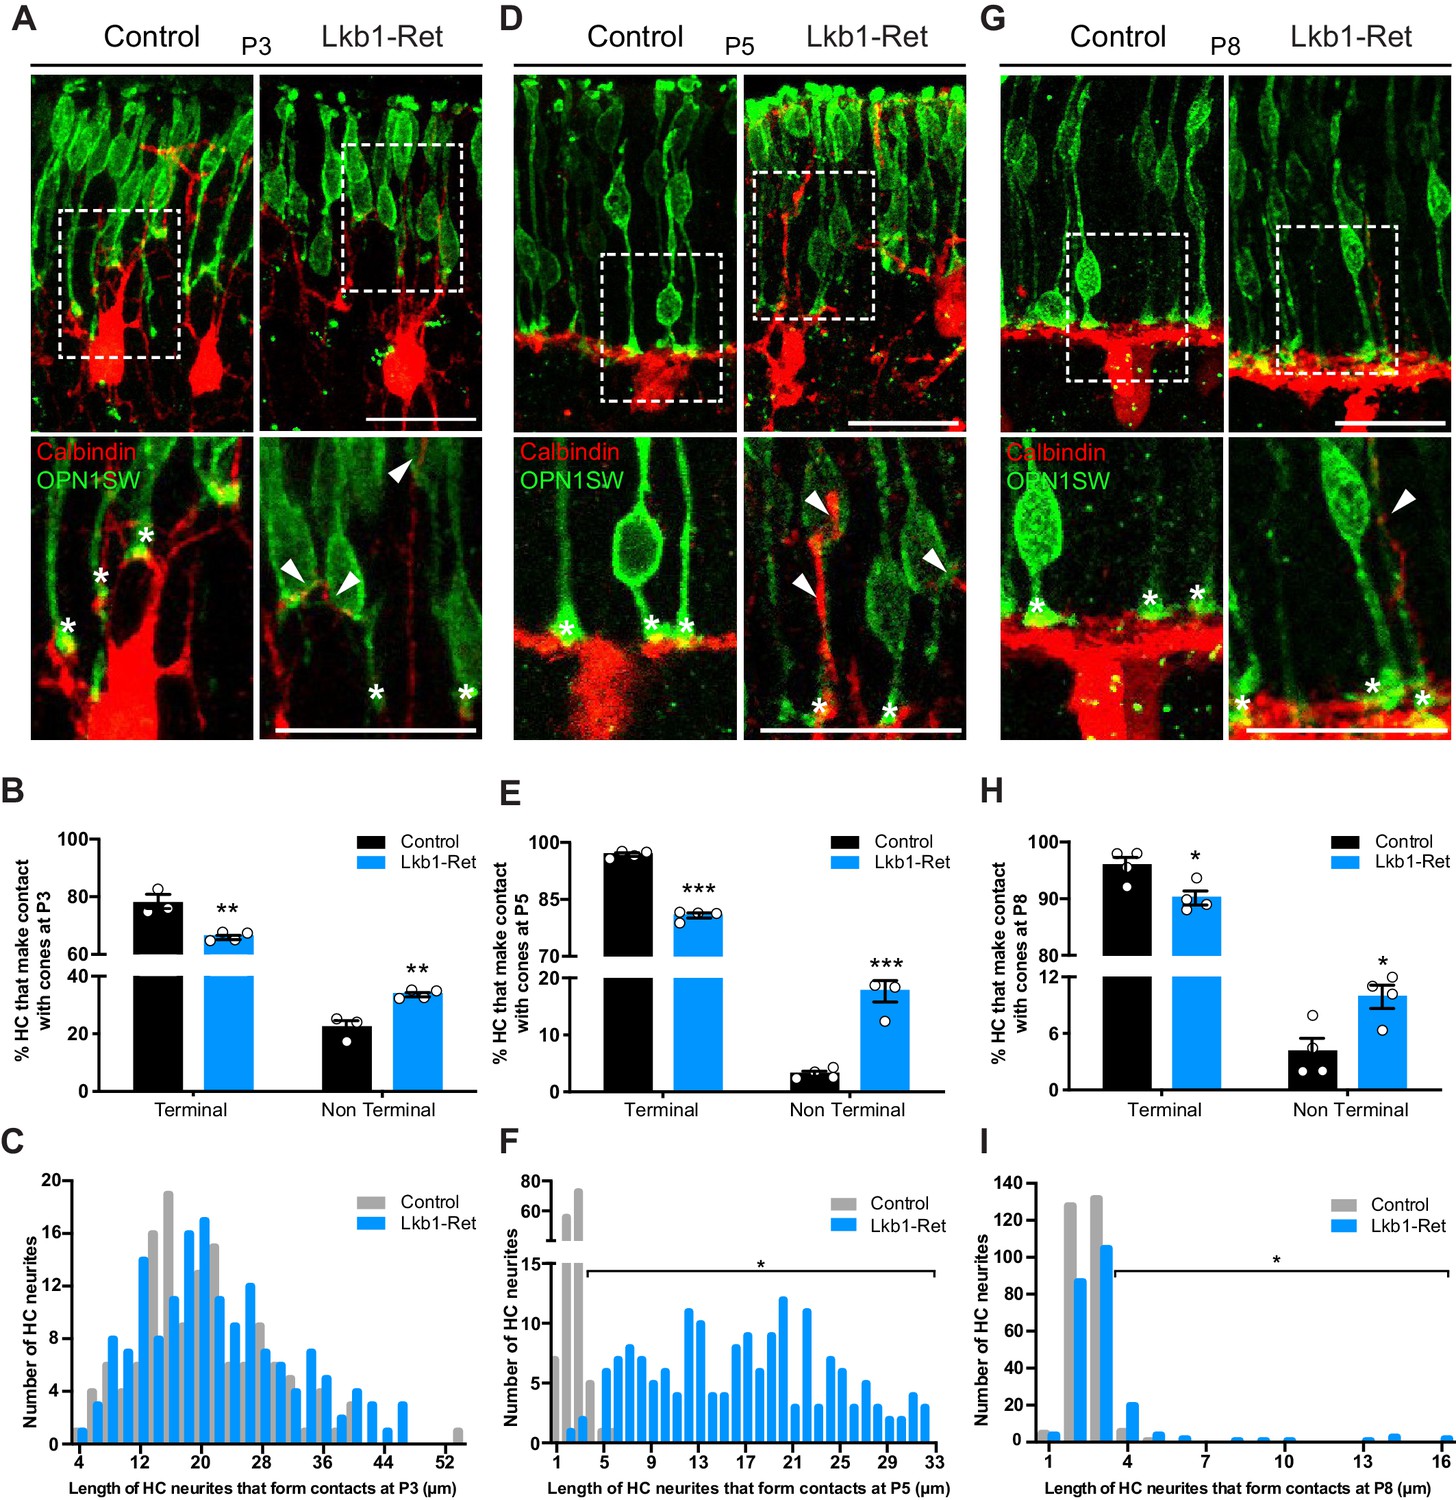
Horizontal cells in LKB1 mutants contact cones at terminal and non-terminal positions.
Horizontal cell and cone contacts (calbindin, red; OPN1SW, green) were identified in Lkb1-Ret and littermate controls during postnatal development. (A) Representative images of horizontal cell-cone contacts at P3. Higher magnification images are displayed of the contacts (stars demarcate terminal contacts; arrows demarcate non-terminal contacts). Scale bars = 25 µm. (B–C) The location of contacts between cones and horizontal cells was quantified at P3. Lkb1-Ret animals showed a small but significant reduction in terminal contacts and an increase in non-terminal contacts relative to controls (B). The length of horizontal cell neurites that formed contacts with cones in control and Lkb1-Ret animals were measured and binned. The mean distance of the terminal contacts relative to the location of horizontal cell somas did not significantly differ between groups (C, n = 135 control cells and n = 159 Lkb1-Ret). N = 3 control and N = 5 Lkb1-Ret animals. (D) Representative images of horizontal cell-cone contacts at P5. Higher magnification images are displayed of the contacts (stars demarcate terminal contacts; arrows demarcate non-terminal contacts). (E–F) The location of contacts between cones and horizontal cells was quantified at P5. Lkb1-Ret animals showed a significant reduction in terminal contacts and an increase in non-terminal contacts relative to controls (E). The length of horizontal cell neurites that formed contacts with cones in control and Lkb1-Ret animals were measured and binned. The mean distance of the terminal contacts relative to the location of horizontal cell somas significantly increased in Lkb1-Ret animals (F). N = 4 control and N = 5 Lkb1-Ret animals. (G) Representative images of horizontal cell-cone contacts at P8. Higher magnification images are displayed of the contacts (stars demarcate terminal contacts; arrows demarcate non terminal contacts). (H–I) The location of contacts between cones and horizontal cells was quantified at P8. Lkb1-Ret animals showed a small but significant reduction in terminal contacts and an increase in non-terminal contacts relative to controls (H). The length of horizontal cell neurites that formed contacts with cones in control and Lkb1-Ret animals were measured and binned. The mean distance of the terminal contacts relative to the location of horizontal cell somas significantly increased in Lkb1-Ret animals (I). N = 4 control and N = 4 Lkb1-Ret animals. Scale bars = 25 µm. Data are represented as the mean ± the s.e.m. (B, E, H, ***p<0.001, **p<0.01, *p<0.05, unpaired t-test across rows corrected for multiple comparisons using the Holm-Sidak method) or as the distribution of length of horizontal cell neurites that form contacts with cones (C, F, I, *p<0.05, non-parametric Mann-Whitney Rank Sum U-test).
Figure 7
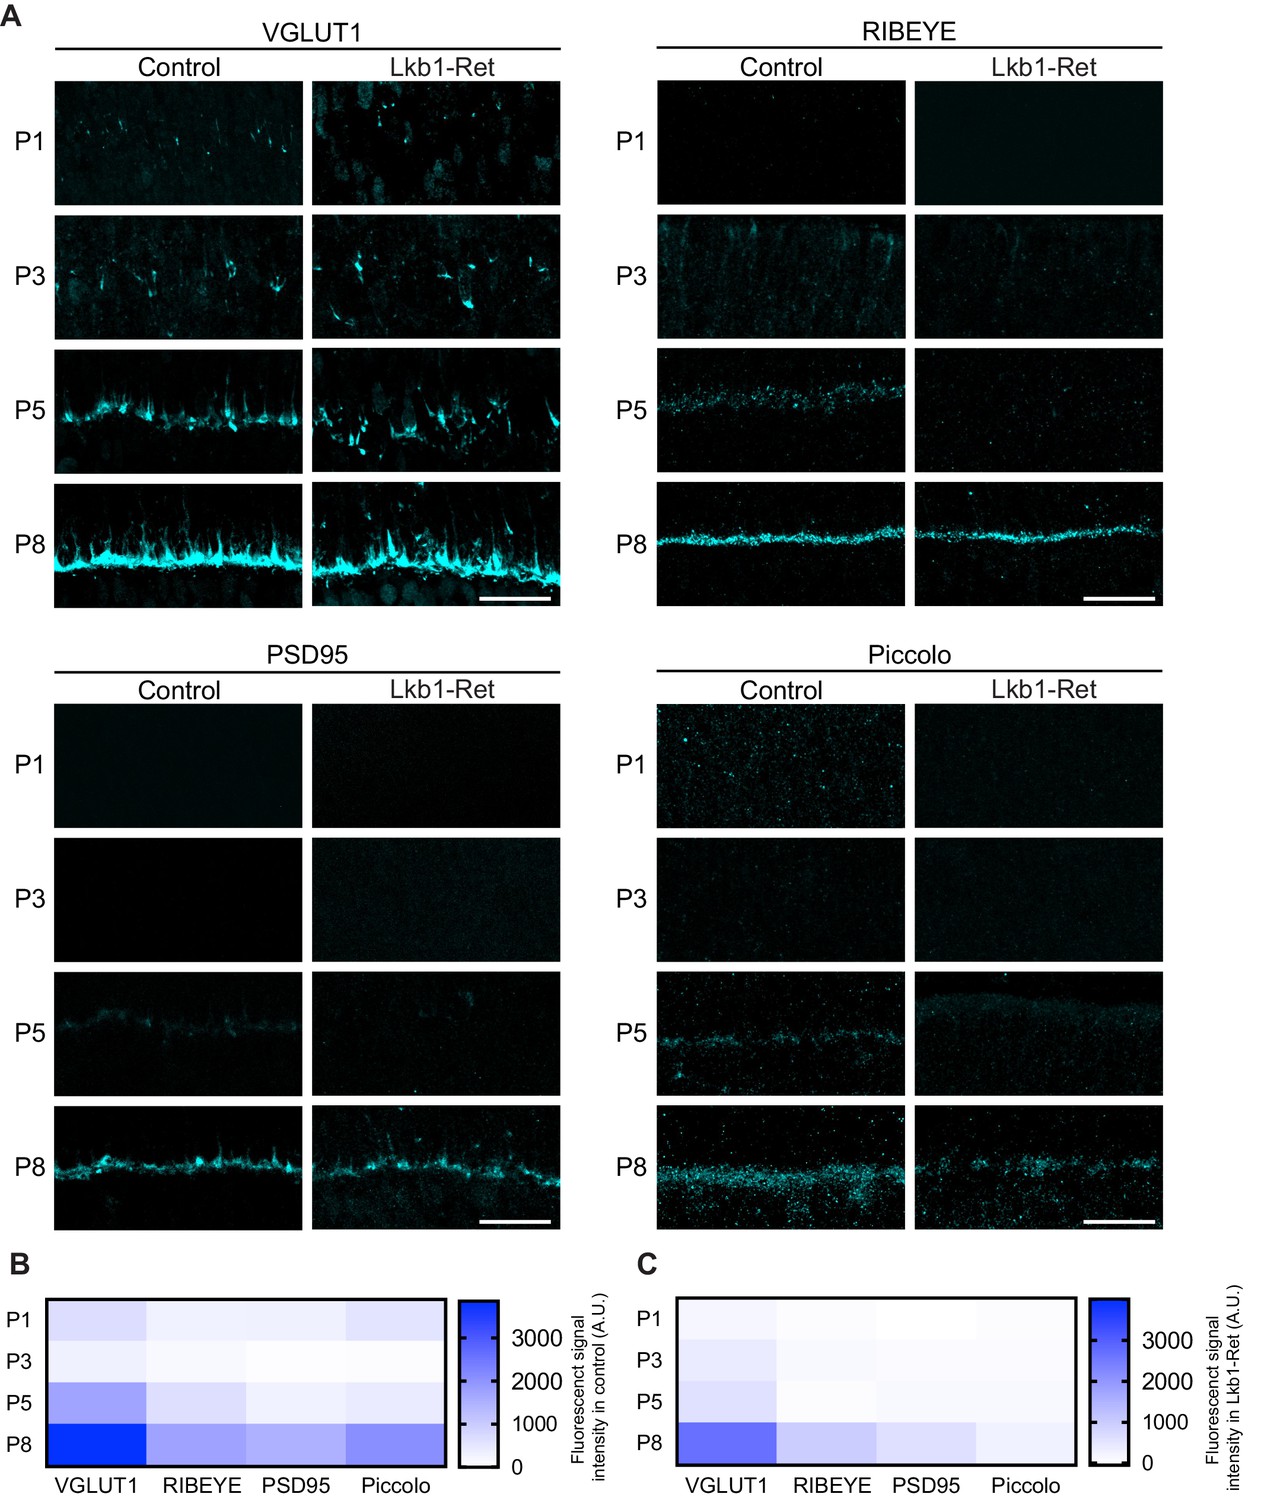
Synaptic protein distribution across development.
Outer retina synapse-associated proteins were stained and quantified over development to assess levels and localization. (A–C) Representative images (A) and quantification (B–C) of VGLUT1, RIBEYE, PSD95, and Piccolo at P1, P3, P5, and P8 in control and Lkb1-Ret animals. Data in (B) and (C) are presented as a heatmap indicating the corrected total cell fluorescence of each retinal layer occupied by the synapse protein signal using a gradient scale where white to blue depicts low to high levels of fluorescent intensity (0–3000, respectively). Scale bars = 25 µm.
Figure 8 with 1 supplement
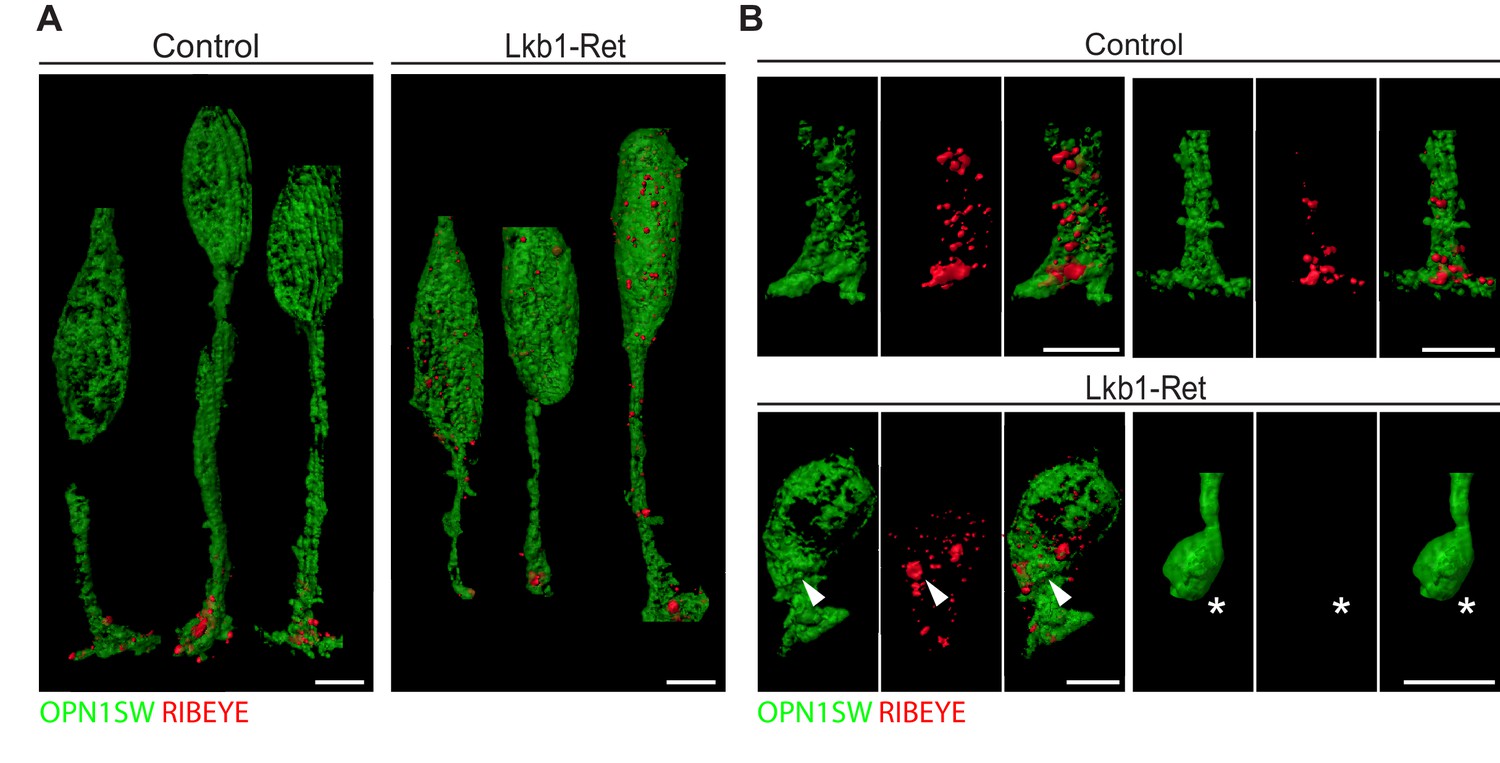
Expansion microscopy shows altered RIBEYE localization in LKB1 mutant cones.
(A) Representative reconstructions of cones from Lkb1-Ret animals and control littermates at P5 are shown following staining with RIBEYE (red) and OPN1SW (green). Samples were expanded, imaged, and reconstructed. (B) Reconstructed control and Lkb1-Ret cone terminals show RIBEYE localization defects in Lkb1-Ret animals. Unlike controls, RIBEYE is present in the cell soma (arrowhead) and can be absent from the cone terminal (star). Scale bars = 5 µm.
Figure 8—figure supplement 1
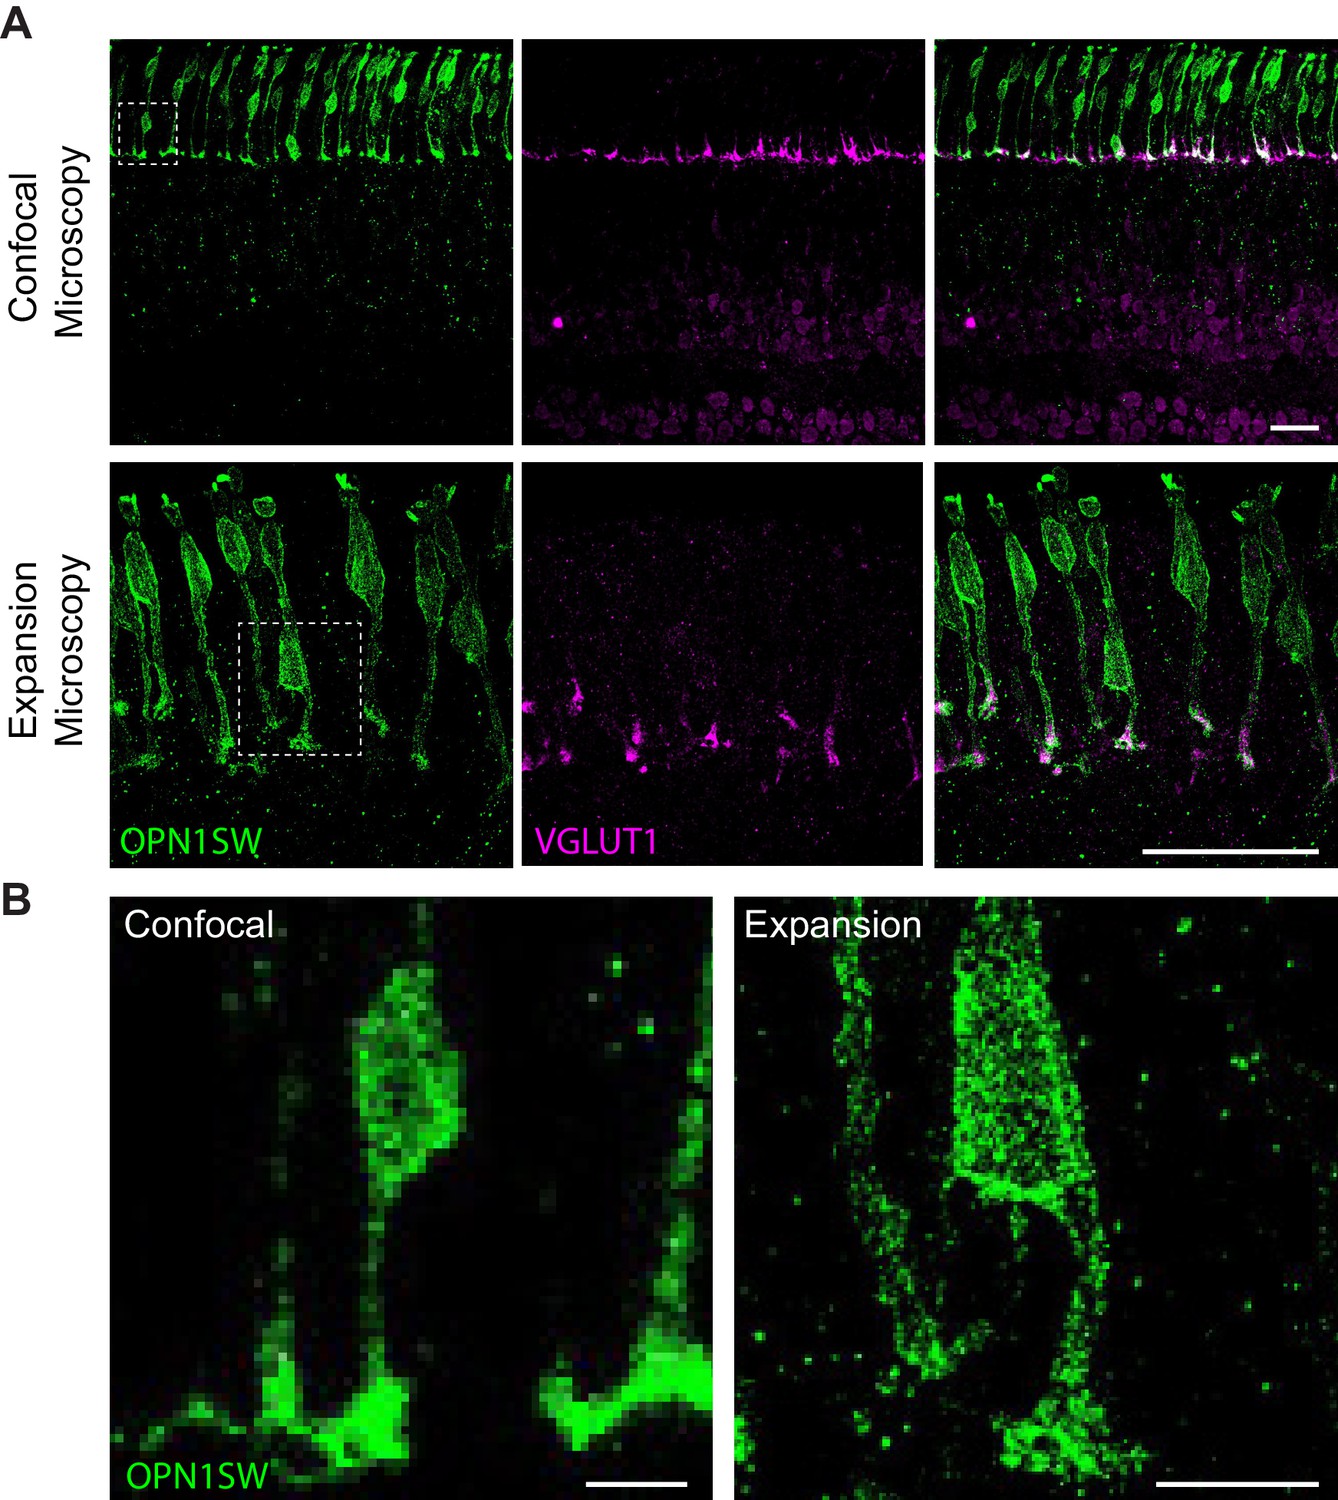
Expansion microscopy provides increased resolution of retinal neurons.
(A) Representative images of cones (OPN1SW, green) and VGLUT1 (magenta) at 60X magnification obtained through confocal or expansion microscopy. (B) Higher magnification images of the boxed regions in (A) of cones in confocal versus expansion microscopy reveals greater resolution of expanded cones. Scale bars = 25 µm (A) 5 µm (B).
Figure 9
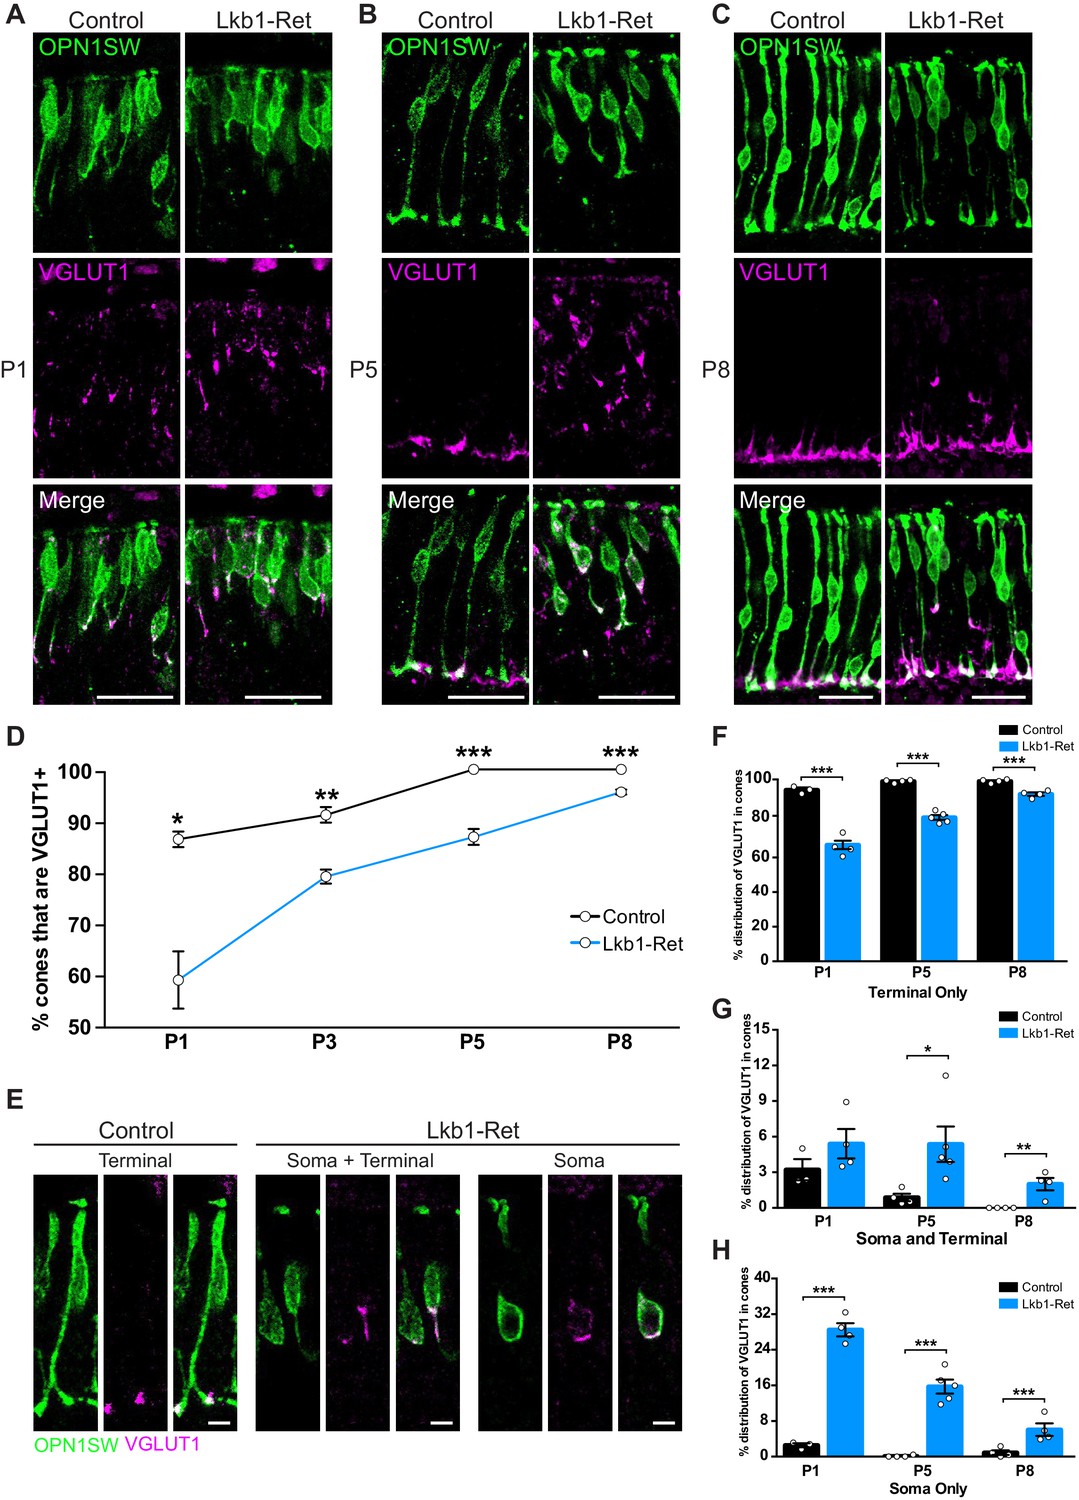
LKB1 regulates VGLUT1 levels and localization.
Cones were co-labeled with OPN1SW (green) and vesicular glutamate transporter 1 (VGLUT1, magenta) in Lkb1-Ret animals and control littermates. (A–C) At P1 (A), P5 (B), and P8 (C) Lkb1-Ret animals have a decreased number of cone terminals that are VGLUT1 positive and show displaced VGLUT1 localization relative to controls. (D) The number of cones that are VGLUT1 positive is significantly reduced in Lkb1-Ret animals relative to control littermates at all time points. (E) Representative images of VGLUT1 localization in single cones. In control animals, VGLUT1 is found primarily in the terminal (left panel), while Lkb1-Ret animals show cones with abnormal VGLUT1 localization within the cell soma and terminal or within the soma only (right panel). Scale bars = 5 µm. (F–H) Quantification of the number of cones that contain VGLUT1 only within the cone terminal (F), in the terminal and the soma (G), or only within the soma (H) at P1, P5, and P8. N ≥ 3 control and N ≥ 4 Lkb1-Ret animals. Scale bars = 25 µm. Data are represented as the mean ± the s.e.m. ***p<0.001, **p<0.01, *p<0.05, unpaired t-test across rows corrected for multiple comparisons using the Holm-Sidak method.
Figure 10 with 2 supplements
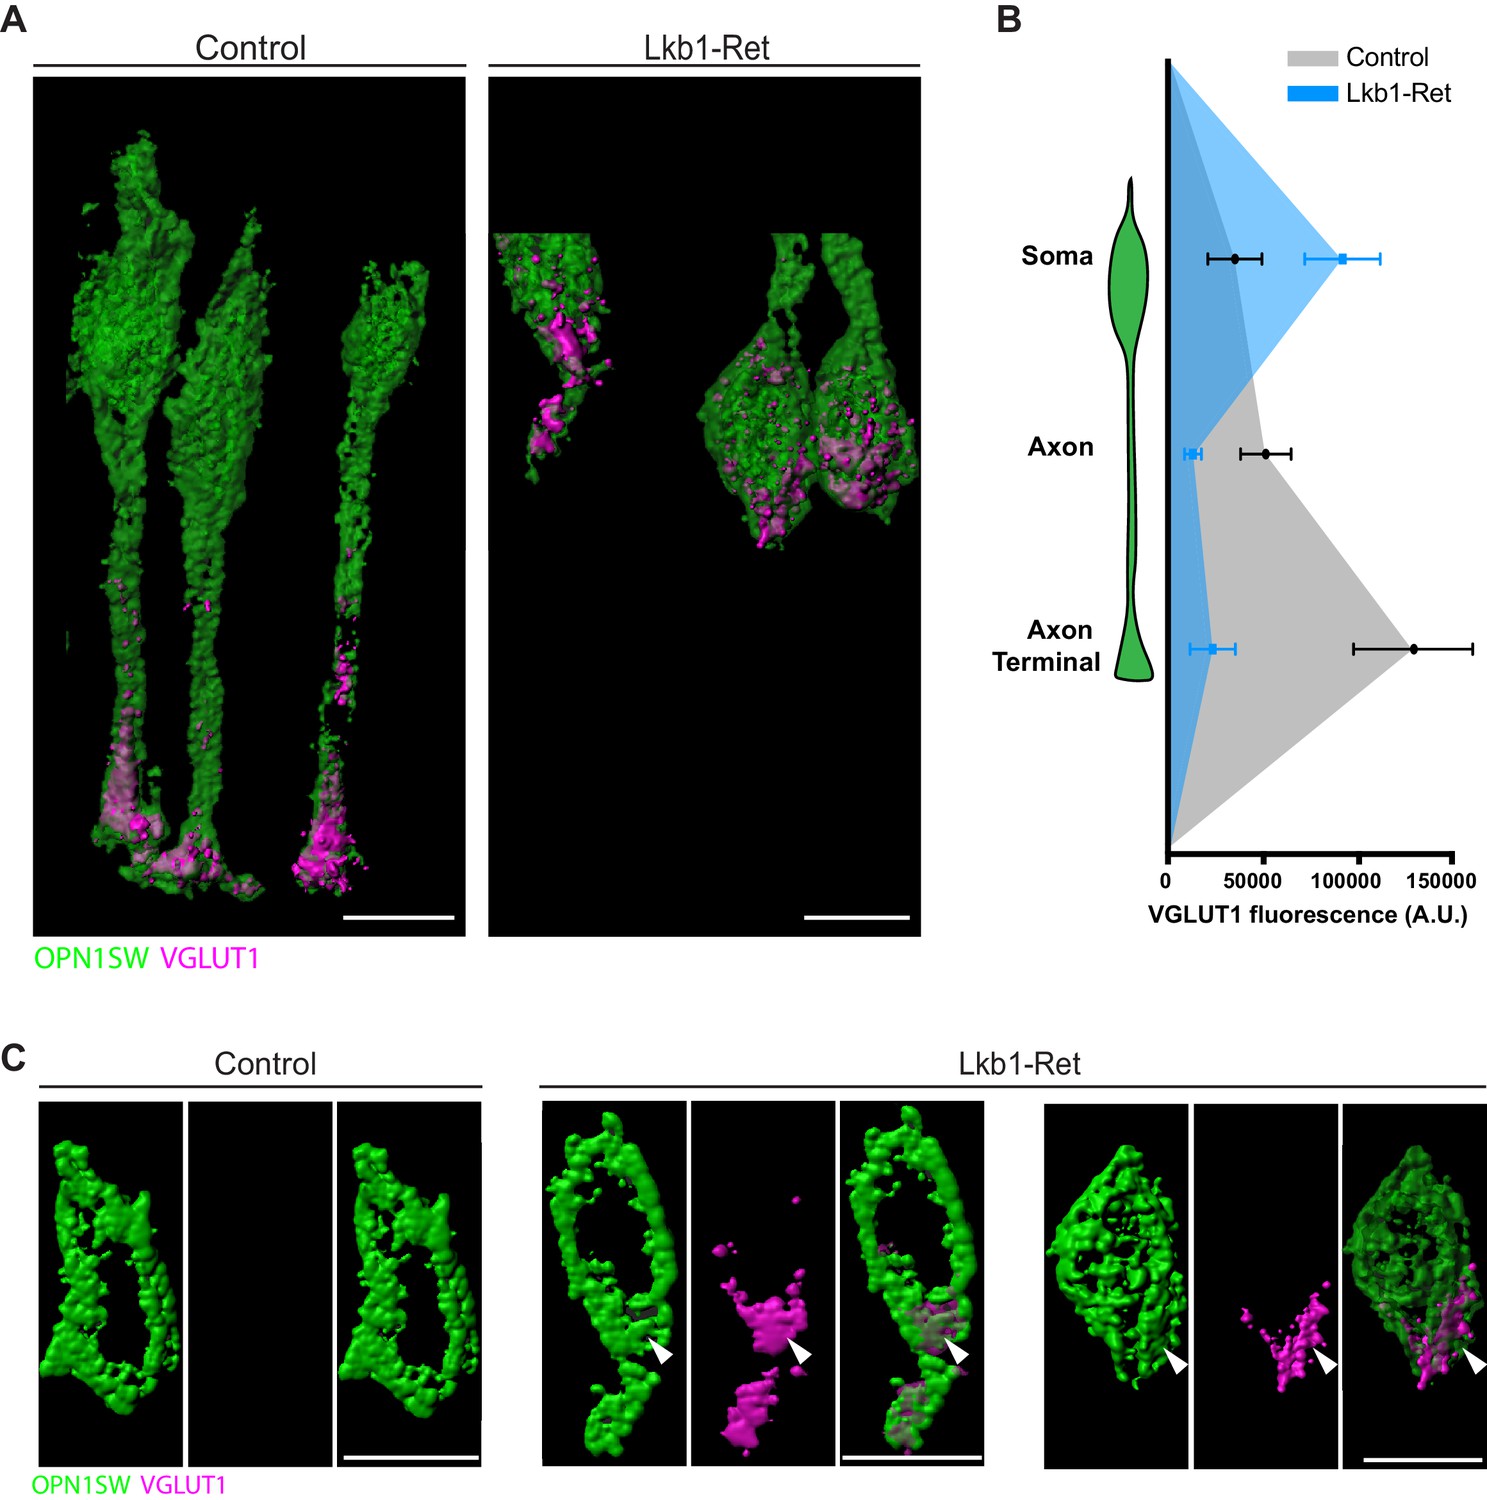
VGLUT1 is mislocalized in LKB1 mutant cone somas.
(A) Representative reconstructions of cones from Lkb1-Ret animals and control littermates at P5 are shown following staining with VGLUT1 (magenta) and OPN1SW (green). Samples were expanded, imaged, and reconstructed. (B) Quantification of VGLUT1 expression in the soma, axon, and axon terminal of cones in both control and Lkb1-Ret animals. Data are presented as a line graph indicating the corrected total cell fluorescence within each neuron compartment occupied by VGLUT1 signal. (C) Reconstructed control and Lkb1-Ret cone somas show morphological defects in Lkb1-Ret animals. VGLUT1 is highly localized to a bulge associated with the cell soma (arrowhead). Scale bars = 5 µm. Data are represented as the mean ± the s.e.m.
Figure 10—video 1
Reconstructed expanded cones reveal VGLUT1 distribution in control mice.
Representative reconstructions of cones from control littermates at P5 are shown following staining with VGLUT1 (magenta) and OPN1SW (green). Samples were expanded, imaged, and reconstructed. The majority of VGLUT1 is localized to the axon terminal and axon.
Figure 10—video 2
Reconstructed cones reveal mislocalized VGLUT1 in LKB1 mutant cone soma.
Representative reconstructions of cones from Lkb1-Ret animals at P5 are shown following staining with VGLUT1 (magenta) and OPN1SW (green). Samples were expanded, imaged, and reconstructed. The majority of VGLUT1 is localized to the soma.
Figure 11
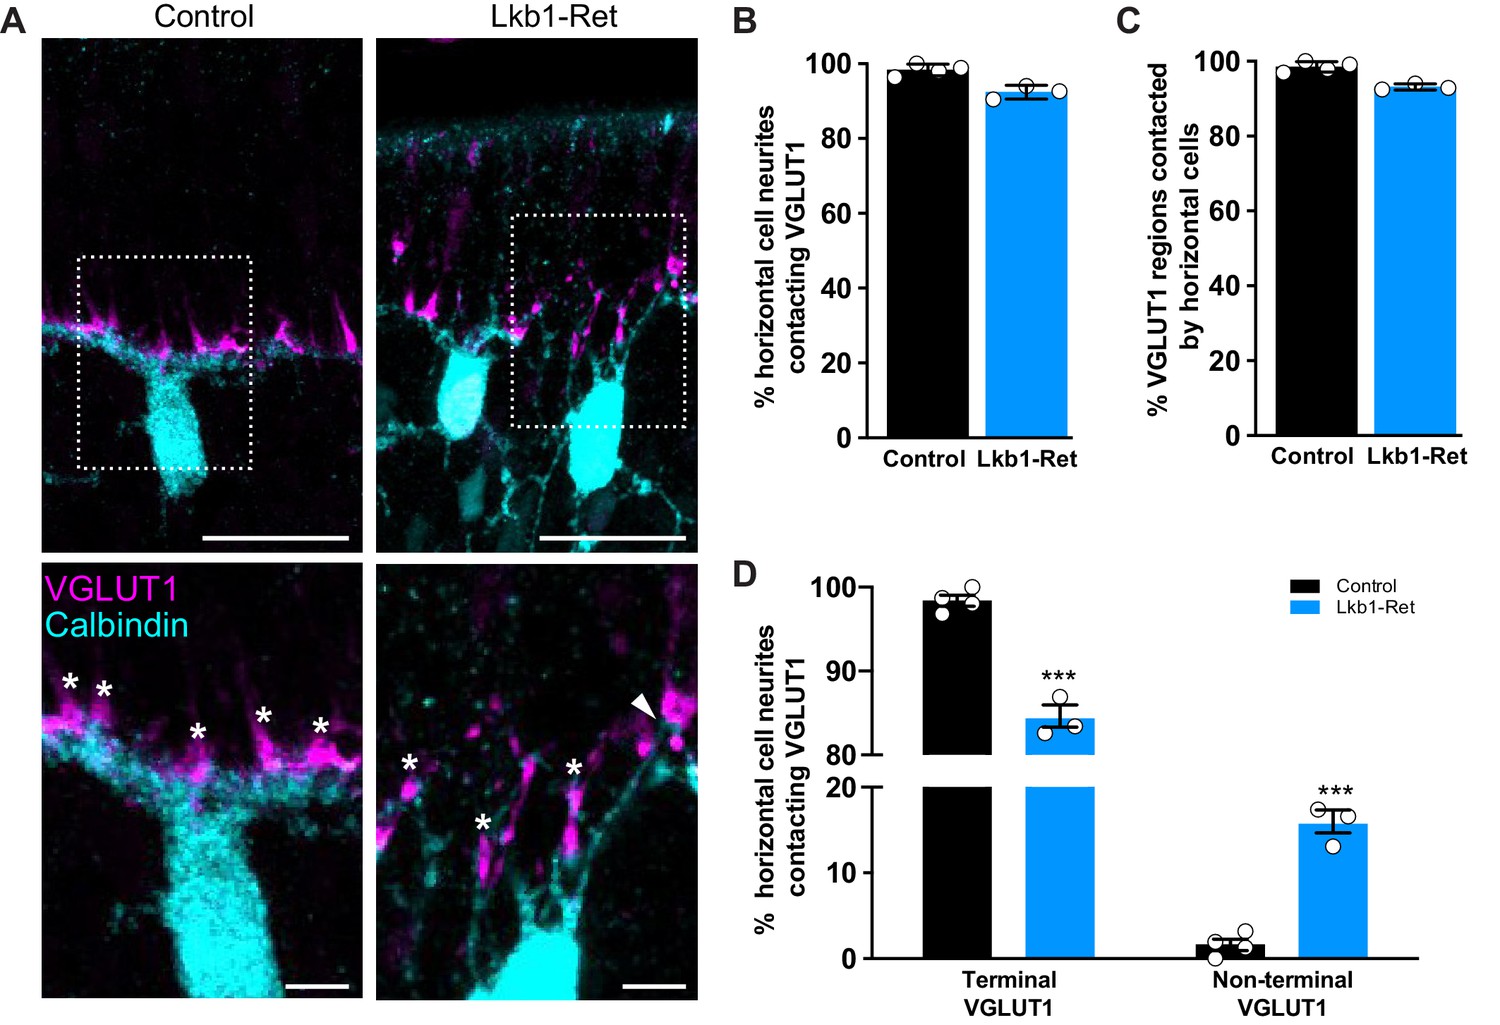
Horizontal cell neurites contact ectopic VGLUT1 locations.
(A) Representative images of horizontal cells (calbindin, cyan) and VGLUT1 (magenta) contacts at P5 in Lkb1-Ret mice and littermate controls are shown. The boxed area is presented as a higher magnification image highlighting horizontal cells contacting VGLUT1 at cone terminals (star) and at non-terminal cone positions (arrow). (B–C) The percent of horizontal cell processes contacting VGLUT1 (B) and the percent of VGLUT1 regions that were contacted by horizontal cells (C) were quantified at P5. Nearly all horizontal cell processes contacted VGLUT1 and nearly all VGLUT1 positive regions were contacted by horizontal cell processes. The relative percent of contacts did not significantly differ between control and Lkb1-Ret animals. N = 4 control and N = 3 Lkb1-Ret animals. (D) The relative location of horizontal cell processes contacting VGLUT1 at cone terminals and non-terminal cone positions were quantified at P5. There is a significant increase in horizontal cell processes contacting non-terminal VGLUT1 in cones in Lkb1-Ret animals compared to control. N = 4 control and N = 3 Lkb1-Ret animals. Scale bars = 25 µm (upper panel) and 5 µm (lower panel). Data are represented as the mean ± the s.e.m. (B,C, non-parametric Mann-Whitney Rank Sum U-test; D, ***p<0.001, unpaired t-test across rows corrected for multiple comparisons using the Holm-Sidak method).
Author response image 1
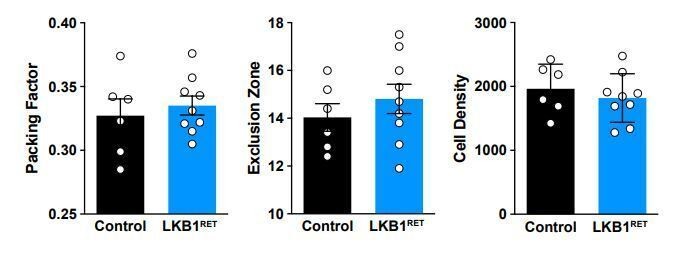
Author response image 2
Tables
Table 1
Antibodies used in LKB1 mutant tissue analysis.
Antibodies were utilized that label individual neuron populations and synapses in the outer retina.
| Antibody name | Immunogen | Labeling specificity | Source | Concentration |
|---|---|---|---|---|
| Calbindin D-28k | Full-length recombinant human Calbindin D-28K | Horizontal cells; amacrine cells; retinal ganglion cells | Novus biologicals; chicken polyclonal; NBP2-50028; no RRID | 1:2000 |
| Calbindin D-28k | Recombinant ratcalbindin D-28k (CB) | Horizontal cells; amacrine cells; retinal ganglion cells | Swant; rabbit polyclonal; CB38; RRID:AB_10000340 | 1:10,000 |
| Chx10 | Recombinant protein derived from the N terminal of the human Chx10 protein conjugated to KLH (aa 1–131) | Bipolar cells | Exalpha; sheep polyclonal; X1180P; RRID:AB_2314191 | 1:300 |
| OPN1SW | Peptide mapping at the N-terminus of the opsin protein encoded by OPN1SW of human origin | Cone photoreceptors | Santa Cruz; goat polyclonal; sc-14363; RRID:AB_2158332 | 1:500 |
| Piccolo | Recombinant protein corresponding to AA 4439 to 4776 from rat Piccolo | Ribbon synapses | Synaptic Systems; rabbit polyclonal; 142 003; RRID:AB_2160182 | 1:500 |
| Protein Kinase C alpha (PKCa) | Purified bovine brain protein kinase C | Rod bipolar cells | Abcam; mouse monoclonal; ab31; RRID:AB_303507 | 1:500 |
| PSD95 | Synthetic peptide corresponding to Mouse PSD95 aa1–100 (C-terminal) conjugated to keyhole limpet haemocyanin. | Photoreceptor terminals | Abcam; goat polyclonal; ab12093; RRID:AB_298846 | 1:500 |
| Rhodopsin | Recombinant fragment corresponding to Bovine Rhodopsin (N terminal) | Rod photoreceptors | Abcam; mouse monoclonal; ab98887; RRID:AB_10696805 | 1:500 |
| RIBEYE | Recombinant protein corresponding to AA95 to 207 from rat Ribeye | Ribbon synapses | Synaptic Systems; rabbit polyclonal; 192 103; RRID:AB_2086775 | 1:500 |
| VGLUT1 | Recombinant protein corresponding to AA456 to 560 from rat VGLUT1 | Photoreceptor terminals | Synaptic Systems; rabbit polyclonal; 135 302; RRID:AB_887877 | 1:500 |
Key resources table
| Reagent type (species) or resource | Designation | Source or reference | Identifiers | Additional information |
|---|---|---|---|---|
| Gene (Mus musculus) | Stk11 | Mouse Genome Informatics | MGI:1341870 NCBI Gene: 20869 | |
| Gene (Mus musculus) | Prkaa1 | Mouse Genome Informatics | MGI:2145955 NCBI Gene: 105787 | |
| Gene (Mus musculus) | Prkaa2 | Mouse Genome Informatics | MGI:1336173 NCBI Gene: 108079 | |
| Strain, strain background (Mus musculus, male and female) | Stk11F/F (previously called Lkb1F/F) | Bardeesy et al., 2002; DOI:10.1038/nature01045 | ||
| Strain, strain background (Mus musculus, male and female) | Prkaa1 F/F Prkaa2 F/F | Nakada et al., 2010; DOI:10.1038/nature09571 | ||
| Strain, strain background (Mus musculus, male and female) | Vsx2-Cre (previously calledChx10-Cre) | The Jackson Laboratory | RRID:IMSR_JAX:005105 | |
| Strain, strain background (Mus musculus, male and female) | Gja10-ires-iCre (previously called Cx57-ires-iCre) | Hirano et al., 2016; DOI:10.1523/ENEURO.0148–15.2016 | ||
| Antibody | Chicken polyclonal anti-Calbindin | Novus Biologicals | NBP2-50028 | IHC (1:2000) |
| Antibody | Rabbit polyclonal anti-Calbindin | Swant | CB38; RRID:AB-100000340 | IHC (1:10000) |
| Antibody | Sheep polyclonal anti-Chx10 | Exalpha | X1180P; RRID:AB_2314191 | IHC (1:300) |
| Antibody | Goat polyclonal anti-OPN1SW | Santa Crus | Sc-14363; RRID:AB_2158332 | IHC (1:500) |
| Antibody | Rabbit polyclonal anti-Piccolo | Synaptic Systems | 142003; RRID:AB_2160182 | IHC (1:500) |
| Antibody | Mouse monoclonal anti-Protein Kinase C α | Abcam | Ab31; RRID:AB_303507 | IHC (1:500) |
| Antibody | Goat polyclonal anti-PSD95 | Abcam | Ab12093; RRID:AB_298846 | IHC (1:500) |
| Antibody | Mouse monoclonal anti-rhodopsin | Abcam | Ab98887; RRID:AB_10696805 | IHC (1:500) |
| Antibody | Rabbit polyclonal anti-RIBEYE | Synaptic Systems | 192103; RRID:AB_2086775 | IHC (1:500) |
| Antibody | Rabbit polyclonal anti-VGLUT1 | Synaptic Systems | 135302; RRID:AB_887877 | IHC (1:500) |
| Commercial assay or kit | RNeasy Mini Kit | Qiagen | Cat. No. 74104 | |
| Commercial assay or kit | RNAscope Multiplex Fluorescent v2 | ACDbio | Cat. No. 323120 | |
| Other | RNAscope Probe-Mm-Stk11 | ACDbio | Cat. No. 469211 | |
| Chemical compound, drug | Acryloyl-X, SE | Thermofisher | Cat. No. A20770 | |
| Chemical compound, drug | TEMED | Thermofisher | Cat. No. 17919 | |
| Chemical compound, drug | APS | Sigma Aldrich | Cat. No. 248614 | |
| Chemical compound, drug | 4-Hydroxy-TEMPO | Sigma Aldrich | Cat. No. 176141 | |
| Chemical compound, drug | Sodium Acrylate | Sigma Aldrich | Cat. No. 408220 | |
| Chemical compound, drug | Acrylamide | Sigma Aldrich | Cat. No. A9099 | |
| Chemical compound, drug | N-N’-Methylenebisacrylamide | Sigma Aldrich | Cat. No. M7279 | |
| Chemical compound, drug | Sodium Chloride | Sigma Aldrich | Cat. No. S9888 | |
| Software, algorithm | ImageJ | NIH | https://imagej.nih.gov/ij/; RRID:SCR_003070 | |
| Software, algorithm | Imaris 7 | Oxford Instruments | RRID:SCR_007370 | |
| Software, algorithm | Prism7 | Graphpad | http://www.graphpad.com; RRID:SCR_002798 |
Additional files
-
Source code 1
OPL area quantification script.
- https://cdn.elifesciences.org/articles/56931/elife-56931-code1-v2.r
-
Source code 2
Neurite quantificaiton script.
- https://cdn.elifesciences.org/articles/56931/elife-56931-code2-v2.ijm
-
Transparent reporting form
- https://cdn.elifesciences.org/articles/56931/elife-56931-transrepform-v2.pdf
Download links
A two-part list of links to download the article, or parts of the article, in various formats.
Downloads (link to download the article as PDF)
Open citations (links to open the citations from this article in various online reference manager services)
Cite this article (links to download the citations from this article in formats compatible with various reference manager tools)
LKB1 coordinates neurite remodeling to drive synapse layer emergence in the outer retina
eLife 9:e56931.
https://doi.org/10.7554/eLife.56931


