Critical role of WNK1 in MYC-dependent early mouse thymocyte development
- The Francis Crick Institute, United Kingdom
- Kings College London, United Kingdom
- University of Birmingham, United Kingdom
- Imperial College, United Kingdom
Figures
Figure 1 with 1 supplement
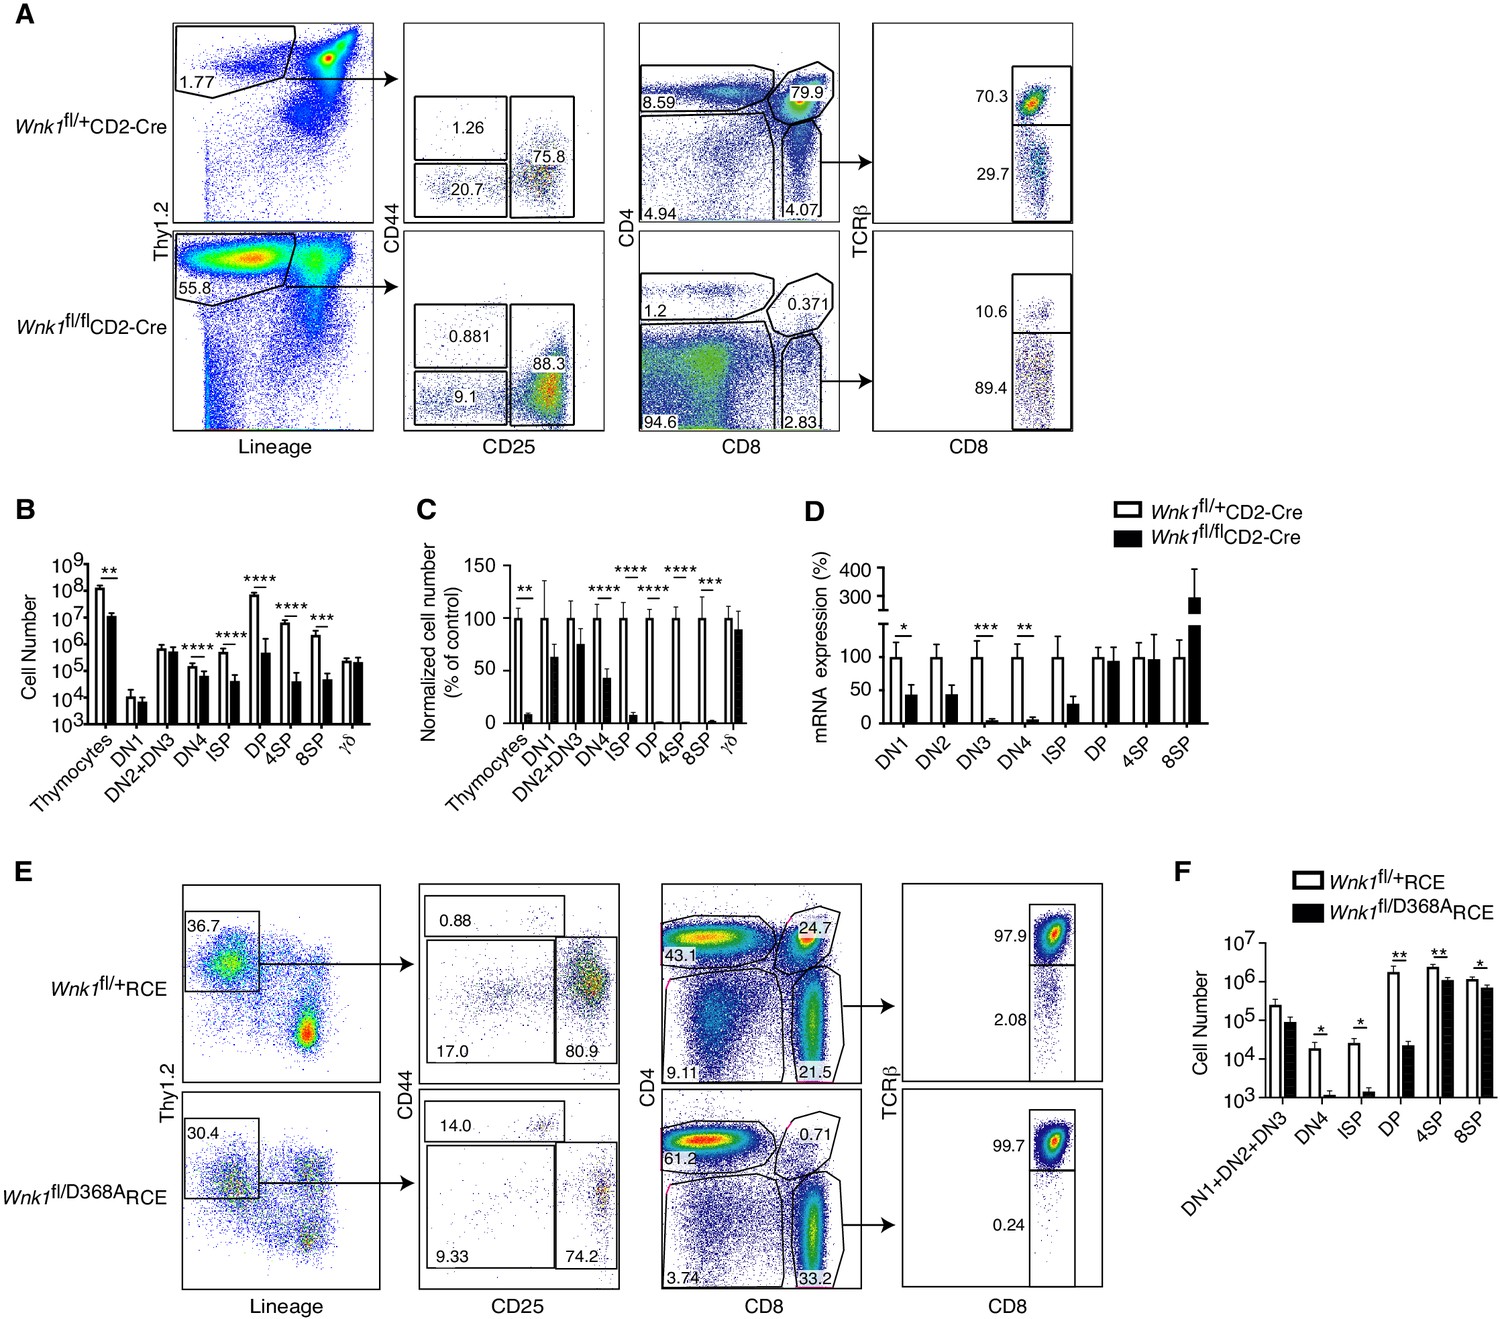
Essential role for WNK1 in thymocyte development.
(A) Flow cytometric analysis of thymocytes from Wnk1fl/+CD2-Cre and Wnk1fl/flCD2-Cre mice showing double negative (DN, Thy1.2+Lineage-) thymocytes subdivided into DN1 (CD44+CD25-), DN2+DN3 (CD25+), and DN4 (CD44-CD25-) subsets, immature single positive (ISP, CD4-CD8+TCRβ-), double positive (DP, CD4+CD8+), CD4+ single positive (4SP, CD4+CD8-), and CD8+ single positive (8SP, CD4-CD8+TCRβ+) thymocytes. Numbers show % of cells falling into each gate. (B) Mean ± SEM number of total thymocytes and of thymocytes at each developmental stage defined using the gates in A, as well as γδ thymocytes (CD4-TCRγ+). (C) Mean ± SEM number of cells in each thymocyte population in Wnk1fl/flCD2-Cre animals normalized to Wnk1fl/+CD2-Cre controls (set to 100%). (D) Mean ± SEM Wnk1 mRNA levels in thymic subsets from Wnk1fl/+CD2-Cre and Wnk1fl/flCD2-Cre mice, normalized to Wnk1fl/+CD2-Cre controls (set to 100%) measured by Q-PCR from exon 1 to exon 2. CD44 levels were used to separate DN2 (CD44+) and DN3 (CD44-) thymocytes. (E) Flow cytometric analysis of Rag1-/- radiation chimeras reconstituted with bone marrow from Wnk1fl/+RCE and Wnk1fl/D368ARCE mice, treated with tamoxifen and analyzed 7 d later showing gating for thymocyte subsets as in A, with DN (Thy1.2+Lineage-) thymocytes pre-gated on CD4-CD8- cells. (F) Mean ± SEM number of cells in thymocyte subsets of Rag1-/- chimeras as in E. *0.01 < p < 0.05, ** 0.001 < p < 0.01, and ***p<0.001. Significance calculated by Mann-Whitney test. Sample sizes: five Wnk1fl/+CD2-Cre and six Wnk1fl/flCD2-Cre mice (B, C), seven (D), and six (F) of each genotype. Data are pooled from two independent experiments.
Figure 1—figure supplement 1
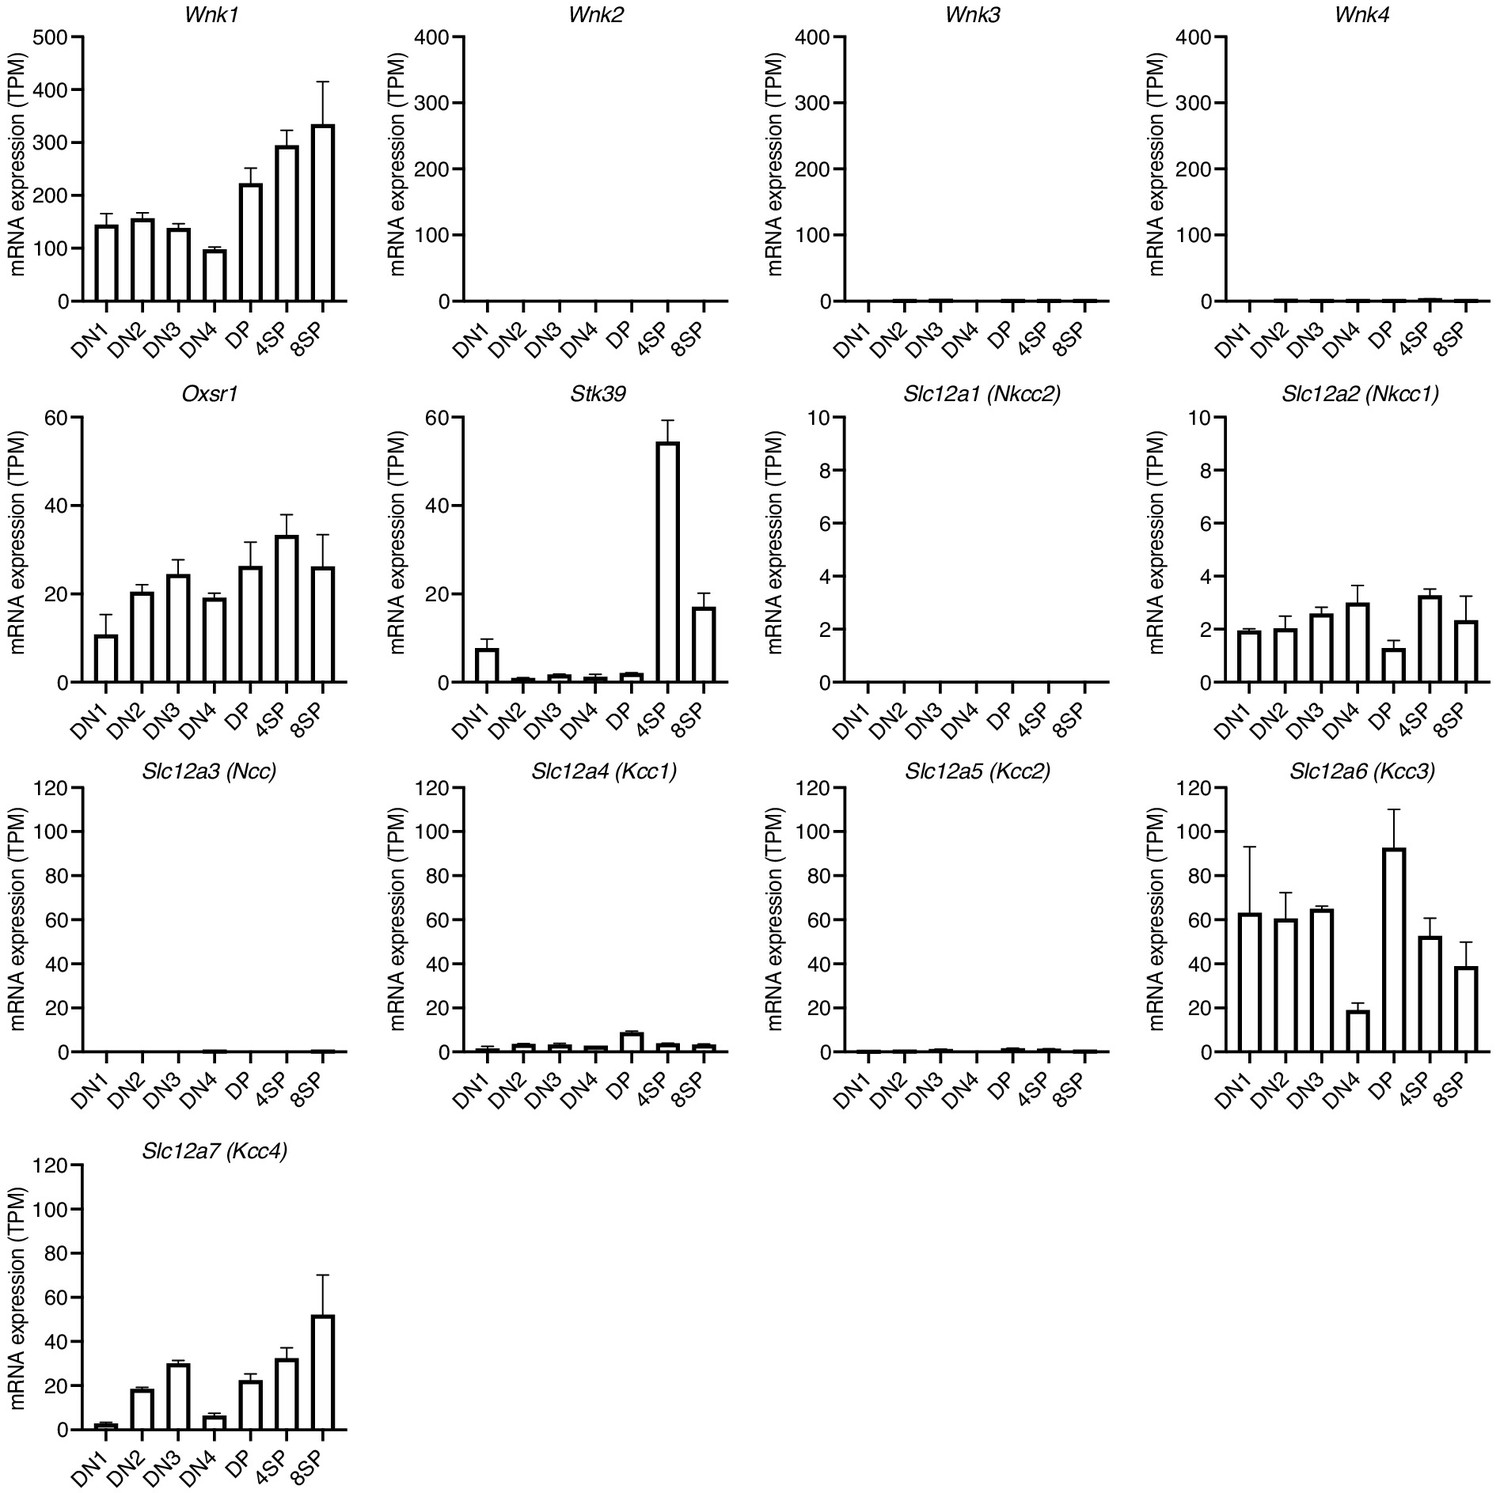
Expression of genes encoding WNK pathway proteins.
Mean ± SEM expression of genes in the WNK1 pathway in the indicated thymocyte subsets, re-analyzed from previously published data (Hu et al., 2013).
Figure 2
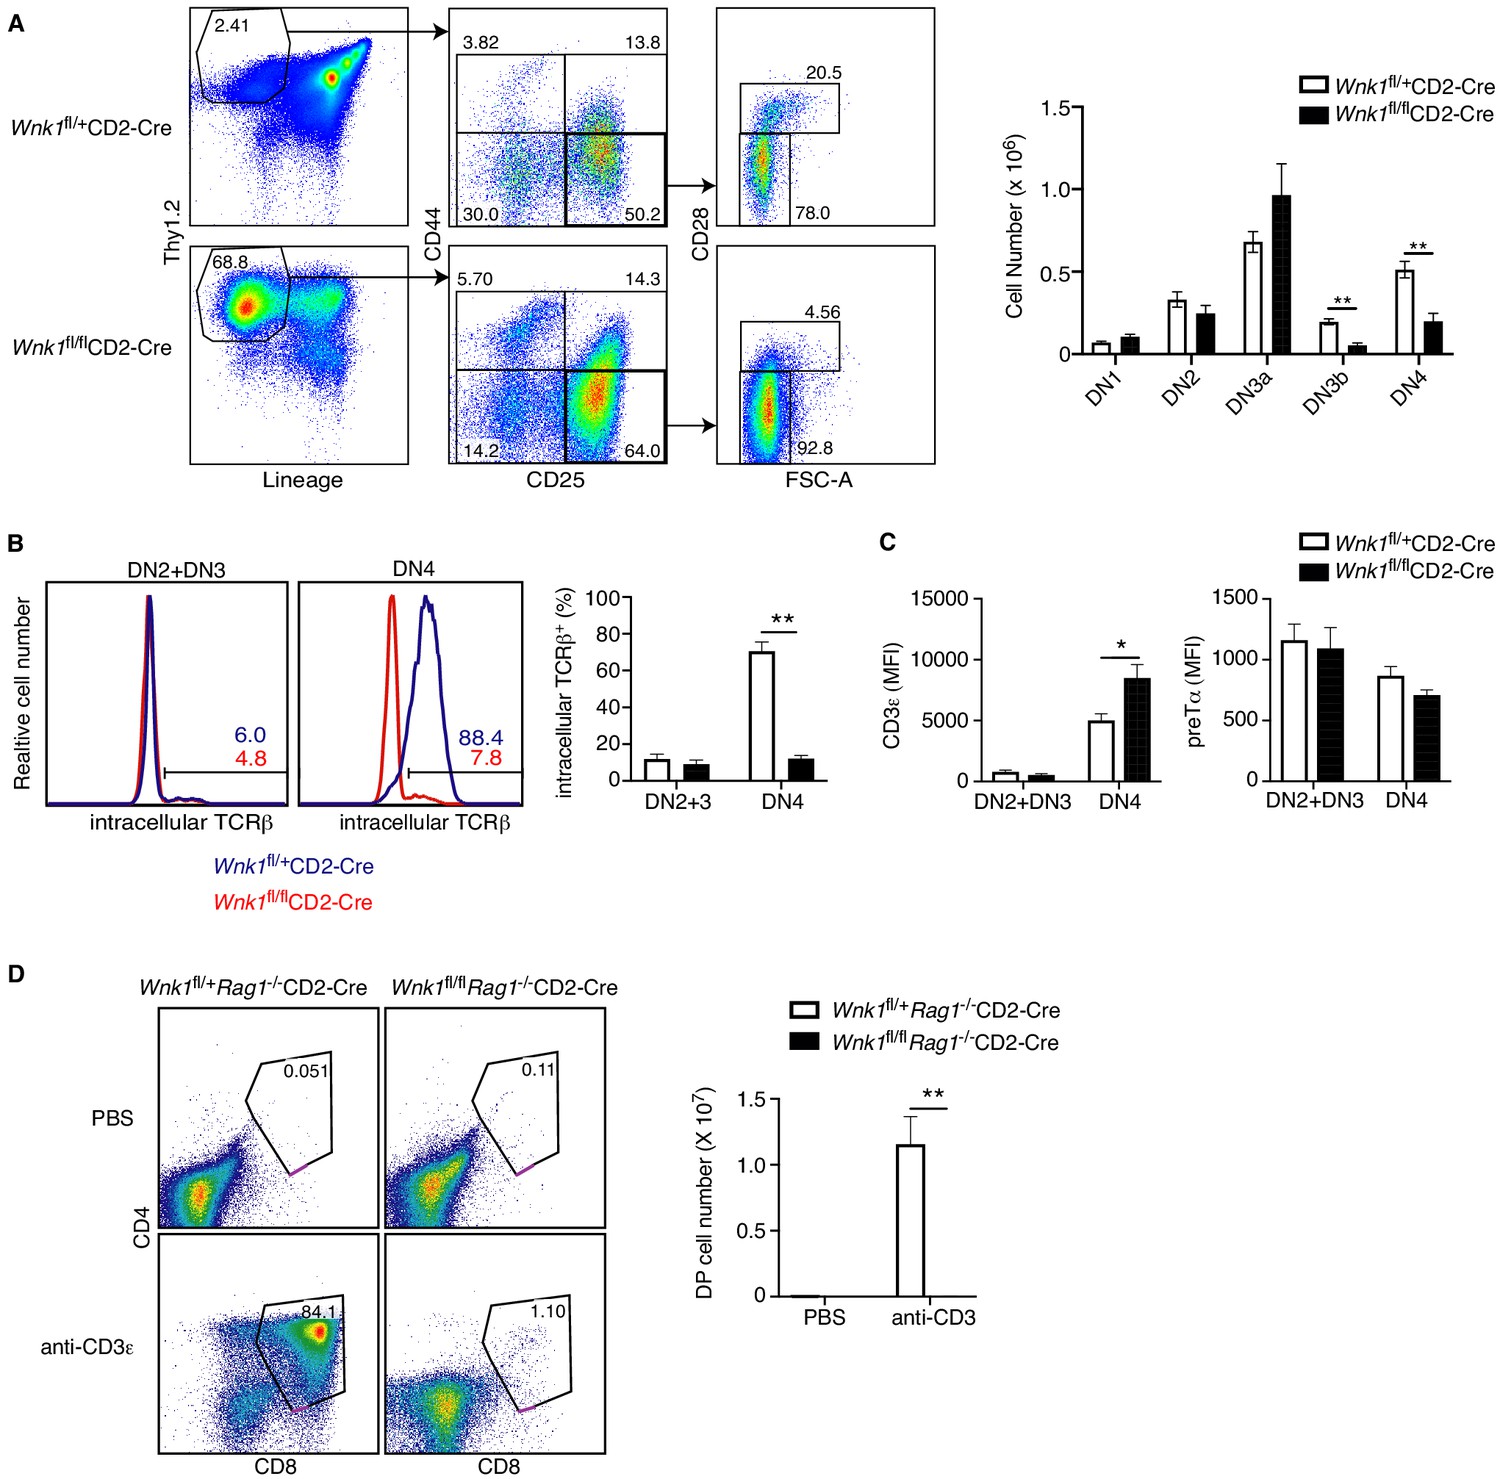
WNK1 is required for thymocytes to develop past the pre-TCR checkpoint.
(A) Left: flow cytometric analysis of Thy1.2+Lineage- thymocytes separated by expression of CD44 and CD25, and then DN3 (CD44-CD25+) cells separated into DN3a (small, FSClowCD28-) and DN3b (large, FSChighCD28+) cells. Right: Mean ± SEM cell numbers in DN subsets. (B) Left: Flow cytometric analysis of thymocytes from Wnk1fl/+CD2-Cre and Wnk1fl/flCD2-Cre mice showing intracellular TCRβ levels in DN2+DN3 and DN4 subsets. Numbers indicate the percentage of TCRβ+ cells. Right: Mean ± SEM percentage of DN2+DN3 and DN4 cells that are intracellular TCRβ+. (C) Mean ± SEM of CD3ε or pre-Tα surface levels measured as mean fluorescence intensity (MFI) in flow cytometry of DN2+DN3 and DN4 thymocytes from Wnk1fl/+CD2-Cre and Wnk1fl/flCD2-Cre mice. (D) Left: flow cytometric analysis of CD4 and CD8 levels on thymocytes from Wnk1fl/+Rag1-/-CD2-Cre and Wnk1fl/flRag1-/-CD2-Cre mice harvested 4 d after intraperitoneal injection with PBS or anti-CD3ε antibody. Gate indicates DP thymocytes and number shows percentage of cells in the gate. Right: mean ± SEM number of DP thymocytes defined using the gates on the left. *0.01<p<0.05, and **p<0.01. Significance calculated by Mann-Whitney test. Sample sizes: six of each genotype (A, B), eight Wnk1fl/+CD2-Cre and ten Wnk1fl/flCD2-Cre mice (C), four Wnk1fl/+Rag1-/-CD2-Cre and Wnk1fl/flRag1-/-CD2-Cre mice injected with PBS and five Wnk1fl/+Rag1-/-CD2-Cre and Wnk1fl/flRag1-/-CD2-Cre mice injected with anti-CD3ε (D). Data are pooled from two independent experiments.
Figure 3
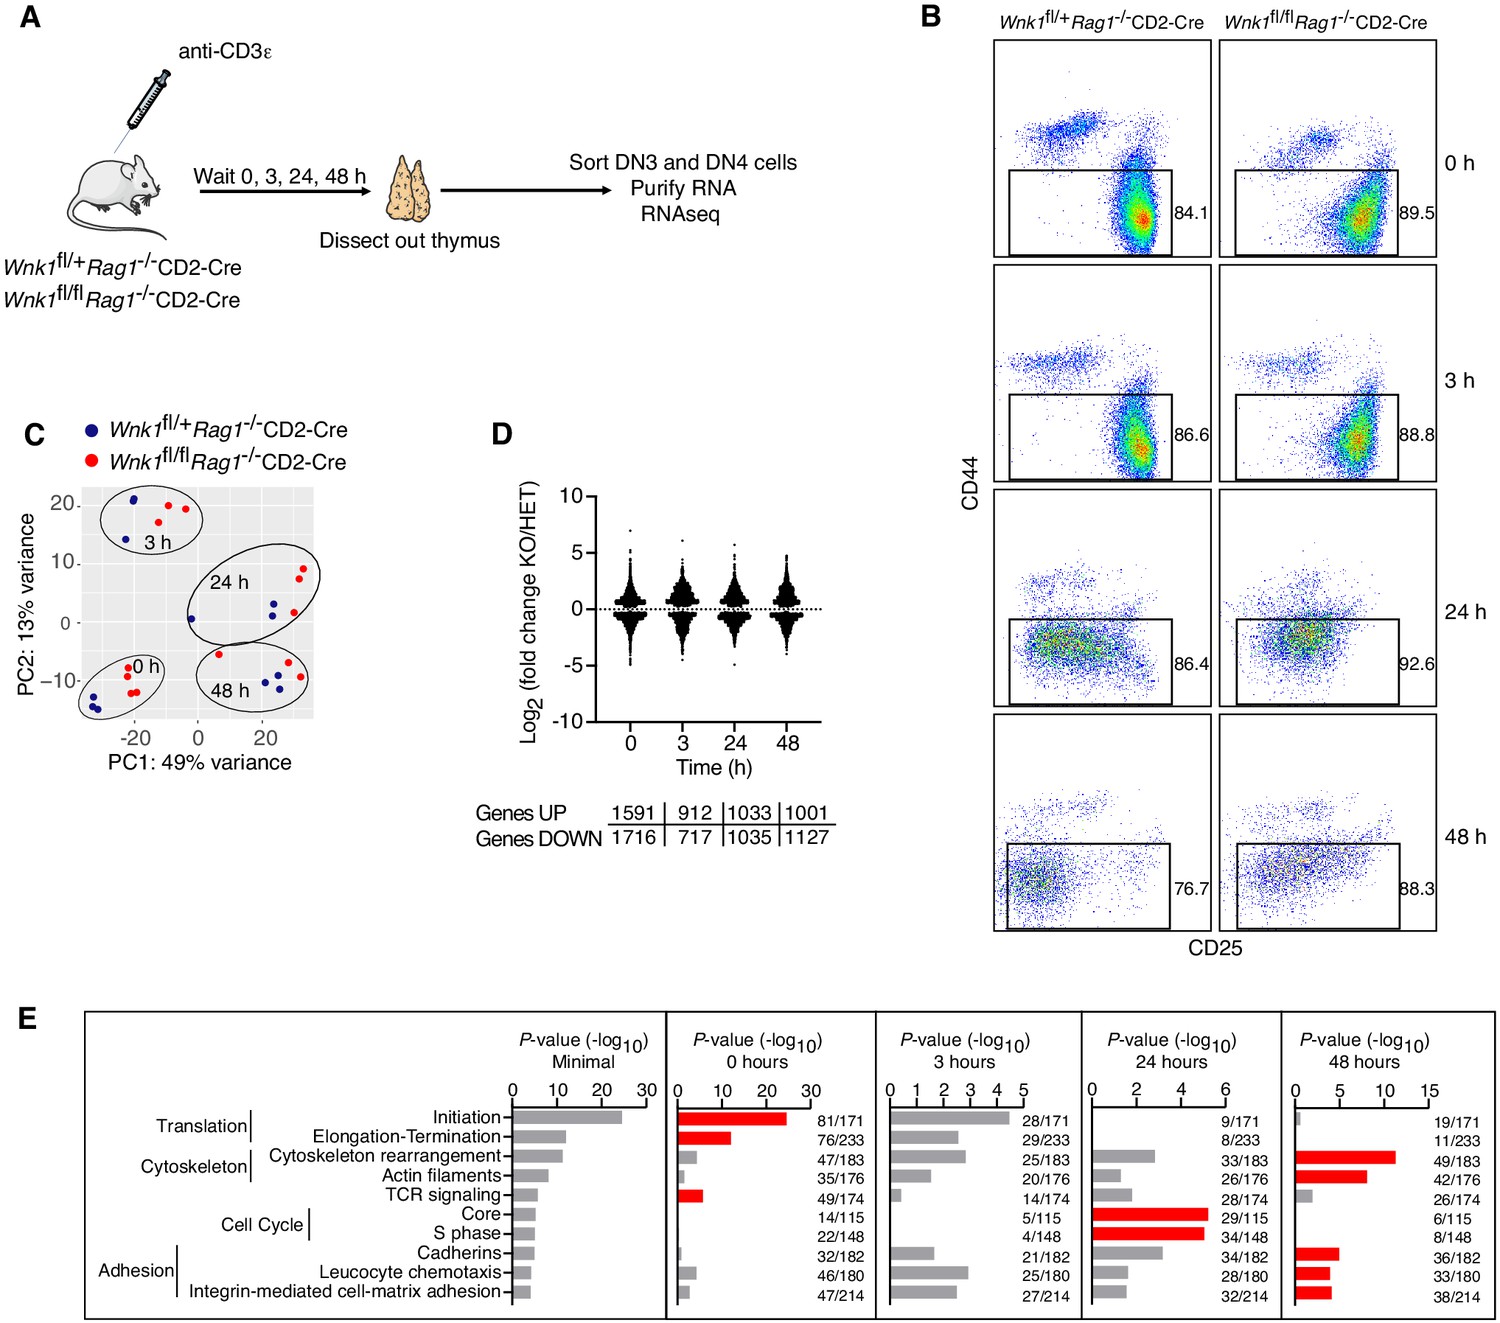
RNAseq of WNK1-deficient thymocytes reveals significant changes in five distinct processes.
(A) Thymi were harvested from Wnk1fl/+Rag1-/-CD2-Cre and Wnk1fl/flRag1-/-CD2-Cre mice that were either untreated (0 hr) or had been injected with anti-CD3ε antibody 3, 24 or 48 hr earlier. DN3+DN4 thymocytes were sorted, RNA purified and analyzed by RNAseq, results of which are shown in C-E. (B) Flow cytometric analysis of DN thymocytes from the experiment described in A. Gates indicate cells (Thy1.2+, CD44-) that were sorted for further RNAseq analysis. (C) Principal component analysis using expression of all normalized genes for all samples from the experiment described in A. (D) Log2 fold changes and total number of statistically significant differentially expressed genes (DEGs) in samples from Wnk1fl/flRag1-/-CD2-Cre (KO) mice compared to Wnk1fl/+Rag1-/-CD2-Cre (HET) mice at each time point (Supplementary files 2, 3). (E) Metacore process analysis of DEGs. Selected processes and their P-values are shown at each time point; graph on left shows the lowest P-value for each process from any of the four time points. Red bars indicate time point with the lowest P-values for each process (Minimal). Ratios indicate the number of DEGs at each time point over the number of all genes in the indicated processes. Significance calculated by Wald’s test (D) and Hypergeometric test (E). Sample sizes: three Wnk1fl/+Rag1-/-CD2-Cre and four Wnk1fl/flRag1-/-CD2-Cre mice for 0 hr time point, three mice of each genotype for all other time points; data are from one experiment.
Figure 4 with 1 supplement
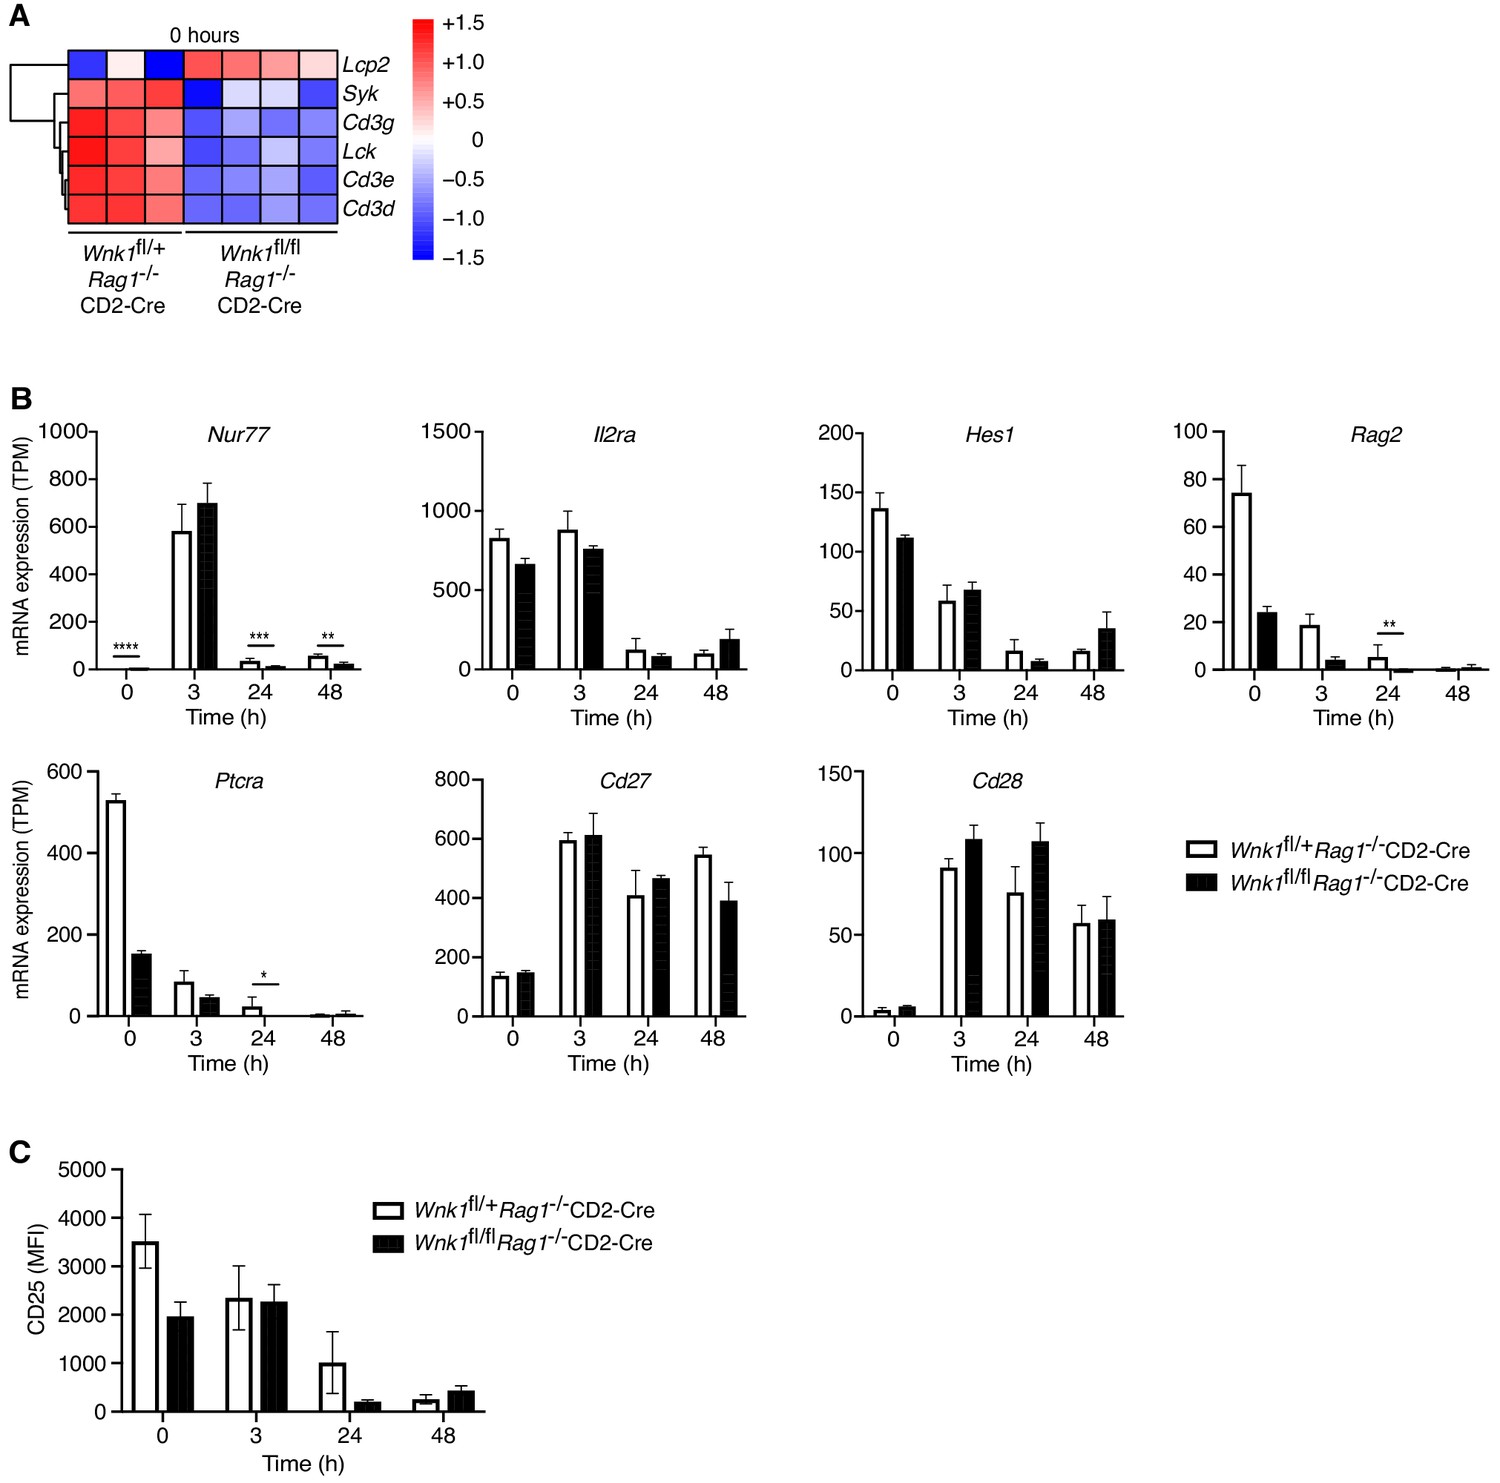
WNK1 deficiency does not perturb early pre-TCR-induced signaling.
(A) Analysis of RNAseq experiment described in Figure 3A, showing heatmap and hierarchical clustering of selected genes from the TCR signaling signature at 0 hr in Wnk1fl/+Rag1-/-CD2-Cre and Wnk1fl/flRag1-/-CD2-Cre mice. Red and blue colors indicate increased or decreased expression of indicated genes relative to the mean expression of each row using normalized log2 expression values. (B) Mean ± SEM expression of selected genes; TPM, transcripts per million reads. (C) Mean ± SEM surface levels of CD25 on CD44- thymocytes analyzed as in Figure 3B. *0.01 < p < 0.05, ** 0.001 < p < 0.01, ***0.0001 < p < 0.001, ****p<0.0001. Significance displayed in (B) is from the analysis of the RNAseq data and was calculated by the Wald test (Supplementary file 3). Sample sizes: three Wnk1fl/+Rag1-/-CD2-Cre and four Wnk1fl/flRag1-/-CD2-Cre mice for 0 hr time point and three mice of each genotype for all other time points. Data are from one experiment.
Figure 4—figure supplement 1
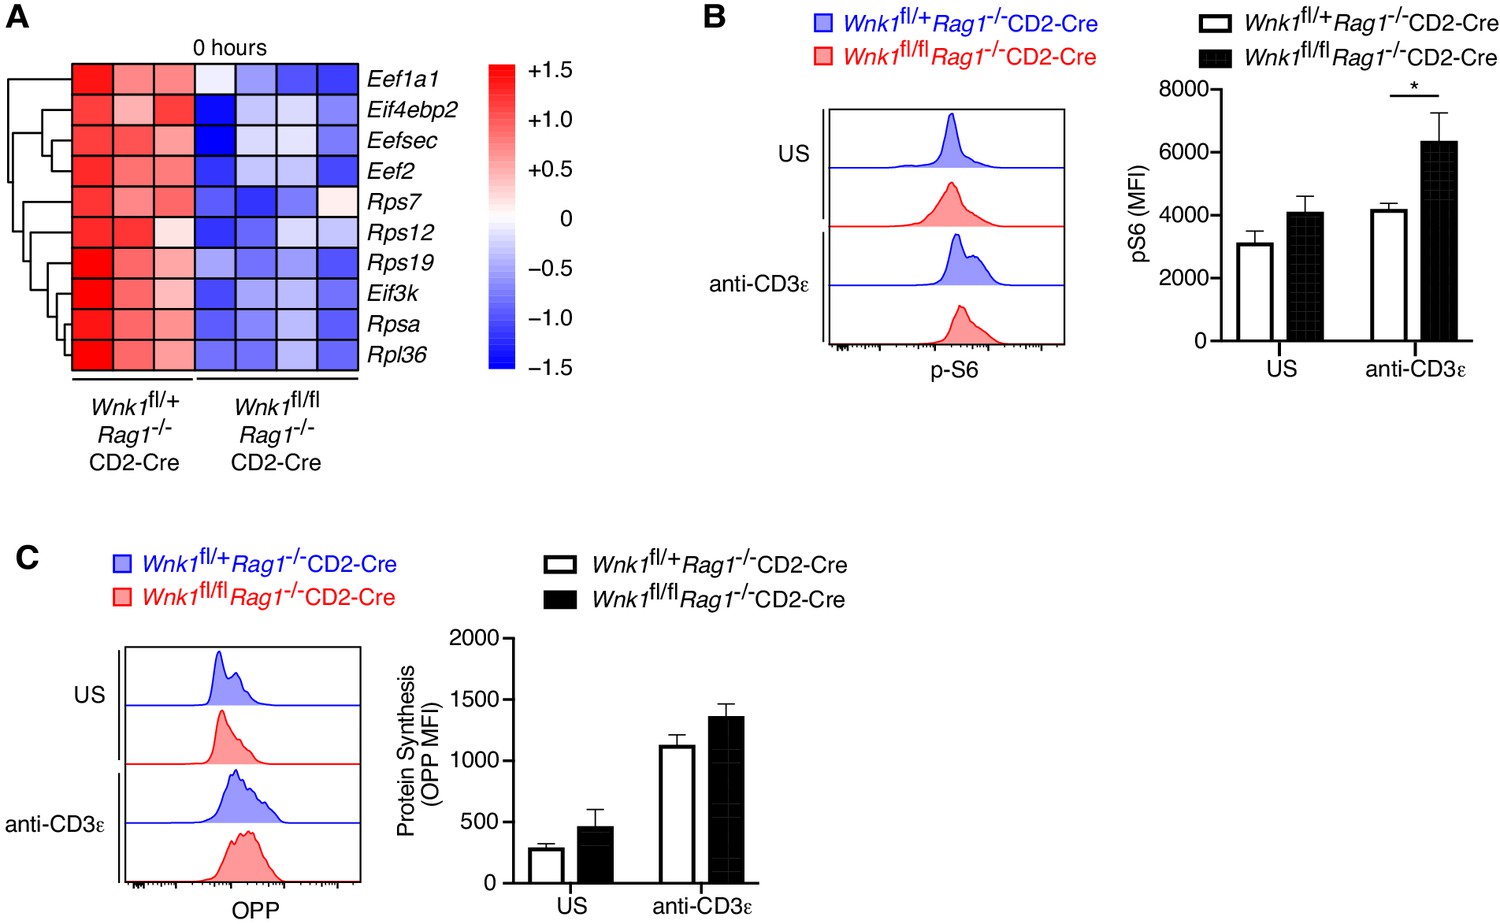
WNK1 deficiency does not perturb protein translation.
(A) Analysis of RNAseq experiment described in Figure 3A, showing heatmap and hierarchical clustering of selected genes from the translation signature at 0 hr. (B) Histograms showing levels of phospho-S6 (pS6) in CD44- DN thymocytes from Wnk1fl/+Rag1-/-CD2-Cre and Wnk1fl/flRag1-/-CD2-Cre mice either unstimulated (US) or 24 hr after anti-CD3ε injection; column graphs show mean ± SEM pS6 levels. (C). Histograms showing rate of protein synthesis measured by O-propargyl-puromycin (OPP) incorporation in CD44- DN thymocytes from Wnk1fl/+Rag1-/-CD2-Cre and Wnk1fl/flRag1-/-CD2-Cre mice, stimulated as in B; column graphs show mean ± SEM rate of protein synthesis. *0.01 < p < 0.05. Significance calculated by Mann-Whitney test. Sample sizes: five (B) and four (C) of each genotype. Data are pooled from two experiments.
Figure 5
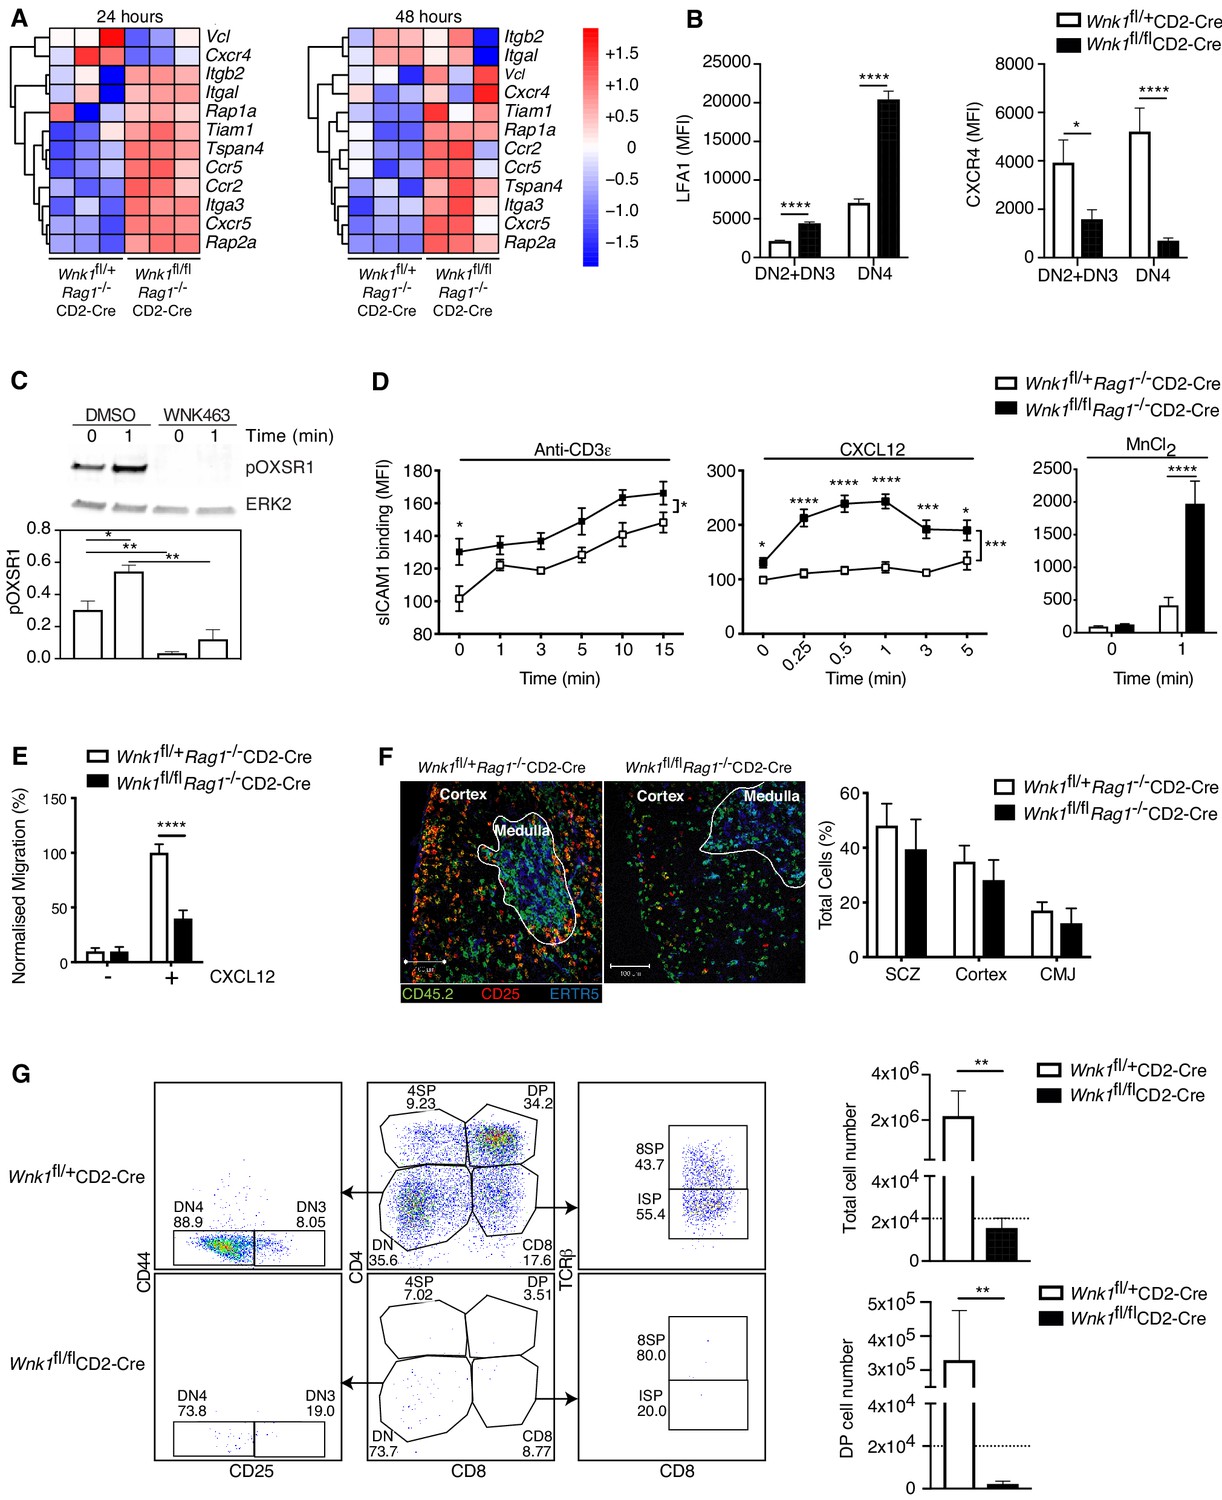
WNK1 regulates thymocyte migration and adhesion.
(A) Heatmap and hierarchical clustering of selected genes from the adhesion signature at 24 and 48 hr after injection of anti-CD3ε into Wnk1fl/+Rag1-/-CD2-Cre and Wnk1fl/flRag1-/-CD2-Cre mice from the experiment described in Figure 3A. (B) Mean ± SEM LFA1 and CXCR4 surface levels in DN2+DN3 and DN4 thymocytes, pre-gated on double negative (TCRβ-, Thy1.2+, Lineage-) thymocytes, from Wnk1fl/+CD2-Cre and Wnk1fl/flCD2-Cre mice. (C) Top, representative immunoblot analysis of phosphorylated OXSR1 (pOXSR1) and ERK2 in total Rag1-/- thymocytes incubated with DMSO or WNK463 and stimulated for 0 or 1 min with CXCL12. Below, quantification of pOXSR1 normalized to the abundance of ERK2. (D) Binding of soluble ICAM1 complexes to mouse DN2+DN3 thymocytes from Wnk1fl/+Rag1-/-CD2-Cre and Wnk1fl/flRag1-/-CD2-Cre mice in response to treatment for various times with anti-CD3ε, CXCL12 or MnCl2. (E) Migration of mouse DN2+DN3 thymocytes from the top chamber to the bottom chamber of a Transwell plate in the presence (+) or absence (-) of CXCL12. (F) Left: representative images of frozen thymus sections from lethally irradiated B6.SJL mice, reconstituted with a 80:20 mixture of bone marrow from B6.SJL (CD45.2-) and either Wnk1fl/+Rag1-/-CD2-Cre or Wnk1fl/flRag1-/-CD2-Cre mice (both CD45.2+), stained with antibodies to the indicated antigens, as well as antibodies to CD11b and CD11c (not shown). Right: distribution of Wnk1fl/+Rag1-/-CD2-Cre or Wnk1fl/flRag1-/-CD2-Cre derived DN2+DN3 (CD25+CD45.2+CD11b-CD11c-) thymocytes between the subcapsular zone (SCZ), cortex and cortico-medullary junction (CMJ) as defined by the ERTR5 staining for medullary epithelial cells. (G) Left: flow cytometric analysis of DN2+DN3 thymocytes from Wnk1fl/+CD2-Cre and Wnk1fl/flCD2-Cre mice after culturing on OP9-DL1 cells for 7 d. Gates indicate DN (CD4-CD8-), DN3 (CD4-CD8-CD25+CD44-), DN4 (CD4-CD8-CD25-CD44-), ISP (CD4-CD8+TCRβ-) DP (CD4+CD8+), 4SP (CD4+CD8-) and 8SP (CD4-CD8+TCRβ+) cells. Right: mean ± SEM number of all cells and number of DP cells recovered after 7 d. Dashed line indicates number of cells seeded into the cultures on day 0. *0.01 < p < 0.05, ** 0.001 < p < 0.01, ***0.0001 < p < 0.001, ****p<0.0001. Significance calculated by Mann-Whitney test. Sample sizes: three of each genotype (A), eight Wnk1fl/+CD2-Cre and ten Wnk1fl/flCD2-Cre mice (B), five (C), five Wnk1fl/+CD2-Cre and seven Wnk1fl/flCD2-Cre mice for the anti-CD3ε- and MnCl2-induced adhesion assays and five and six for the CXCL12-induced adhesion assays (D), six (E, G), and four (F) of each genotype. Data are from one experiment (A) or pooled from two (B, D–G) or five (C) experiments.
Figure 6 with 1 supplement

WNK1 controls entry into S-phase.
(A) Analysis of RNAseq experiment described in Figure 3A, showing heatmap and hierarchical clustering of selected genes from the cell-cycle signature at 24 hr after injection of anti-CD3ε. (B) Canonical cell-cycle signaling diagram for the transition from G1 to S-phase. Genes colored in blue are downregulated at the 24 hr time point in samples from Wnk1fl/flRag1-/-CD2-Cre mice compared to Wnk1fl/+Rag1-/-CD2-Cre mice, genes in red are upregulated. Vertical arrows indicate genes induced or repressed by MYC (Bretones et al., 2015) (C) Left: flow cytometric analysis of DNA content in DN2+DN3 and DN4 thymocytes from Wnk1fl/+CD2-Cre and Wnk1fl/flCD2-Cre mice. Gates show percentage of cells containing more than the diploid amount of DNA (S, G2 and M phases of cell cycle). Right: mean ± SEM percentage of cells in S/G2/M phases of the cell cycle based on gate shown on histograms. (D) Mean ± SEM forward scatter, a measure of cell size, measured by flow cytometry of DN2+DN3 and DN4 thymocytes from Wnk1fl/+CD2-Cre and Wnk1fl/flCD2-Cre mice; data normalized to Wnk1fl/+CD2-Cre DN2+DN3 cells (set to 100%). **0.001 < p < 0.01, ***0.0001 < p < 0.001, ****p<0.0001. Significance was calculated by the Mann-Whitney test. Sample sizes: three (A) or five (C) of each genotype and nine Wnk1fl/+CD2-Cre and seven Wnk1fl/flCD2-Cre mice (D). Data are from one experiment (A), or pooled from two (C, D).
Figure 6—figure supplement 1
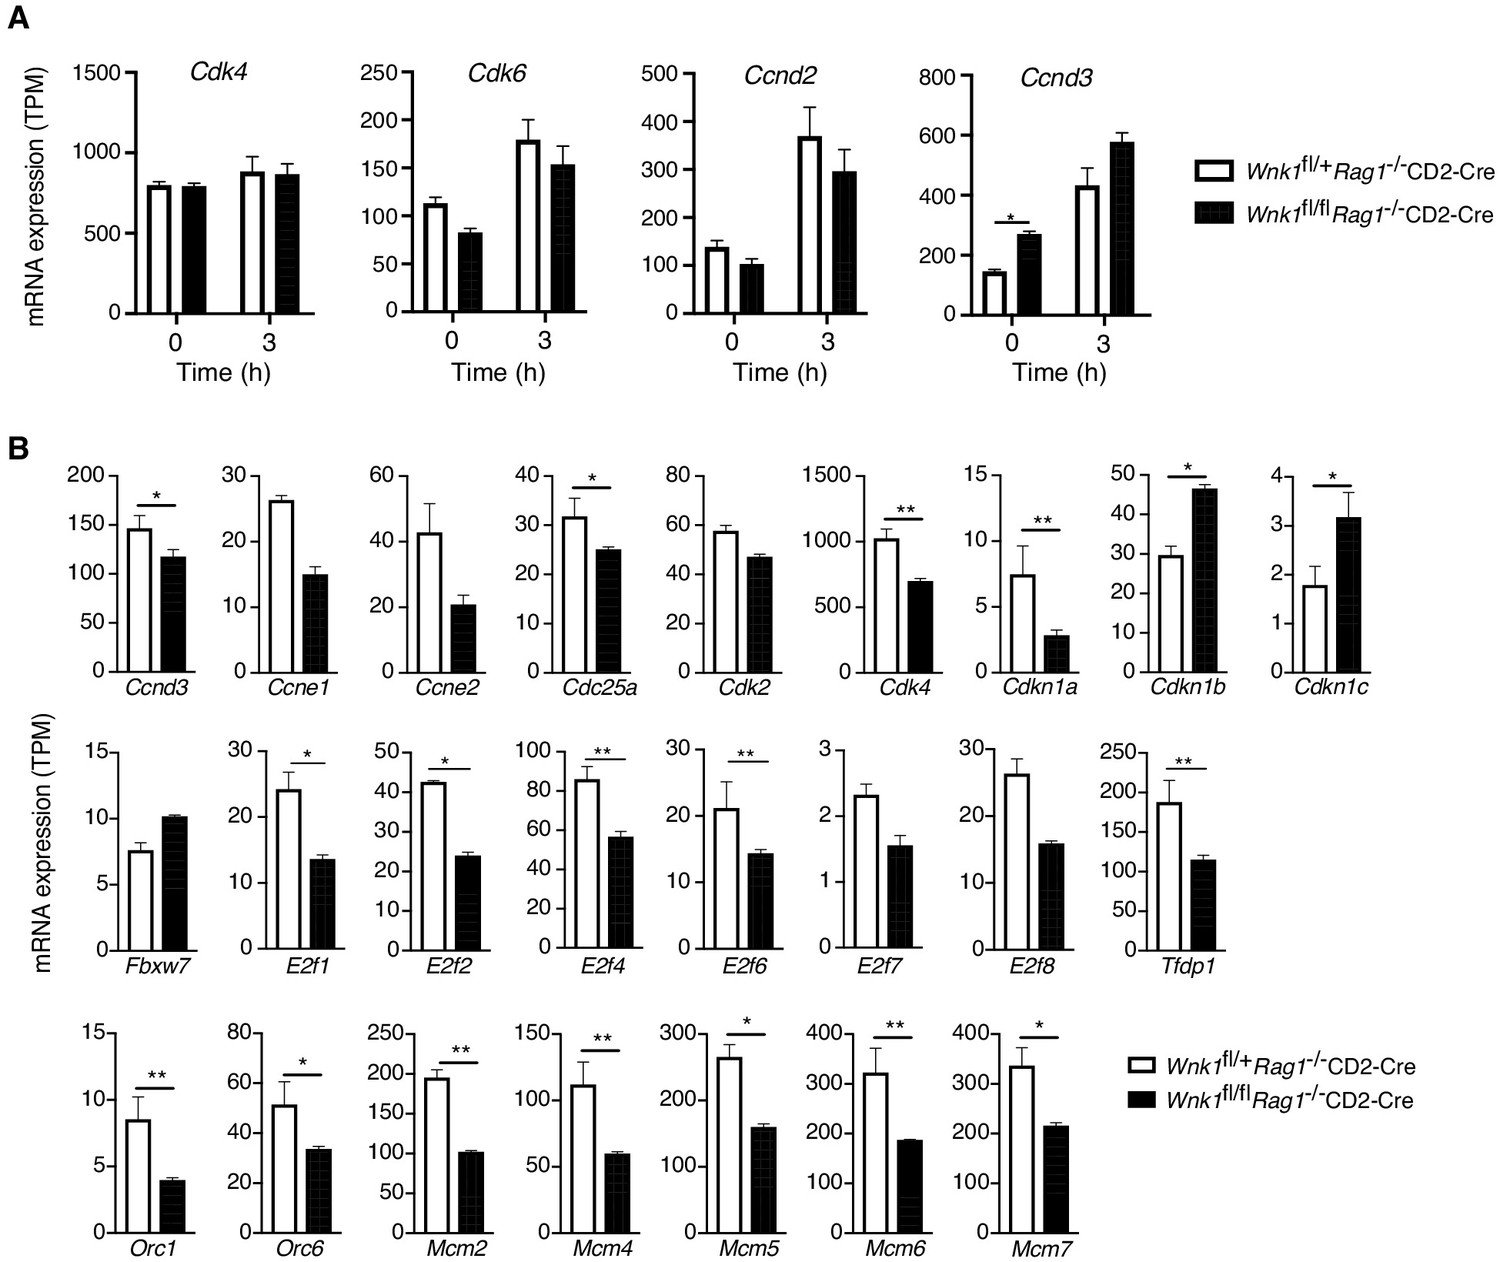
Loss of WNK1 affects expression of genes associated with S-phase, but not late G1.
Analysis of RNAseq experiment described in Figure 3A. (A) Mean ± SEM expression of selected genes associated with progression from the early to late G1 phase of the cell cycle at 0 hr and 3 hr following injection of anti-CD3ε. (B) Mean ± SEM expression of up- or downregulated genes at 24 hr associated with S-phase, as displayed in Figure 6B. *0.01 < p < 0.05, ** 0.001 < p < 0.01. Significance was calculated by the Wald test (Supplementary file 3). Sample sizes: three Wnk1fl/+Rag1-/-CD2-Cre and four Wnk1fl/flRag1-/-CD2-Cre mice for 0 hr time point and three mice of each genotype for 3 and 24 hr time points. Data are from one experiment.
Figure 7 with 1 supplement
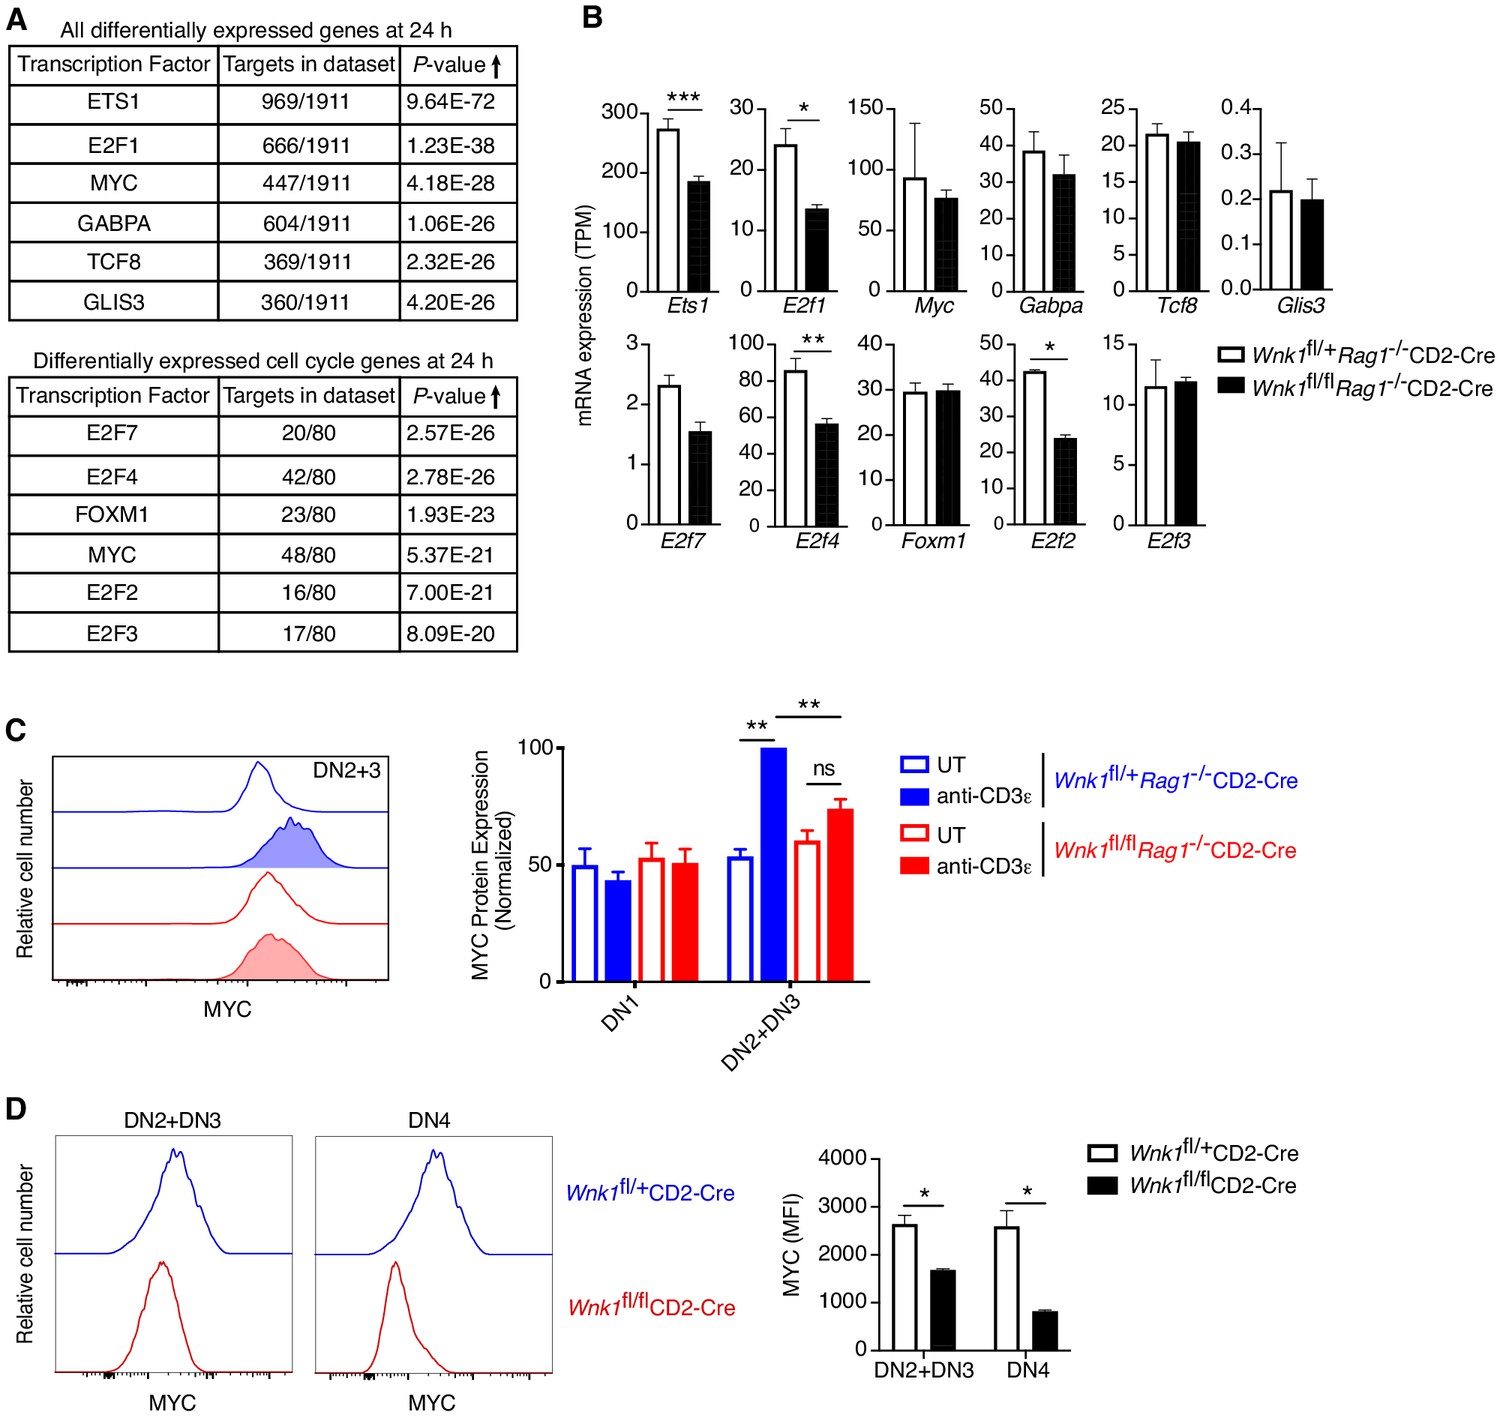
WNK1 is required for pre-TCR induced post-transcriptional regulation of MYC.
(A, B) Analysis of RNAseq experiment described in Figure 3A. (A) Table shows top six transcription factors whose known target genes were most enriched among all significant DEGs at 24 hr or among only cell-cycle genes at 24 hr; results from Metacore transcription factor analysis. (B) Mean ± SEM expression of mRNAs for transcription factors identified in A. Note that graphs of E2f1, E2f2, E2f4 and E2f7 are duplicated from Figure 6—figure supplement 1B. (C) Left: flow cytometric analysis of MYC levels in DN2+DN3 thymocytes from Wnk1fl/+Rag1-/-CD2-Cre and Wnk1fl/flRag1-/-CD2-Cre mice either untreated (UT) or 48 hr after injection with anti-CD3ε. Right: mean ± SEM levels of MYC protein in DN1 and DN2+DN3 thymic subsets normalized to levels in DN2+DN3 cells from injected Wnk1fl/+Rag1-/-CD2-Cre control mice (set to 100%). (D) Left: flow cytometric analysis of MYC levels in DN2+DN3 or DN4 thymocytes from Wnk1fl/+CD2-Cre and Wnk1fl/flCD2-Cre mice. Right: mean ± SEM levels of MYC in DN2+DN3 or DN4 thymocytes. MFI, mean fluorescence intensity. ns, not significant; *0.01 < p < 0.05, **0.001 < p < 0.01, ***p<0.001. Significance calculated by hypergeometric test (A), the Wald test (B), or the Mann-Whitney test (C, D). Sample sizes: three (A, B), five (C) or four (D) of each genotype. Data are from one experiment (A, B, D), or pooled from three (C).
Figure 7—figure supplement 1
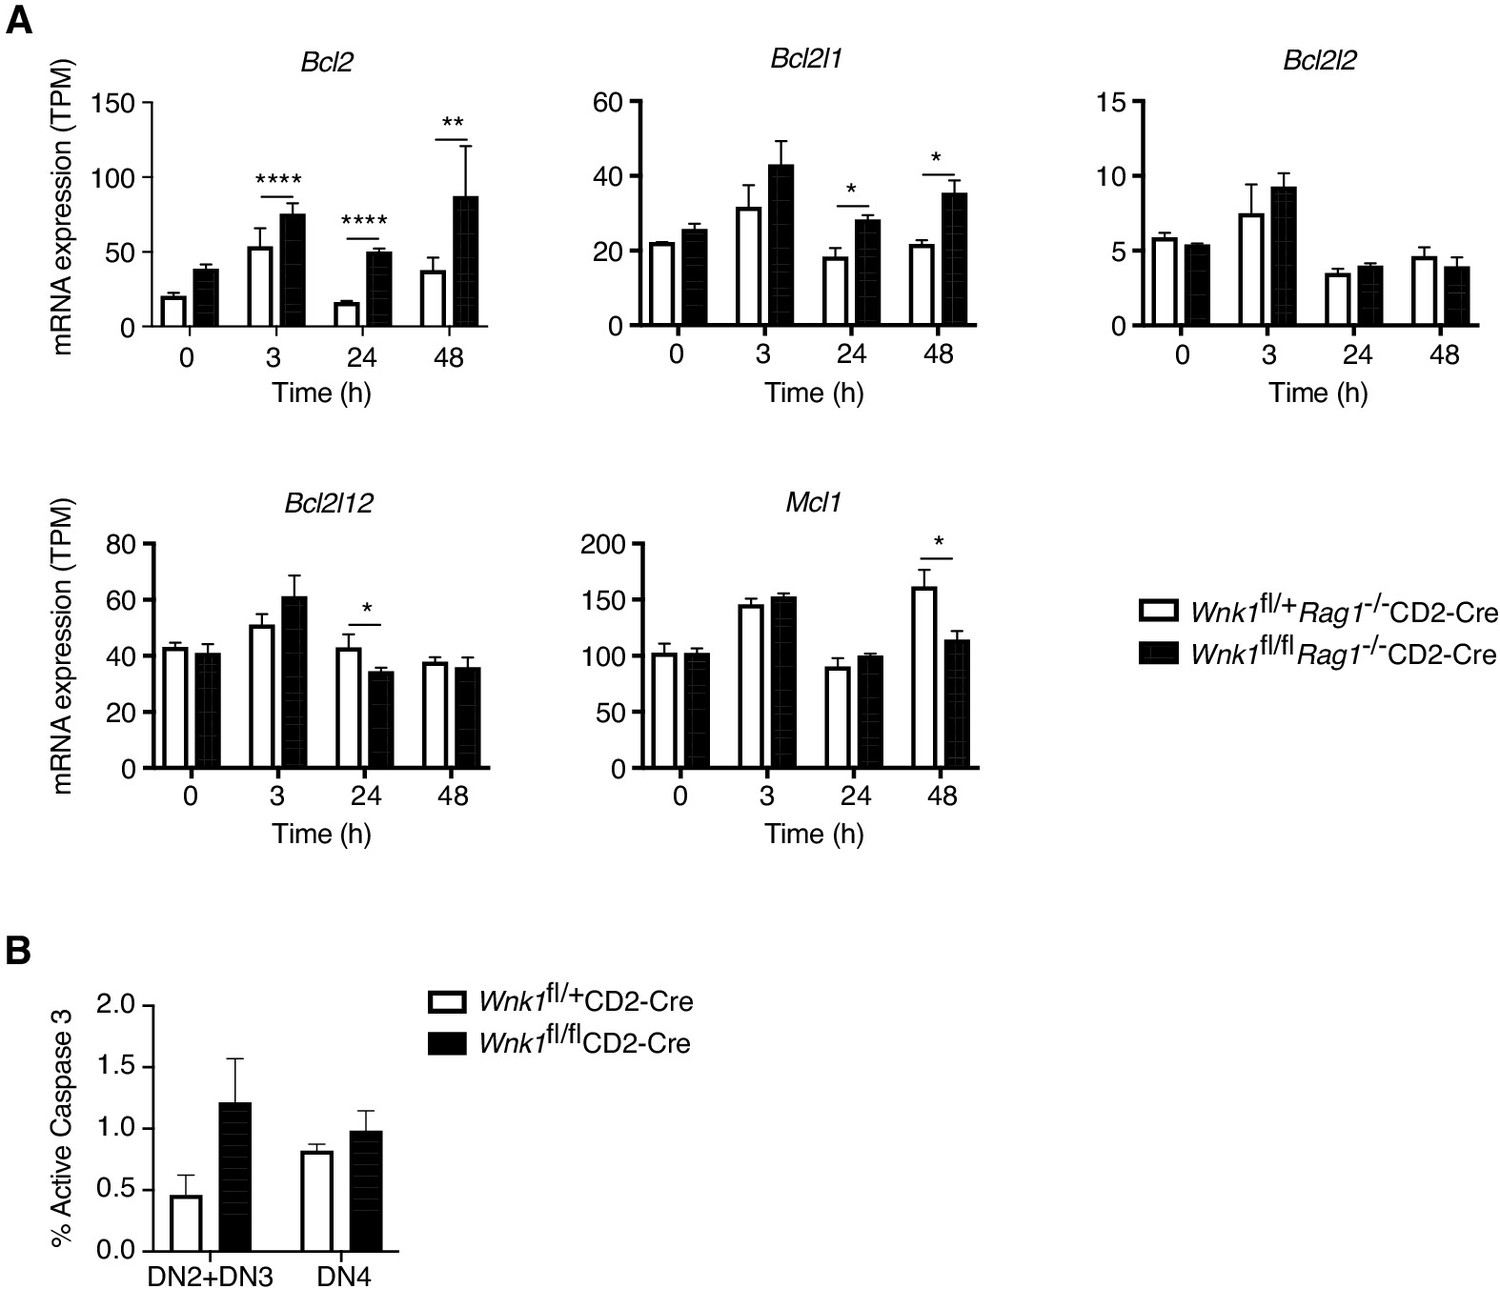
Expression of anti-apoptotic genes in the absence of WNK1.
(A) Analysis of RNAseq experiment described in Figure 3A, showing mean ± SEM expression of anti-apoptotic genes. No expression was detected of the Bcl2a1 genes. (B) Graph shows mean ± SEM% of DN2 and DN3 (DN2+DN3) or DN4 thymocytes of the indicated genotypes that stained positively for active Caspase 3; there was no statistically significant difference in the level of active Caspase three between genotypes. *0.01 < p < 0.05, **0.001 < p < 0.01, and ****p<0.0001. Significance was calculated by the Wald test (A, Supplementary file 3) or by the Mann-Whitney test (B). Sample sizes: three Wnk1fl/+Rag1-/-CD2-Cre and four Wnk1fl/flRag1-/-CD2-Cre mice for 0 hr time point and three mice of each genotype for all other time points (A), or 6 of each genotype (B). Data are from one experiment (A) or pooled from two (B).
Figure 8
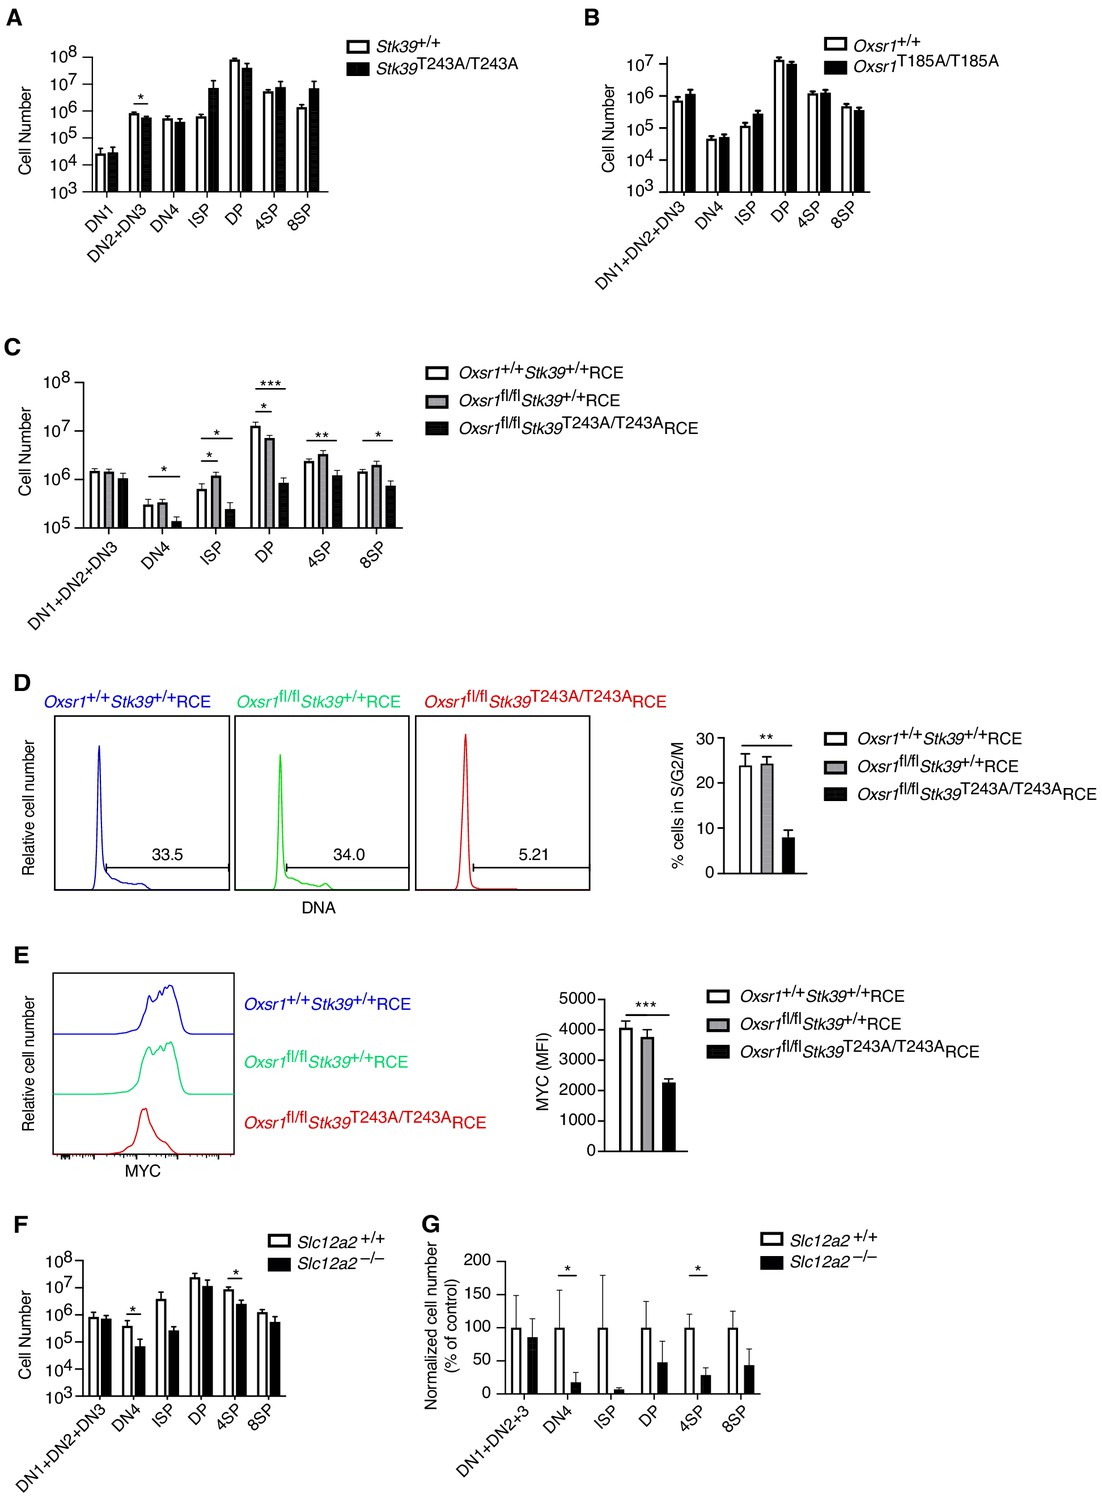
OXSR1 and STK39 are required for pre-TCR induced proliferation and regulation of MYC.
(A–C) Mean ± SEM number of thymocytes at each developmental stage in Stk39+/+ and Stk39T243A/T243A mice (A) or in Rag1-/- radiation chimeras reconstituted with fetal liver cells from Oxsr1+/+ and Oxsr1T185A/T185A embryos (B) or reconstituted with bone marrow cells from Oxsr1+/+Stk39+/+RCE, Oxsr1fl/flStk39+/+RCE and Oxsr1fl/flStk39T243A/T243ARCE mice (C). The chimeric mice in C were analyzed 7 d after treatment with tamoxifen. Thymocyte subsets were identified by flow cytometry as shown in Figure 1A,E. (D) Left: flow cytometric analysis of DNA content in DN4 thymocytes from Rag1-/- radiation chimeras reconstituted with bone marrow cells of the indicated genotypes. Gates show percentage of cells containing more than the diploid amount of DNA (S, G2, and M phases of cell cycle). Right: mean ± SEM percentage of cells in S/G2/M phases of the cell cycle based on gate shown on histograms. (E) Left: flow cytometric analysis of MYC levels in DN4 thymocytes from Rag1-/- radiation chimeras reconstituted with bone marrow cells of the indicated genotypes. Right: mean ± SEM levels of MYC in DN4 thymocytes. (F) Mean ± SEM number of thymocytes at each developmental stage in Rag1-/- radiation chimeras reconstituted with liver cells from Slc12a2+/+ and Slc12a2-/- embryos. (G) Mean ± SEM number of cells in each thymocyte population in chimeras reconstituted with Slc12a2-/- fetal liver normalized to Slc12a2+/+ control chimeras (set to 100%). *0.01 < p < 0.05, **0.001 < p < 0.01, and ***p<0.001. Significance calculated by Mann-Whitney test. Sample sizes: six (A, F, G) or eight (B) of each genotype, or eight Oxsr1+/+Stk39+/+RCE, and seven Oxsr1fl/flStk39+/+RCE and Oxsr1fl/flStk39T243A/T243ARCE mice (C–E). In all cases, data are pooled from two independent experiments.
Figure 9
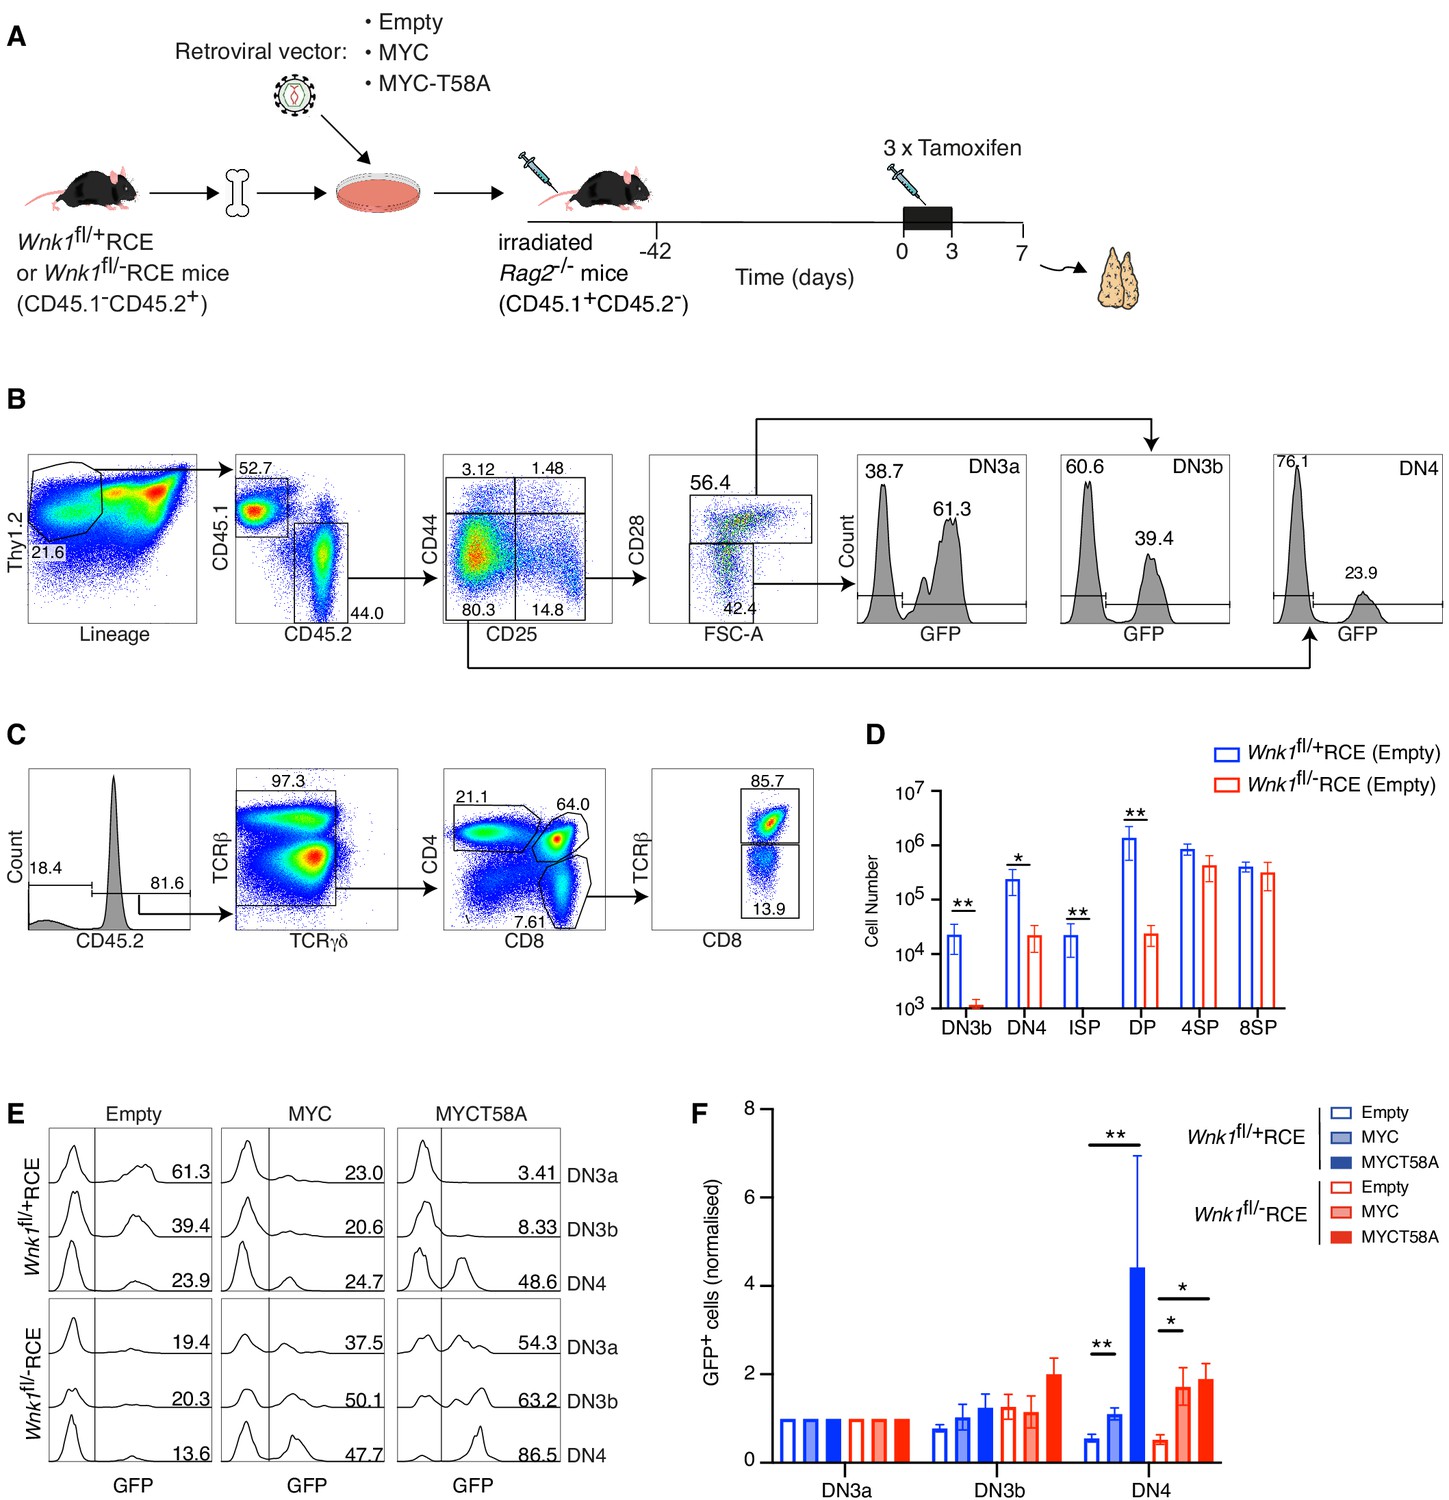
Ectopic expression of MYC promotes development of WNK1-deficient thymocytes through the pre-TCR checkpoint.
(A) Bone marrow from Wnk1fl/+RCE or Wnk1fl/-RCE mice (CD45.1-CD45.2+) was infected in vitro with MIGR1 retroviral vectors expressing MYC, MYCT58A or no gene of interest (Empty); all vectors expressed GFP. Infected bone marrow was used to reconstitute irradiated RAG2-deficient mice (CD45.1+CD45.2-). 42 d later mice were treated with three daily injections tamoxifen and analyzed 7 d after start of tamoxifen treatment. (B, C) Flow cytometric analysis showing (B) gating of Thy1.2+Lineage-CD45.1-CD45.2+ thymocytes separated into DN3a (CD44-CD25+CD28-FSClow), DN3b (CD44-CD25+CD28+FSChigh) and DN4 (CD44-CD25-CD28+) cells, within which GFP+ cells have been infected with the retroviral vector and (C) gating of CD45.2+TCRγδ- thymocytes separated into ISP (CD4-CD8+TCRβ-), DP (CD4+CD8+), 4SP (CD4+CD8-) and 8SP (CD4-CD8+TCRβ+) cells. Numbers indicate percentage of cells in gates. (D) Mean ± SEM number of cells in thymocyte subsets of Rag2-/- chimeras reconstituted with bone marrow from Wnk1fl/+RCE or Wnk1fl/-RCE mice retrovirally transduced with empty vector gated as in B and C. (E) Histograms showing GFP expression in DN3a, DN3b, and DN4 cells from chimeras reconstituted with Wnk1fl/+RCE or Wnk1fl/-RCE marrow that had been infected with indicated retroviral vectors. Numbers indicate percentage of GFP+ cells. (F) Graph of mean (± SEM) % GFP+ cells in DN3a, DN3b, and DN4 cells from chimeras reconstituted with Wnk1fl/+RCE or Wnk1fl/-RCE marrow that had been infected with indicated retroviral vectors, normalized to % GFP+ cells in DN3a cells of each chimera (set to 1). Significance calculated by Mann-Whitney test. *0.01 < p < 0.05, **p<0.01. Sample sizes: (D) five chimeras reconstituted with each genotype; (F) six chimeras reconstituted with Wnk1fl/+RCE marrow infected with empty vector or MIGR1-MYC, four chimeras reconstituted with Wnk1fl/+RCE marrow infected with MIGR1-MYCT58A, five chimeras reconstituted with Wnk1fl/-RCE marrow infected with empty vector or MIGR1-MYC and seven chimeras reconstituted with Wnk1fl/-RCE marrow infected with MIGR1-MYCT58A. Data are from one experiment.
Tables
Appendix 1—key resources table
| Reagent type (species) or resource | Designation | Source or reference | Identifiers | Additional information |
|---|---|---|---|---|
| Gene (Mus musculus) | Wnk1 | Ensembl | ENSMUSG00000045962 | |
| Gene (Mus musculus) | Oxsr1 | Ensembl | ENSMUSG00000036737 | |
| Gene (Mus musculus) | Stk39 | Ensembl | ENSMUSG00000027030 | |
| Gene (Mus musculus) | Slc12a2 | Ensembl | ENSMUSG00000024597 | |
| Gene (Mus musculus) | Myc | Ensembl | ENSMUSG00000022346 | |
| Genetic reagent (Mus musculus) | Wnk1tm1Clhu; Wnk1fl | Xie et al., 2009 doi:10.2353/ajpath.2009.090094 | RRID:MGI:4360972 | |
| Genetic reagent (Mus musculus) | Wnk1tm1.1Clhu; Wnk1- | Köchl et al., 2016 doi:10.1038/ni.3495 | RRID:MGI:6286269 | |
| Genetic reagent (Mus musculus) | Oxsr1tm1.1Ssy; Oxsr1fl | Lin et al., 2011 doi:10.1073/pnas.1107452108 | RRID:MGI:5297491 | |
| Genetic reagent (Mus musculus) | Tg(CD2-icre)4Kio; CD2Cre | de Boer et al., 2003 doi:10.1002/immu.200310005 | RRID:MGI:2449947 | |
| Genetic reagent (Mus musculus) | Wnk1tm1.1Tyb; Wnk1D368A | Köchl et al., 2016 doi:10.1038/ni.3495 | RRID:MGI:6286266 | |
| Genetic reagent (Mus musculus) | Gt(ROSA)26Sortm1(cre/ERT2)Thl; ROSA26CreERT2, RCE | de Luca et al., 2005 doi:10.1172/JCI24059 | RRID:MGI:3701992 | |
| Genetic reagent (Mus musculus) | Oxsr1tm1.1Arte; Oxsr1T185A | Rafiqi et al., 2010 doi:10.1002/emmm.200900058 | RRID:MGI:5462099 | |
| Genetic reagent (Mus musculus) | Stk39tm1.1Arte; Stk39T243A | Rafiqi et al., 2010 doi:10.1002/emmm.200900058 | RRID:MGI:5462098 | |
| Genetic reagent (Mus musculus) | Slc12a2tm1Ges; Slc12a2- | Flagella et al., 1999 doi:10.1074/jbc.274.38.26946 | RRID:MGI:1935144 | |
| Genetic reagent (Mus musculus) | Rag2tm1Fwa; Rag2- | Shinkai et al., 1992 doi:10.1016/0092-8674(92)90029 C | RRID:MGI:1858556 | |
| Genetic reagent (Mus musculus) | Rag1tm1Mom; Rag1- | Mombaerts et al., 1992 doi:10.1016/0092-8674(92)90030 G | RRID:MGI:1857241 | |
| Genetic reagent (Mus musculus) | C57BL/6J.129S4-Tg(Prm-cre)70Og | O'Gorman et al., 1997 doi:10.1073/pnas.94.26.14602 | RRID:MGI:2388049 | |
| Cell line (Mus musculus) | OP9-DL1 | Schmitt and Zúñiga-Pflücker, 2002 doi:10.1016/s1074-7613 (02)00474–0 | RRID:CVCL_B218 | |
| Cell line (Homo-sapiens) | Platinum E (Plat-E) | Morita et al., 2000 doi:10.1038/sj.gt.3301206 | RRID:CVCL_B488 | Retroviral packaging cell line |
| Recombinant DNA reagent | pMIGR1 (plasmid) | Pear et al., 1998 doi:10.1182/blood.V92.10.3780 | RRID:Addgene_27490 | Retroviral construct encoding GFP |
| Recombinant DNA reagent | pMIGR1-MYC (plasmid) | Luo et al., 2005 doi:10.1182/blood-2005-02-0734 | Retroviral construct encoding MYC and GFP | |
| Recombinant DNA reagent | pMIGR1-MYCT58A (plasmid) | This paper | Retroviral construct encoding MYC-T58A and GFP | |
| Antibody | anti-B220-biotin (RA3-6B2) (Rat monoclonal) | Invitrogen | Cat# 13-0452-86; RRID:AB_466451 | FACS (1:200) |
| Antibody | anti-B220-FITC (RA3-6B2) (Rat monoclonal) | Biolegend | Cat# 103206; RRID:AB_312991 | FACS (1:200) |
| Antibody | anti-active Caspase 3-PE (C92-605) (Rabbit monoclonal) | BD Pharmingen | Cat# 550821; RRID:AB_393906 | FACS (1:50) |
| Antibody | anti-CD3ε-biotin (2C11) (Armenian hamster monoclonal) | Biolegend | Cat# 100304; RRID:AB_312669 | FACS (1:200) |
| Antibody | anti-CD3ε-FITC (2C11) (Armenian hamster monoclonal) | eBioscience | Cat# 11-0031-85; RRID:AB_464883 | FACS (1:200) |
| Antibody | anti-CD3ε purified, endotoxin low (2C11) (Armenian hamster monoclonal) | Tonbo | Cat# 40–0031 M001; RRID:AB_464883 | IV injection |
| Antibody | anti-CD4-biotin (RM4-4) (Rat monoclonal) | eBioscience | Cat# 13-0043-85; RRID:AB_466334 | FACS (1:200) |
| Antibody | anti-CD4-FITC (GK1.5) (Rat monoclonal) | eBioscience | Cat# 11-0041-86; RRID:AB_464894 | FACS (1:200) |
| Antibody | anti-CD4-BV421 (RM4-5) (Rat monoclonal) | Biolegend | Cat# 100544; RRID:AB_11219790 | FACS (1:200) |
| Antibody | anti-CD4-PerCP (RM4-5) (Rat monoclonal) | Biolegend | Cat# 100538; RRID:AB_893325 | FACS (1:200) |
| Antibody | anti-CD4-APC-CY7 (GK1.5) (Rat monoclonal) | BD Pharmingen | Cat# 552051; RRID:AB_394331 | FACS (1:200) |
| Antibody | anti-CD8-biotin (53–6.7) (Rat monoclonal) | Biolegend | Cat# 100704; RRID:AB_312743 | FACS (1:200) |
| Antibody | anti-CD8-FITC (53–6.7) (Rat monoclonal) | Biolegend | Cat# 100706; RRID:AB_312745 | FACS (1:200) |
| Antibody | anti-CD8-BV421 (53–6.7) (Rat monoclonal) | Biolegend | Cat# 100738; RRID:AB_11204079 | FACS (1:200) |
| Antibody | anti-CD8-APC (53–6.7) (Rat monoclonal) | eBioscience | Cat# 17-0081-83; RRID:AB_469336 | FACS (1:200) |
| Antibody | anti-CD8-PE-CY7 (53–6.7) (Rat monoclonal) | Biolegend | Cat# 100722; RRID:AB_312761 | FACS (1:200) |
| Antibody | anti-CD11b-biotin (M1/70) (Rat monoclonal) | Biolegend | Cat# 101204; RRID:AB_312787 | FACS (1:200) |
| Antibody | anti-CD11b-FITC (M1/70) (Rat monoclonal) | Biolegend | Cat# 101206; RRID:AB_312789 | FACS (1:200) |
| Antibody | anti-CD11c-biotin (N418) (Armenian Hamster monoclonal) | Biolegend | Cat# 117304; RRID:AB_313773 | FACS (1:200) |
| Antibody | anti-CD11c-FITC (HL3) (Armenian Hamster monoclonal) | BD Pharmingen | Cat# 553801; RRID:AB_395060 | FACS (1:200) |
| Antibody | anti-CD19-biotin (1D3) (Rat monoclonal) | BD Pharmingen | Cat# 553784; RRID:AB_395048 | FACS (1:200) |
| Antibody | anti-CD19-FITC (MB19-1) (Mouse monoclonal) | eBioscience | Cat# 11-0191-85; RRID:AB_464966 | FACS (1:200) |
| Antibody | anti-CD25-eF450 (PC-61.5) (Rat monoclonal) | eBioscience | Cat# 48-0251-82; RRID:AB_10671550 | FACS (1:200) |
| Antibody | anti-CD25-FITC (7D4) (Rat monoclonal) | BD Pharmingen | Cat# 553072; RRID:AB_394604 | FACS (1:200) |
| Antibody | anti-CD25-PE (3C7) (Rat monoclonal) | BD Pharmingen | Cat# 553075; RRID:AB_394605 | FACS (1:200) |
| Antibody | anti-CD28-PE-CY7 (E18) (Mouse monoclonal) | Biolegend | Cat# 122014; RRID:AB_604079 | FACS (1:200) |
| Antibody | anti-CD44-PE (IM7) (Rat monoclonal) | eBiosciene | Cat# 12-0441-83; RRID:AB_465665 | FACS (1:200) |
| Antibody | anti-CD44-APC (IM7) (Rat monoclonal) | eBioscience | Cat# 17-0441-83; RRID:AB_469391 | FACS (1:200) |
| Antibody | anti-CD44-APC-eF780 (IM7) (Rat monoclonal) | eBioscience | Cat# 47-0441-82; RRID:AB_1272244 | FACS (1:200) |
| Antibody | CD45.1-PerCP-Cy5.5 (A20) (Mouse monoclonal) | eBioscience | Cat# 45-0453-82; RRID:AB_1107003 | FACS (1:200) |
| Antibody | CD45.2-APC-eF780 (104) (Mouse monoclonal) | eBioscience | Cat# 47-0454-82; RRID:AB_1272175 | FACS (1:200) |
| Antibody | anti-CXCR4-PE (2B11) | BD Pharmingen | Cat# 12-9991-82; RRID:AB_891391 | FACS (1:100) |
| Antibody | anti-DX5-biotin (Rat monoclonal) | eBioscience | Cat# 13-5971-85; RRID:AB_466826 | FACS (1:200) |
| Antibody | anti-DX5-FITC (Rat monoclonal) | Biolegend | Cat# 108906; RRID:AB_313413 | FACS (1:200) |
| Antibody | anti-GR-1-biotin (RB6-8C5) (Rat monoclonal) | Biolegend | Cat# 108404; RRID:AB_313369 | FACS (1:200) |
| Antibody | anti-LFA-1-PE (M17/4) (Rat monoclonal) | BD Bioscience | Cat# 12-0111-82; RRID:AB_465544 | FACS (1:200) |
| Antibody | anti-mouse IgG1-biotin (A85-1) (Rat monoclonal) | BD Pharmingen | 553441; RRID:AB_394861 | FACS (1:100) |
| Antibody | anti-MYC-AF647 (Y69) (Rabbit monoclonal) | Abcam | Cat# ab190560; RRID:AB_2876372 | FACS (1:400) |
| Antibody | anti-NK1.1-biotin (PK136) (Mouse monoclonal) | eBioscience | Cat# 13-5941-85; RRID:AB_466805 | FACS (1:200) |
| Antibody | anti-NK1.1-FITC (PK136) (Mouse monoclonal) | Biolegend | Cat# 108706; RRID:AB_313393 | FACS (1:200) |
| Antibody | anti-pS325-OXSR1/pS383-STK39 (sheep polyclonal) | MRC-PPU | Cat# S670B; RRID:AB_2876373 | IB (1 µg/ml) |
| Antibody | anti-PTCRA (2F5) (Mouse monoclonal) | BD Pharmingen | Cat# 552407; RRID:AB_394381 | FACS (1:100) |
| Antibody | anti-pS235/pS236-S6-AF488 (D57.2.2E) (Rabbit monoclonal) | Cell Signaling | Cat# 5317; RRID:AB_10694920 | FACS (1:50) |
| Antibody | anti-TCRβ-bio (H57-597) (Armenian Hamster monoclonal) | eBioscience | Cat# 13-5961-85; RRID:AB_466820 | FACS (1:200) |
| Antibody | anti-TCRβ-FITC (H57-597) (Armenian Hamster monoclonal) | Biolegend | Cat# 109206; RRID:AB_313429 | FACS (1:200) |
| Antibody | anti-TCRβ-APC (H57-597) (Armenian Hamster monoclonal) | Tonbo | Cat# 20–5961 U100, RRID:AB_2621612 | FACS (1:200) |
| Antibody | anti-TCRγδ-biotin (UC7-13D5) (Armenian Hamster monoclonal) | eBioscience | Cat# 13-5811-82; RRID:AB_466684 | FACS (1:200) |
| Antibody | anti-TCRγδ-FITC (UC7-13D5) (Armenian Hamster monoclonal) | Biolegend | Cat# 107504; RRID:AB_313313 | FACS (1:200) |
| Antibody | anti-TCRγδ-PE (GL3) (Armenian Hamster monoclonal) | eBioscience | Cat# 12-5711-82; RRID:AB_465934 | FACS (1:200) |
| Antibody | anti-Thy1.2-BV605 (53–2.1) (Rat monoclonal) | Biolegend | Cat# 140317; RRID:AB_11203724 | FACS (1:500) |
| Antibody | anti-Thy1.2-FITC (53–2.1) (Rat monoclonal) | Biolegend | Cat# 140304; RRID:AB_10642812 | FACS (1:500) |
| Antibody | anti-Thy1.2-APC (53–2.1) (Rat monoclonal) | eBioscience | Cat# 17-0902-83; RRID:AB_469423 | FACS (1:500) |
| Peptide, recombinant protein | Streptavidin-PE | Biolegend | Cat #: 405204 | FACS (1:200) |
| Peptide, recombinant protein | Streptavidin-PerCP | Biolegend | Cat #: 405213 | FACS (1:200) |
| Peptide, recombinant protein | mouse CXCL12 | R and D systems | Cat # 460-SD-010/CF | (500 ng/ml) |
| Peptide, recombinant protein | mouse ICAM1-Fc | R and D systems | Cat # 796-IC-050 | Transwell assay (500 ng/ml); Adhesion Assay (25 µg/ml) |
| Commercial assay or kit | Foxp3/Transcription factor staining buffer set | eBioScience | Cat # 00-5523-00 | |
| Chemical compound, drug | Tamoxifen | Millipore-Sigma | Cat # T5648 | |
| Software, algorithm | Graphpad Prism 8 | Graphpad | RRID:SCR_002798 | |
| Software, algorithm | Flowjo 10 | Flowjo | RRID:SCR_008520 | |
| Other | 7AAD | Merck | Cat # SML1633 | |
| Other | FxCycle Violet Stain | Thermo Fisher | Cat # F10347 | (1:1000) |
| Other | LIVE/DEAD NearIR | Thermo Fisher | Cat # L10119 | (1:500) |
| Other | Zombie Aqua | Biolegend | Cat # 423102 | (1:500) |
Additional files
-
Supplementary file 1
RNAseq analysis of control and WNK1-deficient DN3 thymocytes following injection of anti-CD3ε.
Analysis of RNAseq experiment described in Figure 3A, showing expression of all genes measured in TPM at all time points.
- https://cdn.elifesciences.org/articles/56934/elife-56934-supp1-v2.xlsx
-
Supplementary file 2
Differential gene expression in control and WNK1-deficient DN3 thymocytes following injection of anti-CD3ε.
Analysis of RNAseq experiment described in Figure 3A, showing differential gene expression analysis with DESeq2, taking into account all genes.
- https://cdn.elifesciences.org/articles/56934/elife-56934-supp2-v2.xlsx
-
Supplementary file 3
Significant differential gene expression in control and WNK1-deficient DN3 thymocytes following injection of anti-CD3ε.
Analysis of RNAseq experiment described in Figure 3A, showing differential gene expression analysis with DESeq2 as in Supplementary file 2 but showing only genes that were statistically significantly differentially expressed (padj ≤0.05) and had an average expression value of TPM >3 over all conditions.
- https://cdn.elifesciences.org/articles/56934/elife-56934-supp3-v2.xlsx
-
Transparent reporting form
- https://cdn.elifesciences.org/articles/56934/elife-56934-transrepform-v2.docx
Download links
A two-part list of links to download the article, or parts of the article, in various formats.
Downloads (link to download the article as PDF)
Open citations (links to open the citations from this article in various online reference manager services)
Cite this article (links to download the citations from this article in formats compatible with various reference manager tools)
Critical role of WNK1 in MYC-dependent early mouse thymocyte development
eLife 9:e56934.
https://doi.org/10.7554/eLife.56934


