Specific labeling of synaptic schwann cells reveals unique cellular and molecular features
- Department of Molecular Biology, Cellular Biology, and Biochemistry, Brown University, United States
- Center for Translational Neuroscience, Robert J. and Nancy D. Carney Institute for Brain Science and Brown Institute for Translational Science, Brown University, United States
- Neuroscience Graduate Program, Brown University, United States
- Fralin Biomedical Research Institute at Virginia Tech Carilion, United States
- Department of Advanced Research Computing, Virginia Tech, United States
- Department of Neurology, Warren Alpert Medical School of Brown University, United States
Figures
Figure 1
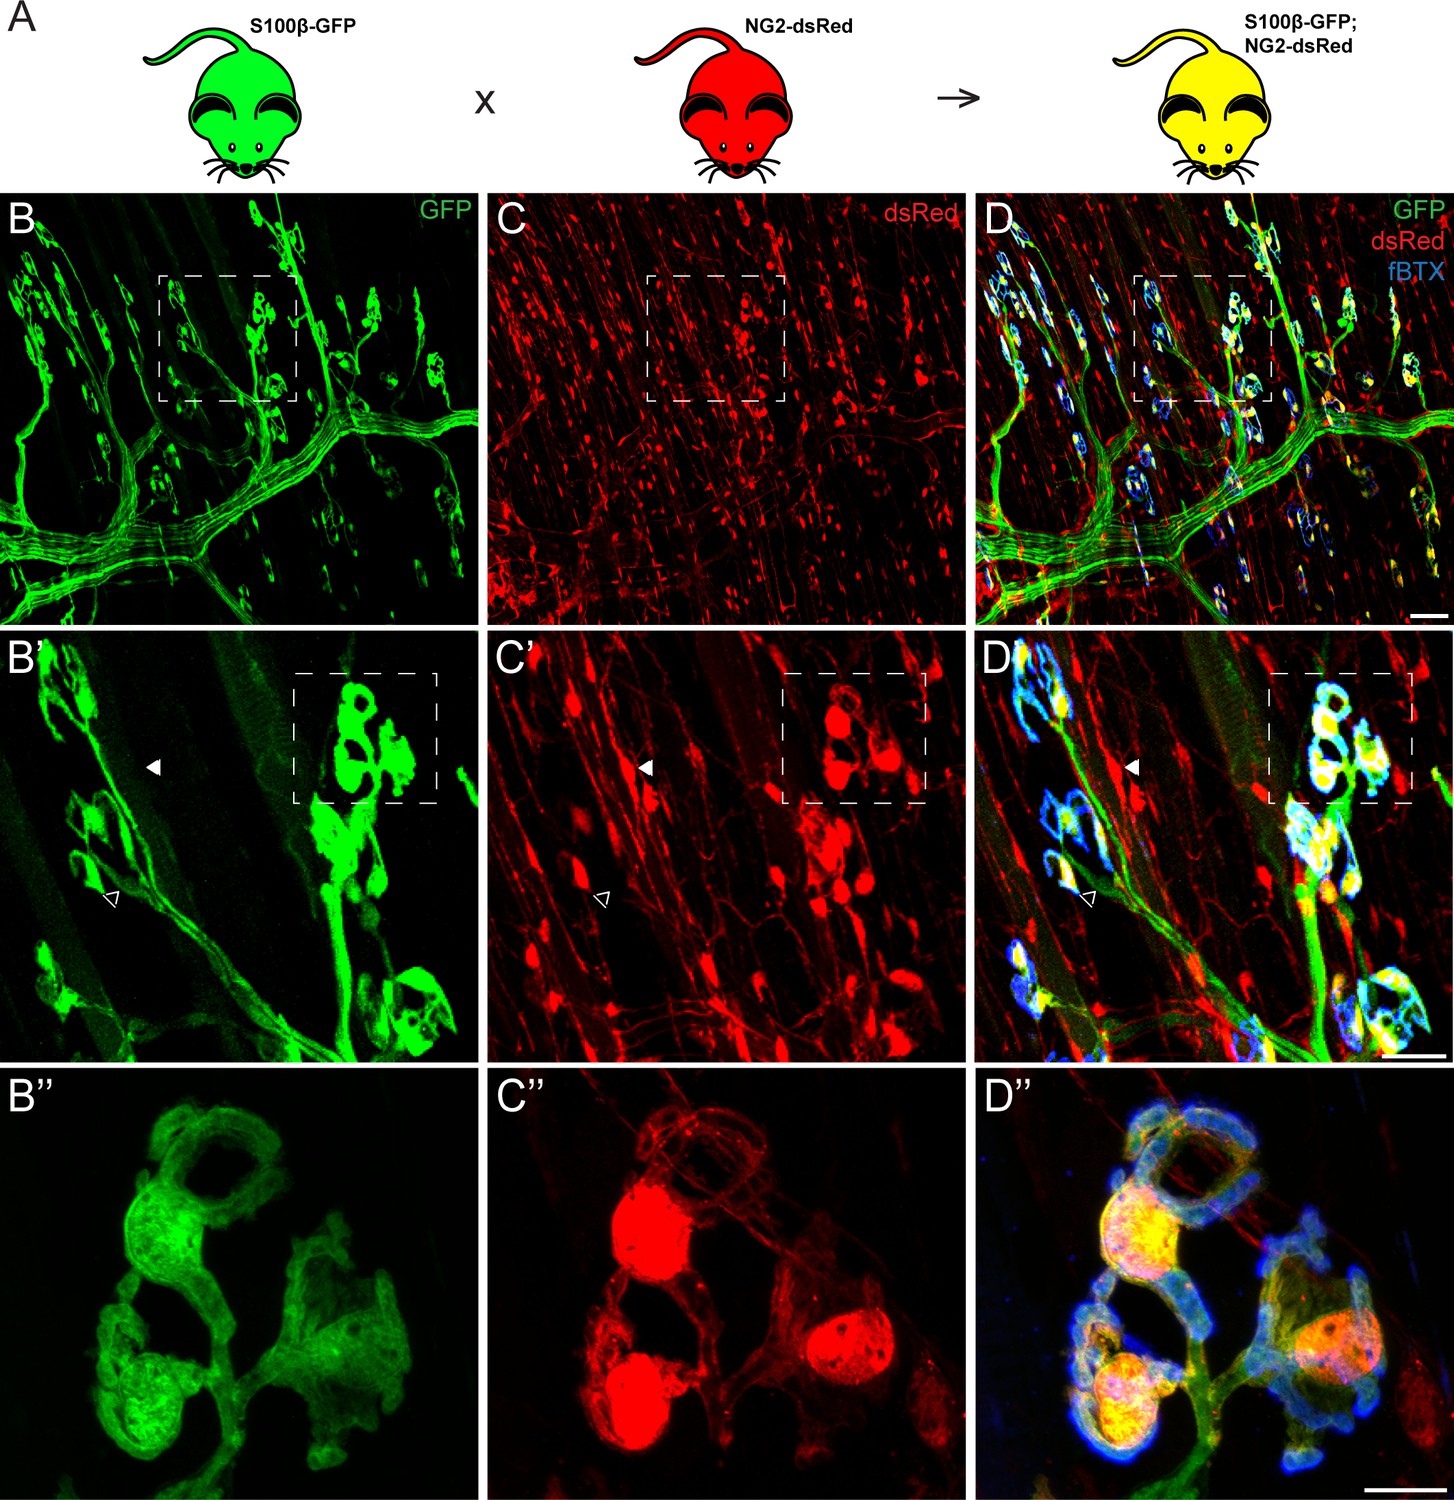
Co-expression of S100β and NG2 is unique to PSCs in the EDL muscle.
(A) In order to selectively label PSCs, S100β-GFP and NG2-dsRed transgenic mice were crossed to create S100β-GFP;NG2-dsRed mice. (B–D) Representative images of GFP (B) and dsRed (C) fluorescence in the EDL of S100B-GFP;NG2-dsRed mice. S100β-GFP+ Schwann cells are visible along the motor axon while S100β-GFP+ PSCs are identified by their unique morphology and clustering pattern near the NMJ, visualized here using a fluourescent α-bungarotoxin conjugate (fBTX) to detect nAChRs (blue). Note that PSCs are the only cells expressing both GFP and dsRed (D). At non-synaptic sites, GFP-positive cells do not express dsRed (hollow arrow; B’, C’, D’) and dsRed-positive cells do not express GFP (filled arrow; B’, C’, D’). Scale bar = 50 μm (D), 25 μm (D’), and 10 μm (D’’).
Figure 2
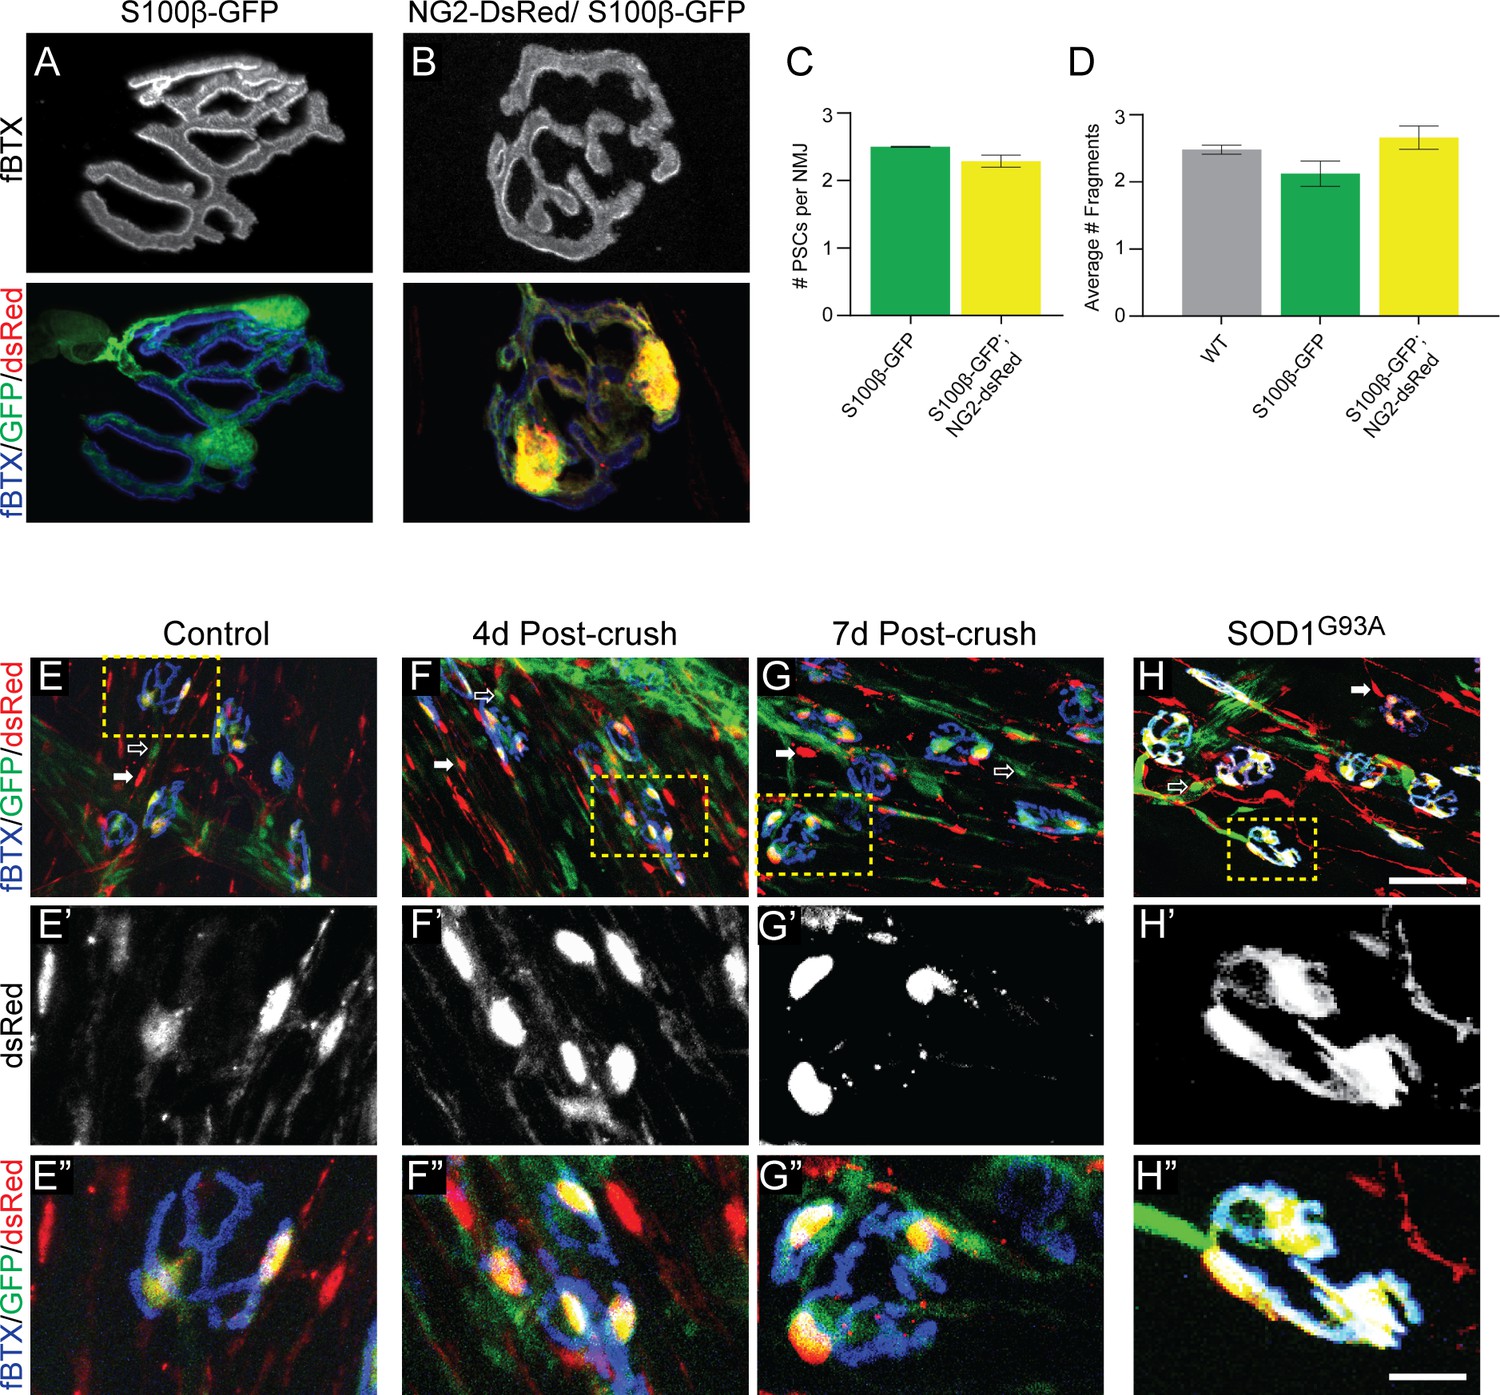
The NG2-DsRed/S100β-GFP mouse line can be used to reliably identify PSCs in healthy and stressed NMJs.
(A–B) Representative images of NMJs identified by fBTX labeled nAChRs from S100β-GFP (A) and S100β-GFP;NG2-dsRed (B) EDL. (C–D) The co-expression of GFP and dsRed has no discernible negative effects on NMJ fragmentation or PSC number in the EDL muscle of young adult mice. (C) The average number of PSCs per NMJ is unchanged between S100B-GFP mice and S100β-GFP;NG2-dsRed mice. (D) The average number of nAChR fragments per NMJ, as determined by analysis of continuity of fBTX labeled nAChRs, is unchanged between wild-type, S100B-GFP, and S100β-GFP;NG2-dsRed animals. (E–H) PSCs in stressed muscle co-express S100β-GFP and NG2-dsRed. Representative images of NMJs identified by fBTX labeled nAChRs in S100β-GFP;NG2-dsRed mice shows co-expression of S100β-GFP and NG2-dsRed by PSCs in healthy uninjured (E), at 4d (F), and 7d (G) post-fibular nerve crush, and in P120 SOD1G93A (H) EDL. At non-synaptic sites, GFP-positive cells do not express dsRed (hollow arrow; E, F, G, H) and dsRed-positive cells do not express GFP (filled arrow; E, F, G, H). Error bar = standard error of the mean. Scale bar = 10 μm (A–B), 50 μm (E–H), and 12.5 μm (E’-H’ and E’=H’).
Figure 3 with 2 supplements
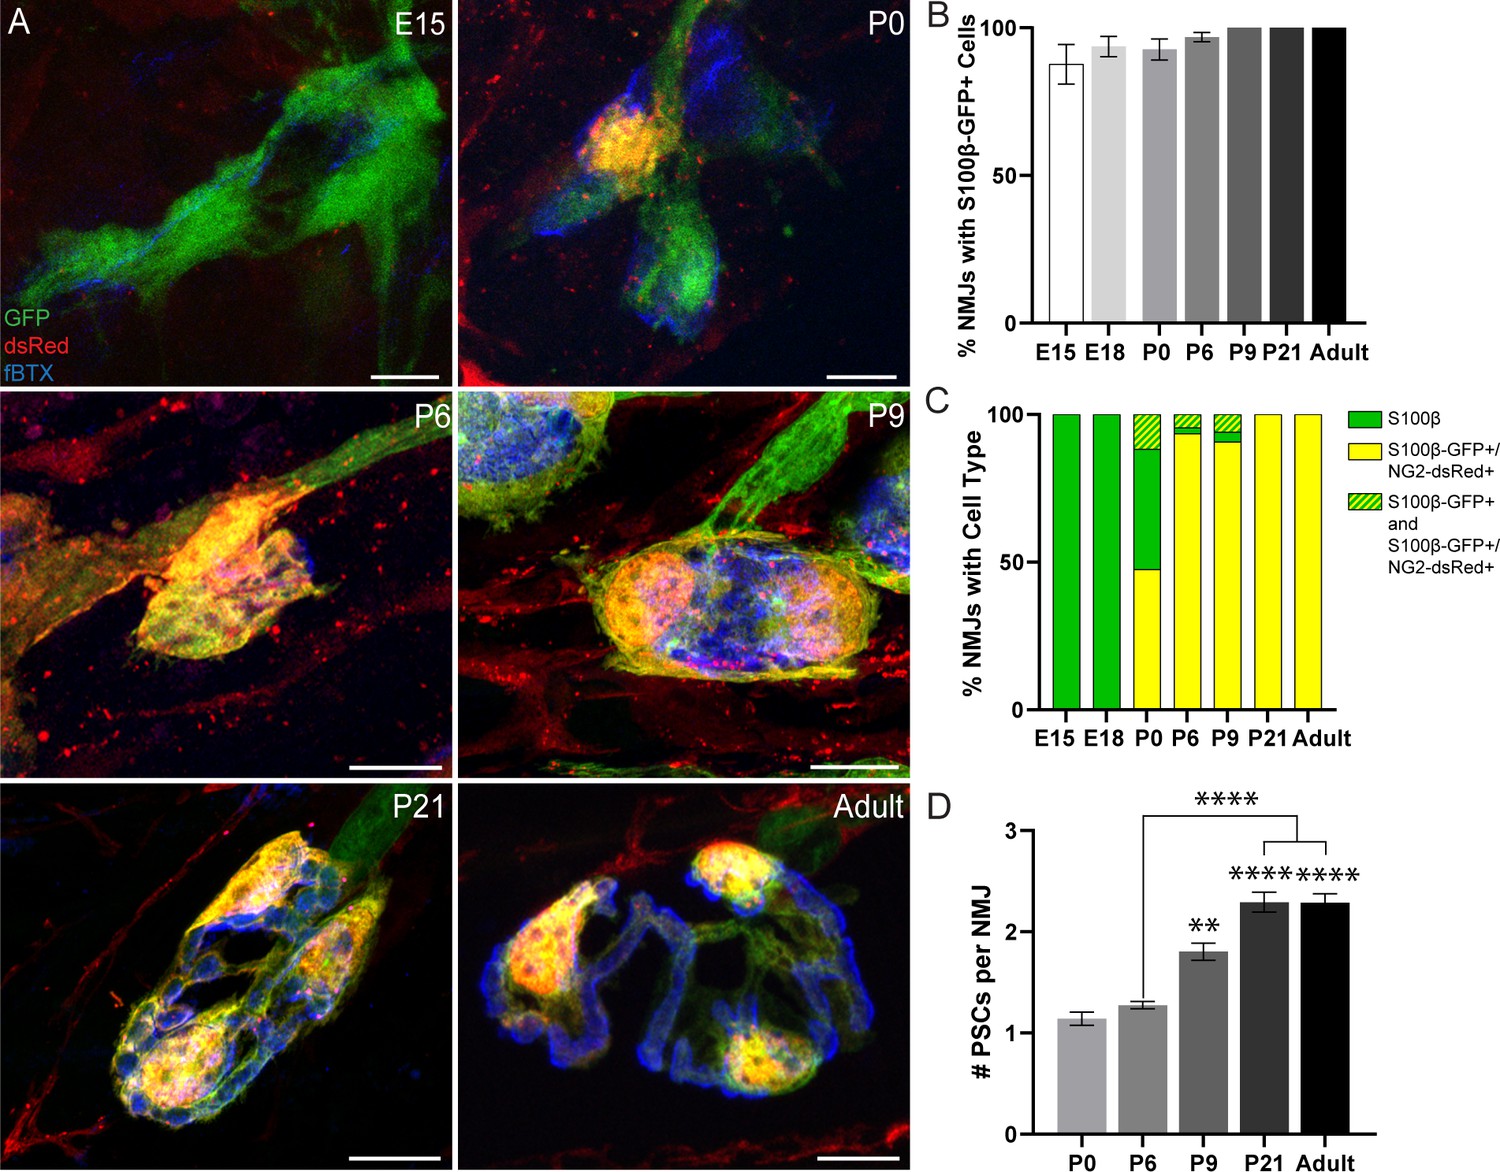
Analysis of NG2-dsRed distribution and PSC density during NMJ development in the EDL muscle.
(A) Representative images of NMJs, identified by nAChR clusters with fBTX (blue), in developing (E15, P0, P6, P9, P21) and adult S100β-GFP (green);NG2-dsRed (red) transgenic EDL. (B) The number of NMJs populated by at least one S100β-GFP+ cell increases between the ages of E15 and P9, at which point all observed NMJs have at least one S100β-GFP+ cell. (C) Analysis of NMJs that contain at least one single labeled S100β-GFP+ cell (green bar), at least one double labeled S100β-GFP+;NG2-dsRed+ cell (yellow bar) or a combination of single labeled S100β-GFP+ cells and double labeled S100β-GFP+;NG2-dsRed+ cells (green/yellow bar) shows that developing NMJs are exclusively populated by S100β-GFP+ cells in the embryonic stages and are increasingly populated by S100β-GFP+;NG2-dsRed+ cells as the NMJ develops. (D) The average number of PSCs per NMJ increases during development. Error bar = standard error of the mean. Scale bar = 10 μm. *=p < 0.05,***=P < 0.001; ****=P < 0.0001. Asterisks represent comparisons with P0 unless otherwise noted.
Figure 3—figure supplement 1

Color and grayscale images of PSCs in the EDL muscle of (A) E15, (B) E18, (C) P0, (D) P6, (E) P9, (F) P21, and (G) adult S100β-GFP;NG2-dsRed mice.
Scale bar = 10 μm.
Figure 3—figure supplement 2
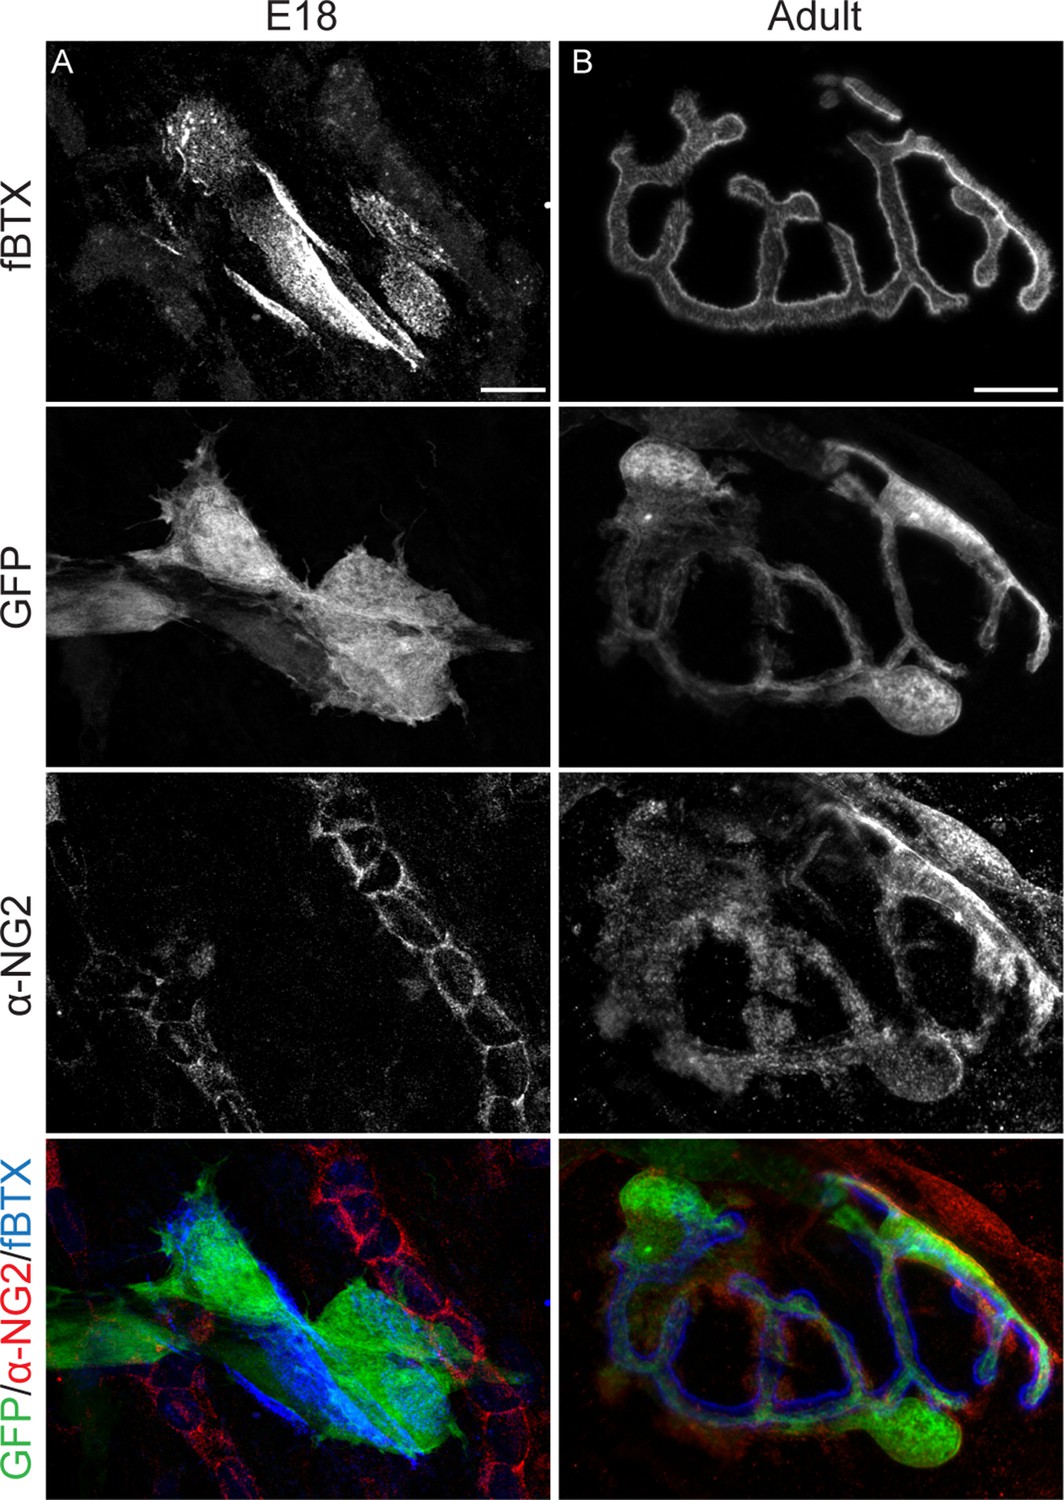
Cells at NMJs express NG2 in adults but not at embryonic timepoints.
(A) Immunohistochemical labeling of NG2 revealed that S100β-GFP+ cells at NMJs do not express NG2 in E18 S100β-GFP EDL muscle. (B) In the adult S100β-GFP EDL muscle, however, NG2 is detected in S100β-GFP+ cells at NMJs. Scale bar = 10 μm.
Figure 4 with 1 supplement
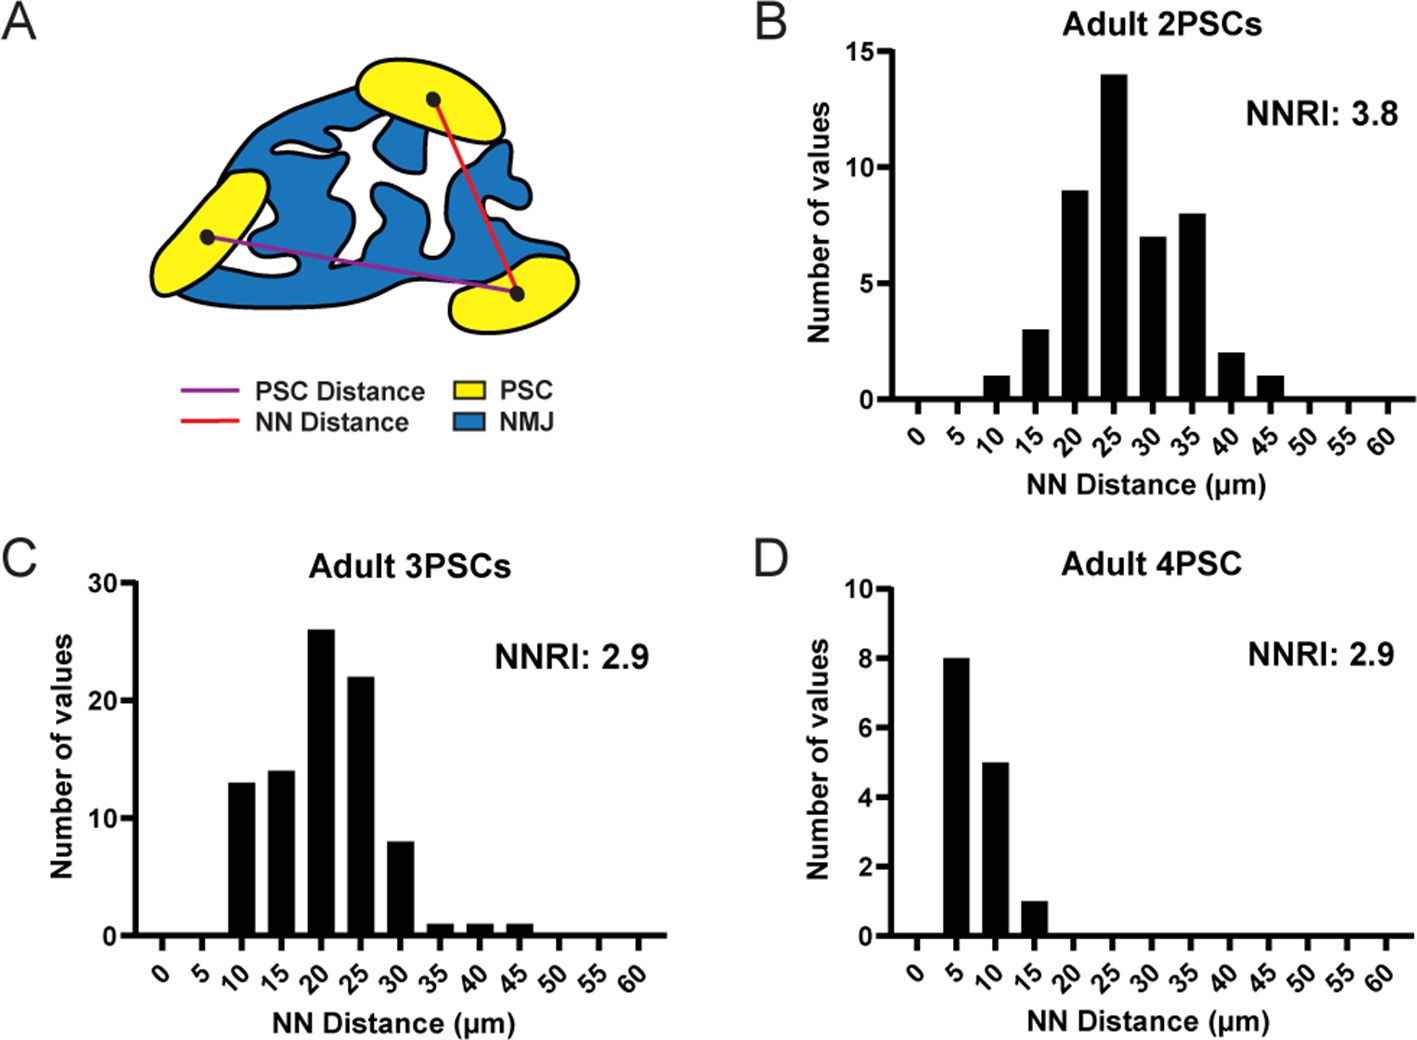
PSC distribution at the NMJ is non-random and ordered.
(A) The nearest neighbor (NN) distance, or the distance between a PSC and the closest neighboring PSC, is represented by the red line. The distance represented by the purple line is not considered for NN analysis. The distribution of NN values (shown in panels B, C, and D) is used to determine the degree of order in PSC distribution, as represented by the nearest neighbor regularity index (NNRI). Distribution patterns with an NNRI value greater than 1.91 are considered to be non-random. (B–D) Nearest neighbor distributions of S100-GFP+;NG2-dsRed+ PSCs in adult (P60) EDL muscle show that PSC distributions have orderly patterns of distribution with NNRI > 1.91 regardless of whether they are located at an NMJ with 2 PSCs (B), 3 PSCs (C), or 4 PSCs (D).
Figure 4—figure supplement 1

The number of PSCs associated with an NMJ varies but PSC density remains constant in the EDL, soleus (SOL), and diaphragm (DIA) muscles of adult mice.
(A–B) Representative images of NMJs, identified by nAChR clusters with fBTX (blue), in the (A) EDL and (B) diaphragm of adult S100β-GFP (green);NG2-dsRed (red) mice. (C) An analysis of the average number of PSCs at an NMJ shows that there are fewer PSCs at NMJs in the diaphragm as compared to the EDL and soleus. (D) An analysis of NMJs based on PSC number shows that the diaphragm has more NMJs with 1 PSC and fewer NMJs with 3 PSCs as compared to EDL and soleus. (E) When standardizing for NMJ size, the density of PSCs at NMJs is unchanged between the EDL, soleus and diaphragm. Error bar = standard error of the mean. Scale bar = 10 μm.
Figure 5
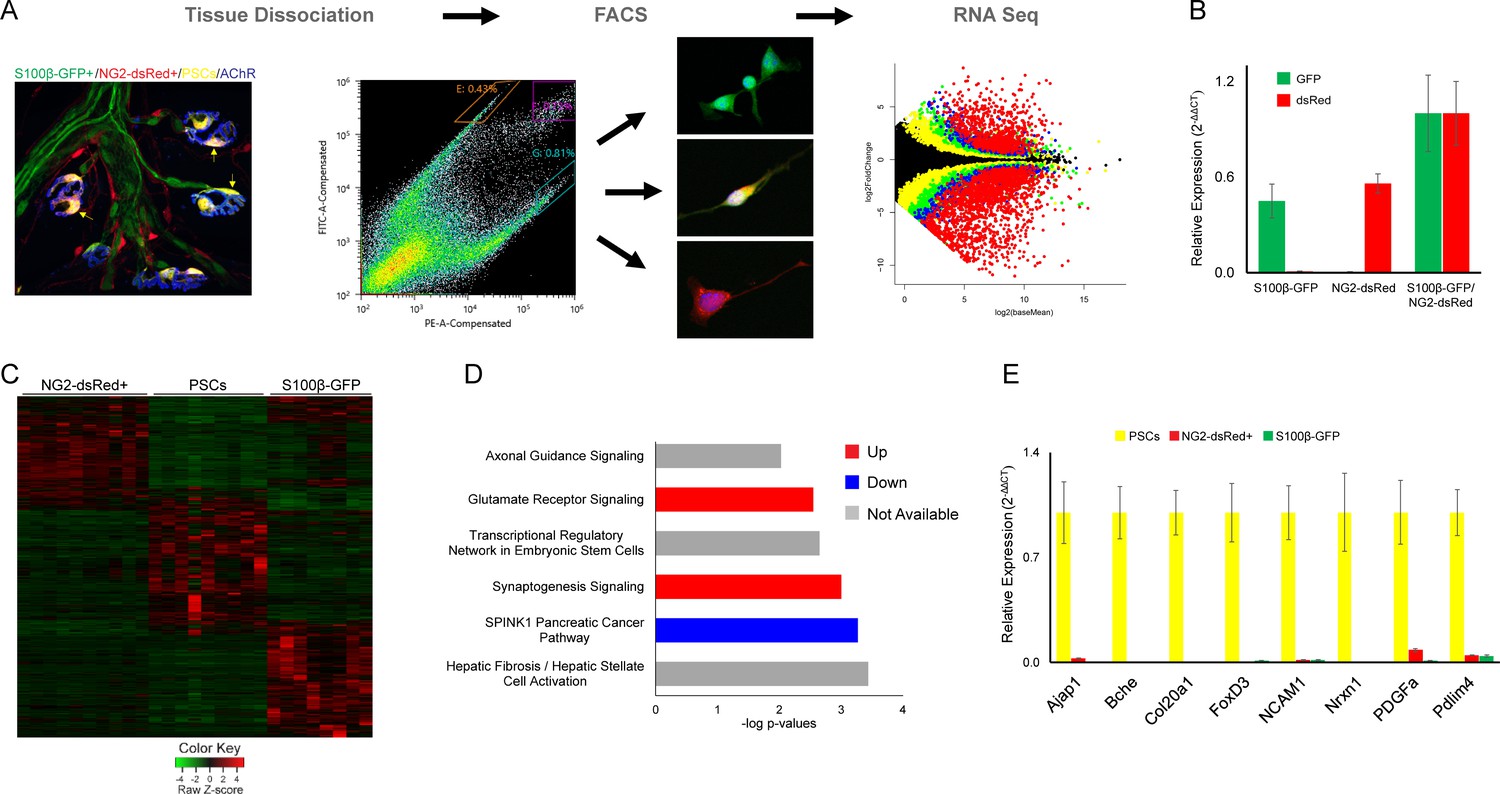
Molecular analysis of S100β-GFP+;NG2-dsRed+ PSCs, S100β-GFP+ Schwan cells, and NG2-dsRed+ cells following isolation with FACS.
(A) Skeletal muscle from juvenile S100B-GFP;NG2-dsRed mice was dissociated and S100-GFP+;NG2-dsRed+ PSCs, S100β-GFP+ Schwan cells, and NG2-dsRed+ cells were sorted by FACS for RNA seq and qPCR. Representative fluorescence intensity gates for sorting of S100β-GFP+, NG2-dsRed+ and S100β-GFP+;NG2-dsRed+ cells are indicated in the scatter plot. GFP (y-axis) and dsRed (x-axis) fluorescence intensities were used to select gates for S100β-GFP+ cells (outlined in orange), NG2-dsRed+ cells (outlined in teal), and double labeled S100β-GFP+;NG2-dsRed+ cells (outlined in purple). Representative images of cells from sorted populations are shown. (B) GFP and dsRed qPCR was performed on FACS isolated cells to confirm specificity of sorting gates. (C) A heat map of RNA-seq results depicting genes with at least 5 counts and expression differences with a p-value of less than 0.01 between any 2 cell types reveals a distinct transcriptome in S100β-GFP+;NG2-dsRed+ PSCs versus S100β-GFP+ Schwann cells and NG2-dsRed+ cells. (D) Synaptogenesis and axon guidance signaling are among the most influential signaling pathways in PSCs according to Ingenuity Pathway Analysis of genes enriched in PSCs versus S100β-GFP+, and NG2-dsRed+ cells. (E) qPCR was performed on FACS isolated S100-GFP+;NG2-dsRed+ PSCs, S100β-GFP+ Schwan cells, and NG2-dsRed+ cells to verify mRNA levels of RNA seq identified PSC enriched genes. In each analysis, transcripts were not detected or detected at low levels in S100β-GFP+ Schwann cells and NG2-dsRed+ cells. Error bar = standard error of the mean. Scale bar = 10 µm.
Tables
Table 1
Genes with functional roles in PSCs identified by RNA seq analysis of isolated PSCs.
| Gene | Description | Proposed role | Read count | Log2 change vs NG2-dsRed+ | Log2 change vs S100β-GFP+ | Reference |
|---|---|---|---|---|---|---|
| Adora2a | Adenosine A2a receptor | Detect/modulate synaptic activity | 8.1 | −3.68 | −2.67 | (Robitaille, 1995; Rochon et al., 2001) |
| Adora2b | Adenosine A2b receptor | Detect/modulate synaptic activity | 9.2 | −3.16 | −4.55 | (Robitaille, 1995; Rochon et al., 2001) |
| Agrn | Agrin | AChR aggregation | 2049.7 | 1.16 | 2.93 | (Georgiou and Charlton, 1999) |
| Bche | Butyrylcholinesterase | Modulate synaptic ACh levels | 7191.0 | 7.89 | 7.21 | (Trachtenberg and Thompson, 1996) |
| Cacna1c | L type Calcium channel, alpha 1 c | Detect/modulate synaptic activity | 14.3 | −4.92 | −2.10 | (Morris et al., 1999) |
| Cacna1d | L type Calcium channel, alpha 1d | Detect/modulate synaptic activity | 18.4 | −0.42 | −1.49 | (Morris et al., 1999) |
| Cd44 | CD44 antigen | Mediates cell-cell interactions | 1249.2 | 0.75 | −1.22 | (Woldeyesus et al., 1999) |
| Chrm1 | Muscarinic acetylcholine receptor M1 | Detect/modulate synaptic activity | 14.8 | n.d. | 0.89 | (Robitaille et al., 1997; Riethmacher et al., 1997) |
| Cnp | 2',3'-cyclicnucleotide 3' phosphodiesterase | Anchors axon terminal at NMJ | 2990.2 | 4.23 | 1.66 | (Personius et al., 2016) |
| Erbb2 | Erb-b2 receptor tyrosine kinase 2 | Synaptogenesis/maintenance | 228.9 | 0.84 | 1.37 | (Park et al., 2017; Pinard et al., 2003; Descarries et al., 1998) |
| Erbb3 | Erb-b2 receptor tyrosine kinase 3 | Synaptogenesis/maintenance | 2471.3 | 7.05 | 4.46 | (Park et al., 2017; Hess et al., 2007) |
| GAb1 | GRB2-associated protein 1 | Synaptic pruning | 693.8 | 0.31 | 1.57 | (Heredia et al., 2018) |
| Grm1 | Glutamate receptor, metabotropic 1 | Detect/modulate synaptic activity | 9.2 | n.d. | 0.80 | (Darabid et al., 2018) |
| Grm5 | Glutamate receptor, metabotropic 5 | Detect/modulate synaptic activity | 38.0 | n.d. | 2.84 | (Darabid et al., 2018) |
| LNX1 | Ligand of numb-protein X 1 | Regulate NRG1 signaling | 37.5 | −2.29 | −0.70 | (Peper et al., 1974) |
| MAG | Myelin-associated glycoprotein | Synaptogenesis/maintenance | 136.0 | 3.12 | −0.55 | (Personius et al., 2016) |
| Mpz | Myelin protein zero | Synaptogenesis/maintenance | 4590.7 | 2.54 | −0.79 | (Personius et al., 2016) |
| Nos2 | Nitric oxide synthase 2, inducible | Synaptogenesis/modulate synaptic activity | 13.4 | −2.91 | −1.28 | (Musarella et al., 2006) |
| Nos3 | Nitric oxide synthase 3, endothelial cell | Synaptogenesis/modulate synaptic activity | 48.6 | −2.69 | −0.68 | (Musarella et al., 2006) |
| P2ry1 | Purinergic receptor P2Y1 | Detect/modulate synaptic activity, synapse elimination | 144.4 | 0.52 | 2.21 | (Robitaille, 1995; De Winter et al., 2006; Feng and Ko, 2008) |
| P2ry2 | Purinergic receptor P2Y2 | Detect/modulate synaptic activity | 24.0 | −1.55 | −1.04 | (Robitaille, 1995) |
| P2ry10b | P2Y receptor family member P2Y10b | Detect/modulate synaptic activity | 10.0 | −1.25 | −3.14 | (Robitaille, 1995) |
| P2ry12 | P2Y receptor family member P2Y12 | Detect/modulate synaptic activity | 273.5 | n.d. | 3.70 | (Robitaille, 1995) |
| P2ry14 | P2Y receptor family member P2Y14 | Detect/modulate synaptic activity | 13.6 | −3.49 | −2.06 | (Robitaille, 1995) |
| S100b | S100 protein beta | Intracellular signaling | 1788.3 | 5.34 | 3.12 | (Reynolds and Woolf, 1992) |
| Sema3a | Semaphorin 3a | Detect/modulate synaptic activity | 136.6 | 2.95 | 1.07 | (Yang et al., 2001) |
| Tgfb1 | Transforming growth factor, beta 1 | AChR aggregation | 173.2 | −1.08 | −1.90 | (Petrov et al., 2014) |
Key resources table
| Reagent type (species) or resource | Designation | Source or reference | Identifiers | Additional information |
|---|---|---|---|---|
| Genetic reagent (M. musculus) | S100b-GFP | PMID:15590915 | MGI:3588512 | Dr. Wesley Thompson (Texas A and M) |
| Genetic reagent (M. musculus) | NG2-dsRed | PMID:18045844 | MGI:3796063 | Dr. Akiko Nishiyama (University of Connecticut) |
| Genetic reagent (M. musculus) | SOD1G93A | PMID:8209258 | MGI:2183719 | Dr. Deng (Northwestern University) |
| Antibody | Guinea pig polyclonal anti-NG2 | PMID:19058188 | Antibody Registry: AB_2572299 | 1:250 |
| Antibody | Alexa Fluor-488 goat polycolonal anti guinea pig | Invitrogen | RRID:AB_2534117 | 1:1000 |
| Antibody | Alexa Fluor-488 goat polyclonal anti rabbit | Invitrogen | Catalog# A-11008 | 1:1000 |
| Software, algorithm | Ingenuity Pathway Analysis | Qiagen | RRID:SCR_008117 | |
| Software, algorithm | GraphPad Prism | GraphPad | RRID:SCR_002798 | |
| Software, algorithm | R | The R Project for Statistical Computing | RRID:SCR_001905 | |
| Software, algorithm | ImageJ | ImageJ | RRID:SCR_003070 | |
| Software, algorithm | Bio-Rad CFX Manager | Bio-Rad | RRID:SCR_017251 | |
| Commercial assay or kit | PicoPure RNA Isolation Kit | ThermoFisher | Catalog#KIT0204 | |
| Commercial assay or kit | iScript cDNA synthesis kit | Bio-Rad | Catalog#1708891 | |
| Commercial assay or kit | SsoAdvanced PreAmp Supermix | Bio-Rad | Cataolog#1725160 | |
| Commercial assay or kit | iTAQ Univeral SYBR Green Supermix | Bio-Rad | Catalog#1725121 | |
| Chemical compound, drug | Alexa Fluor-555 alpha- bungarotoxin | Invitrogen | Catalog#B35451 | |
| Chemical compound, drug | DAPI | ThermoFisher | Catalog#D1306 |
Additional files
-
Supplementary file 1
Genes with highly enriched expression in perisynaptic Schwann cells.
- https://cdn.elifesciences.org/articles/56935/elife-56935-supp1-v2.docx
-
Supplementary file 2
Primers used for cDNA preamplification and qPCR.
- https://cdn.elifesciences.org/articles/56935/elife-56935-supp2-v2.docx
-
Transparent reporting form
- https://cdn.elifesciences.org/articles/56935/elife-56935-transrepform-v2.docx
Download links
A two-part list of links to download the article, or parts of the article, in various formats.
Downloads (link to download the article as PDF)
Open citations (links to open the citations from this article in various online reference manager services)
Cite this article (links to download the citations from this article in formats compatible with various reference manager tools)
Specific labeling of synaptic schwann cells reveals unique cellular and molecular features
eLife 9:e56935.
https://doi.org/10.7554/eLife.56935


