Flexible motor sequence generation during stereotyped escape responses
- Hefei National Laboratory for Physical Sciences at the Microscale, Center for Integrative Imaging, School of Life Sciences, University of Science and Technology of China, China
- Chinese Academy of Sciences Key Laboratory of Brain Function and Disease, China
- Samuel Lunenfeld Research Institute, Mount Sinai Hospital, Canada
- University of Toronto, Canada
- Department of Neurobiology, University of Massachusetts Medical School, United States
- Center for Excellence in Brain Science and Intelligence Technology, Chinese Academy of Sciences, China
Figures
Figure 1 with 2 supplements
Flexible motor sequence generation during C. elegans escape responses.
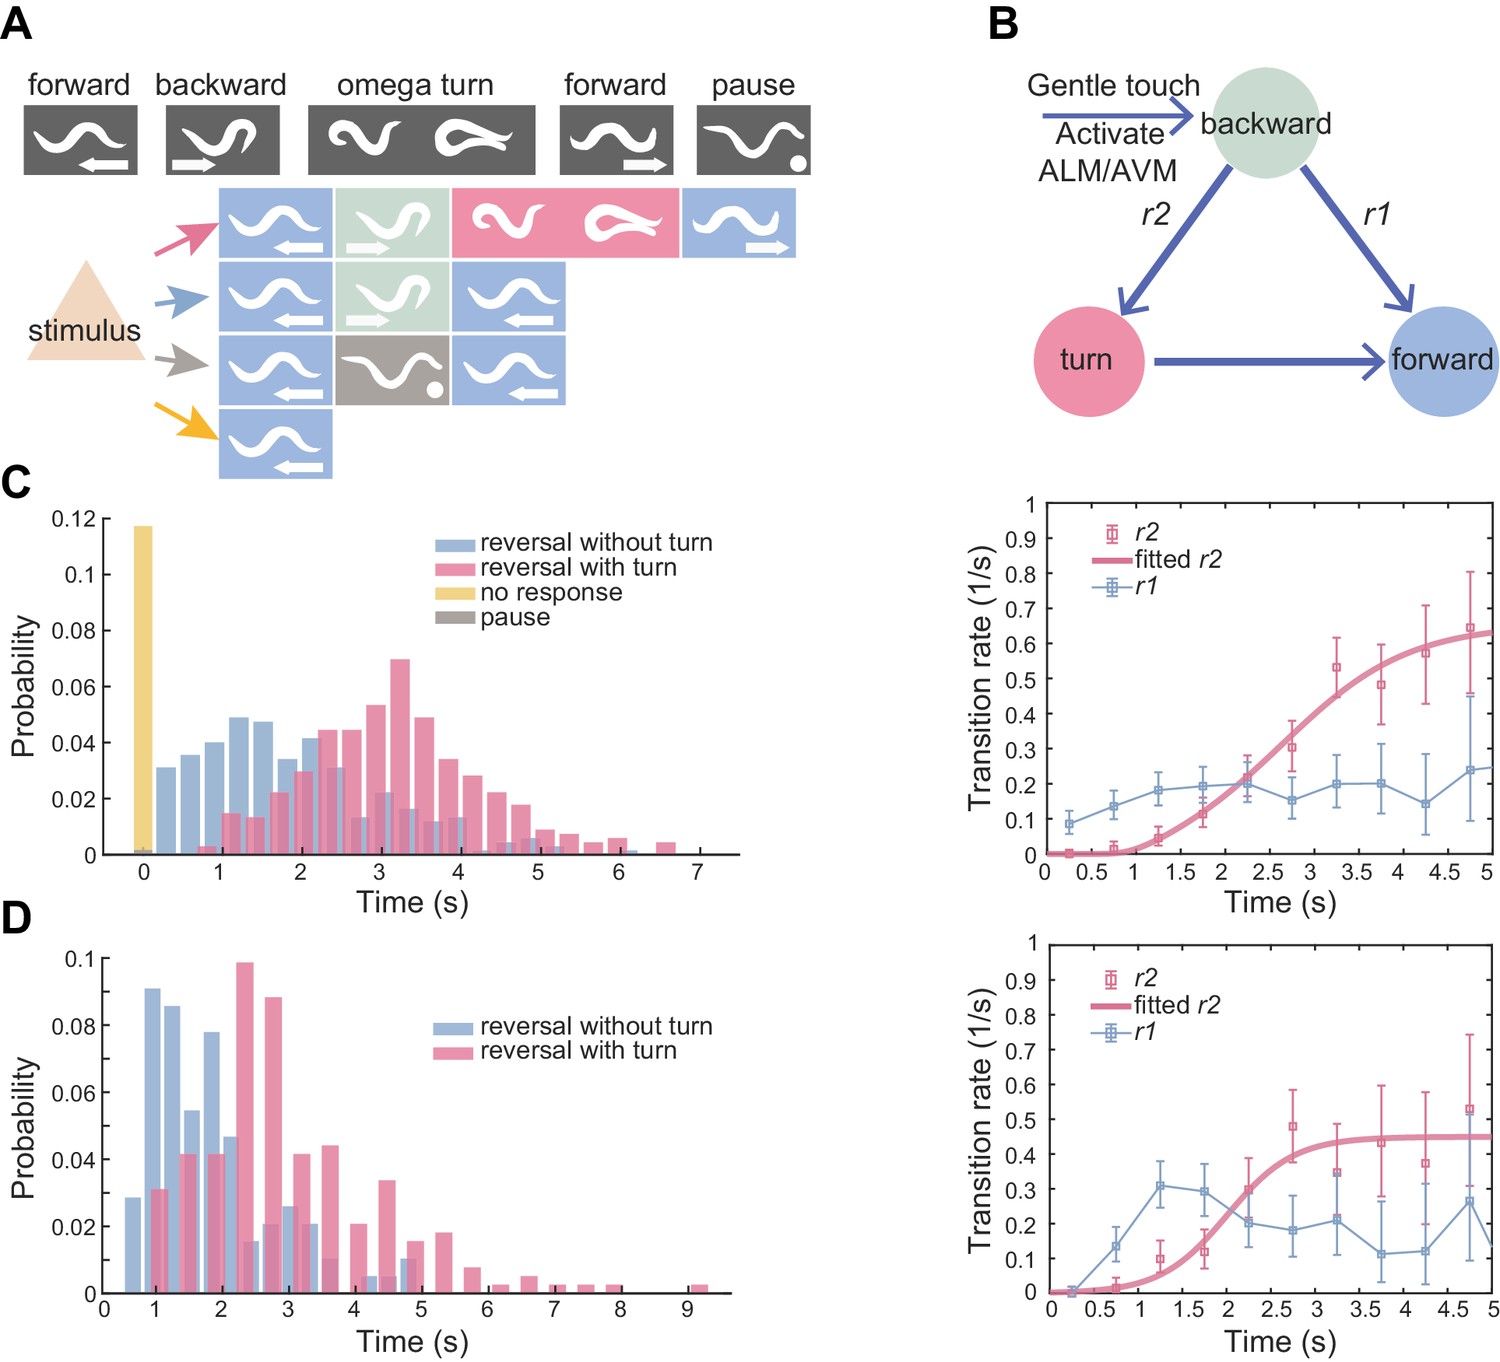
(A) Optogenetic stimulation of mechanosensory neurons ALM/AVM (Pmec-4::ChR2) was carried out with blue light (473 nm, 4.63 mW/mm2) for 1.5 s during animal forward movement. Identical stimuli could induce four different behavioral outputs: reversal followed by an omega turn, reversal followed by forward movement, pause state or forward movement (no response). (B) Definitions of type-I and type-II transitions. (C) Reversal length distribution (left) and transition rates (right) during ALM/AVM (Pmec-4::ChR2) triggered escape responses. Total number of trials, n = 674; reversal without turn, n = 272; reversal with turn, n = 322; no response, n = 79; pause, n = 1. Number of animals used can be found in Supplementary file 4. Here and below, the error bars of transition rates represent 95% binomial proportion confidence interval. (D) Reversal length distribution (left) and transition rates (right) during thermal stimulus induced escape responses. Wild-type, n = 385. Animal heads were thermally stimulated by an infrared laser (1480 nm; 400 mA) for 0.75 s. Solid lines are theoretical fits using Equation 4 and fitted type-II transition rates pass goodness-of-fit test (p>0.05).
-
Figure 1—source data 1
Source data for Figure 1 and Figure 1—figure supplement 1.
- https://cdn.elifesciences.org/articles/56942/elife-56942-fig1-data1-v2.zip
Figure 1—figure supplement 1
Definition of the type-II transition and statistical test of reversal length distribution.
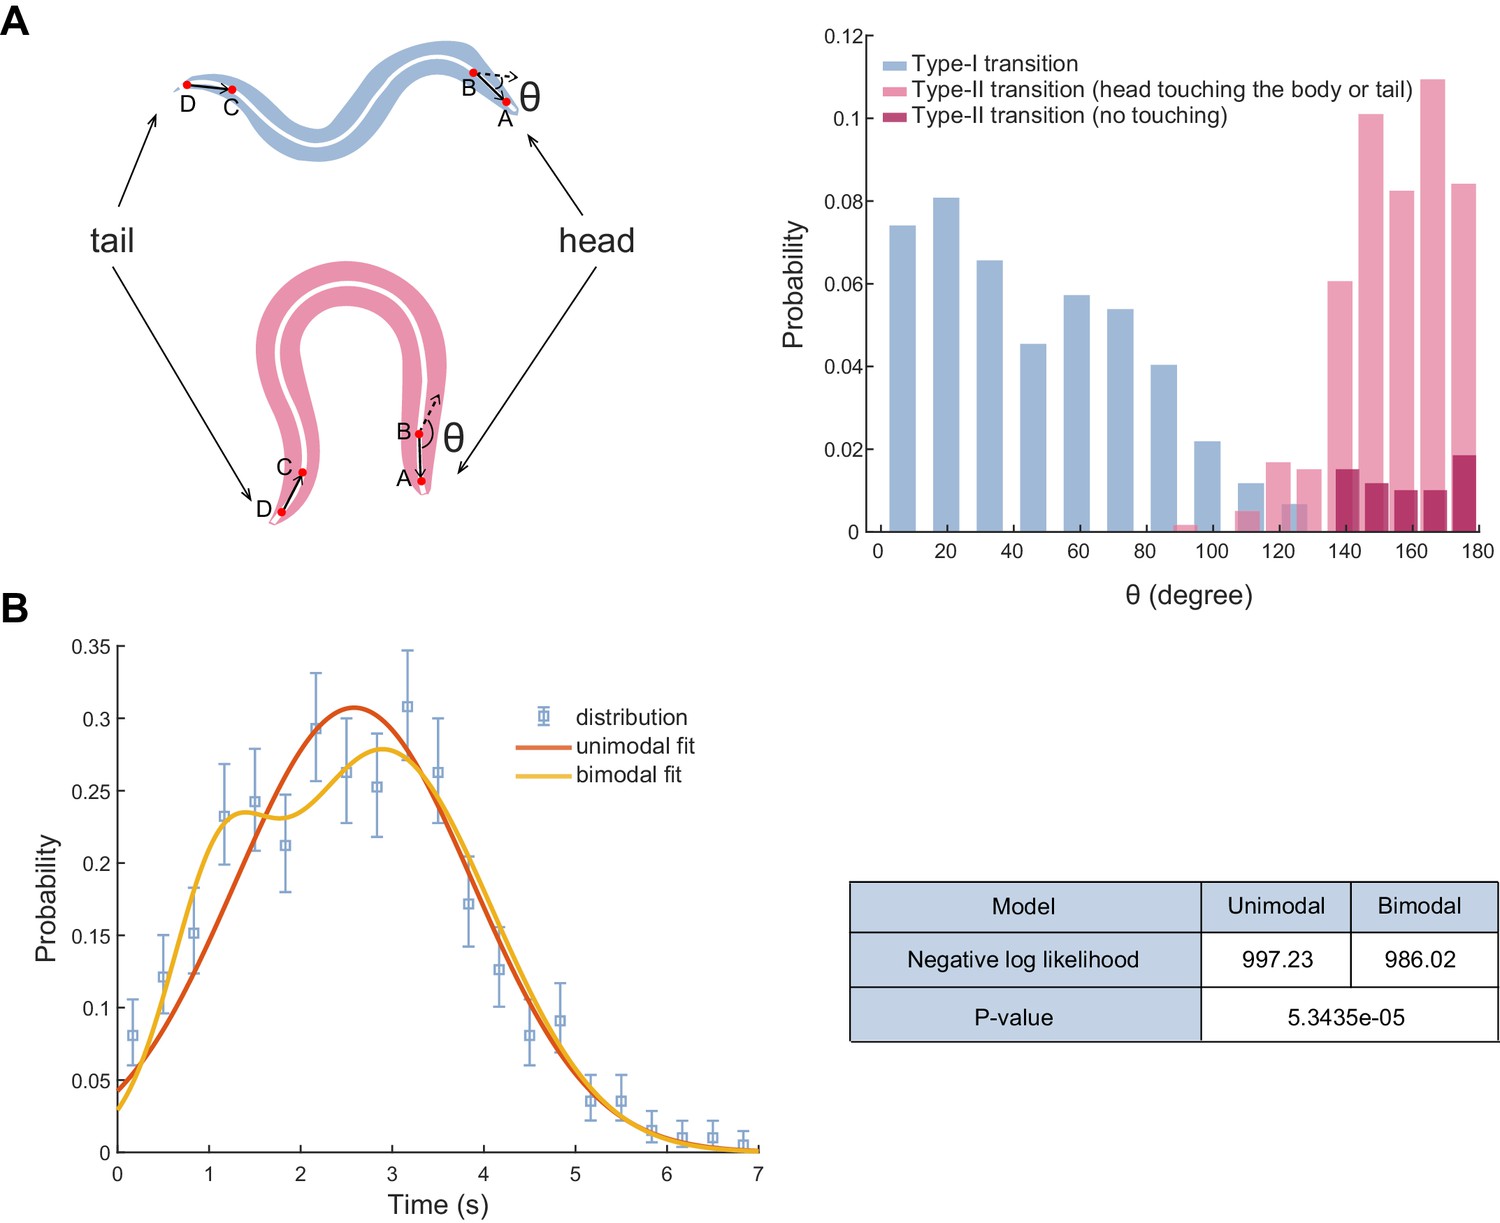
(A) Left, examples of reorientation angle θ during the type-I (up) and the type-II transition (bottom). θ was measured as the angle between the head vector (BA) and the tail vector (DC). The worm body centerline was equally divided into 100 segments. The head vector (BA) is denoted as point B (mean coordinate of the 10th-14th segment) to A (mean coordinate of the 1st-5th segment), while the tail vector is denoted as point D (mean coordinate of 96th-100th segment) to C (mean coordinate of the 86th-90th segment). Immediately after the end of reversal, we identified a frame in which the worm exhibited a highly coiled body posture to calculate θ. If the head touched the body or tail, θ was computed from the frame before touching. Right, distribution of θ during ALM/AVM (Pmec-4::ChR2) triggered escape responses. A type-II transition was identified by either the head touching the body (or tail) or θ > 135° within a single head swing. Total trials, n=594; type-I transition, n=272; type-II transition (touching the body or tail), n=283; type-II transition (no touching), n=39. (B) A Gaussian mixture model to fit the reversal length distribution during ALM/AVM (Pmec-4::ChR2) triggered escape responses. We performed the likelihood ratio test between the unimodal Gaussian distribution fit and the bimodal Gaussian mixture model fit. After computing the difference of the negative log likelihoods, we found a p-value = 5.4e-5 using the distribution, where k = 3 is the difference of the number of free parameters in the unimodal (total 2 parameters) and bimodal (total 5 parameters) distribution. At level α=0.01, we have sufficient evidence that the bimodal distribution fits the reversal length better than the unimodal distribution.
Figure 1—video 1
Three main types of escape responses, Related to Figure 1.
Optogenetic activation of ALM/AVM mechanosensory neurons in freely moving worms for 1.5 s induced three types of responses.
Figure 2 with 2 supplements
Interneurons AIB are crucial for motor state transitions.
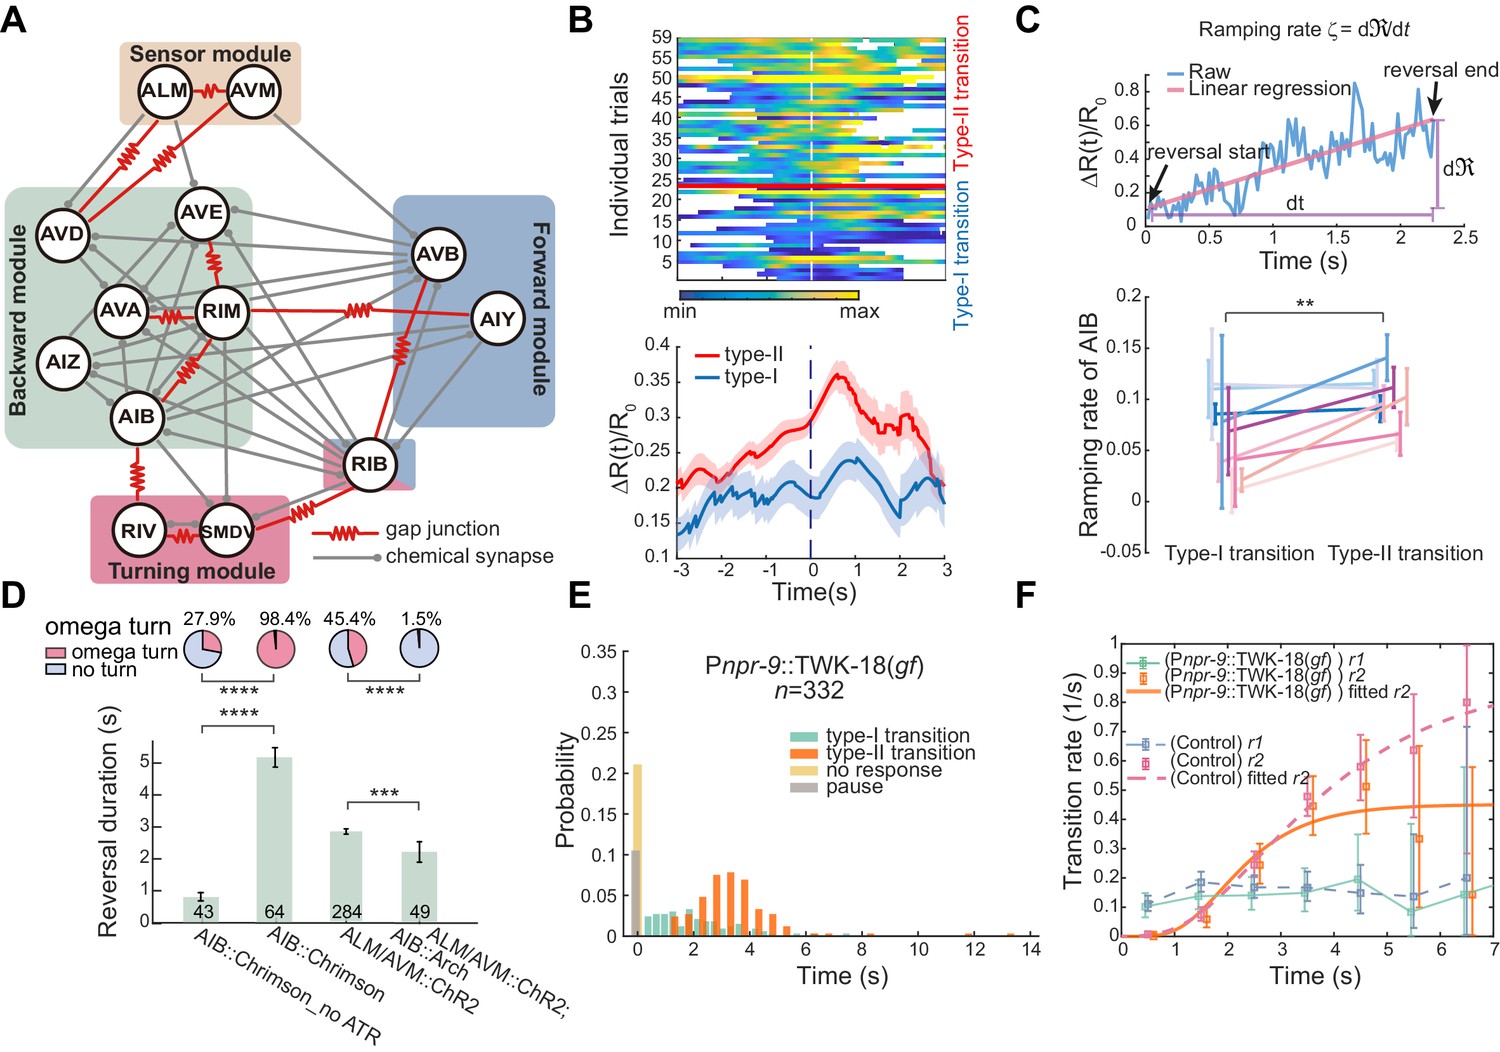
(A) Simplified circuit diagram underlying the gentle touch induced escape responses. Neurons were grouped into four modules based on their functional roles and activity patterns. (B) Calcium activity of AIB during spontaneous reversals before type-I (n = 23) and type-II (n = 36) transitions in unrestrained behaving animals (Pinx-1::GCaMP6;Pinx-1::wCherry). Here, data are aligned to the ends of reversals (vertical dashed line, t = 0). Heat map across trials (up) and ΔR(t)/R0 (Mean ± SEM, bottom) are shown. (C) Ramping rate of calcium activity in AIB. Up, raw single trial ΔR(t)/R0 from reversal start to reversal end. The ramping rate is the slope of the red line, fitted by linear regression. Bottom, ramping rates of AIB during type-I and type-II transitions. Each color (Mean ± SEM) represents single animal data across multiple trials. Total nine animals (Pinx-1::GCaMP6;Pinx-1::wCherry) were tested. Very short reversals (less than 1.5 s) are excluded, for some of them have negative ramping rates and the slope estimate is susceptible to noise (but including those trials doesn’t affect our conclusion). **p<0.01, two-way ANOVA. (D) Optogenetic activation of AIB (635 nm, 4.46 mW/mm2, 7 s) or inhibition of AIB (561 nm, 21.71 mW/mm2, 12 s) during ALM/AVM (473 nm, 14.71 mW/mm2, 1.5 s) triggered avoidance behaviors, reversal durations (bar graph) and fractions of animals executing omega turns (pie chart) are shown. Error bars are SEMs. Bar graph, Mann–Whitney U test. Pie chart, χ2 test. *p<0.05, ***p<0.001, ****p<0.0001. Here and below, the actual turning percentages (nturn/ntotal) are noted beside the pie chart and numbers within the bars indicate the number of trials with reversal. (E–F) Reversal length distribution (E) and transition rates (F) during escape responses when AIB were persistently hyperpolarized through an exogenous expression of the potassium channel TWK-18. Control group is from Figure 1C.
-
Figure 2—source data 1
Source data for Figure 2 and Figure 2—figure supplement 1.
- https://cdn.elifesciences.org/articles/56942/elife-56942-fig2-data1-v2.zip
Figure 2—figure supplement 1
Local interneurons AIB and RIM in the backward module differentially modulate motor state transitions.
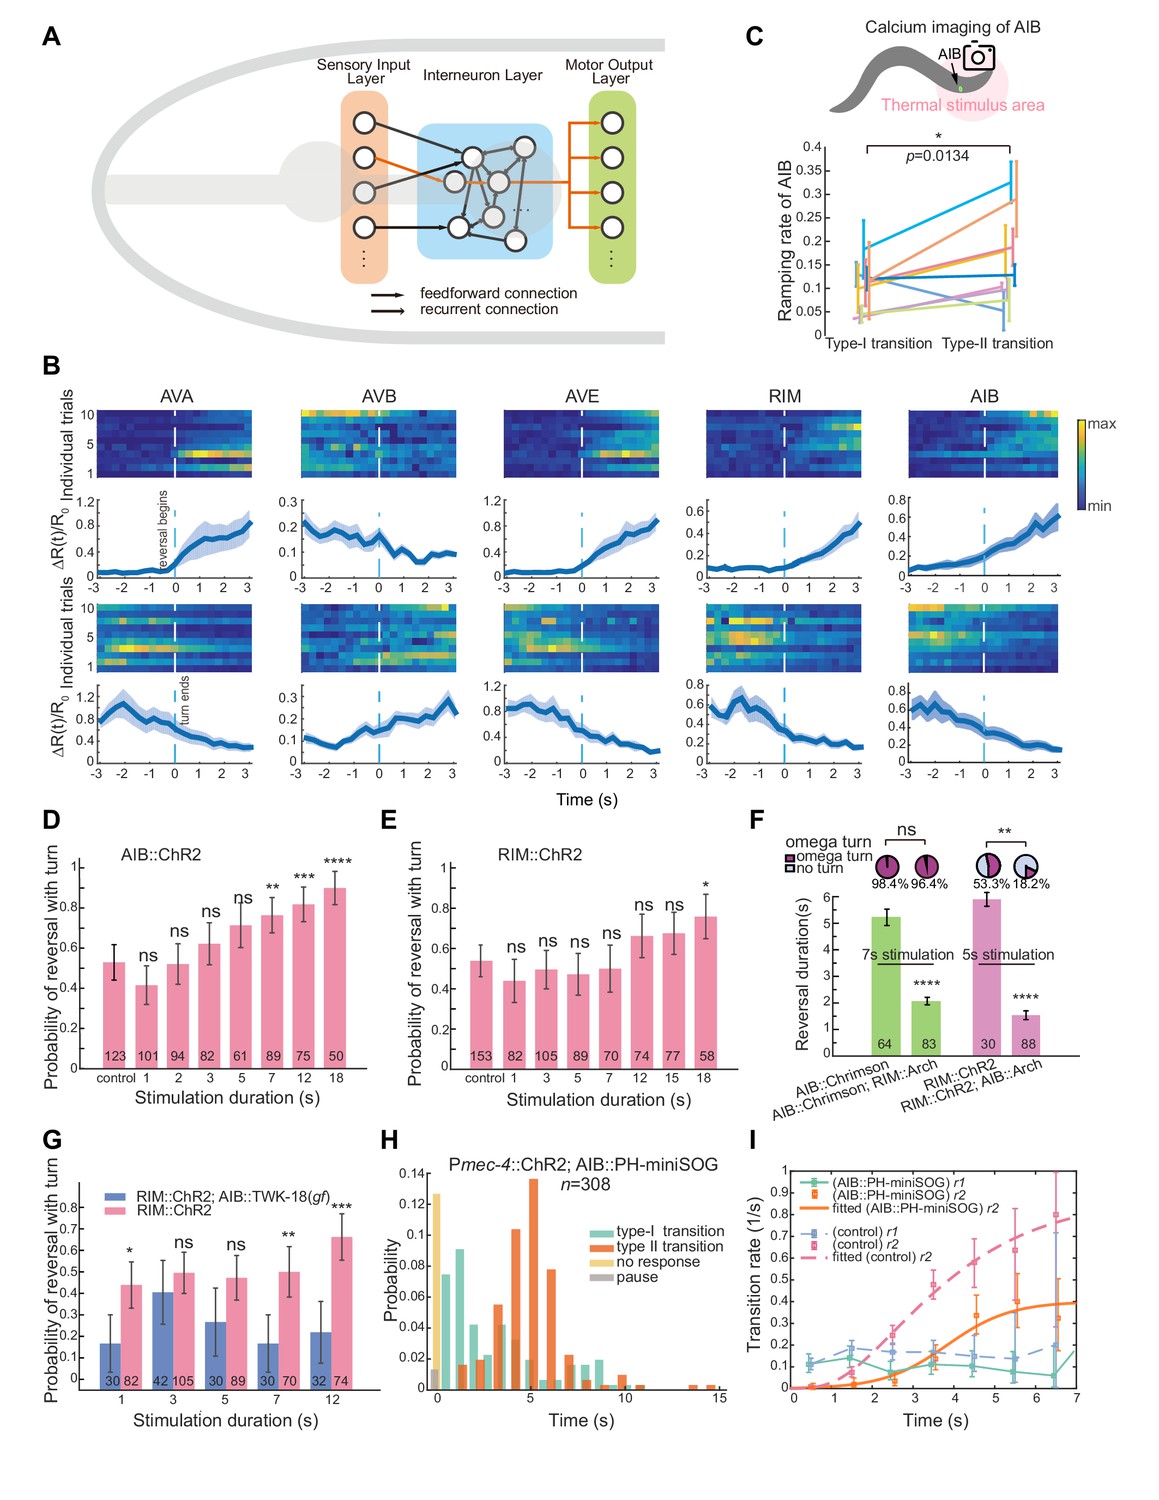
(A) Schematic diagram of the C. elegans nervous system. (B) Multi-neuron calcium imaging in freely behaving animals (Pnmr-1/Plim-4/Plgc-55/Pnpr-9::NLS::wCherry::SL2::GCaMP6). Interneurons in the backward and forward modules were simultaneously imaged using a confocal microscopy (see Materials and methods for details). Data are aligned to the onset of a reversal (up, vertical dashed lines, t = 0) or the end of a turn (bottom, vertical dashed lines, t = 0). Heat map across trials and ΔR(t)/R0 (Mean ± SEM) across trials are shown. (C) Ramping rate of AIB calcium activity during thermally-induced escape responses. Ramping rate is significantly higher in type-II transition (nine animals, each point has more than three trials). *p<0.05, two-way ANOVA. (D–E) Characterization of the probability of type-II transition during optogenetic stimulation of two different interneurons AIB (left) and RIM (right) for varying durations. Longer activation of AIB consistently led to a higher probability of type-II transition (left). The control groups are animals performing spontaneous motor state transitions without optogenetic stimulation. A blue laser (473 nm, 14.71 mW/mm2) was used to stimulate ChR2 expressed neurons. (F–G) Hyperpolarization of RIM (Ptdc-1::Arch) or AIB (Pnpr-9::Arch) both affected reversal duration (bar graph), but only inhibiting AIB affected the probability of type-II transition (pie chart). In F), simultaneous optogenetic activation of AIB (or RIM) (635 nm, 4.46 mW/mm2 for AIB or 473 nm, 14.71 mW/mm2 for RIM) and inhibition (561 nm, 6.80 mW/mm2) of RIM (or AIB) were carried out for 7 (or 5) seconds. In G), RIM were activated for varying durations, while AIB were inactivated through an exogenous expression of the potassium channel TWK-18. (H–I) Reversal length distribution and transition rates after optogenetic ablation of AIB. ALM/AVM were optogenetically activated for 1.5 s to trigger avoidance behavior. AIB were ablated by exogenous expression of a membrane targeted PH-miniSOG. Data from Figure 1C) are used as control. For reversal duration, error bars indicate SEMs. Mann–Whitney U test. For probability of turn, error bars indicate 95% binomial proportion confidence interval. χ2 test. *p<0.05, **p<0.01, ***p<0.001, ****p<0.0001. All multiple comparisons were adjusted using Bonferroni correction.
Figure 2—video 1
AIB neurons are crucial for turn and backward movement, Related to Figure 2 and Figure 2—figure supplement 1.
Optogenetic activation of AIB neurons in free-moving animals reliably triggered backward movement followed by omega turns. Inhibition of AIB neurons quickly terminated backward movement.
Figure 3 with 3 supplements
Feedforward excitation via electrical coupling drives omega turns.
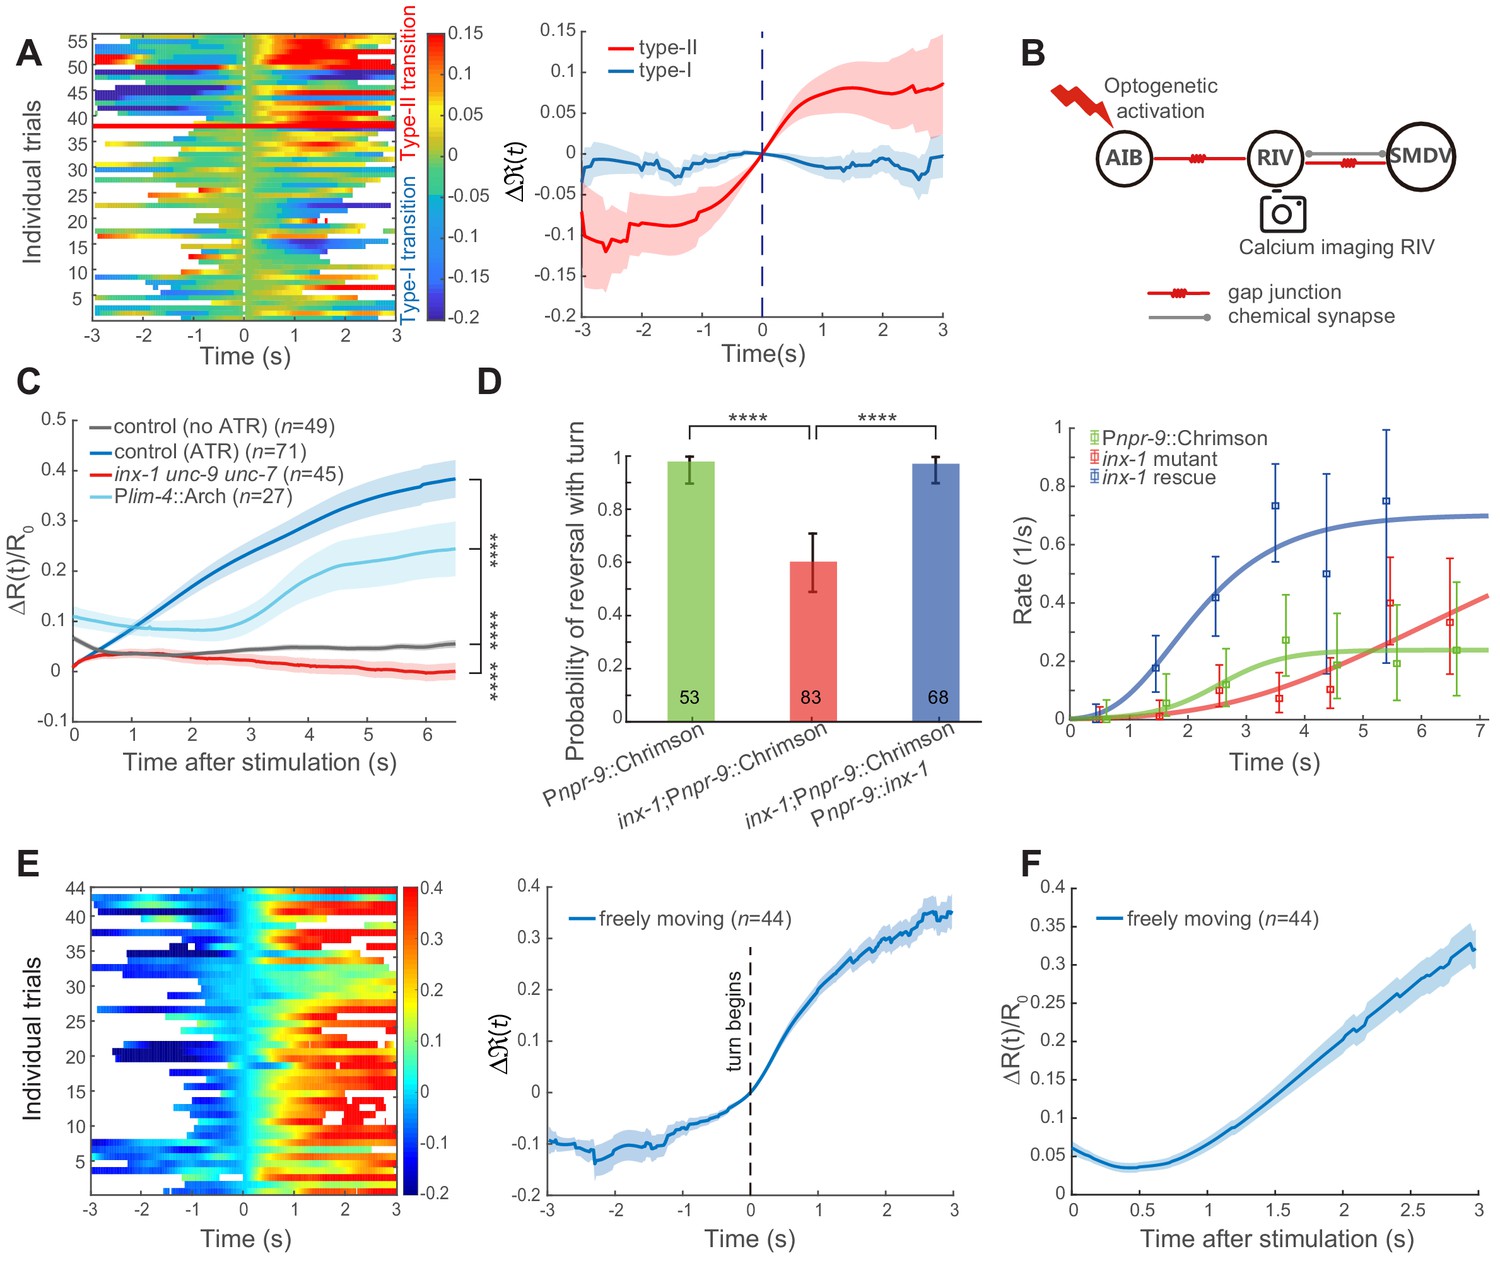
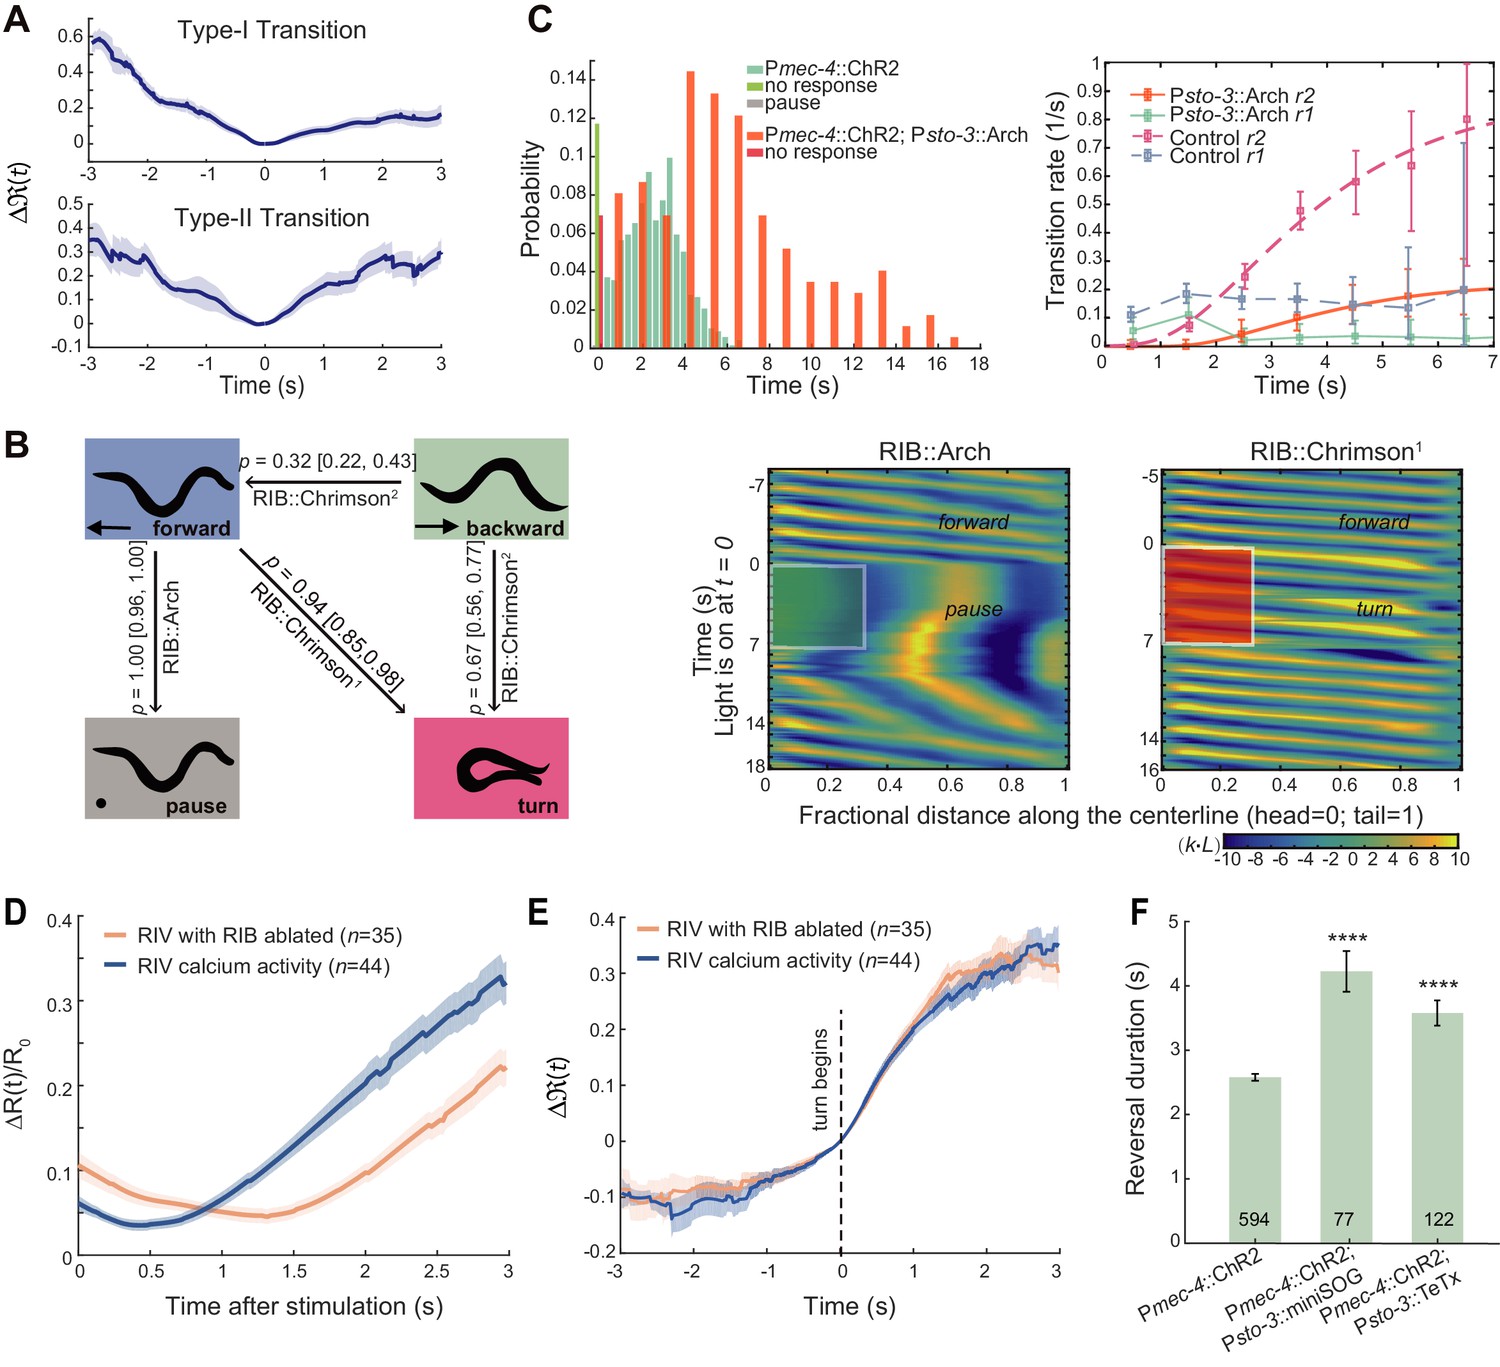
(A) Calcium activity of RIV during the type-I (n = 38) and the type-II (n = 18) transitions in spontaneous behaving animals (Plim-4::GCaMP6). Here, data are aligned to the ends of reversals (vertical dashed line, t = 0). Heat map across trials (left) and Δ(t) (Mean ± SEM, right, also see Materials and Methods) are shown. (B) Optical neurophysiology for probing the feedforward coupling between the backward module and the turning module. (C) Simultaneous optogenetic activation of AIB (635 nm, 6.11 mW/mm2) and calcium imaging of RIV in immobilized animals. ΔR(t)/R0 (Mean ± SEM) under different genetic backgrounds are shown: control (ATR) is wild-type (dark blue); inx-1unc-9unc-7 triple mutant (red); calcium imaging of RIV in the presence of moderate inhibition (561 nm, 1.94 mW/mm2) of RIV (light blue, Plim-4::Arch). The control (no ATR) represents imaging data from wild-type animals without feeding all-trans retinal (grey). ****p<0.0001, two-way ANOVA. (D) Probability of a reversal followed by a turn (left) and type-II transition rates (right) for gap junction deficient mutants. AIB, expressing Chrimson, were optogenetically activated for 7 s (635 nm, 4.46 mW/mm2) in wild-type animals (green), gap junction deficient mutants inx-1 (red), and inx-1 mutants, in which INX-1 channels were restored specifically in AIB (blue). Error bars indicate 95% binomial proportion confidence interval. χ2 test. ****p<0.0001. (E) Simultaneous optogenetic activation of AIB (635 nm, 6.11 mW/mm2) and calcium imaging of RIV in unrestrained behaving animals. Left, calcium activity heatmap across trials. t < 0 represents reversals. Omega turns start at t = 0. Right, (mean ± SEM) are shown (blue). (F) Data are related to (E), but t = 0 is aligned to the beginning of AIB stimulation.
-
Figure 3—source data 1
Source data for Figure 3.
- https://cdn.elifesciences.org/articles/56942/elife-56942-fig3-data1-v2.zip
Figure 3—figure supplement 1

Possible polysynaptic pathways from AIB to RIV (less than four layers are shown) according to C. elegans connectome.
SDQ were oxygen-sensing neurons and topological cluster analyses suggest ADA may be involved in chemosensation. RIM, RIS and RIV have direct electrical coupling with AIB.
Figure 3—figure supplement 2
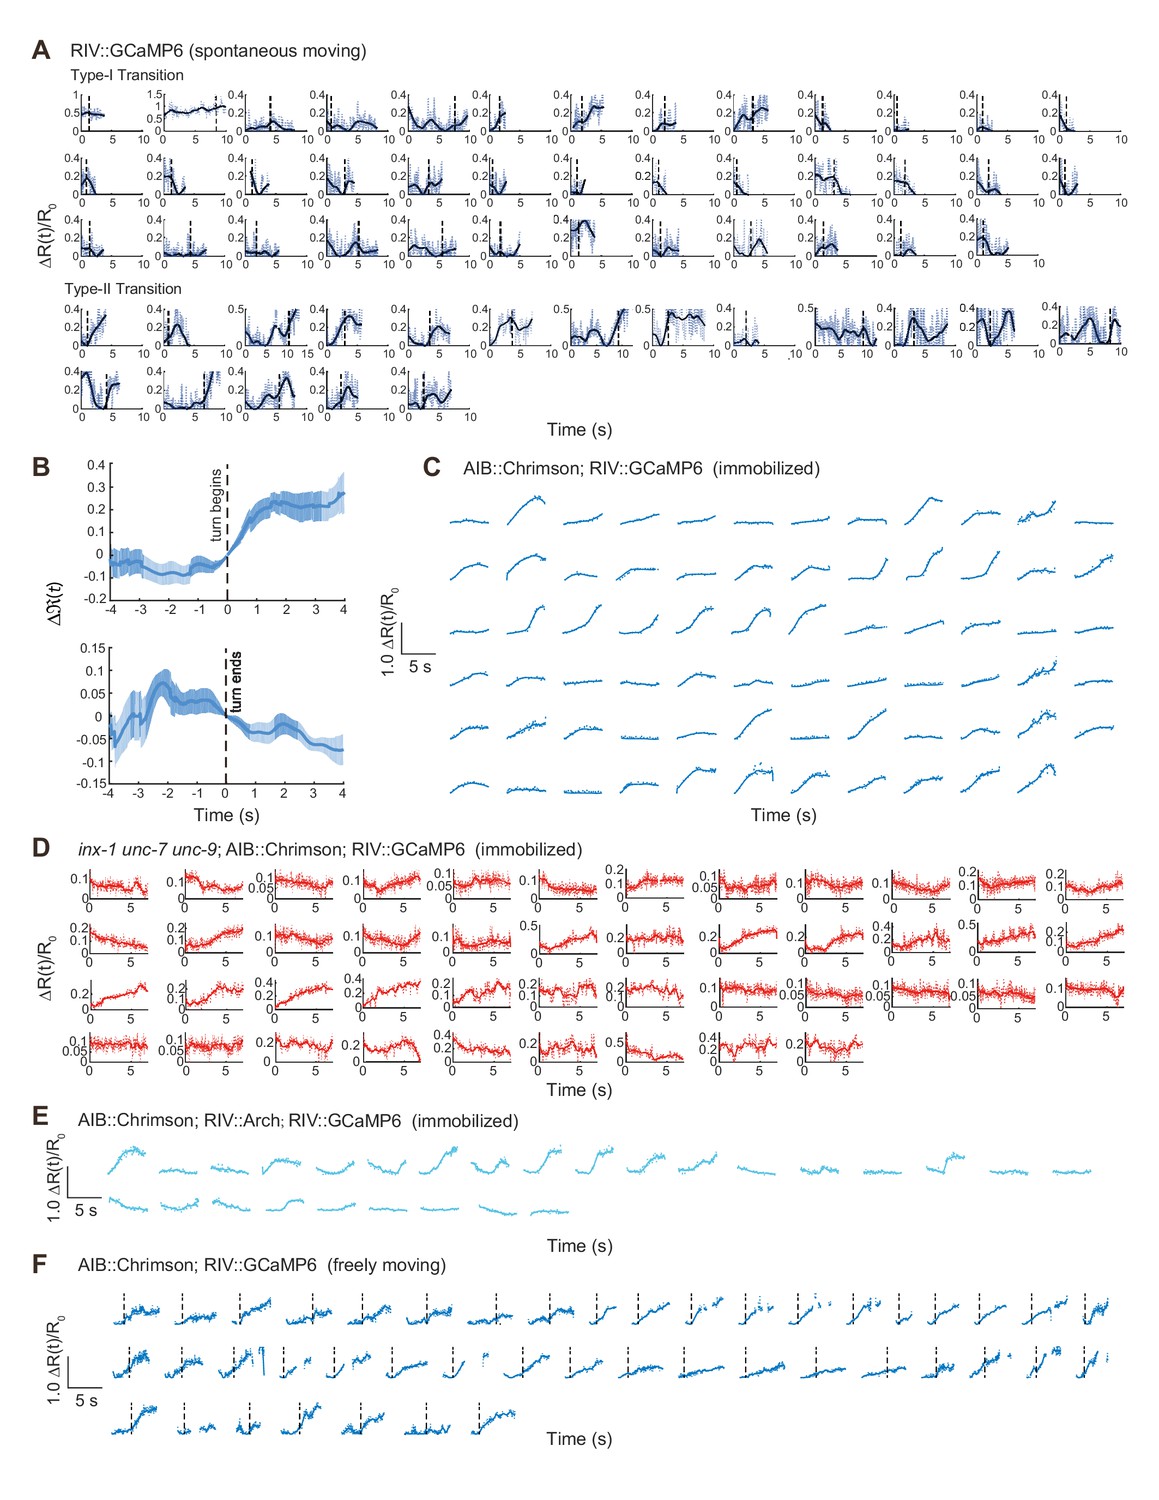
Optogenetic activation of AIB and calcium imaging of RIV in different experimental conditions.
(A and C–F) Single trial data related to Figure 3A, (C and E–F). In (F), dashed lines indicate the start of a turn. (B) Calcium activity of RIV (Plim-4::GCaMP6, n = 20) during thermal stimulus induced escape responses in freely moving animals. Δ(t) = [ΔR(t) - ΔR(t = 0)]/R0 (mean ± SEM) are shown. t = 0 is aligned to the initiation (up) or termination (bottom) of an omega turn.
Figure 3—video 1
Optogenetic activation of AIB under various genetic backgrounds, Related to Figure 3 and Figure 4.
Optogenetic activation of AIB in eat-4 glutamate vesicular transport deficient mutants or glutamate postsynaptic receptor mutants induced an omega turn preceded by a much shorter reversal. Specifically restoring eat-4 in AIB or glc-1 in AIY promoted a longer reversal. Activating AIB in gap junction deficient mutant inx-1 reduced the probability of omega turn, which were rescued by restoring inx-1 in AIB.
Figure 4 with 2 supplements
Glutamatergic inhibition modulates type-II transition.
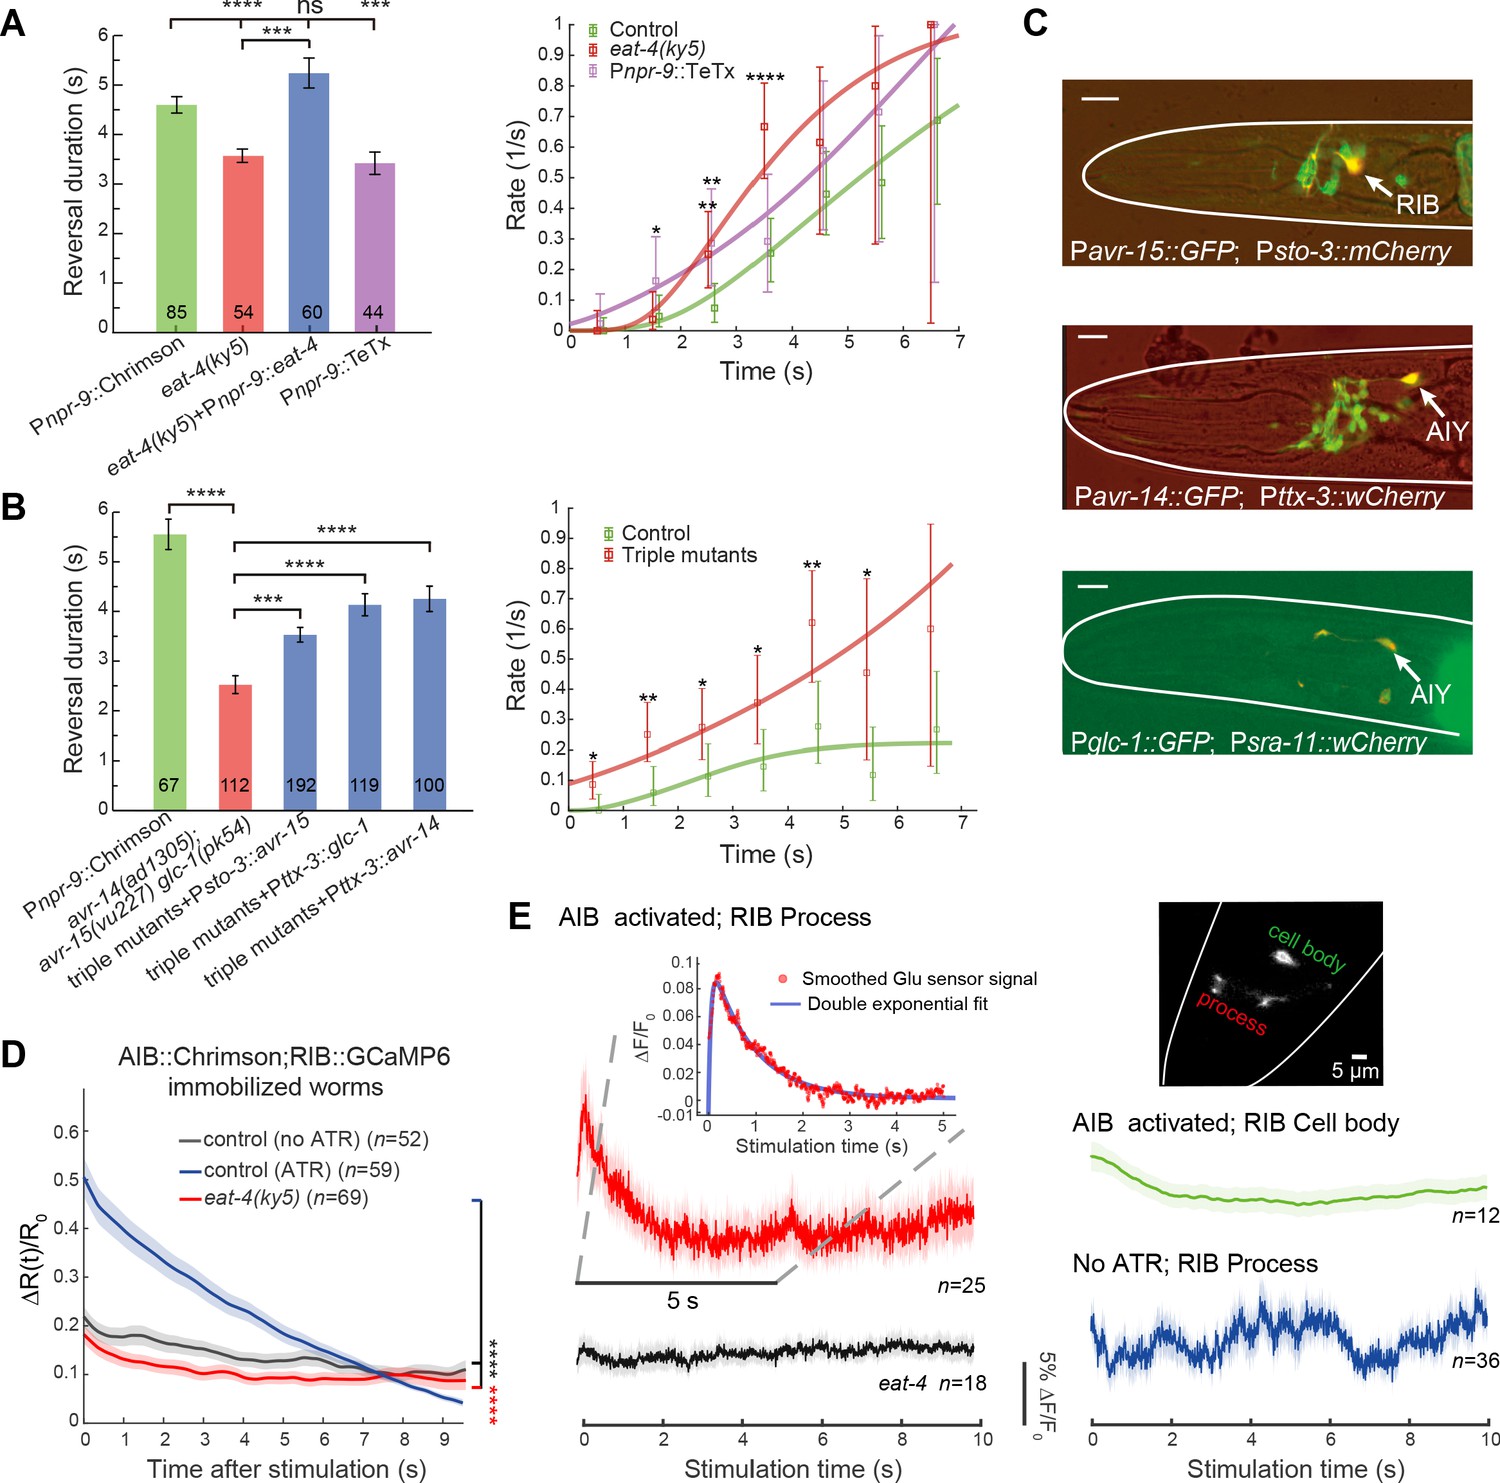
(A) Reversal durations (left) and type-II transition rates (right) in glutamatergic synaptic transmission deficient animals upon strong and persistent optogenetic activation of AIB. Optogenetic stimulation was delivered for 7 s using red light (635 nm, 4.46 mW/mm2). Right, compare r2 in eat-4 mutant or in Pnpr-9::TeTx with control animals across the whole distribution (Kolmogorov-Smirnov test, p=6.2e-7, p=0.0026) or within a time window (χ2 test: * p<0.05, ** p<0.01, *** p<0.001, **** p<0.0001). (B) Reversal durations (left) and type-II transition rates (right) in GluCl receptor mutants upon optogenetic activation of AIB (635 nm, 4.46 mW/mm2). Right, compare r2 in triple receptor mutant with control animals across the whole distribution (Kolmogorov-Smirnov test, p=5.9e-8) or within a time window (χ2 test: * p<0.05, ** p<0.01). (C) Genes encoding GluCl receptors were expressed in local interneurons RIB and AIY respectively. GFP reporter lines were constructed using avr-14, avr-15 and glc-1 promoters, respectively; mCherry (or wCherry) reporters were used for cell identification. Expression pattern from one section is showed. Scale bar, 10 µm. (D) Simultaneous optogenetic activation of AIB (635nm, 6.11 mW/mm2) and calcium imaging of RIB in immobilized animals under wide-type (control (ATR)) (blue) or eat-4 glutamate deficient mutant background (red). ΔR(t)/R0 (Mean ± SEM) are shown. t = 0 represents the beginning of AIB stimulation. The control group (no ATR) (grey) represents imaging data from animals without feeding all-trans retinal. ****p<0.0001, two-way ANOVA. (E) Functional coupling between AIB and RIB neurons was directly tested through glutamate imaging. Upon stimulation of AIB (Pnpr-9::Chrimson), the process (red), cell body (green) of the RIB (Psto-3::iGluSnFR) and the RIB process in eat-4 glutamate deficient mutants (grey) exhibited distinct fluorescence signals. The control group (blue) represents imaging data from animals without feeding all-trans retinal. Raw iGluSnFR imaging was recorded at 150 Hz. Trial average (bold color) and SEM (shaded region) are shown. Inset, the fluorescence signal of the process (red) is fitted with a double exponential function (blue), , where , and are free parameters. represents the time constant of glutamate signal decay, and is the baseline constant, which was subtracted in the inset plot. For reversal duration, Error bars indicate SEM. Mann–Whitney U test: ***p<0.001, ****p<0.0001. All multiple comparisons were adjusted using Bonferroni correction.
-
Figure 4—source data 1
Source data for Figure 4 and Figure 4—figure supplements 1–2.
- https://cdn.elifesciences.org/articles/56942/elife-56942-fig4-data1-v2.zip
Figure 4—figure supplement 1
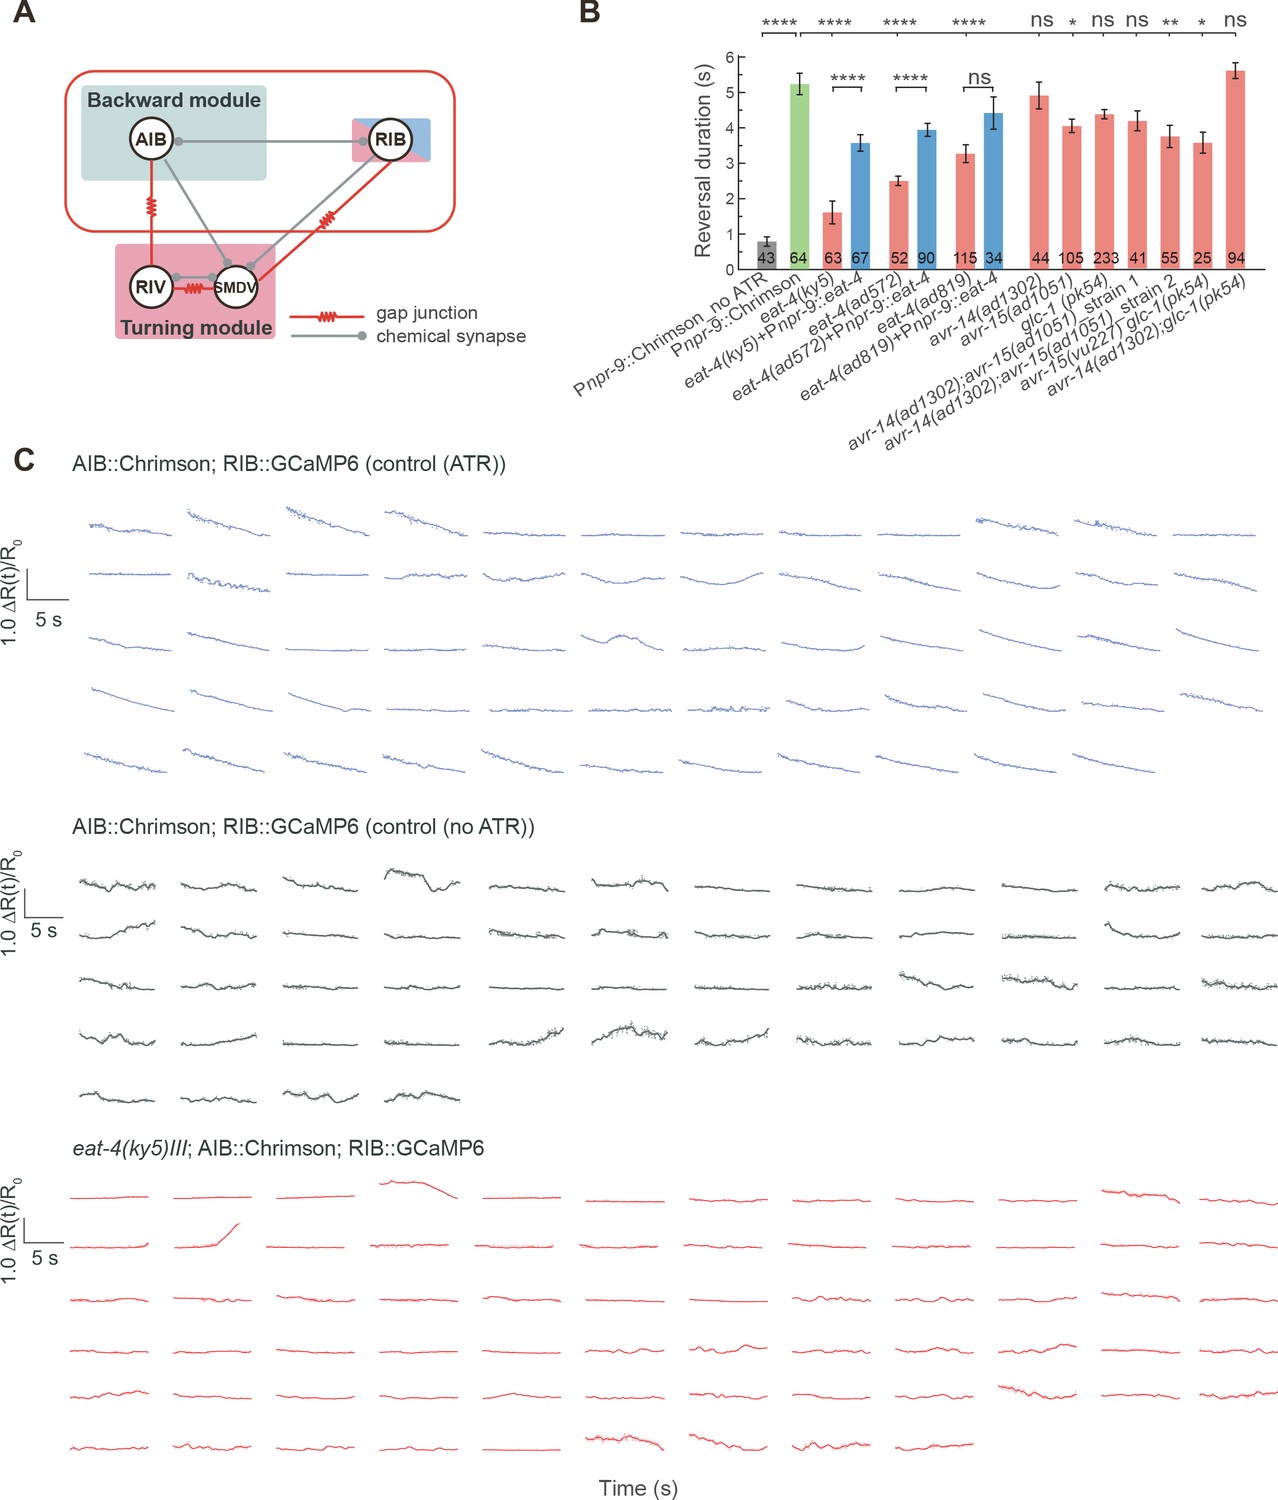
Glutamatergic inhibitions between AIB and RIB flexibly control the motor state transitions.
(A) Couplings between the backward, forward and turning modules. AIB, RIV and RIB are highlighted. (B) Reversal length during optogenetic activation of AIB in various glutamate postsynaptic receptor mutants and restoring eat-4 specifically in AIB in different eat-4 glutamate deficient mutants. GluCl single and double mutants exhibited longer reversals than the triple mutants (Figure 4B), suggesting that AVR-14, AVR-15 and GLC-1 proteins function synergistically to mediate feedforward inhibition. Error bars indicate SEMs. *p<0.05, **p<0.01, ****p<0.0001. Mann–Whitney U test. All multiple comparisons were adjusted using Bonferroni correction. (C) Single trial data related to Figure 4D).
Figure 4—figure supplement 2

Functional coupling between AIB and RIB neurons was directly tested through glutamate imaging.
(A) Single trial data of the glutamatergic signal on the process of RIB after AIB activation onset, related to Figure 4E). Raw data and smoothed data (bold line) are showed. (B) Examination of AIB calcium activity after optogenetic activation of AIB, related to Figure 4E). Raw data and smoothed data (bold line) are showed.
Figure 5 with 3 supplements
Local interneurons RIB promote both turning and forward behaviors.
(A) Calcium activity of RIB during type-I (up, n = 41) and type-II transitions (bottom, n = 25). Δ(t) (mean ± SEM) are shown. t = 0 is aligned to the initiation of forward movement (up) or an omega turn (bottom). (B) Statistics of motor state transitions (left) and representative curvature kymographs (right) upon optogenetic manipulation of RIB. Left, the probability for a transition and its 95% confidence limits were computed. RIB::Chrimson1, n = 65, red light (635 nm, 3.75 mW/mm2); RIB::Chrimson2, n = 82, red light (635 nm, 1.00 mW/mm2); RIB::Arch, n = 83, green light (561 nm, 8.14 mW/mm2). Right, animals crawled on fresh agar plates. Body curvature was normalized by a k · L, where L is the body length. Green (or red) shaded regions show selected spatiotemporal regions for optogenetic inhibition (or activation). The kymograph of turning behaviors exhibits longer cycles to complete body bending and larger body curvature, which are different from those during forward movement. (C) Reversal length distributions (left) and transition rates (right) when ALM/AVM activation was followed by optogenetic inhibition of RIB (12 s green light, 561 nm, 1.94 mW/mm2). Pmec-4::ChR2;Psto-3::Arch, n = 173. Control group is from Figure 1C. (D) Calcium imaging of RIV in wild-type (blue) and RIB-ablated animals (orange) upon optogenetic stimulation of AIB in freely behaving animals. ΔR(t)/R0 (Mean ± SEM) are shown. (E) Data are related to (D), but all trials were aligned to the onset of omega turns. (F) Reversal length during ALM/AVM-triggered escape responses in RIB-ablated animals or in animals where chemical synaptic transmission from RIB was blocked. Error bars indicate SEM. Mann–Whitney U test, ****p<0.0001. All multiple comparisons were adjusted using Bonferroni correction.
-
Figure 5—source data 1
Source data for Figure 5 and Figure 5—figure supplement 1.
- https://cdn.elifesciences.org/articles/56942/elife-56942-fig5-data1-v2.zip
Figure 5—figure supplement 1
RIB receive feedforward inhibition to modulate type-II transition and neurons in the turning module might contribute to reversal termination.
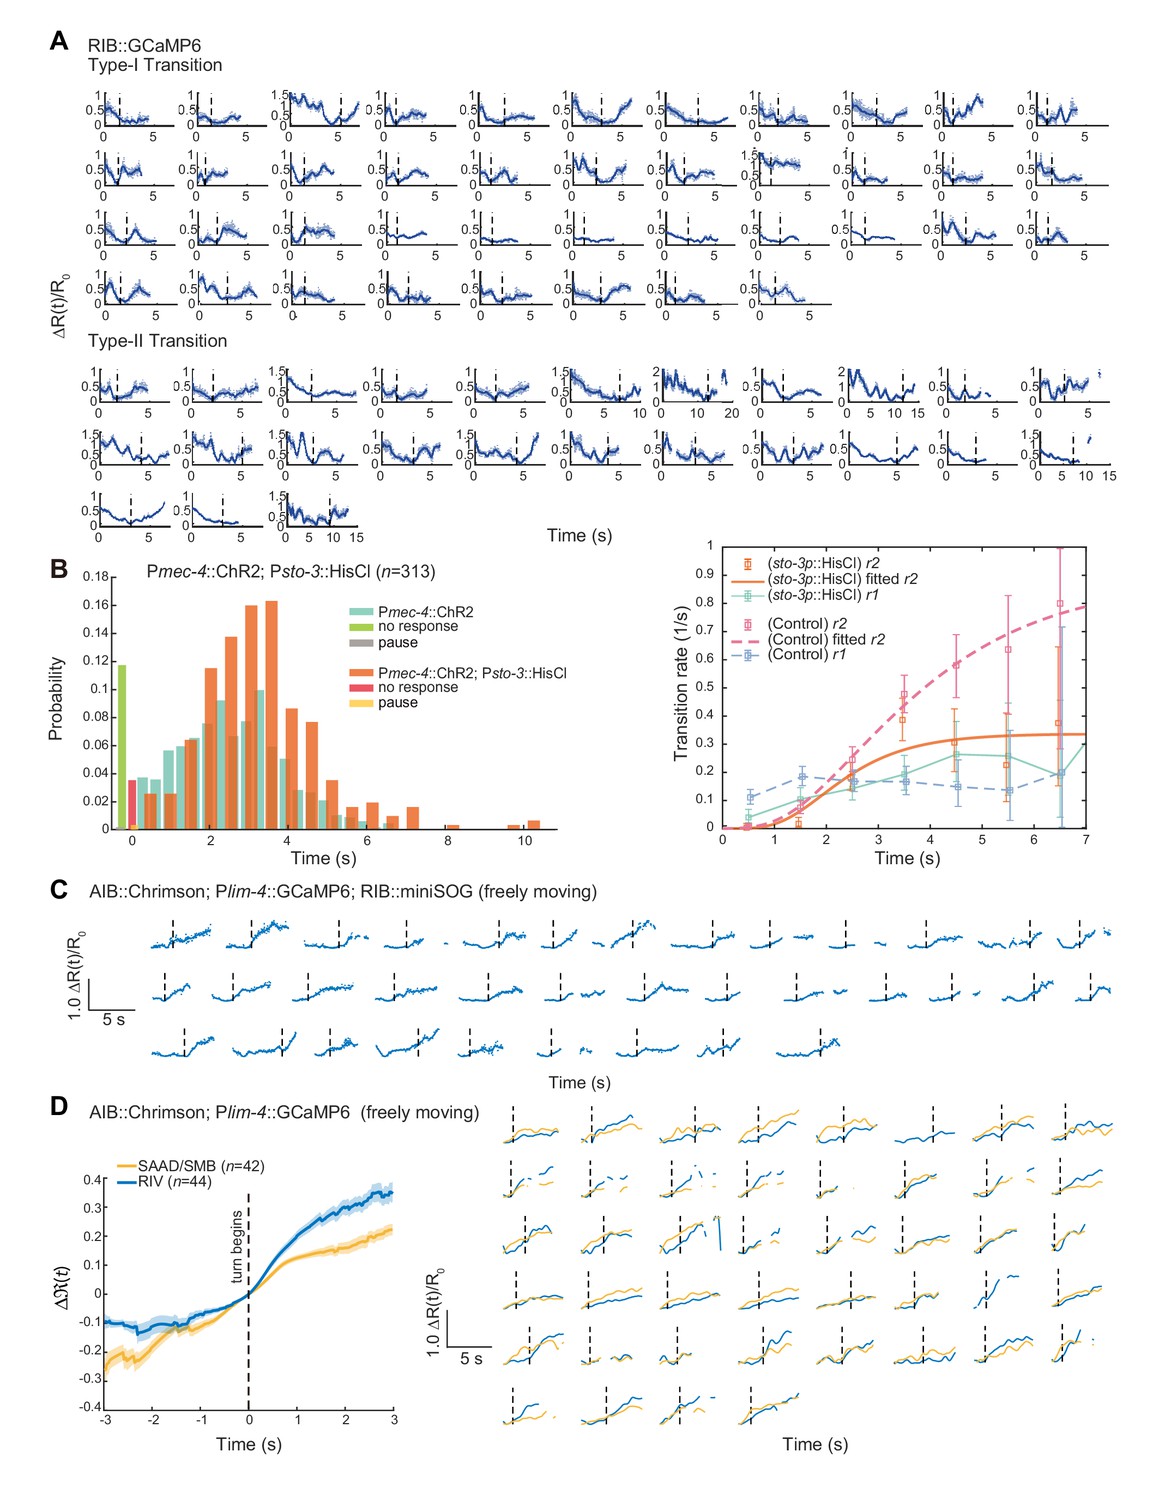
(A) Single trial data related to Figure 5A). Dashed lines indicate the initiation of forward movement (up) or omega turns (bottom). (B) Persistent inhibition of RIB by expressing an exogenous histamine channel (HisCl) during ALM/AVM-triggered escape responses. Type-II transition quickly approached a plateau at a lower rate, which is consistent with our model prediction and Figure 5C). Control group is from Figure 1C). (C) Single trial data related to Figure 5D–E). (D) Left, simultaneous optogenetic activation of AIB and calcium imaging of RIV or SAAD/SMB (Pnpr-9::Chrimson;Plim-4::GCaMP6) in freely behaving animals. t = 0 is aligned to the onset of an omega turn. Δ(t) (mean ± SEM) are shown. Right, smoothed single trial data. Dashed lines indicate the start of a turn.
Figure 5—video 1
Optogenetic manipulation of RIB can induce motor state transitions, Related to Figure 5.
Strong activation of RIB during forward movement reliably triggered turns; while inhibiting RIB during forward movement led to a pause state.
Figure 5—video 2
Optogenetic inhibition of RIB or RIV/SAA/SMB neurons during escape responses prolonged reversal durations, Related to Figure 5 and Figure 6.
Figure 6 with 1 supplement
Feedback inhibition from the turning module contributes to reversal termination.
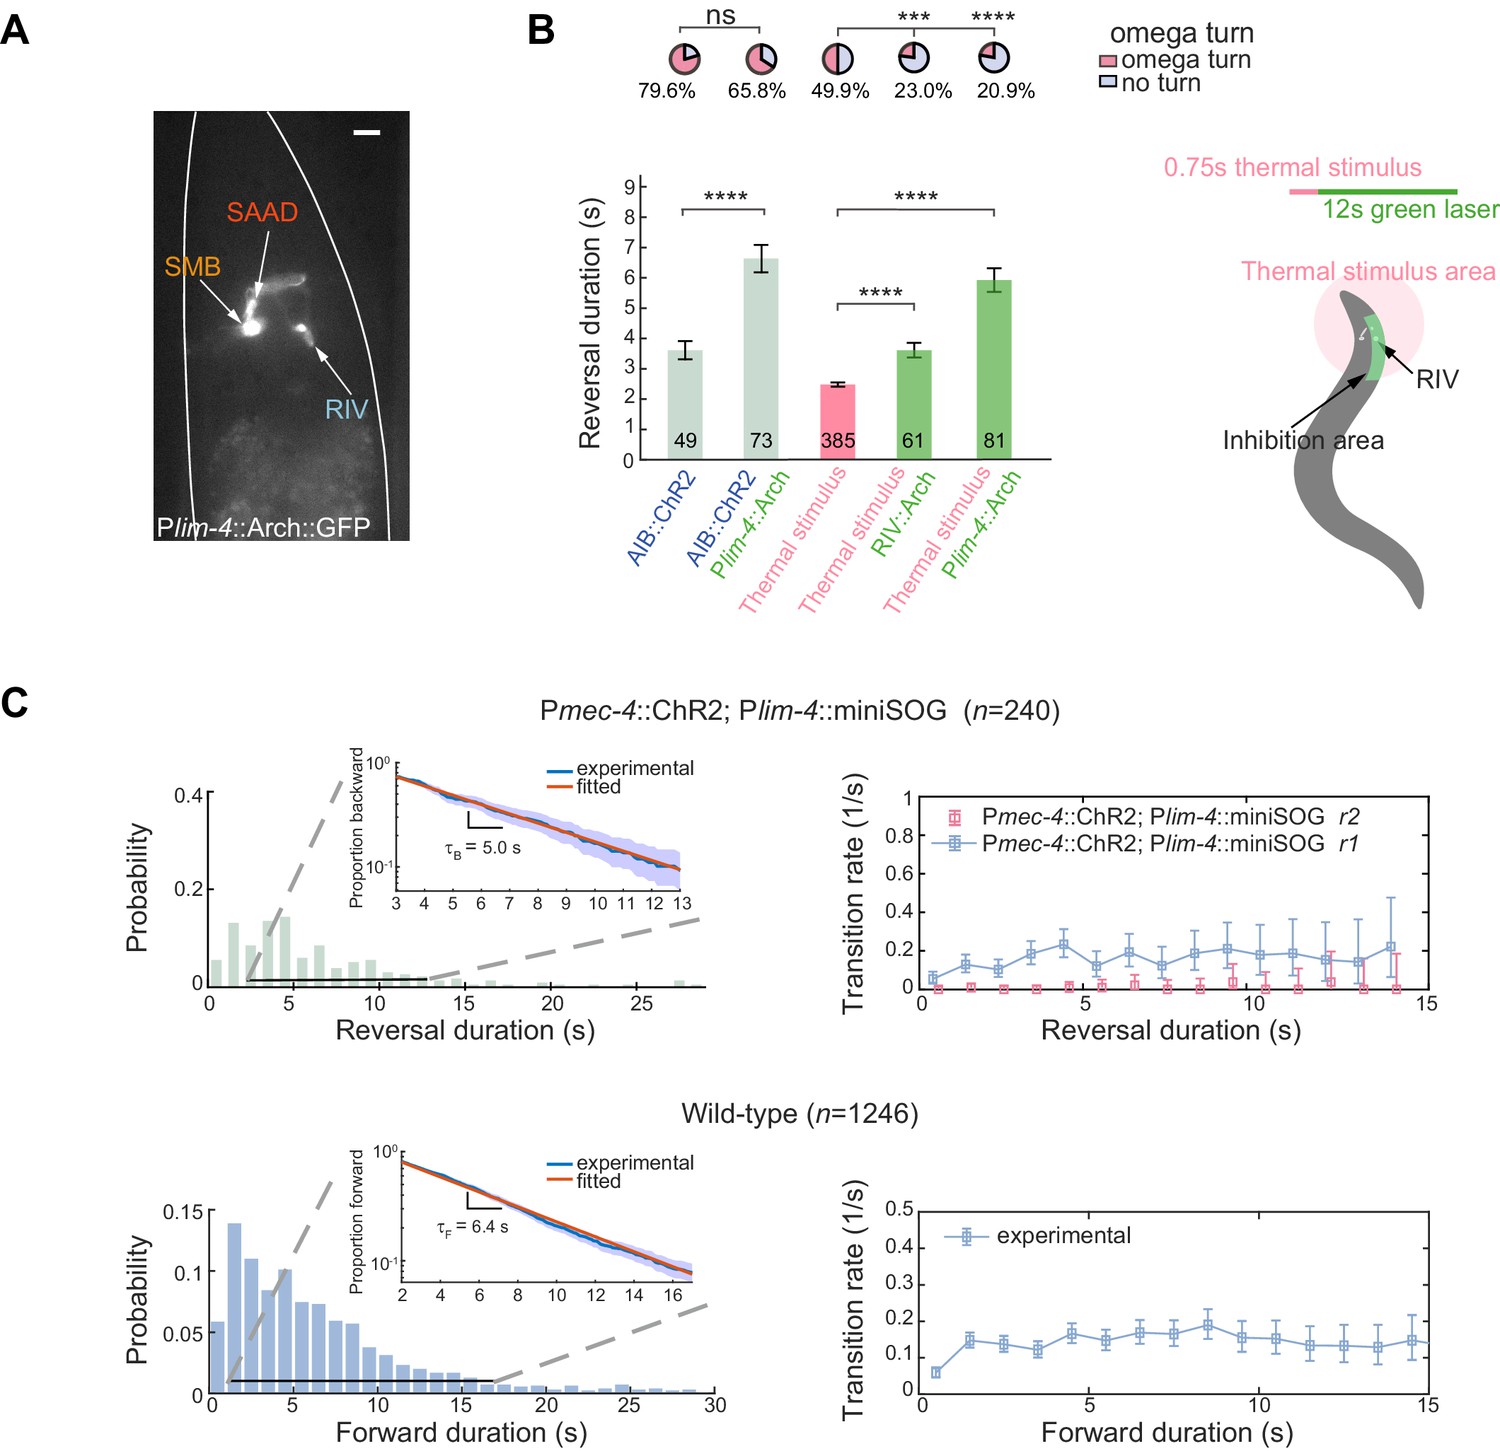
(A) Expression pattern of Plim-4::Arch::GFP. Scale bar, 10 µm. (B) Left, escape responses induced by optogenetic activation of AIB (blue text, 473 nm, 14.71 mW/mm2, 1.5 s) or thermal stimulus (pink text, 1480 nm, 0.75 s) followed by optogenetic inhibition of Arch-expressed interneurons (green text, 561 nm, 21.71 mW/mm2, 12 s). Bar graph, reversal durations, Mann–Whitney U test and error bars are SEMs. Pie chart, fractions of trials executing omega turns, χ2 test. *p<0.05, ***p<0.001, ****p<0.0001. All multiple comparisons were adjusted using Bonferroni correction. Right, schematic diagram for selective inhibition of RIV near animal head during thermally induced (1480 nm, 0.75 s) escape responses. (C) Up, reversal length distribution (left) and transition rate (right) in RIV/SAAD/SMB ablated animals. Bottom, spontaneous run length distribution (left) and transition rate from forward to backward movements (right) in wild-type animals. Insets are plots of survival functions: proportion of trials moving backward (up) or forward (bottom) until t. We fitted only trials with reversal duration ≥3 s and forward duration ≥2 s.
-
Figure 6—source data 1
Source data for Figure 6.
- https://cdn.elifesciences.org/articles/56942/elife-56942-fig6-data1-v2.zip
Figure 6—video 1
RIV neurons are essential for omega turns, Related to Figure 6.
Optogenetic ablation of RIV/SAA/SMB neurons abolished type-II transition, and animals could no longer generate a complete turn but executed a much longer reversal.
Figure 7

A model summary for motor sequence generation.
(A) Schematics of neuronal circuit of C. elegans avoidance behavior. Feedforward excitation between local interneurons AIB and RIV triggers turning behavior. Glutamatergic inhibition between AIB and RIB flexibly controls the motor state transitions. Feedback inhibition from the turning module helps terminate backward behavior. (B) Illustration of the biophysical meaning of the type-II transition. The sub-threshold membrane potential of RIV fluctuates around the fixed point x0, just like a particle (red) in an energy well. When RIV membrane potential crosses the threshold xth, RIV along with other neurons in the turning module become fully activated and a turn starts. (C) A simple stochastic model without short-term synaptic plasticity cannot account for the experimentally observed transition rate. (D) Schematics of a three-module model based on the animal connectome and experimentally identified functional motifs. Short-term synaptic depression (STD) was introduced in the feedforward inhibition. (E) Type-II transition rate during ALM/AVM triggered escape responses. Pink line is a theoretical fit using Equation 4. in Equation 4 is given by the glutamate decay constant in Figure 4E.
Tables
Key resources table
| Reagent type (species) or resource | Designation | Source or reference | Identifiers | Additional information |
|---|---|---|---|---|
| Strain, strain background (C. elegans) | C. elegans strains used and generated in this study | Caenorhabditis Genetics Center (CGC) and this paper | Supplementary file 1 | |
| Recombinant DNA reagent | Plasmids generated in this study | This paper | Supplementary file 2 | |
| Recombinant DNA reagent | Primers for genes (or promoters) used in this study | This paper | Supplementary file 3 | |
| Software, algorithm | MATLAB | Mathworks | RRID:SCR_001622 | https://www.mathworks.com |
| Software, algorithm | CoLBeRT system | Samuel Lab | http://colbert.physics.harvard.edu/ | |
| Software, algorithm | ImageJ | Media Cybernetics | RRID:SCR_003070 | https://imagej.net/ |
| Software, algorithm | LabVIEW | National Instruments | RRID:SCR_014325 | http://www.ni.com |
Additional files
-
Supplementary file 1
Strains information.
- https://cdn.elifesciences.org/articles/56942/elife-56942-supp1-v2.docx
-
Supplementary file 2
Associated plasmids information.
- https://cdn.elifesciences.org/articles/56942/elife-56942-supp2-v2.docx
-
Supplementary file 3
Associated promoter and gene information.
- https://cdn.elifesciences.org/articles/56942/elife-56942-supp3-v2.docx
-
Supplementary file 4
Sample size and replicate number for all experiments.
- https://cdn.elifesciences.org/articles/56942/elife-56942-supp4-v2.docx
-
Transparent reporting form
- https://cdn.elifesciences.org/articles/56942/elife-56942-transrepform-v2.docx
Download links
A two-part list of links to download the article, or parts of the article, in various formats.
Downloads (link to download the article as PDF)
Open citations (links to open the citations from this article in various online reference manager services)
Cite this article (links to download the citations from this article in formats compatible with various reference manager tools)
Flexible motor sequence generation during stereotyped escape responses
eLife 9:e56942.
https://doi.org/10.7554/eLife.56942


