Drosophila PDGF/VEGF signaling from muscles to hepatocyte-like cells protects against obesity
- Department of Genetics, Blavatnik Institute, Harvard Medical School, United States
- Harvard Chan Bioinformatics Core, Harvard T.H. Chan School of Public Health, United States
- Howard Hughes Medical Institute, United States
Figures
Figure 1 with 1 supplement
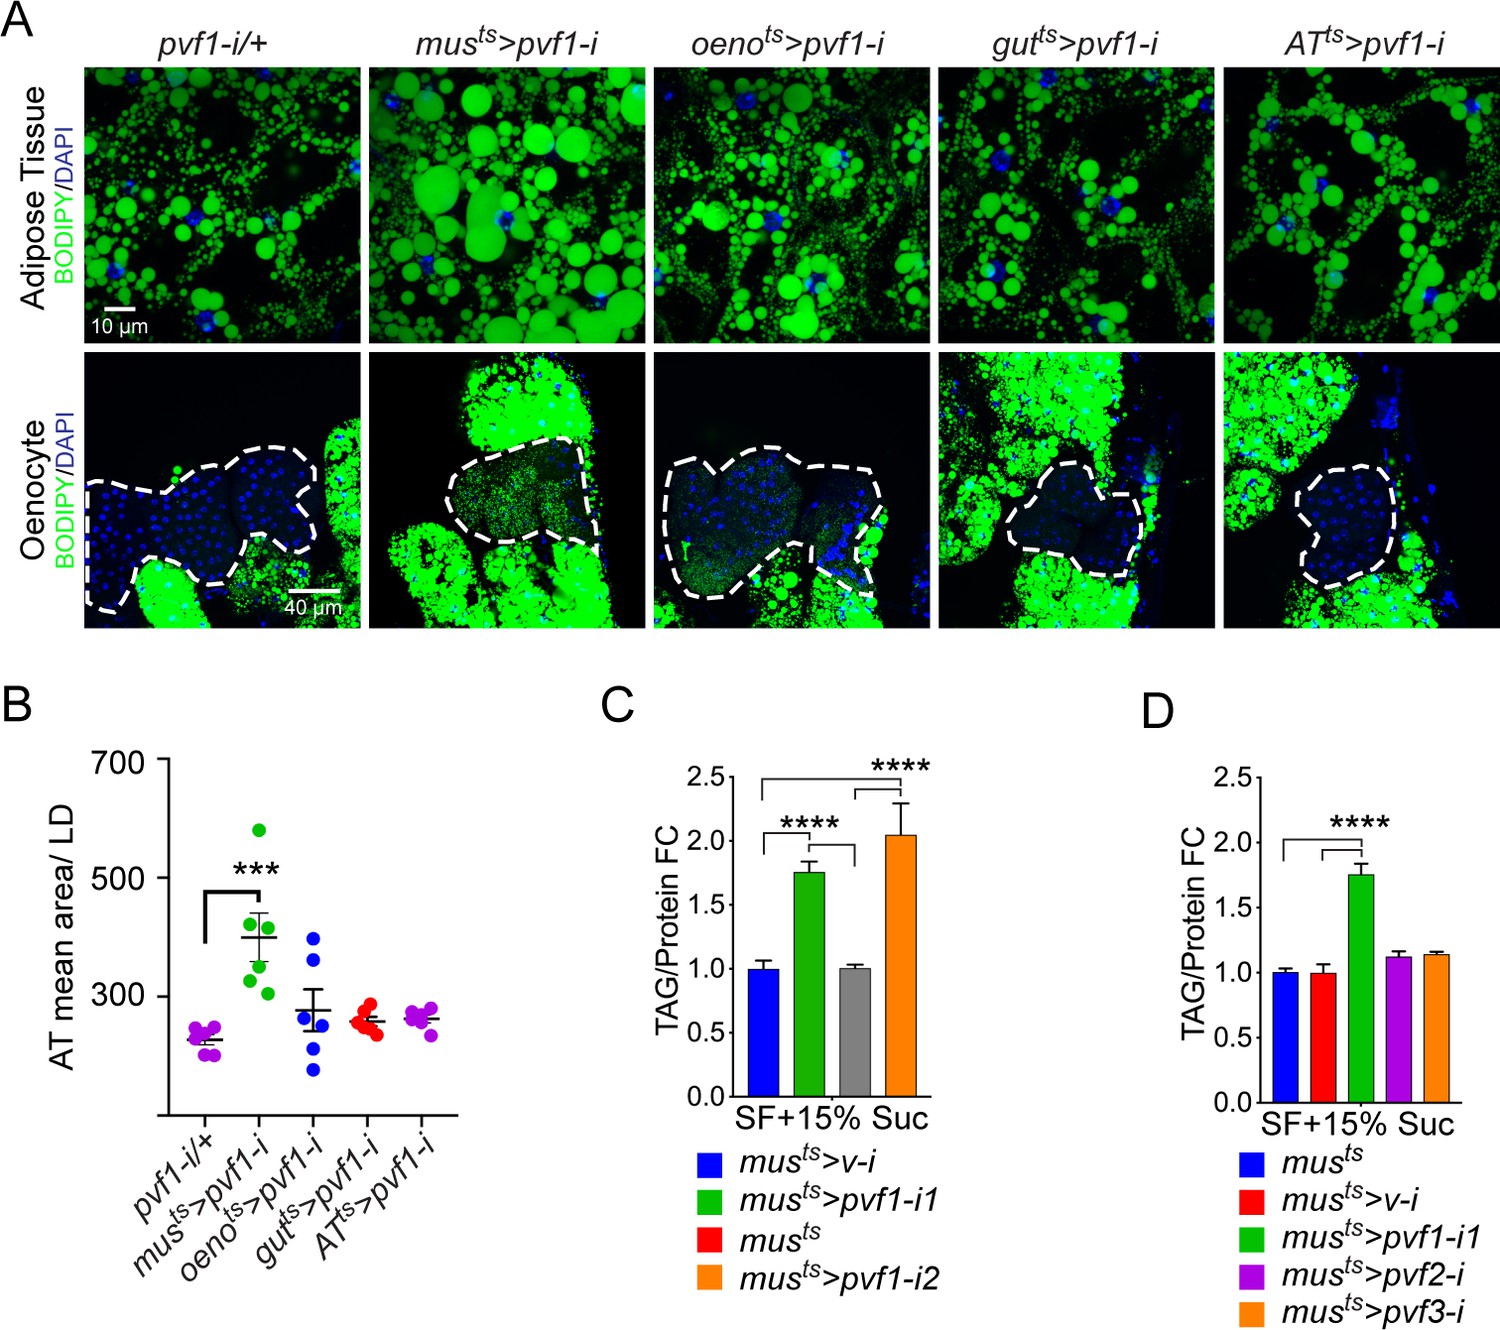
A muscle-to-oenocyte Pvf1 signaling axis protects against obesity.
(A) BODIPY staining showing neutral lipid accumulation in the adult male adipose tissue (AT) and oenocytes (dorsal abdominal cuticle) of flies in which pvf1 was knocked down using an RNAi transgene (VDRC: kk102699) specifically in the adult: muscle (musts= muscle-Gal4Gal80ts), oenocytes (oenots = oenocyte-Gal4Gal80ts), gut (gutts = gut-Gal4Gal80ts), and adipose tissue (ATts = AdiposeTissue-Gal4Gal80ts). The RNAi transgene alone is shown as a control. Similar results were observed using a different RNAi line (NIG: 7103 R-2, data not shown). (B) Mean lipid droplet size (≥10 microns in diameter) in the adipose tissue of flies shown in (A). Only muscle-specific loss of pvf1 show a significant increase compared to the control genotype, N = 6 animals, One-way ANOVA followed by Tukey’s HSD test, *** denotes p≤0.001, error bars = SEM. (C) Triacylglycerol (TAG) assay showing TAG/protein ratio in adult males in which pvf1 was knocked down specifically in the muscle. Knocking down pvf1 using two independent RNAi lines (pvf1-i1::VDRC kk102699 and pvf1-i2::NIG 7103 R-2) leads to a significant increase in total TAG content of the flies. (musts>v-i = muscle-Gal4Gal80ts>vermilion RNAi). (SF+15% Suc = standard lab food supplemented with 15% sucrose w/w). N = 6, Cohorts of eight males were used for each data point. One-way ANOVA followed by Tukey’s HSD test, **** denotes p≤0.0001, error bars = SEM. (D) Total TAG content of adult males with adult muscle-specific (musts) knockdown of pvf1, pvf2 and pvf3. N = 6, Cohorts of eight males were used for each data point. One-way ANOVA followed by Tukey’s HSD test, **** denotes p≤0.0001, error bars = SEM.
Figure 1—figure supplement 1
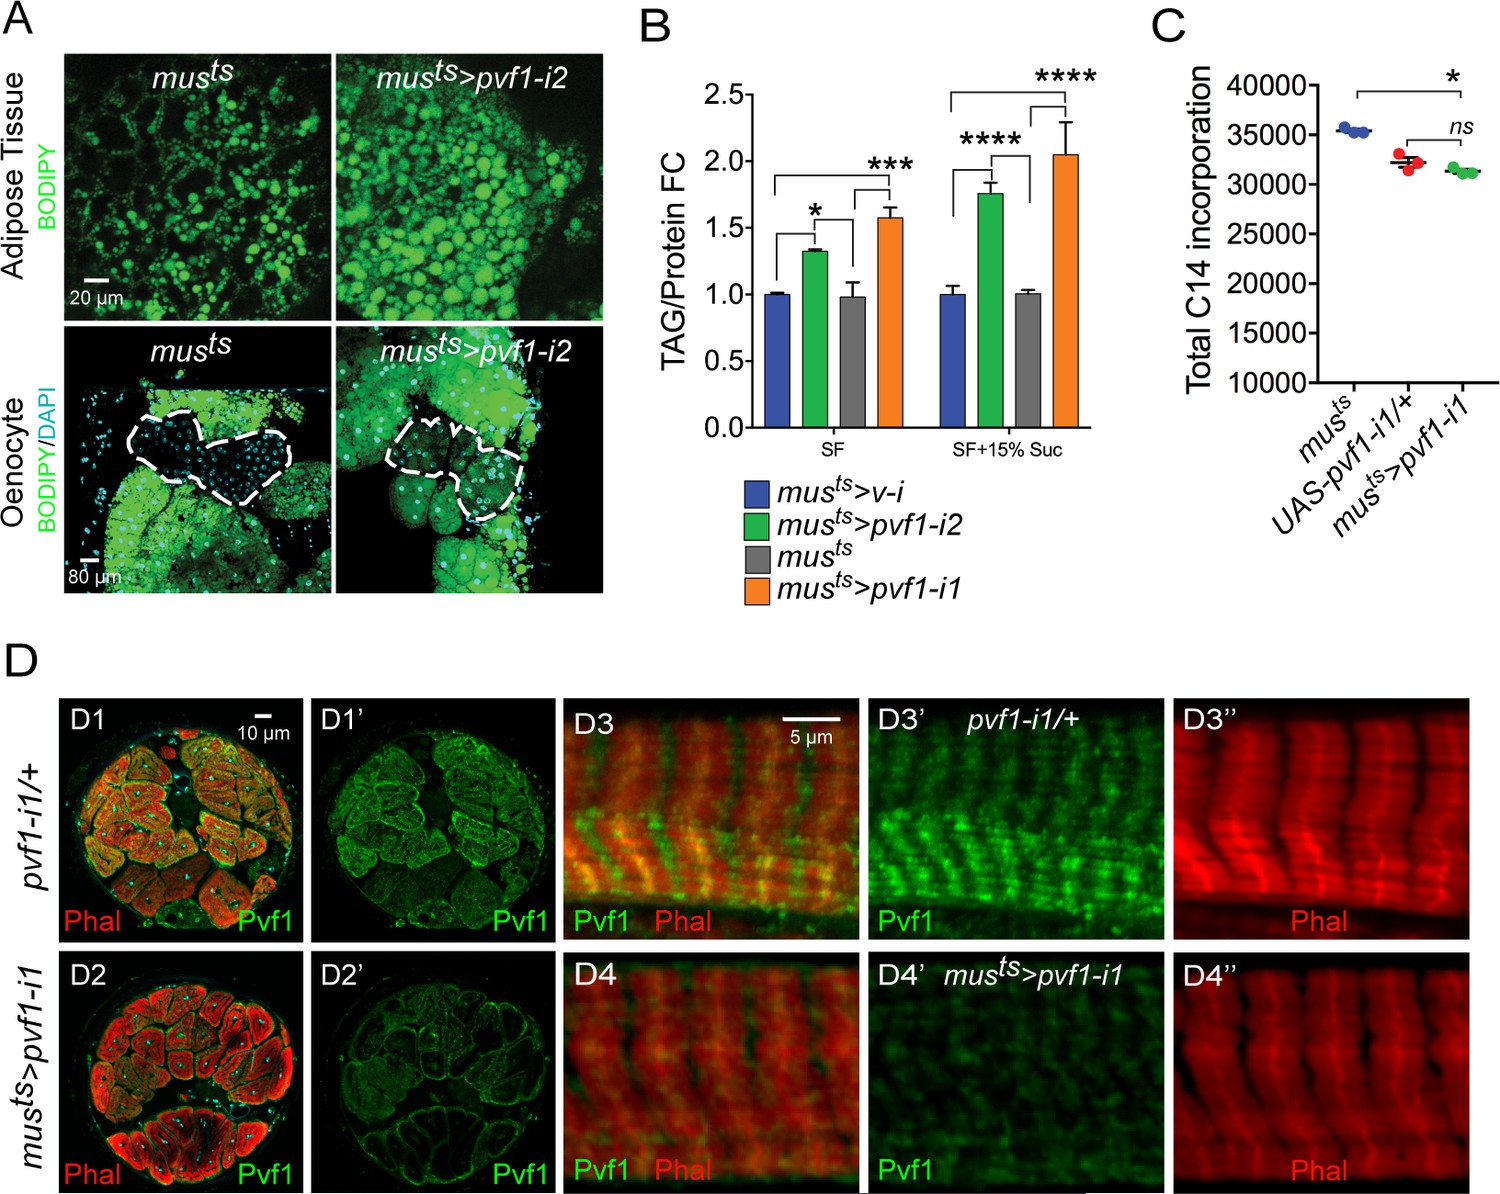
A muscle to oenocyte Pvf1 signaling axis protects against obesity.
(A) BODIPY staining showing neutral lipid accumulation in the adult male adipose tissue (AT) and oenocytes (dorsal abdominal cuticle) of control (musts = muscle-Gal4Gal80ts) flies and flies with muscle-specific knockdown of pvf1 (musts>pvf1-i2) (NIG: 7103 R-2) (B) Total TAG content of adult males with adult muscle-specific knockdown of pvf1 (musts>pvf1-i2) (NIG: 7103 R-2) reared on standard lab food (SF) and 15% w/v high-sugar diet (HSD). (SF = standard lab food). (SF+15% Suc = standard lab food supplemented with 15% sucrose w/w). N = 6, Cohorts of eight males were used for each data point. Two-way ANOVA followed by Tukey’s HSD test, * denotes p≤0.05, *** denotes p≤0.001, **** denotes p≤0.0001, error bars = SEM. (C) 14C counts per minute of whole fly homogenates of control (musts) and UAS-pvf1-i1/+ flies and flies with muscle-specific knockdown of pvf1 (musts>pvf1-i1) (VDRC: kk102699) that were fed with [U-14C]-Glucose for 24 hrs. N = 3, Cohorts of 25 males were used for each data point. One-way ANOVA followed by Tukey’s HSD test, * denotes p≤0.05, ns denotes Not Significant, error bars = SEM. (D) Distribution of Pvf1 protein (anti-Pvf1 antibody:: Green) in the leg muscle of control (pvf1-i1/+) (D1, D1’, D3, D3’) flies and flies with muscle-specific knockdown of pvf1 (musts>pvf1-i1) (VDRC: kk102699) (D2, D2’, D4, D4’). Figures D1, D1’ and D2, D2’ show cross-section of the leg muscle. Figures D3, D3’ and D4, D4’ show transverse section of the leg muscle.
Figure 2 with 3 supplements
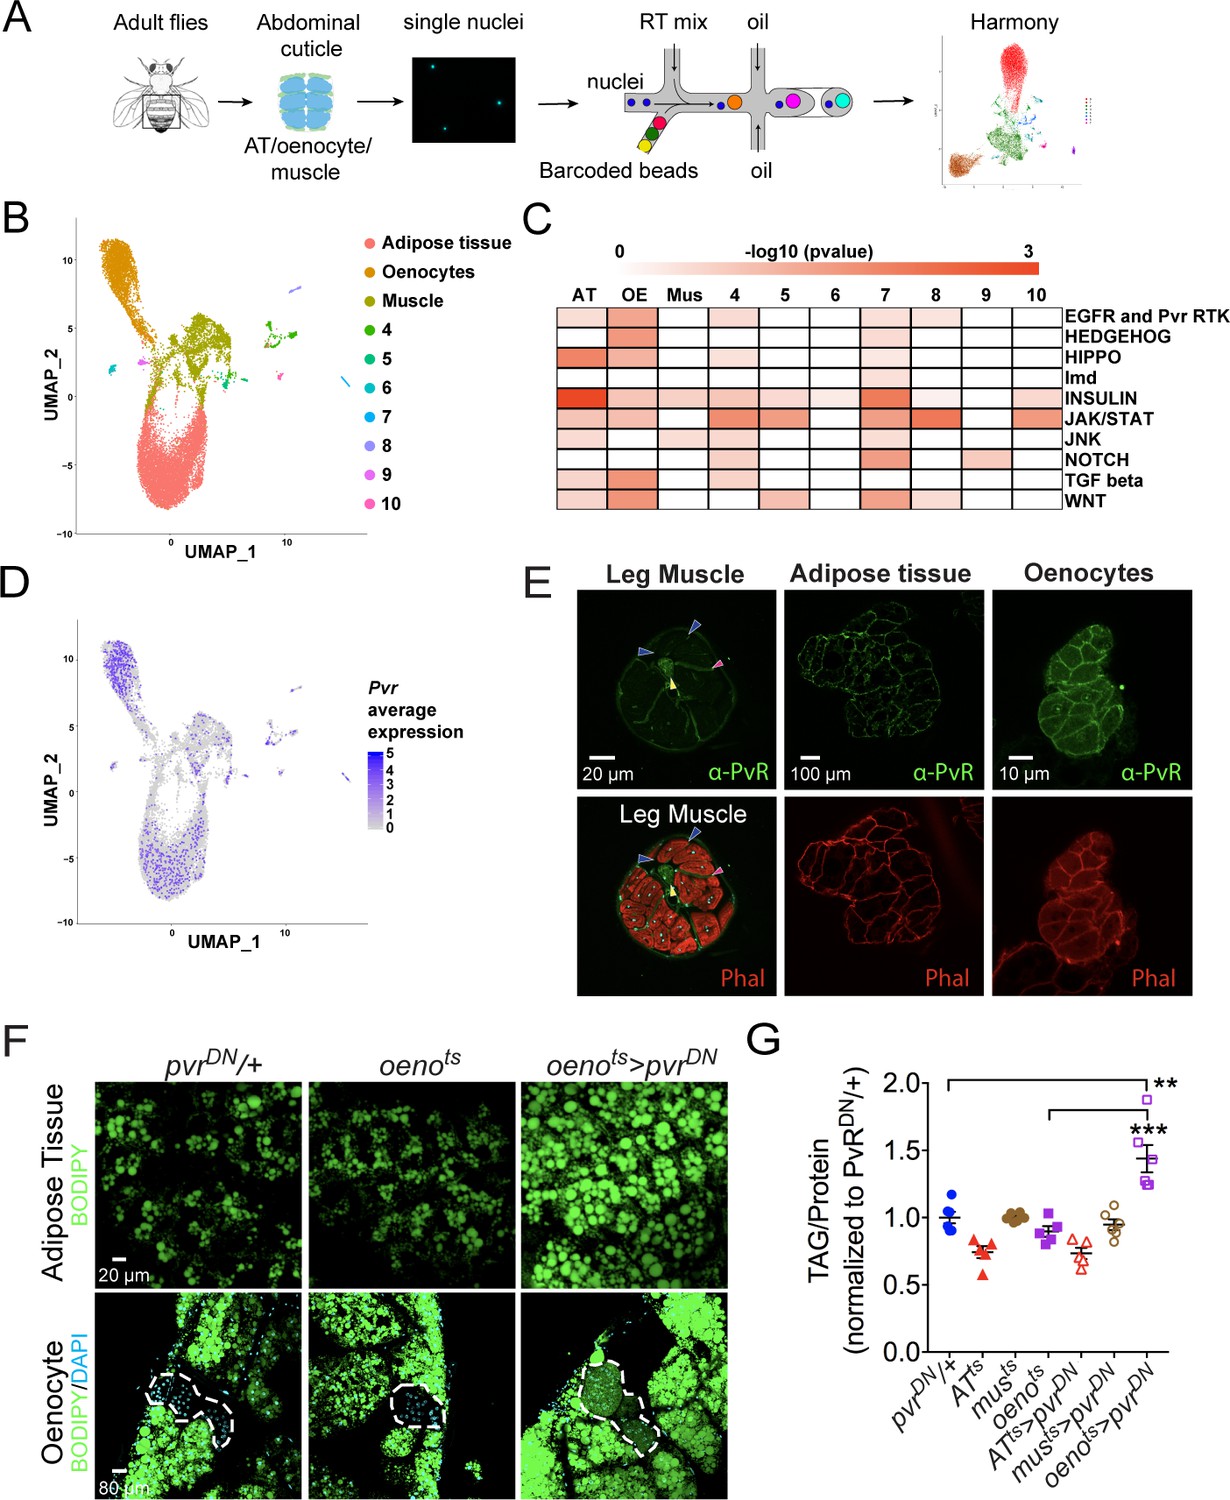
Single nuclei-RNA-sequencing reveals that oenocyte-specific PvR signaling protects against obesity.
(A) Schematic of snRNA-seq workflow. Adult fly abdomens are dissected and dissociated to obtain high-quality single nuclei for downstream encapsulation by 10X genomics-based snRNA-seq platform and subsequent sequencing and analysis using Harmony. (B) Uniform Manifold Approximation and Projection (UMAP) plot representing 10 unique clusters identified while using a resolution of 0.1 for the clustering analysis. Each color and dot in the plot represent a cluster and a single nucleus, respectively. (C) Pathway enrichment analysis reveals EGFR and Pvr Receptor Tyrosine Kinase (RTK) signaling pathway enriched in oenocytes (OE) when compared to other clusters including adipose tissue (AT) and muscle (Mus). (D) UMAP plot representing the average expression of Pvr, which is highly enriched in oenocytes and to a lesser extent in adipose tissue and muscle. (E) Anti-PvR (Green) and phalloidin-594 (Red) staining of w1118 (VDRC isogenic stock) adult male leg musculature (cross-section), adipose tissue, and oenocytes. Yellow and red arrowheads show the leg axon bundle and trachea respectively. Blue arrowheads show the sarcolemma of individual leg muscle bundles. (F) BODIPY staining showing neutral lipid accumulation in adult male adipose tissue and oenocytes (dorsal abdominal cuticle) of control males and males over-expressing pvrDN in the adult oenocytes (oenots>pvrDN). (G) Total TAG content of adult males over-expressing pvrDN in the adult adipose tissue (ATts>pvrDN), muscle (musts>pvrDN), and oenocytes (oenots>pvrDN). Flies containing the UAS construct and the tissue-specific drivers alone serve as controls. N = 5–6, Cohorts of six males were used for each data point. One-way ANOVA followed by Tukey’s HSD test, ** denotes p≤0.01, *** denotes p≤0.001, error bars = SEM.
Figure 2—figure supplement 1
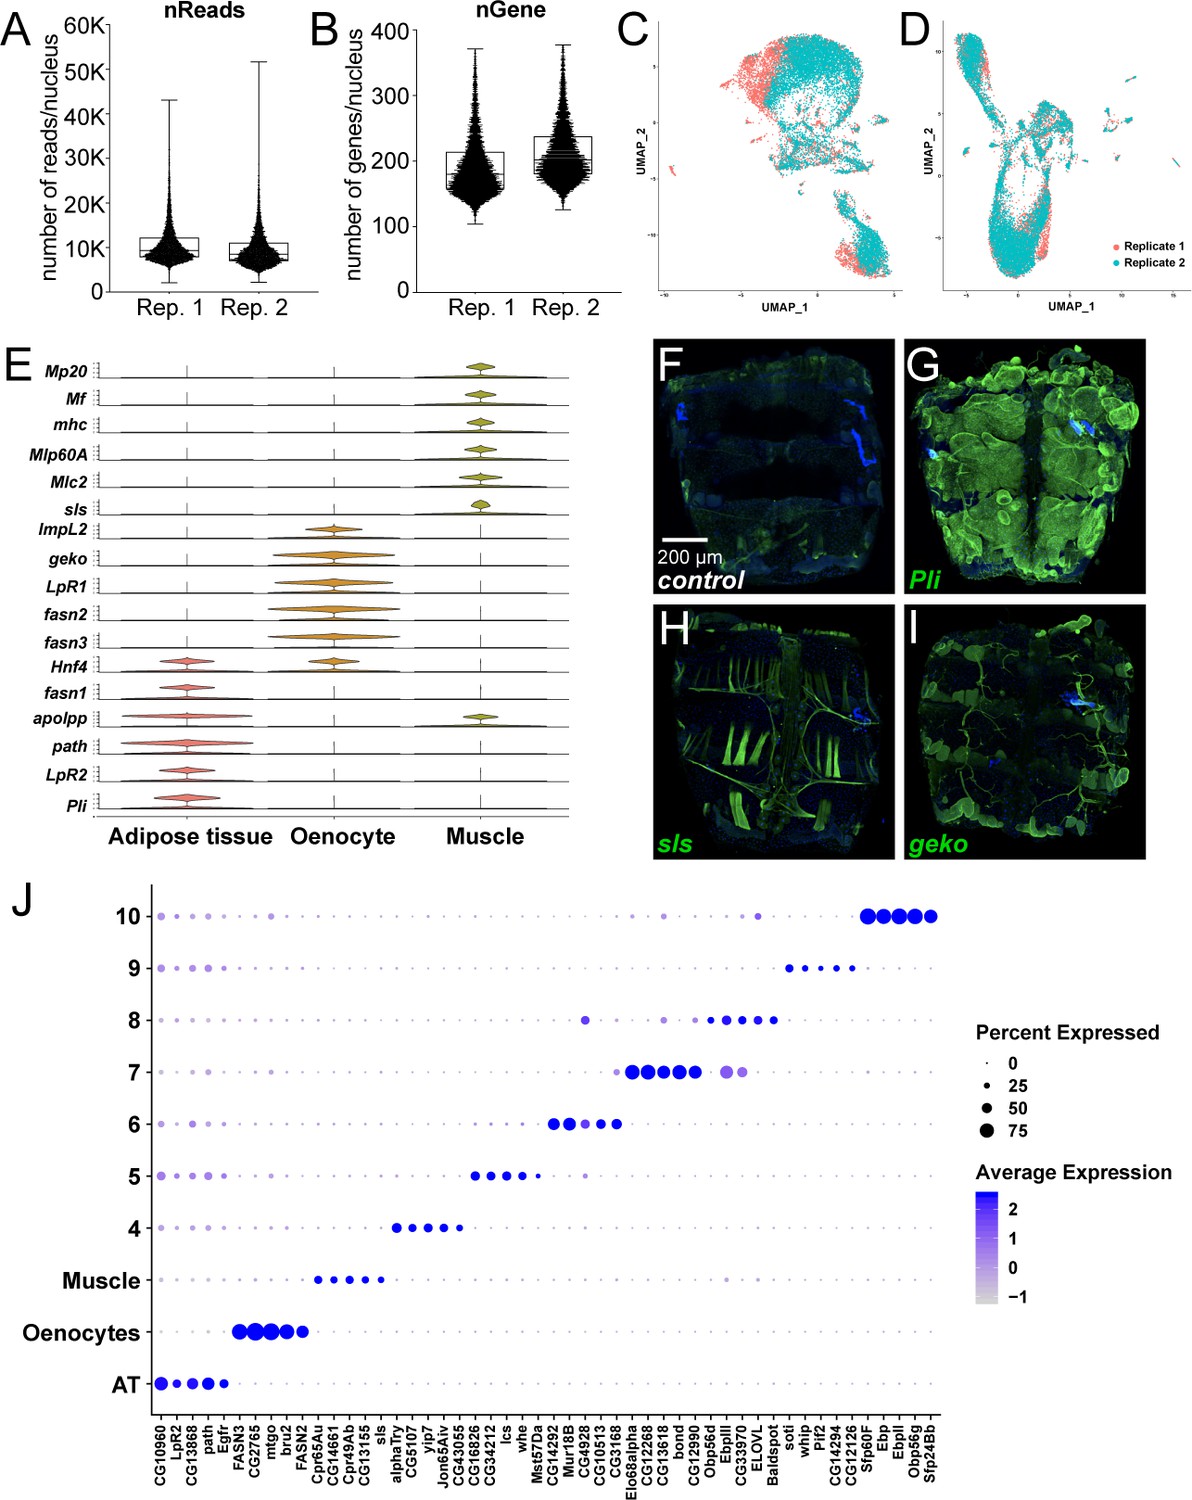
snRNA-seq of adult fly abdomens: validation of marker genes and top marker genes per cluster identified using a resolution of 0.1.
(A) Distribution of number of reads per nucleus in each replicate (Rep. 1 and 2). (B) Distribution of number of genes per nucleus in each replicate (Rep. 1 and 2). (C) UMAP plots representing batch effects due to replicates prior to Harmony (D) UMAP plots representing correction of the batch effects after Harmony. (E) Violin plots representing the normalized expression of marker genes specific for the metabolically active tissues: adipose tissue, oenocytes, and muscle. (F–I) Validation of novel marker genes for the three major clusters dipose tissue, muscle and oenocyte. Trojan-Gal4 lines for each of the candidate genes (pliMI00302-TG4.2, slsMI10783-TG4.1, and gekoMI02663-TG4.1) were used to drive expression of EGFP to mimic the pattern of expression of the genes themselves. One-week-old adult male abdomens were dissected and stained with anti-EGFP to revel the expression pattern of each of the three genes. (F) w1118 adult male abdomen stained with anti-EGFP shows background staining pattern. Muscle cells that were damaged during dissection tend to uptake the antibody and show some staining on the edges of the sample. (G) pliMI00302-TG4.2>UAS-2xEGFP adult male abdomens show EGFP staining primarily in the adipose tissue. Staining was not seen in the abdominal muscles or in the oenocytes. (H) slsMI10783-TG4.1>UAS-2xEGFP adult male abdomens show EGFP staining in the abdominal tubular muscles and in the alary muscles. (I) gekoMI02663-TG4.1>2 xEGFP adult males abdomens show EGFP staining in the oenocytes and in the tracheal tubes. Staining above the background sample was not seen in the adipose tissue or the abdominal muscles. (J) Dot plot representation of top five genes enriched per cluster based on average logFC. The size of the dot represents the percentage of cells expressing a gene while the color gradient represents the level of gene expression.
Figure 2—figure supplement 2
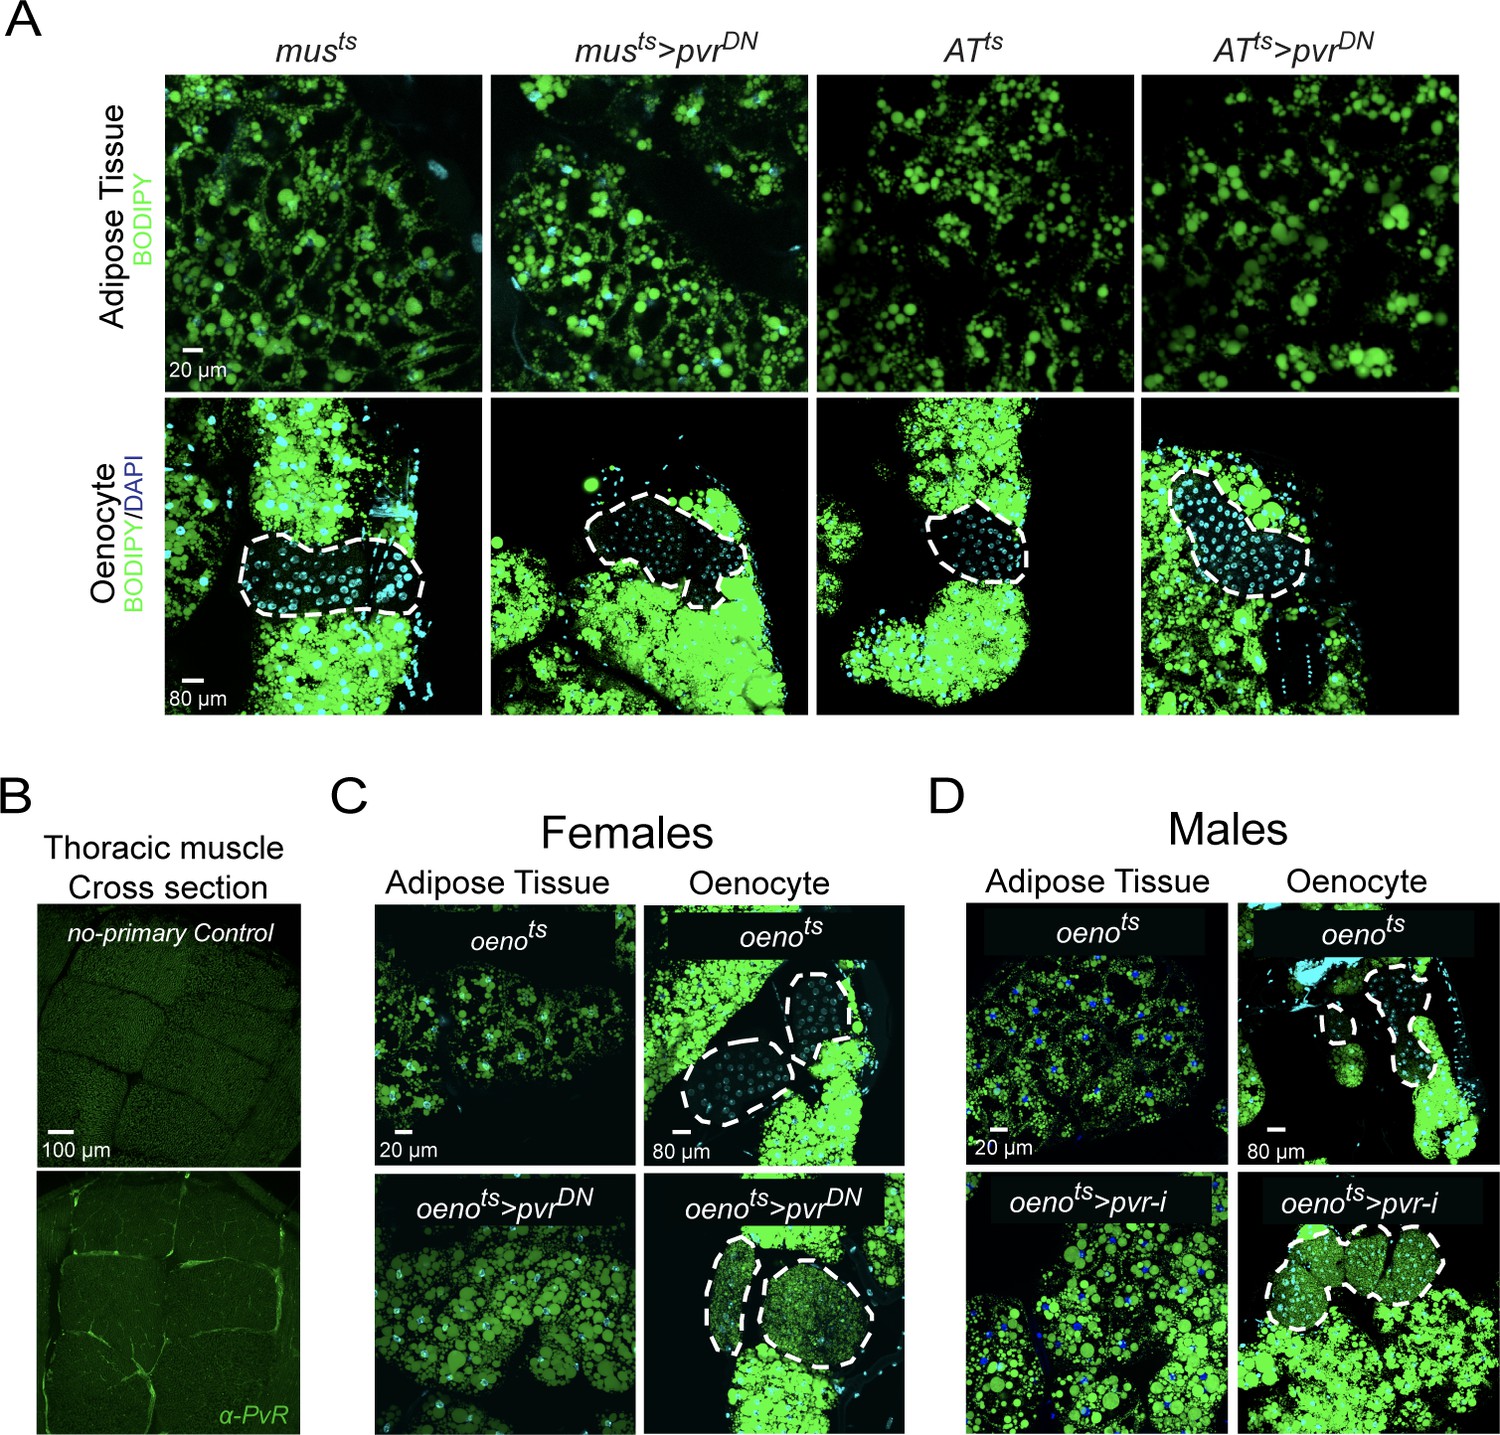
PvR signaling works specifically in the oenocytes to protect against obesity.
(A) BODIPY staining showing neutral lipid accumulation in adult male adipose tissue (AT) and oenocytes (dorsal abdominal cuticle) of control males and males over-expressing pvrDN in the adult muscle (musts>pvrDN) and adipose tissue (ATts>pvrDN). Loss of PvR signaling in the muscle or adipose tissue does not have any effect on the neutral lipid content of either the adipose tissue or the oenocytes. (B) Distribution of PvR protein (anti-PvR antibody::Green) in the thoracic muscle of control (musts) males. A cross-section of the indirect flight muscles is shown. (C) BODIPY staining showing neutral lipid accumulation in the adult female adipose tissue and oenocytes (dorsal abdominal cuticle) of control (oenots = oenocyte-Gal4Gal80ts) flies and flies with oenocyte-specific over-expression of (oenots>pvrDN). (D) BODIPY staining showing neutral lipid accumulation in the adult male adipose tissue and oenocytes (dorsal abdominal cuticle) of control (oenots) flies and flies with oenocyte-specific knockdown of pvr (oenots>pvr i) (NIG: 8222 R-2).
Figure 2—figure supplement 3
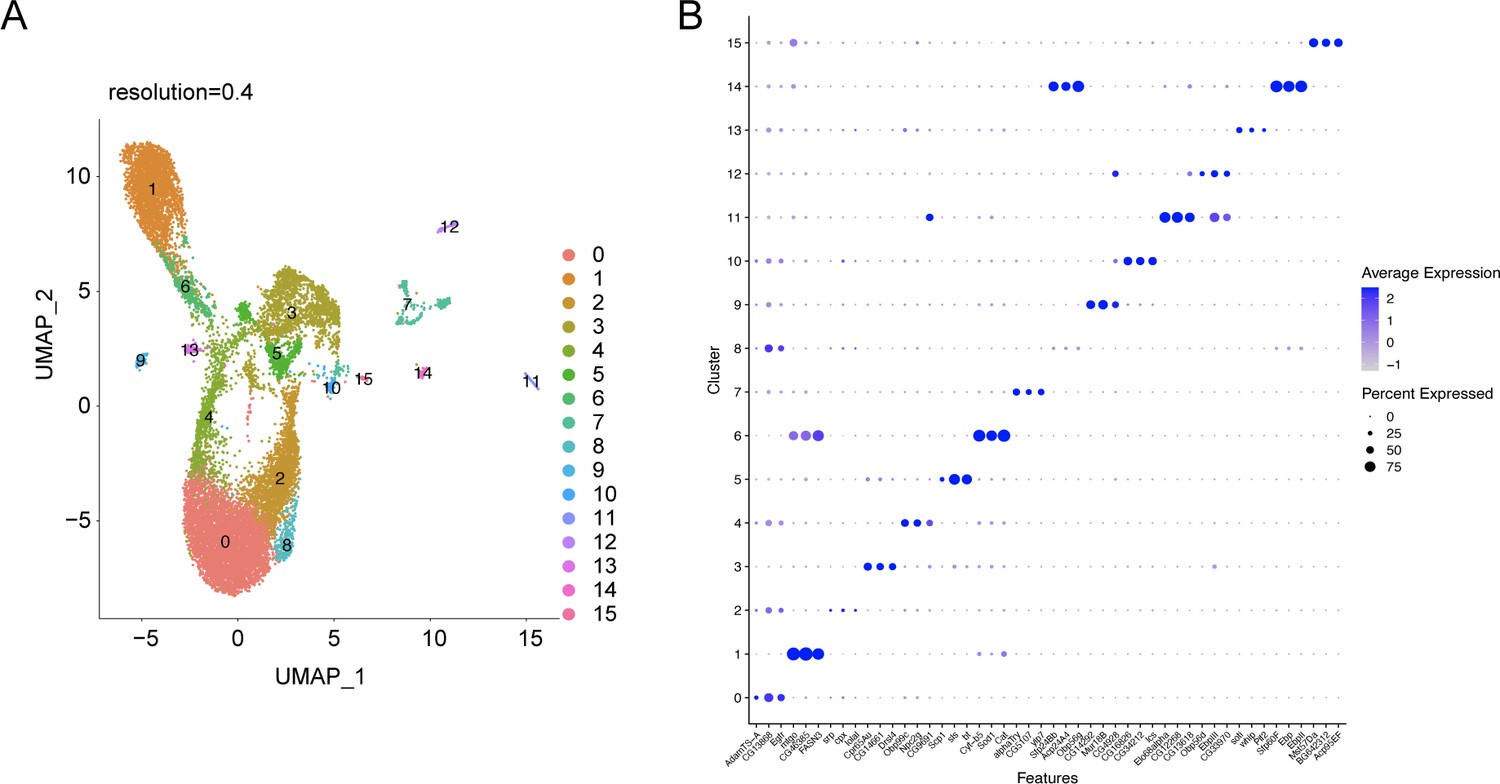
snRNA-seq analysis of the abdominal cuticle at higher resolution of 0.4.
(A) UMAP of the WT control snRNA-seq analysis at a higher resolution of 0.4 reveals a potential heterogeneity within the major tissues such as adipose tissue (clusters 0, 2, 4, and 8), oenocyte (clusters 1 and 6), and muscle (clusters 3 and 5). (B) Dot plot representing top three genes enriched per cluster pertaining to the snRNA-seq expression data of the abdominal cuticle at resolution 0.4. The genes are ranked based on the average expression of each gene per cluster.
Figure 3 with 1 supplement
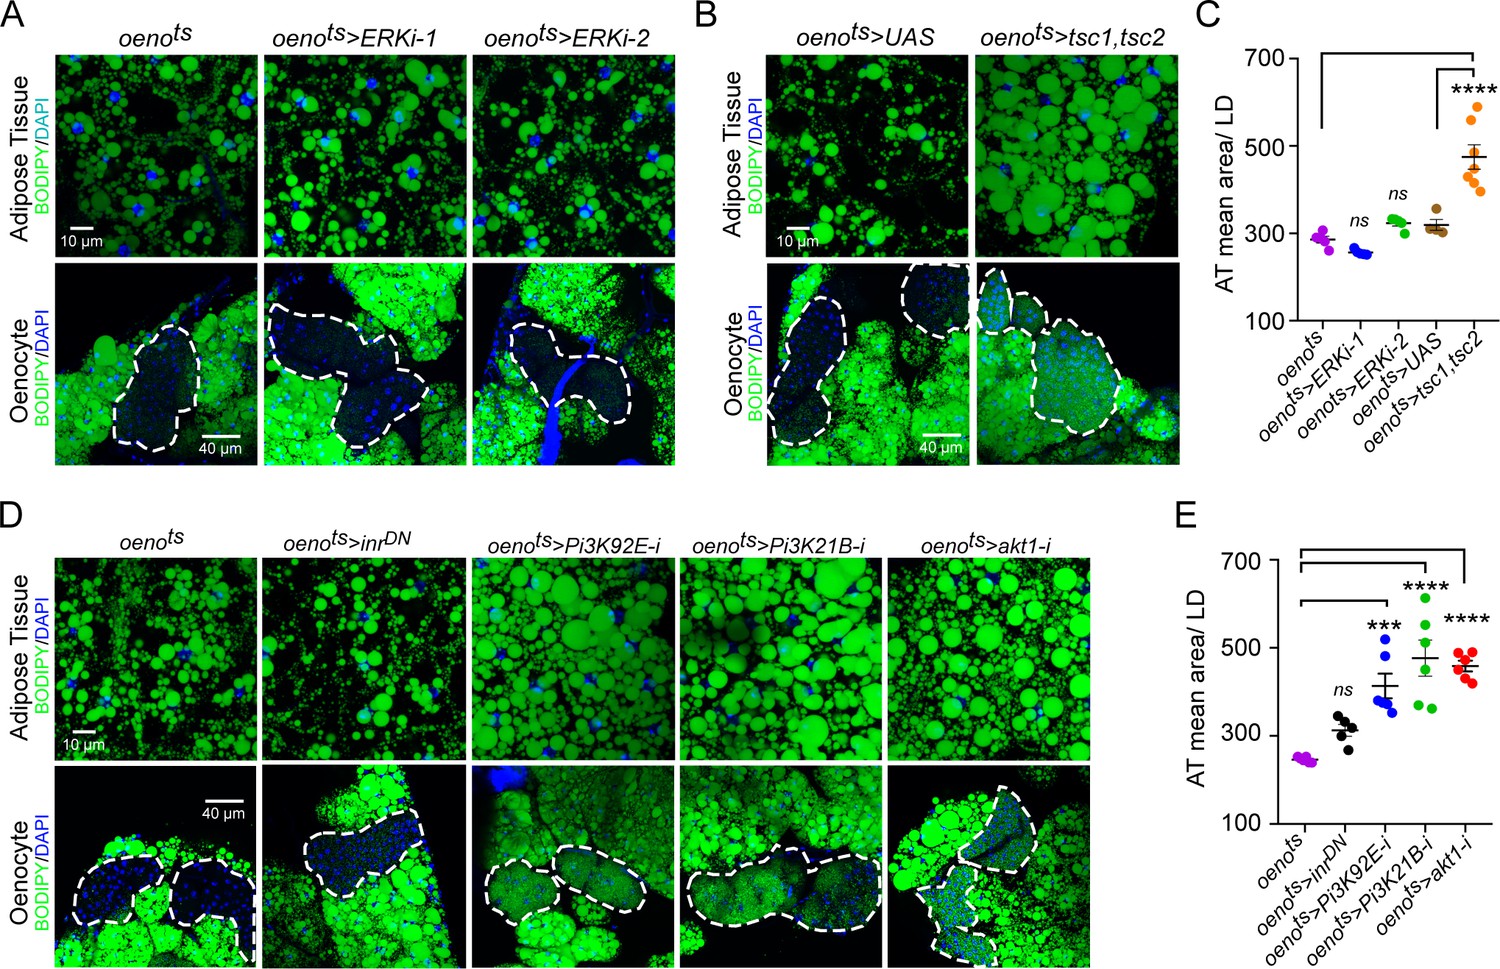
Oenocyte-specific Pi3K/Akt1/TOR signaling protects against obesity.
(A) BODIPY staining showing neutral lipid accumulation in the adipose tissue and oenocytes of control males (oenots = oenocyte-Gal4Gal80ts) and males with oenocyte-specific knockdown of ERK (oenots>ERKi-1 and oenots>ERKi-2) using two independent RNAi lines. (B) BODIPY staining showing neutral lipid accumulation in the adipose tissue and oenocytes of control males (oenots) and males with oenocyte-specific over-expression of tsc1 and tsc2 (oenots>tsc1,tsc2). (C) Mean lipid droplet size (≥10 microns in diameter) in the adipose tissue of flies shown in Figure 2A and B. Only oenocyte-specific loss of TOR signaling (oenots>tsc1,tsc2) show a significant increase (p<0.001) compared to the control genotype. N = 6 animals, One-way ANOVA followed by Tukey’s HSD test, **** denotes p≤0.0001, error bars = SEM. (D) BODIPY staining showing neutral lipid accumulation in the adipose tissue and oenocytes of control males (oenots) and males with oenocyte-specific over-expression of inrDN (oenots>inrDN) and oenocyte-specific (oenots>) knockdown of Pi3K92E (Dp110), Pi3K21B (Dp60) and akt1. (E) Mean lipid droplet size (≥10 microns in diameter) in the adipose tissue of flies shown in Figure 2D. Oenocyte-specific (oenots>) knockdown of Pi3K92E (Dp110), Pi3K21B (Dp60), and akt1 lead to a significant increase (p<0.001 for Pi3K92E, and, p<0.0001 for Pi3K21B and akt1) compared to the control genotype. N = 6 animals, One-way ANOVA followed by Tukey’s HSD test, *** denotes p≤0.001, **** denotes p≤0.0001, error bars = SEM.
Figure 3—figure supplement 1
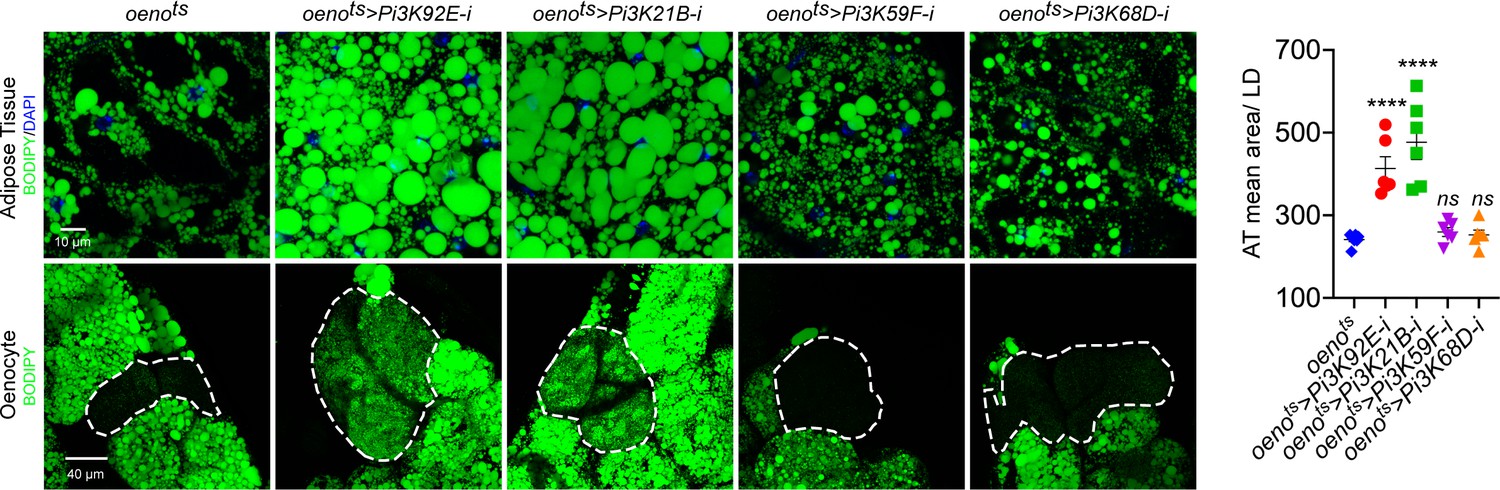
Oenocyte-specific loss of only Pi3K92E and Pi3K21B leads to obesity.
BODIPY staining showing neutral lipid accumulation in the adult male adipose tissue and oenocytes (dorsal abdominal cuticle) of control (oenots = oenocyte-Gal4Gal80ts) flies and flies with oenocyte-specific (oenots>) knockdown of: Pi3K92E; Pi3K21B, Pi3K59F and Pi3K68D.
Figure 4 with 3 supplements
Pi3K/Akt1/TOR signaling acts downstream of PvR in the oenocytes to regulate adiposity.
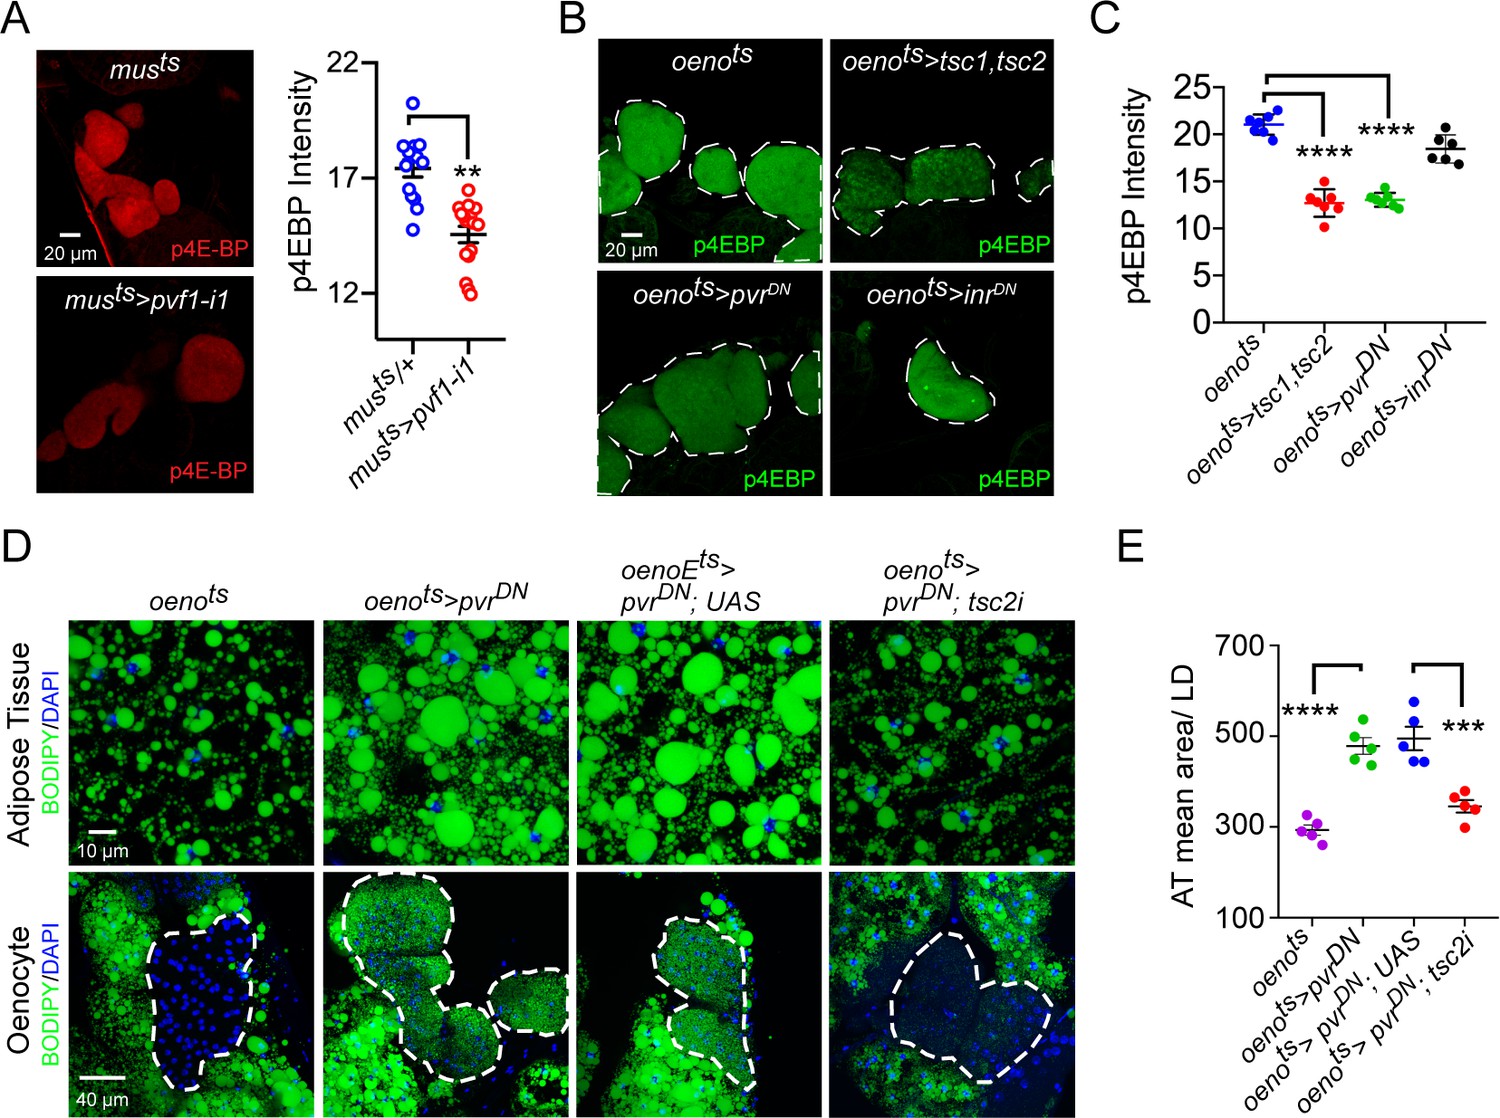
(A) p4EBP staining (Red) of the oenocytes from control (musts = muscle-Gal4Gal80ts) and flies with muscle-specific knockdown of pvf1 (musts>pvf1-i1). Muscle-specific loss of pvf1 leads to a significant decrease (p<0.01) in p4EBP levels in the oenocytes. N = 10 animals, student t-test, ** denotes p≤0.01, error bars = SEM. (B) p4EBP staining (Green) of oenocytes from control flies (oenots = oenocyte-Gal4Gal80ts) and flies with oenocyte-specific over-expressing tsc1/tsc2 (oenots>tsc1,tsc2), pvrDN (oenots>pvrDN) or inrDN (oenots>inrDN). (C) Quantification of p4EBP staining intensity in the oenocytes for samples shown in Figure 3C. Oenocyte-specific over-expression of tsc1/tsc2 (oenots>tsc1,tsc2) and pvrDN (oenots>pvrDN) led to a significant reduction in p4EBP levels (p<0.0001). Over-expression of inrDN (oenots>inrDN), however, does not affect p4EBP levels significantly. N = 6/7 animals, Student t-test, **** denotes p≤0.0001, error bars = SEM. (D) BODIPY staining showing neutral lipid accumulation in the adipose tissue and oenocytes of control males (oenots) and males with oenocyte-specific over-expression of either pvrDN (oenots>pvrDN) or over-expression of pvrDN along with tsc2 knockdown (oenots>pvrDN,tsc2-i). Flies over-expressing pvrDN in the oenocytes along with an empty UAS construct (oenots>pvrDN,UAS) serve as an additional control to account for any effect of Gal4 dilution on the obesity phenotype. (E) Mean lipid droplet size (≥10 microns in diameter) in the adipose tissue of flies shown in (D). Oenocyte-specific knockdown of tsc2 along with pvrDN over-expression (oenots>pvrDN,tsc2-i) significantly rescues the obesity phenotype observed flies with oenocyte-specific over-expression of pvrDN (p<0.001). N = 5 animals, One-way ANOVA followed by Tukey’s HSD test, *** denotes p≤0.001, **** denotes p≤0.0001, error bars = SEM.
Figure 4—figure supplement 1
Oenocyte-specific activation of TOR signaling does not affect lipid accumulation.
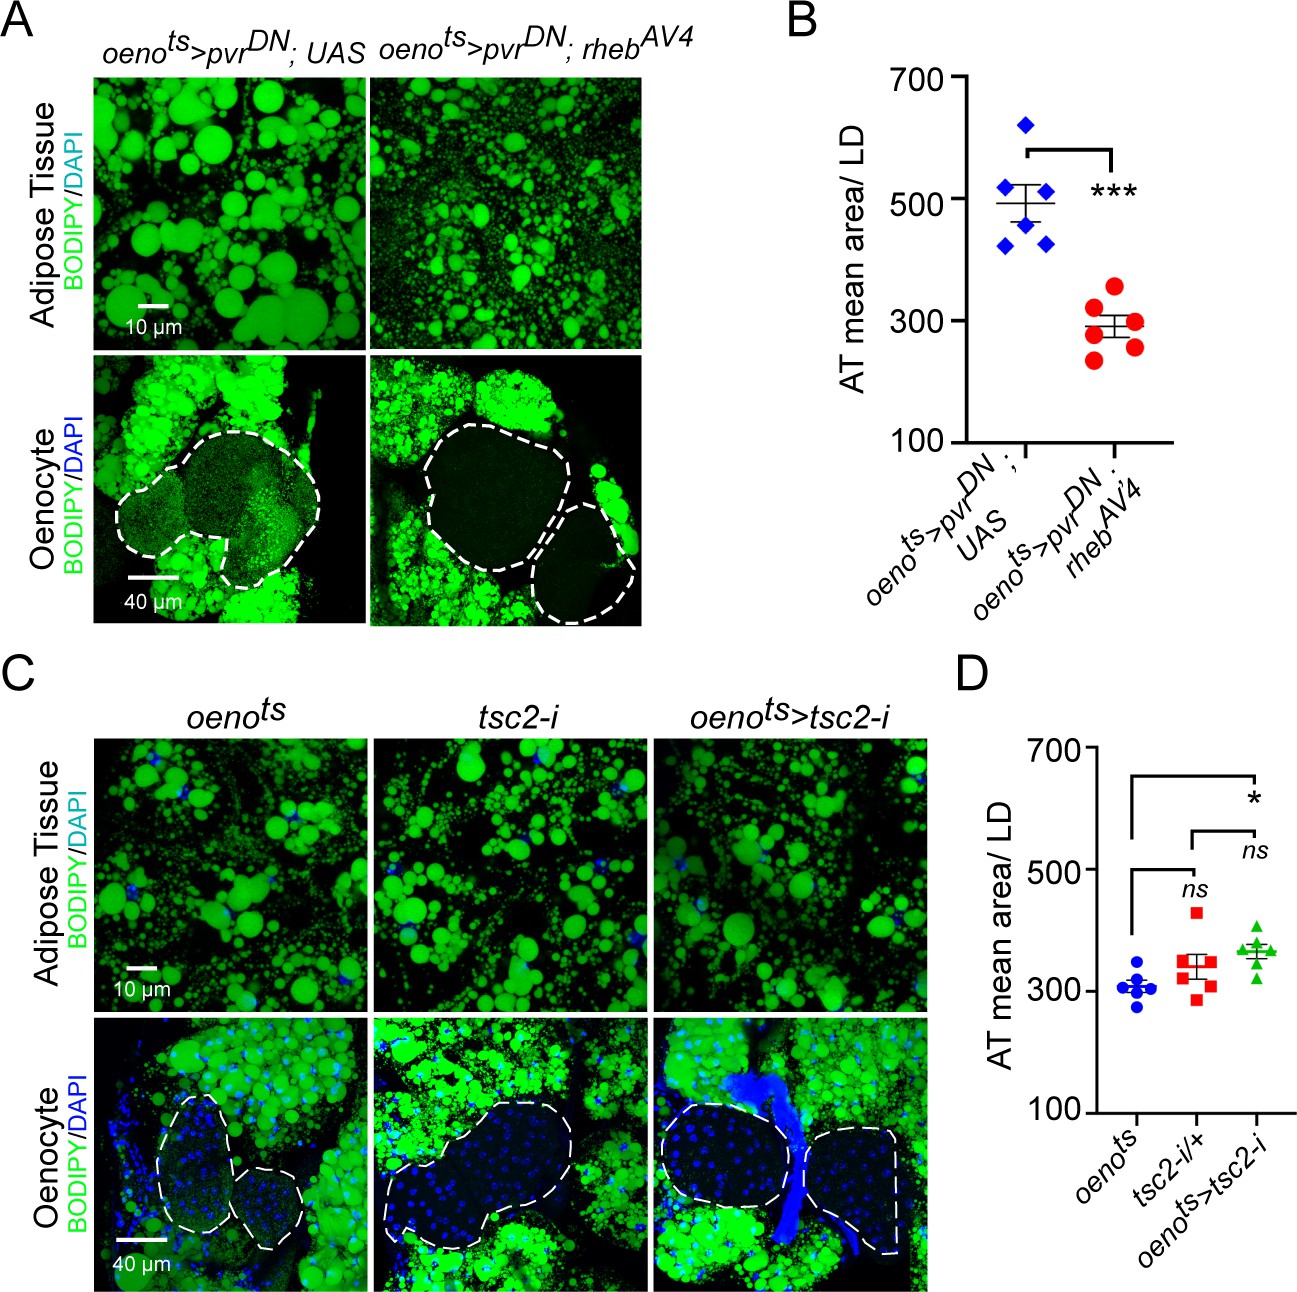
(A) BODIPY staining showing neutral lipid accumulation in the adipose tissue and oenocytes of males with oenocyte-specific over-expression of either pvrDN (oenots>pvrDN) or over-expression of pvrDN along with over-expression of a constitutively active form of rheb (oenots>pvrDN; rhebAV4). oenots = oenocyte-Gal4Gal80ts. (B) Mean lipid droplet size (≥10 microns in diameter) in the adipose tissue of flies shown in (A). Oenocyte-specific over-expression of rehbAV4 along with pvrDN over-expression (oenots>pvrDN; rhebAV4) significantly rescues the obesity phenotype observed flies with oenocyte-specific over-expression of pvrDN (p<0.001). N = 6 animals, One-way ANOVA followed by Tukey’s HSD test, *** denotes p≤0.001, **** denotes p≤0.0001, error bars = SEM. (C) BODIPY staining showing neutral lipid accumulation in the adipose tissue and oenocytes of control males (oenots and tsc2-i) and males with oenocyte-specific tsc2 knockdown (oenots>tsc2-i). (D) Mean lipid droplet size (≥10 microns in diameter) in the adipose tissue of flies shown in (C). Oenocyte-specific knockdown of tsc2 showed a mild increase in mean lipid droplet size only compared to once control. N = 6 animals, One-way ANOVA followed by Tukey’s HSD test, error bars = SEM.
Figure 4—figure supplement 2
InR signaling or oenocyte size does not affect PvR signaling-mediated effects on systemic lipid accumulation.
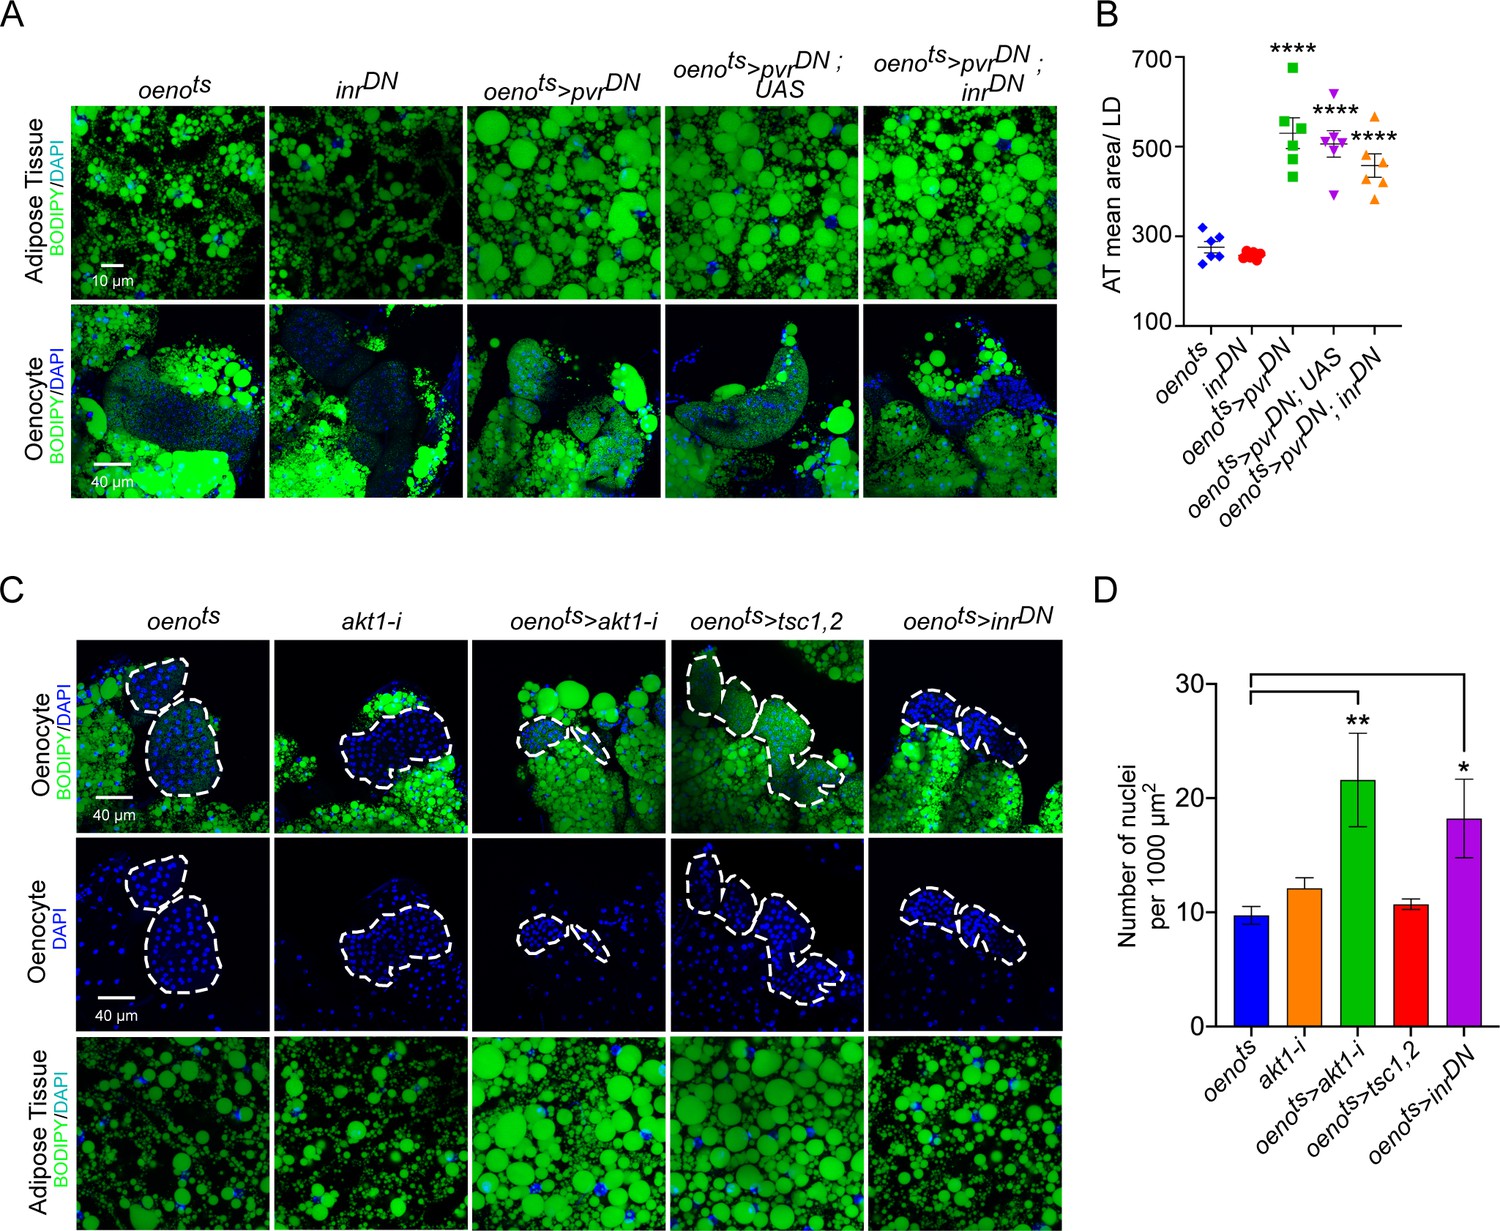
(A) BODIPY staining showing neutral lipid accumulation in the adipose tissue and oenocytes of control males (oenots = oenocyte-Gal4Gal80ts and inrDN = UAS-inrDN/+) and males with oenocyte-specific overexpression of pvrDN either by itself (oenots>pvrDN) or along with overexpression of inrDN (oenots>pvrDN; inrDN). Flies over-expressing pvrDN in the oenocytes along with an empty UAS construct (oenots>pvrDN,UAS) serve as an additional control to account for any effect of Gal4 dilution on the obesity phenotype. (B) Mean lipid droplet size (≥10 microns in diameter) in the adipose tissue of flies shown in (A). Oenocyte-specific over-expression inrDN along with pvrDN (oenots>pvrDN; inrDN) rescues lipid accumulation in the oenocytes. However, the flies still show a significant increase in lipid droplet size in the adipose tissue compared to controls. N = 6 animals, One-way ANOVA followed by Tukey’s HSD test, *** denotes p≤0.001, **** denotes p≤0.0001, error bars = SEM. (C) DAPI staining showing the density of nuclei in the oenocytes of control flies (oenots and akt1-i = akt1-i/+) and flies lacking Akt signaling (oenotye-specific knockdown of akt1: oenots>akt1-i), TOR signaling (oenotye-specific overexpression of tsc1 and tsc2: oenots>tsc1, tsc2) and InR signaling (oenocyte-specific overexpression of inrDN: oenots>inrDN). Loss of Akt signaling and InR signaling leads to a significant decrease in oenocyte size as reflected by an increase in oenocyte density per unit area. N = 5/6 animals (about three oenocyte clusters were measured per animal), One-way ANOVA followed by Tukey’s HSD test, *** denotes p≤0.001, **** denotes p≤0.0001, error bars = SEM. Representative images of adipose tissue lipid droplets for each genotype is also shown. Note that the images were drawn from experiments already reported elsewhere in the manuscript and quantification of lipid droplet size is already reported in Figure 3C, E and Figure 4—figure supplement 3B.
Figure 4—figure supplement 3
Additional control showing baseline lipid droplet size in the adipose tissue and lipid accumulation in the oenocytes.
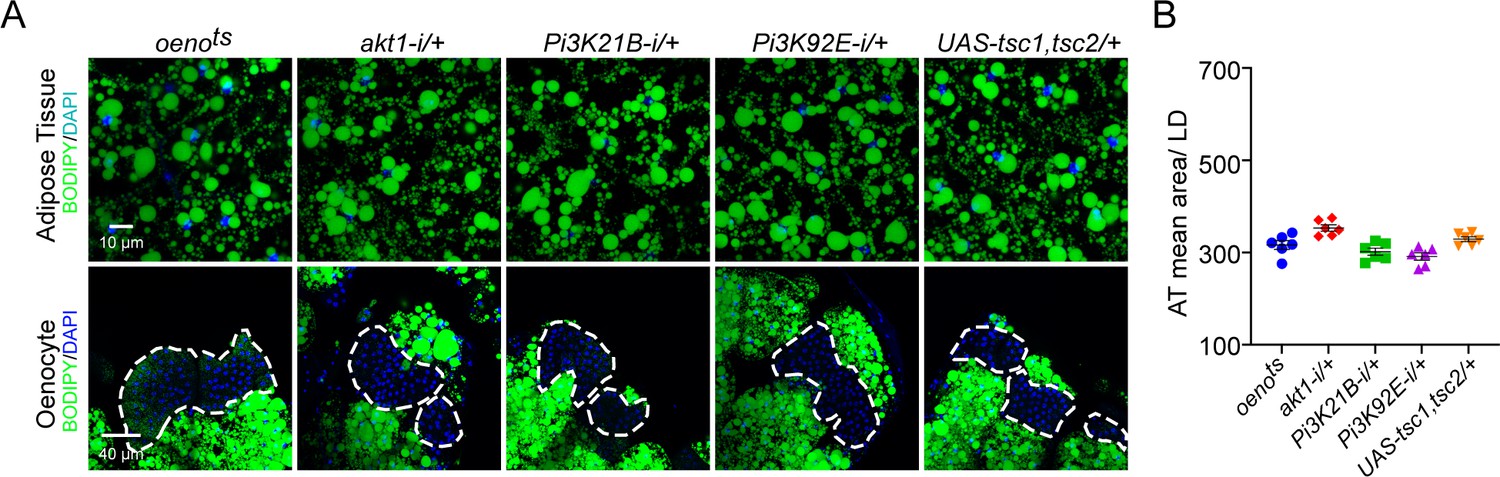
(A) BODIPY staining showing neutral lipid accumulation in the adipose tissue and oenocytes of control males flies. oenots = oenocyte-Gal4Gal80ts. (B) Mean lipid droplet size (≥10 µm in diameter) in the adipose tissue of flies shown in (A). N = 6 animals, One-way ANOVA followed by Tukey’s HSD test, *** denotes p≤0.001, **** denotes p≤0.0001, error bars = SEM.
Figure 5
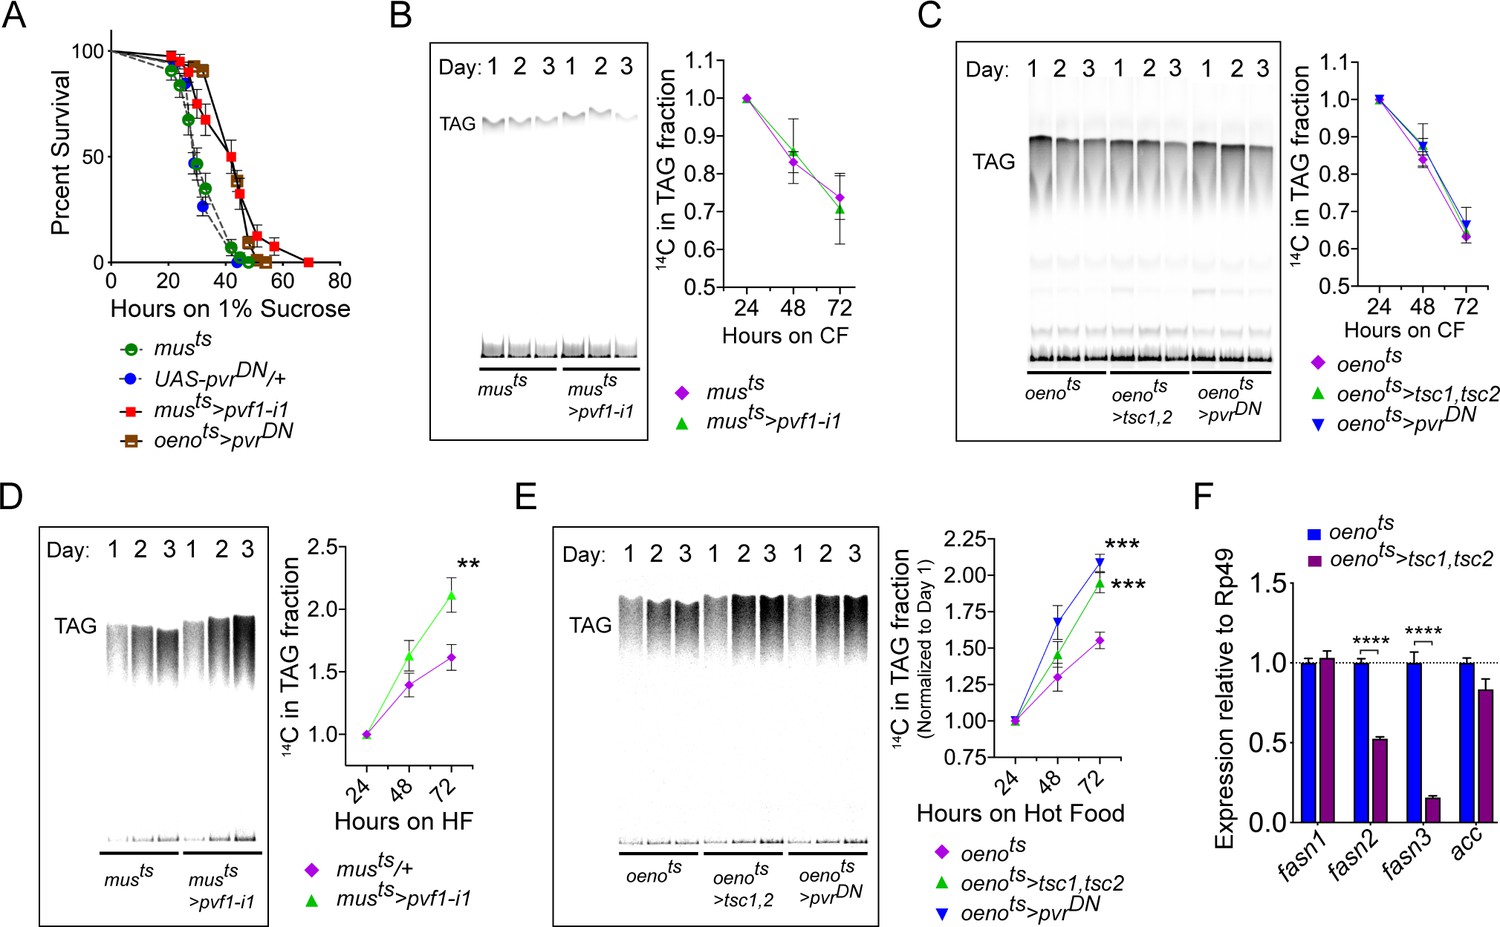
Muscle to oenocyte Pvf1 signaling suppresses lipid synthesis.
(A) Starvation resistance of adult male flies on 1% sucrose and 0.8% agar food. Males with muscle-specific knockdown of pvf1 (musts>pvf1-i1) and oenocyte-specific loss of PvR signaling (oenots>pvrDN) were significantly more resistant to starvation compared to respective controls flies (musts = muscle-Gal4Gal80ts and UAS-pvrDN/+). N = 100 (animals), Log rank (Mantel-Cox) test, p≤0.0001 for both comparisons, error bars = SEM. (B) Rate of lipid mobilization in control (musts) and flies with muscle-specific loss of pvf1 (musts>pvf1-i1). N = 4, Cohorts of 23 adult males were used per data point. Multiple Student t-test, error bars = SEM. (C) Rate of lipid mobilization in control (oenots = oenocyte-Gal4Gal80ts) and flies with oenocyte-specific loss of TOR signaling (oenots>tsc1,tsc2) and PvR signaling (oenots>pvrDN). N = 4, Cohorts of 23 adult males were used per data point. Multiple Student t-test, error bars = SEM. (D) Rate of lipid synthesis and incorporation from [U-14C]-Sucrose in control (musts) and flies with muscle-specific loss of pvf1 (musts>pvf1-i1). Flies lacking Pvf1 in the muscle show a significantly faster rate of lipid incorporation compared to control animals. N = 4, Cohorts of 23 adult males were used per data point. ** denotes p≤0.01 at 72 hr on hot food. Multiple student t-test, error bars = SEM. (E) Rate of lipid synthesis and incorporation from [U-14C]-Sucrose in control flies (oenots) and flies with oenocyte-specific loss of TOR signaling (oenots>tsc1,tsc2) and PvR signaling (oenots>pvrDN). Flies lacking TOR or PvR signaling in the oenocytes show a significantly faster rate of lipid incorporation compared to control animals. N = 4, Cohorts of 23 adult males were used per data point. *** denotes p≤0.001 at 72 hr on hot food. Multiple student t-test, error bars = SEM. (F) Expression level of key lipid synthesis genes in control (oenots) and flies with oenocyte-specific loss of TOR signaling (oenots>tsc1,tsc2). Only oenocyte-specific fatty acid synthases, fasn2 and fasn3, show a significant reduction in expression in the experimental flies. N = 4, Cohorts of 23 adult males were used per data point. One-way ANOVAa followed by Tukey’s HSD test, **** denotes p≤0.0001, error bars = SEM.
Figure 6 with 2 supplements
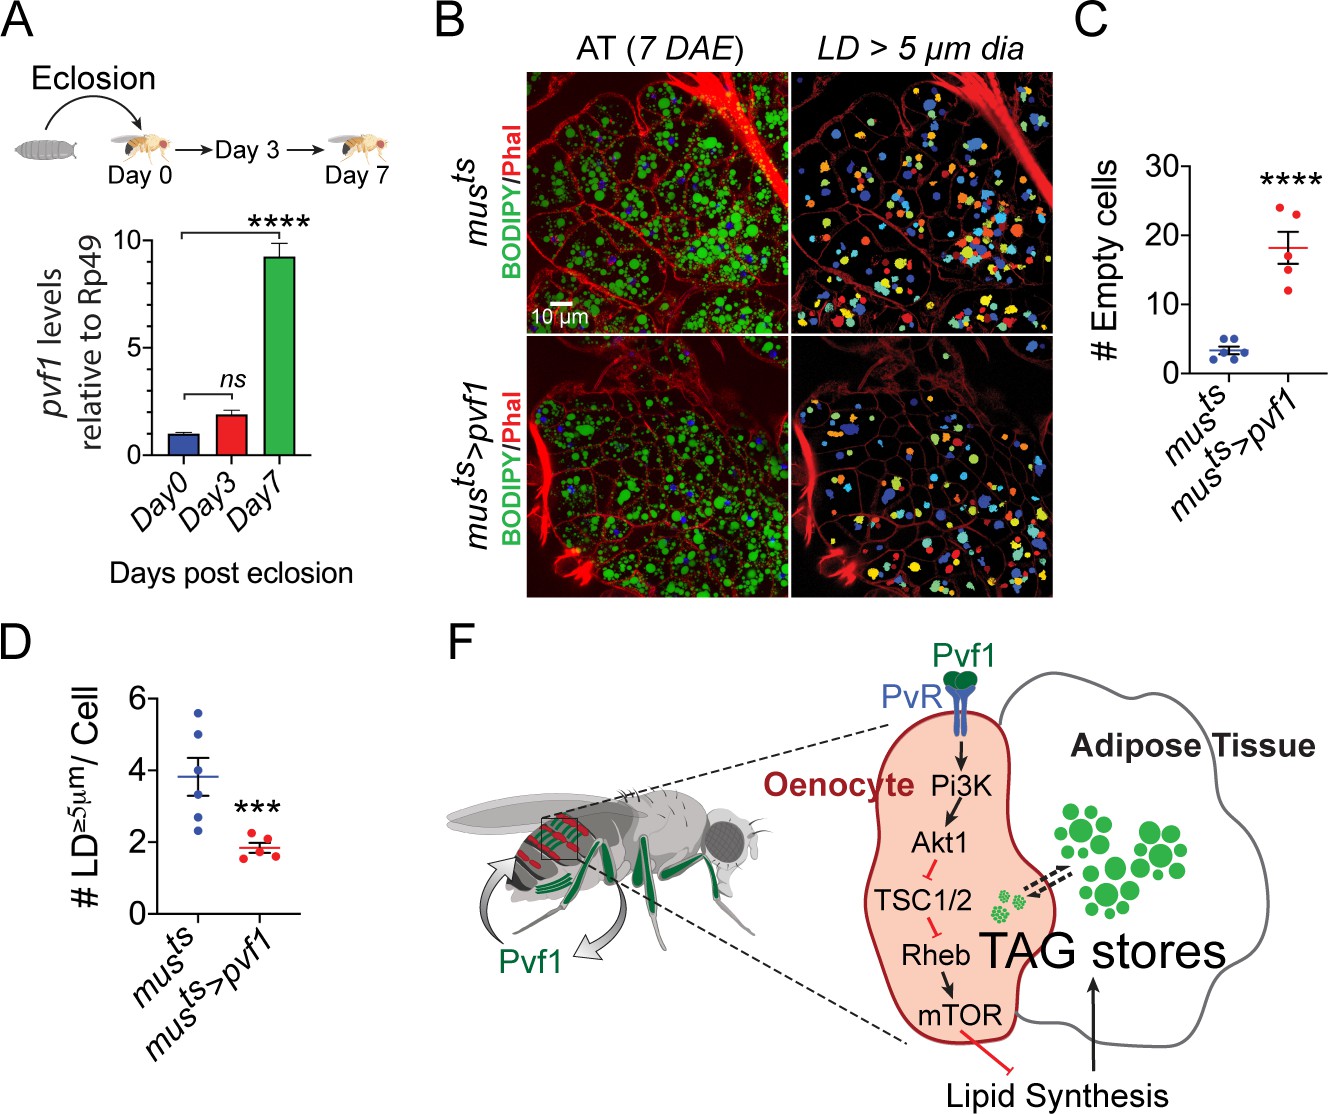
Muscle-Pvf1 limits post-eclosion lipid recovery by suppressing lipid synthesis.
(A) Muscle-specific expression of pvf1 in freshly eclosed w1118 males on days 0, 3 and 7 post eclosion. N = 4, 10 adult male abdominal cuticles were used per data point. One-way Anova followed by Dunnett multiple comparison test, ns denotes Not Significant with p=0.202, **** denotes p≤0.0001, error bars = SEM. (B) BODIPY staining of adipose tissue from 7-day-old control males (musts = muscle-Gal4Gal80ts) and males with muscle-specific over-expression of pvf1 (musts>Pvf1) from Day 0 of eclosion. Panels on the right show identification of lipid droplets (LD) that are ≥ 5 μm in diameter using Cell Profiler. DAE = days after eclosion. (C) Quantification of number of adipose tissue cells that do not contain LDs that are ≥ 5 µm in diameter for control (musts) flies and flies with muscle-specific over-expression of pvf1 (musts>pvf1). N = 5/6 animals, Student t-test, **** denotes p≤0.0001, error bars = SEM. (D) Quantification of number of large (≥5 μm in diameter) LDs per cell in control (musts) flies and flies with muscle-specific over-expression of pvf1 (musts>pvf1). N = 5/6 animals, Student t-test, *** denotes p≤0.001, error bars = SEM. (E) Model of the role of muscle-derived Pvf1 in regulating systemic lipid content by signaling to the oenocytes of adult male flies.
Figure 6—figure supplement 1
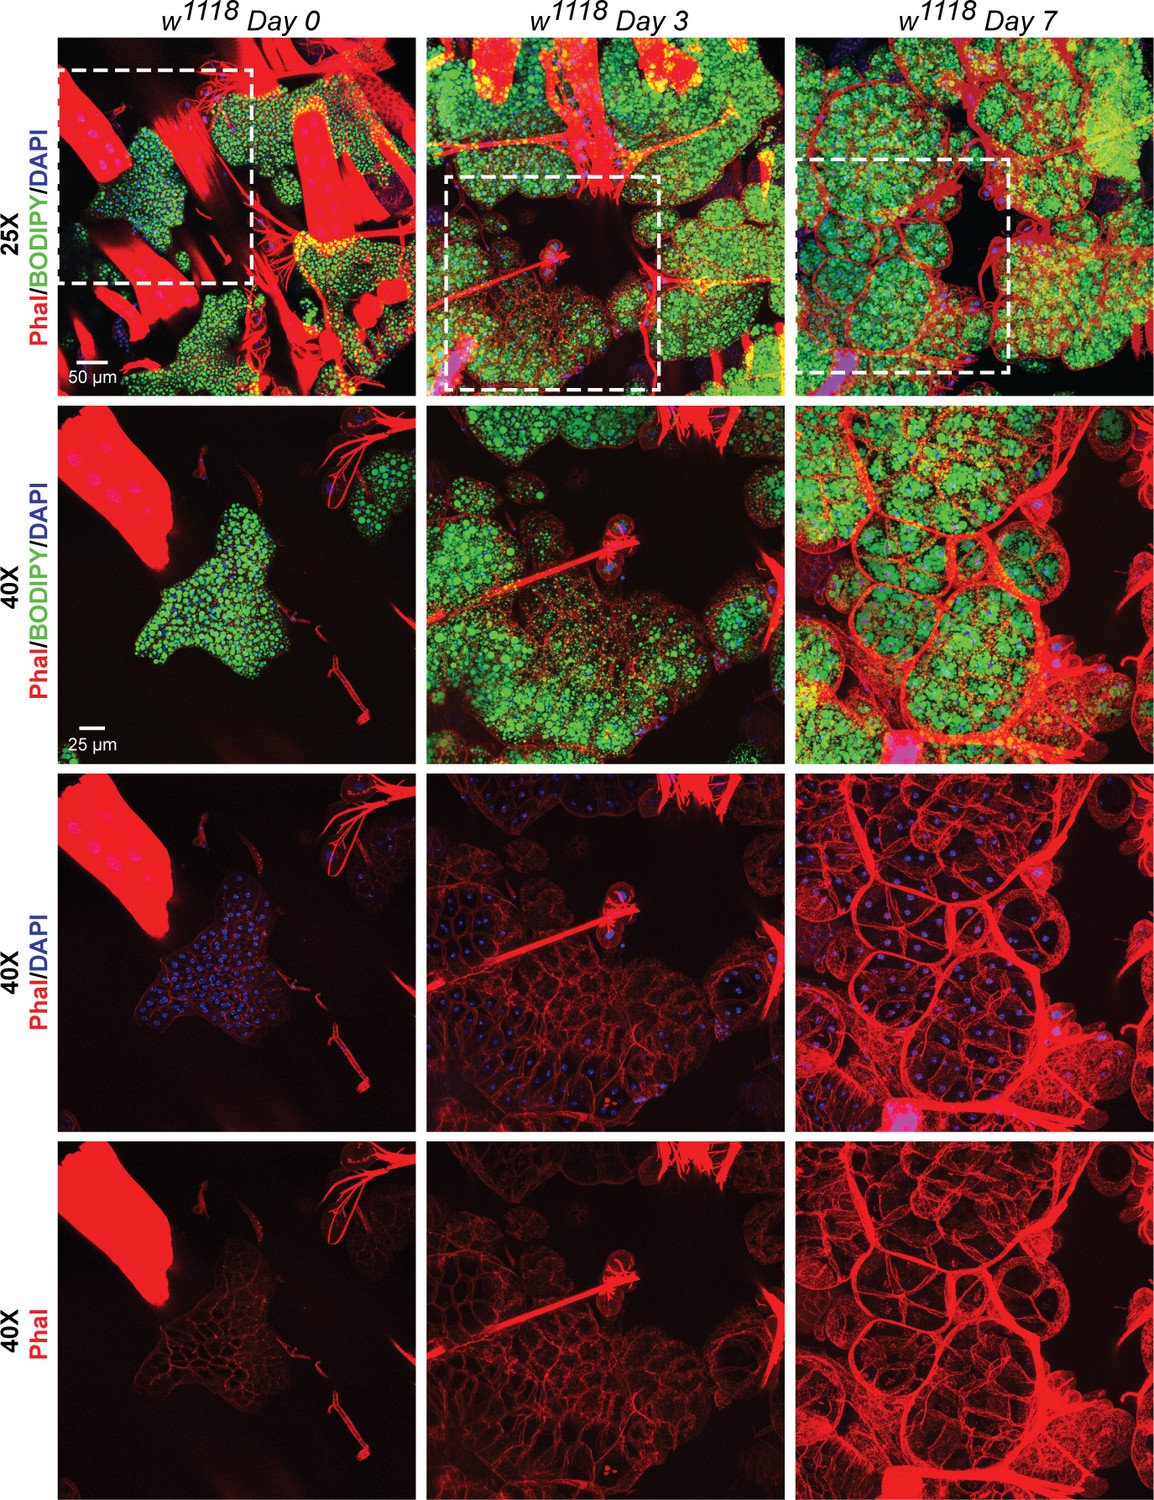
Recovery of adipose tissue lipid stores involve formation and expansion of new lipid droplets, and, expansion of the adipose tissue cells.
BODIPY, DAPI and Phalloidin staining of adipose tissue preparations from w1118 flies on day 0, day 3 and day 7 after eclosion. Topmost row shows images acquired with a 25x eyepiece. Bottom three rows show images acquired with a 40x eyepiece. Dotted white boxes show the regions that were re-imaged with the 40x lens. On day 0 post-eclosion, the adipose tissue is small with each cell having two nuclei that are positioned very close to each other. By day 3 and day 7, the adipose tissue cells become progressively larger and fill up with more lipid droplets per cell (both large and small).
Figure 6—figure supplement 2
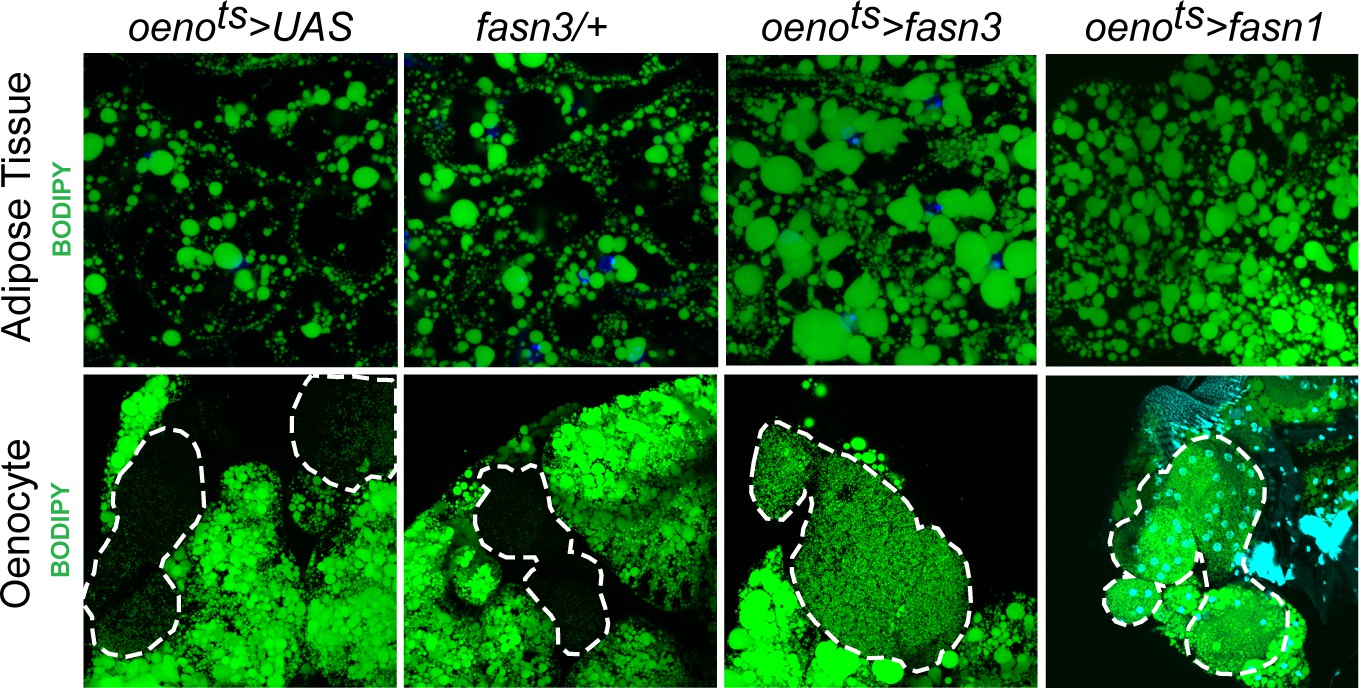
Oenocyte-specific activation of lipid synthesis leads to increased lipid stores in the adipose tissue.
BODIPY staining showing neutral lipid accumulation in the adult male adipose tissue and oenocytes (dorsal abdominal cuticle) of control (oenots>UAS) flies and flies with oenocyte-specific over-expression of fasn3 and fasn1 (oenots>fasn3 and oenots>fasn1). oenots = oenocyte-Gal4Gal80ts.
Figure 7
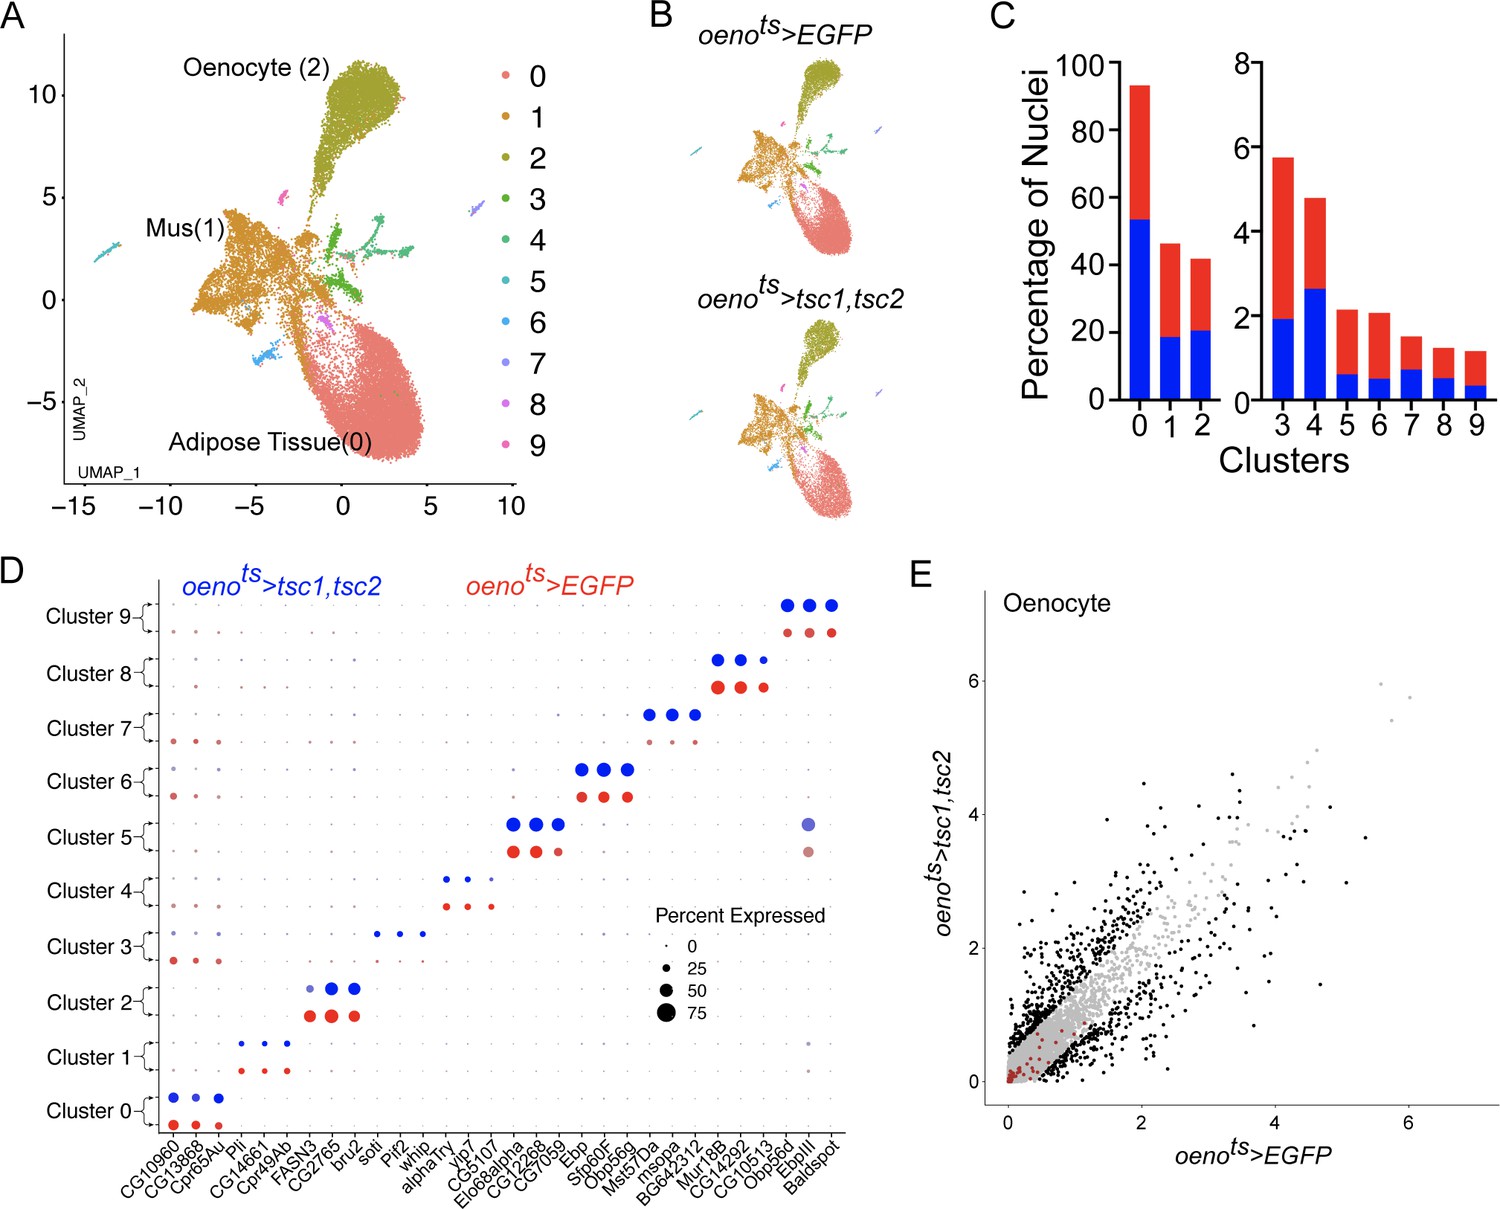
Differential snRNA-seq of the abdominal cuticle upon oenocyte-specific loss of TOR.
(A) Integrated Uniform Manifold Approximation and Projection (UMAP) plot of snRNA-seq data derived from the abdominal cuticle samples pertaining to oenocyte-specific overexpression of tuberous sclerosis complex 1 and 2 (tsc1, tsc2), which results in the blockade of TOR activity. The UMAP shows 10 distinct clusters (0–9) with the Adipose (0), Muscle (1), and Oenocytes (2) as the major tissue clusters. oenots = oenocyte-Gal4Gal80ts. (B) UMAPs separated (from A) based on samples oenocyte-specific overexpression of EGFP control (oenots>EGFP) and tsc1, tsc2 (oenots>tsc1, tsc2). (C) Bar graphs depicting the percentages of nuclei between the two genotypes oenots >EGFP (red) and oenots>tsc1, tsc2 (blue). Note that the fraction of nuclei did not change in cluster 2, which represents the Oenocytes. (D) Dot plot representing top three genes enriched per cluster based on average expression (logFC). Color gradient of the dot represents the expression level, while the size represents percentage of cells expressing any gene per cluster. The dots within each cluster are separated based on the two genotypes oenots>EGFP (red) and oenots>tsc1, tsc2 (blue) to showcase changes in gene expression, if any. (E) Scatter plot depicting the differentially expressed genes within the Oenocyte cluster pertaining to the two genotypes, oenots>EGFP and oenots>tsc1,tsc2 [log(average expression +1)]. The differential gene expression analysis reveals that certain genes known to be induced upon starvation (highlighted as red dots) remain unchanged upon loss of TOR activity within oenocytes compared to controls. See Supplementary file 4 for the list of starvation-induced genes.
Tables
Key resources table
| Reagent type (species) or resource | Designation | Source or reference | Identifiers | Additional information | |||
|---|---|---|---|---|---|---|---|
| Gene (D. melanogaster) | Pvf1 | FlyBase | FLYB: FBgn0030964 | NA | |||
| Gene (D. melanogaster) | Pvf2 | FlyBase | FLYB: FBgn0031888 | NA | |||
| Gene (D. melanogaster) | Pvf3 | FlyBase | FLYB: FBgn0085407 | NA | |||
| Gene (D. melanogaster) | Pvr | FlyBase | FLYB: FBgn0085407 | NA | |||
| Gene (D. melanogaster) | Pi3K21B | FlyBase | FLYB: FBgn0020622 | NA | |||
| Gene (D. melanogaster) | Pi3K92E | FlyBase | FLYB: FBgn0015279 | NA | |||
| Gene (D. melanogaster) | Akt1 | FlyBase | FLYB: FBgn0010379 | NA | |||
| Gene (D. melanogaster) | Tsc1 | FlyBase | FLYB: FBgn0026317 | NA | |||
| Gene (D. melanogaster) | Tsc2 | FlyBase | FLYB: FBgn0005198 | NA | |||
| Gene (D. melanogaster) | Pli | FlyBase | FLYB: FBgn0025574 | NA | |||
| Gene (D. melanogaster) | sls | FlyBase | FLYB: FBgn0086906 | NA | |||
| Gene (D. melanogaster) | geko | FlyBase | FLYB: FBgn0020300 | NA | |||
| Gene (D. melanogaster) | Pi3K59F | FlyBase | FLYB: FBgn0015277 | NA | |||
| Gene (D. melanogaster) | Pi3K68D | FlyBase | FLYB: FBgn0015278 | NA | |||
| Gene (D. melanogaster) | rl | FlyBase | FLYB: FBgn0003256 | NA | |||
| Gene (D. melanogaster) | InR | FlyBase | FLYB: FBgn0283499 | NA | |||
| Gene (D. melanogaster) | FASN1 | FlyBase | FLYB: FBgn0283427 | NA | |||
| Gene (D. melanogaster) | FASN3 | FlyBase | FLYB: FBgn0287184 | NA | |||
| Strain, strain background (D. melanogaster) | w1118 | Vienna Drosophila Resource Center | VDRC ID: 60000 | 1w[1118] | |||
| Genetic reagent (D. melanogaster) | UAS-pvf1i/UAS-pvf1-i1 | Vienna Drosophila Resource Center | VDRC ID: 102699 | Genotype: P{KK112211}VIE-260B | |||
| Genetic reagent (D. melanogaster) | UAS-pvf1-i2 | National Institute of Genetics | NIG Fly: 7103 R-2 | NA | |||
| Genetic reagent (D. melanogaster) | UAS-pvf2-i | Vienna Drosophila Resource Center | VDRC ID: 102072 | Genotype: P{KK110608}VIE-260B | |||
| Genetic reagent (D. melanogaster) | UAS-pvf3-i | Vienna Drosophila Resource Center | VDRC ID: 105008 | Genotype: P{KK112796}VIE-260B | |||
| Genetic reagent (D. melanogaster) | musts | Perrimon Lab stock | PMID:28739899 | Genotype: w[*]; P[w[+mC]=tub]P-Gal80{[ts]}10; P{w[+mC]}=Gal4-{Mef2.R}3 | |||
| Genetic reagent (D. melanogaster) | v-i | National Institute of Genetics | NIG Fly: 2115 R-1 | NA | |||
| Genetic reagent (D. melanogaster) | pli-troj-Gal4 | Bloomington Drosophila Stock Center | BDSC: 77693 | Genotype: y[1] w[*]; Mi{Trojan-GAL4.2}Pli[MI00302-TG4.2]/TM3, Sb[1] Ser[1] | |||
| Genetic reagent (D. melanogaster) | sls-troj-Gal4 | Bloomington Drosophila Stock Center | BDSC: 67495 | Genotype: y[1] w[*]; Mi{Trojan-GAL4.1}sls[MI10783-TG4.1]/TM3, Sb[1] Ser[1] | |||
| Genetic reagent (D. melanogaster) | geko-troj-Gal4 | Bloomington Drosophila Stock Center | BDSC: 66833 | Genotype: y[1] w[*]; Mi{Trojan-GAL4.1}geko[MI02663-TG4.1]/TM3, Sb[1] Ser[1] | |||
| Genetic reagent (D. melanogaster) | pvrDN | Bloomington Drosophila Stock Center | BDSC: 58430 | w[1118]; P{w[+mC]=UASp Pvr.DN}D1 | |||
| Genetic reagent (D. melanogaster) | ATts | Perrimon lab | FBrf0234453 | yw/w; tub-Gal80ts/Cyo; Lpp-Gal4/TM6BTby+ | |||
| Genetic reagent (D. melanogaster) | oenots | Bloomington Drosophila Stock Center | BDSC: 65700 | Genotype: P{w[+mC]=Desat1 GAL4.E800}4M, P{w[+mC]=tubP-GAL80[ts]}2 | |||
| Genetic reagent (D. melanogaster) | pvr-i | National Institute of Genetics | NIG-FLY: 8222 R-2 | NA | |||
| Transfected construct | NA | NA | NA | NA | |||
| Biological sample (D. melanogaster) | Adult Abdominal Cuticle | NA | NA | NA | |||
| Antibody | Anti-Pvr (Rat, Polyclonal) | Rosin et al., 2004 | PMID:15056618 | 1/400 | |||
| Antibody | Anti-Pvf1 (Rat, Polyclonal) | Rosin et al., 2004 | PMID:15056618 | 1/100 | |||
| Antibody | Anti-p4E-BP (Rabbit, monoclonal) | Cell Signaling | 2855S | 1/200 | |||
| Recombinant DNA reagent | NA | NA | NA | NA | |||
| Sequence-based reagent | FASN1 (primer) | FlyPrimerBank | PP32811 | For: ATTATTGACGCTGGCCTAAACC Rev: TGCTGCTCAGTCTCCGAGT | |||
| Sequence-based reagent | FASN2 (primer) | FlyPrimerBank | PP1235 | For: ACATTGTGATCTCGGGACTTTC Rev:CGCTAAAGAACTTGTCGTCGAA | |||
| Sequence-based reagent | FASN3 (primer) | FlyPrimerBank | PP17912 | For: CGCCGATGGCGTCATTTTAAT Rev:CTCCAAAGAAGGTTGCATCAAAC | |||
| Sequence-based reagent | Pvf1 (primer) | FlyPrimerBank | PP26981 | For: AATCAACCGTGAGGAATGCAA Rev: GCACGCGGGCATATAGTAGT | |||
| Sequence-based reagent | ACC (primer) | FlyPrimerBank | PP34306 | For: CGAGCGGGCCATTAGGTTT Rev: GCCATCTTGATGTATTCGGCAT | |||
| Peptide, recombinant protein | NA | NA | NA | NA | |||
| Commercial assay or kit | Chromium Single Cell 3’ Library and Gel Bead Kit v2 | 10x Genomics | PN-120267 | NA | |||
| Commercial assay or kit | Chromium i7 Multiplex Kit | 10x Genomics | PN-120262 | NA | |||
| Commercial assay or kit | Chromium Single Cell A Chip Kit | 10x Genomics | PN-1000009 | NA | |||
| Commercial assay or kit | Nuclei Isolation Kit: Nuclei PURE Prep | Sigma-Aldrich | Cat# NUC201-1KT | NA | |||
| Chemical compound, drug | NA | NA | NA | NA | |||
| Software, algorithm | Seurat | Stuart et al., 2019 | PMID:31178118 | NA | |||
| Software, algorithm | Harmony | Korsunsky et al., 2019 | PMID:31740819 | NA | |||
| Software, algorithm | SoupX | Young and Behjati, 2018 | Biorxiv | doi: https://doi.org/10.1101/303727 | |||
| Software, algorithm | Biorender | https://biorender.com/ | NA | Biorender was utilized to make the schematic diagrams used in this study. | |||
| Other | DAPI (nuclear stain) | Vector Laboratories | Cat# H-1200 | Ready to use | |||
| Other | BODIPY | ThermoFischer | Cat# D3823 | 1/500 dilution of a 1 mg/ml stock in DEPC | |||
| Other | SyBr Green | Bio-Rad iQ SYBR Green Supermix | Cat# 1708880 | Working concentration: 1X | |||
| Other | Phalloidin | ThermoFischer | A12381 | 1/100 dilution of a 1 mg/ml stock in Methanol | |||
Additional files
-
Supplementary file 1
Table representing number of nuclei, genes and unique molecular identifiers (UMIs) recovered per nuclei per sample.
- https://cdn.elifesciences.org/articles/56969/elife-56969-supp1-v2.xlsx
-
Supplementary file 2
Marker genes identified in each of the 10 clusters (Figure 2B) identified in our snRNA seq of control (oenots>EGFP) animals.
- https://cdn.elifesciences.org/articles/56969/elife-56969-supp2-v2.xlsx
-
Supplementary file 3
Signaling pathway genes identified in our snRNA sequencing analysis and used for pathway enrichment analysis (Figure 2C).
- https://cdn.elifesciences.org/articles/56969/elife-56969-supp3-v2.xlsx
-
Supplementary file 4
Normalized expression levels (obtained from snRNA seq analysis) of starvation responsive genes in the oenocytes of control (oenots>EGFP) animals and animals lacking TOR signaling in the oenocytes (oenots>tsc1, tsc2).
- https://cdn.elifesciences.org/articles/56969/elife-56969-supp4-v2.xlsx
-
Transparent reporting form
- https://cdn.elifesciences.org/articles/56969/elife-56969-transrepform-v2.docx
Download links
A two-part list of links to download the article, or parts of the article, in various formats.
Downloads (link to download the article as PDF)
Open citations (links to open the citations from this article in various online reference manager services)
Cite this article (links to download the citations from this article in formats compatible with various reference manager tools)
Drosophila PDGF/VEGF signaling from muscles to hepatocyte-like cells protects against obesity
eLife 9:e56969.
https://doi.org/10.7554/eLife.56969


