Shared and modality-specific brain regions that mediate auditory and visual word comprehension
- Psychology, University of Dundee, United Kingdom
- Institute of Neuroscience and Psychology, University of Glasgow, United Kingdom
- Institute for Biomagnetism and Biosignalanalysis, University of Münster, Germany
- Department for Cognitive Neuroscience, Faculty of Biology, Bielefeld University, Germany
Figures
Figure 1 with 2 supplements
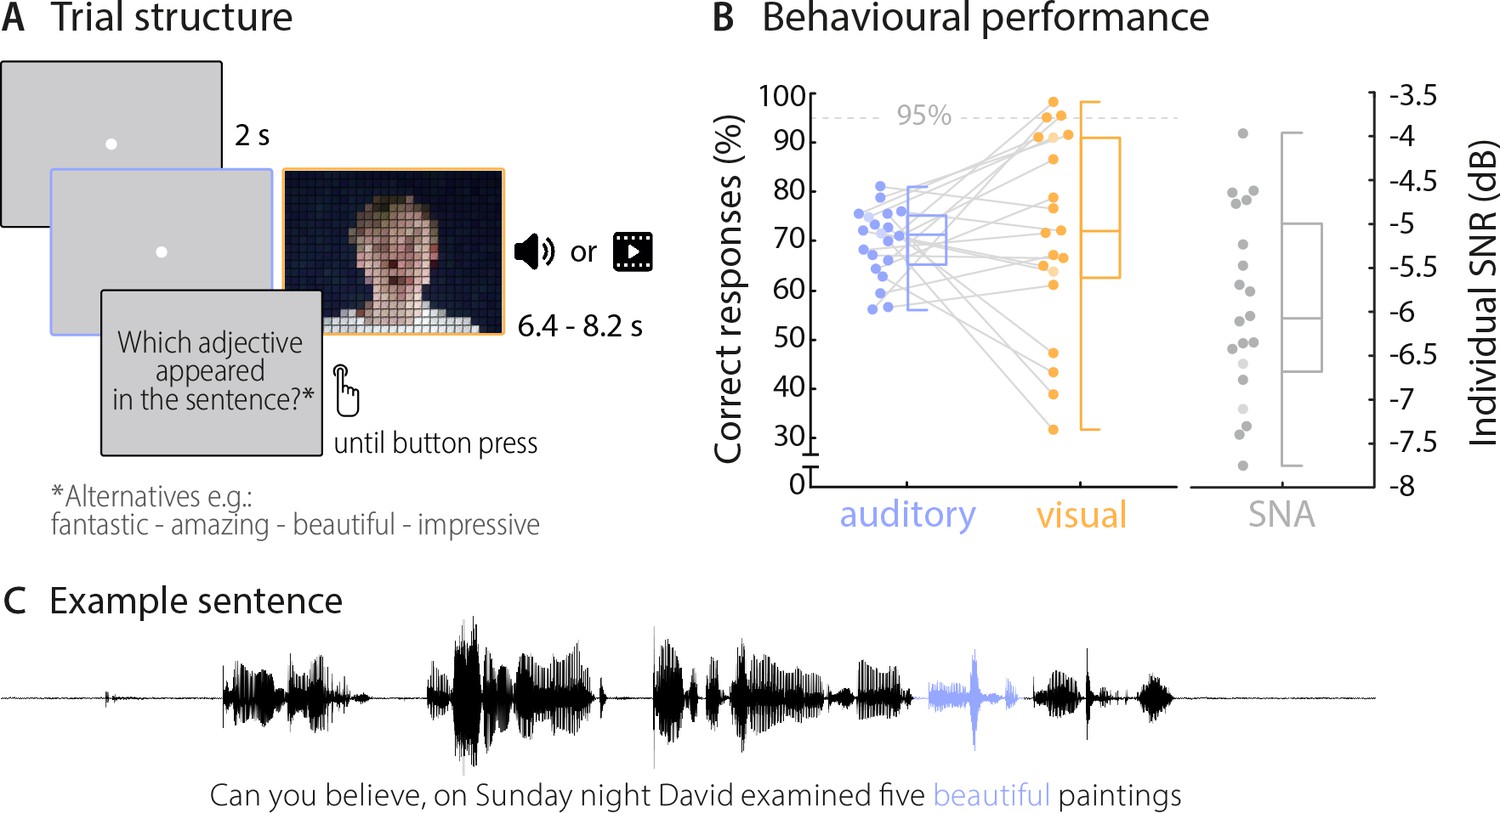
Trial structure and behavioural performance.
(A) Trial structure was identical in the auditory and visual conditions. Participants listened to stereotypical sentences while a fixation dot was presented (auditory condition) or watched videos of a speaker saying sentences (visual condition). The face of the speaker is obscured for visualisation here only. After each trial, a prompt on the screen asked which adjective (or number) appeared in the sentence and participants chose one of four alternatives by pressing a corresponding button. Target words (here ‘beautiful’) occupied the 2nd or 3rd last position in the sentence. (B) Participants’ behavioural performance in auditory (blue) and visual (orange) conditions, and their individual SNR values (grey) used for the auditory condition. Dots represent individual participants (n = 20), boxes denote median and interquartile ranges, whiskers denote minima and maxima (no outliers present). MEG data of two participants (shaded in a lighter colour) were not included in neural analyses due to excessive artefacts. Participants exceeding a performance of 95% correct (grey line) were excluded from the neuro-behavioural analysis (which was the case for three participants in the visual condition). (C) Example sentence with target adjective marked in blue.
Figure 1—figure supplement 1
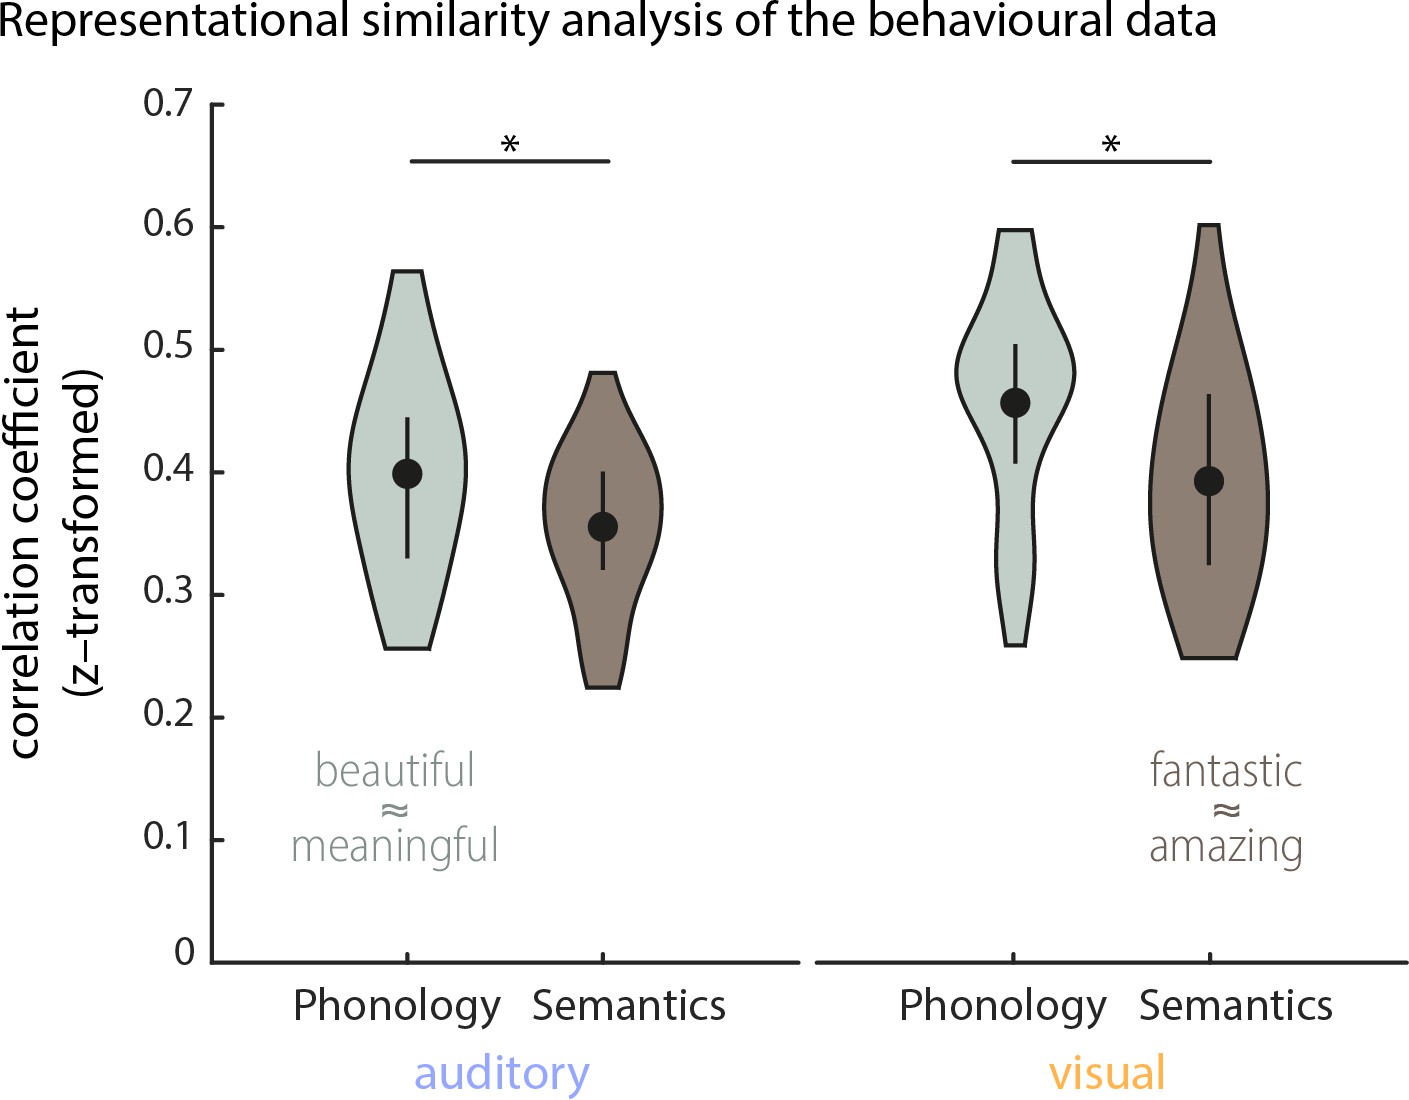
Explorative representational similarity analysis (RSA) of the behavioural data (n = 20).
Density plots show the distribution of within-participant correlations between behavioural representational dissimilarity matrices (RDMs) and RDMs obtained from phonological and semantic representations of the 18 target words (medians, interquartile ranges and densities). Behavioural RDMs were obtained by computing the confusion matrix from participants’ behavioural responses. Pairwise phonological distances for the stimulus material were computed using Phonological Corpus Tools (V1.4.0), and semantic distances were computed using fastText vector representations (see Materials and methods for details). Representational similarity was computed using Spearman rank correlations. Overall, phonological and semantic features both influenced participants’ responses. A repeated-measurements ANOVA (2 (conditions) x 2 (features)) yielded a main effect of condition (F(1,19) = 7.53, p=0.013; mean correlations: Mauditory = 0.38, SEM = 0.01; Mvisual = 0.43, SEM = 0.02) and a main effect of features (F(1,19) = 20.98, p = <0.001, Mphon = 0.43, SEM = 0.01; Msem = 0.37, SEM = 0.01). A post-hoc comparison revealed that in both conditions phonological features influenced behaviour stronger than semantic features (Wilcoxon Signed-ranks test; Zauditory = 151, p=0.037, Zvisual = 189, p=0.002). Examples for close phonological and semantic relationships between two words are given in image.
Figure 1—figure supplement 2
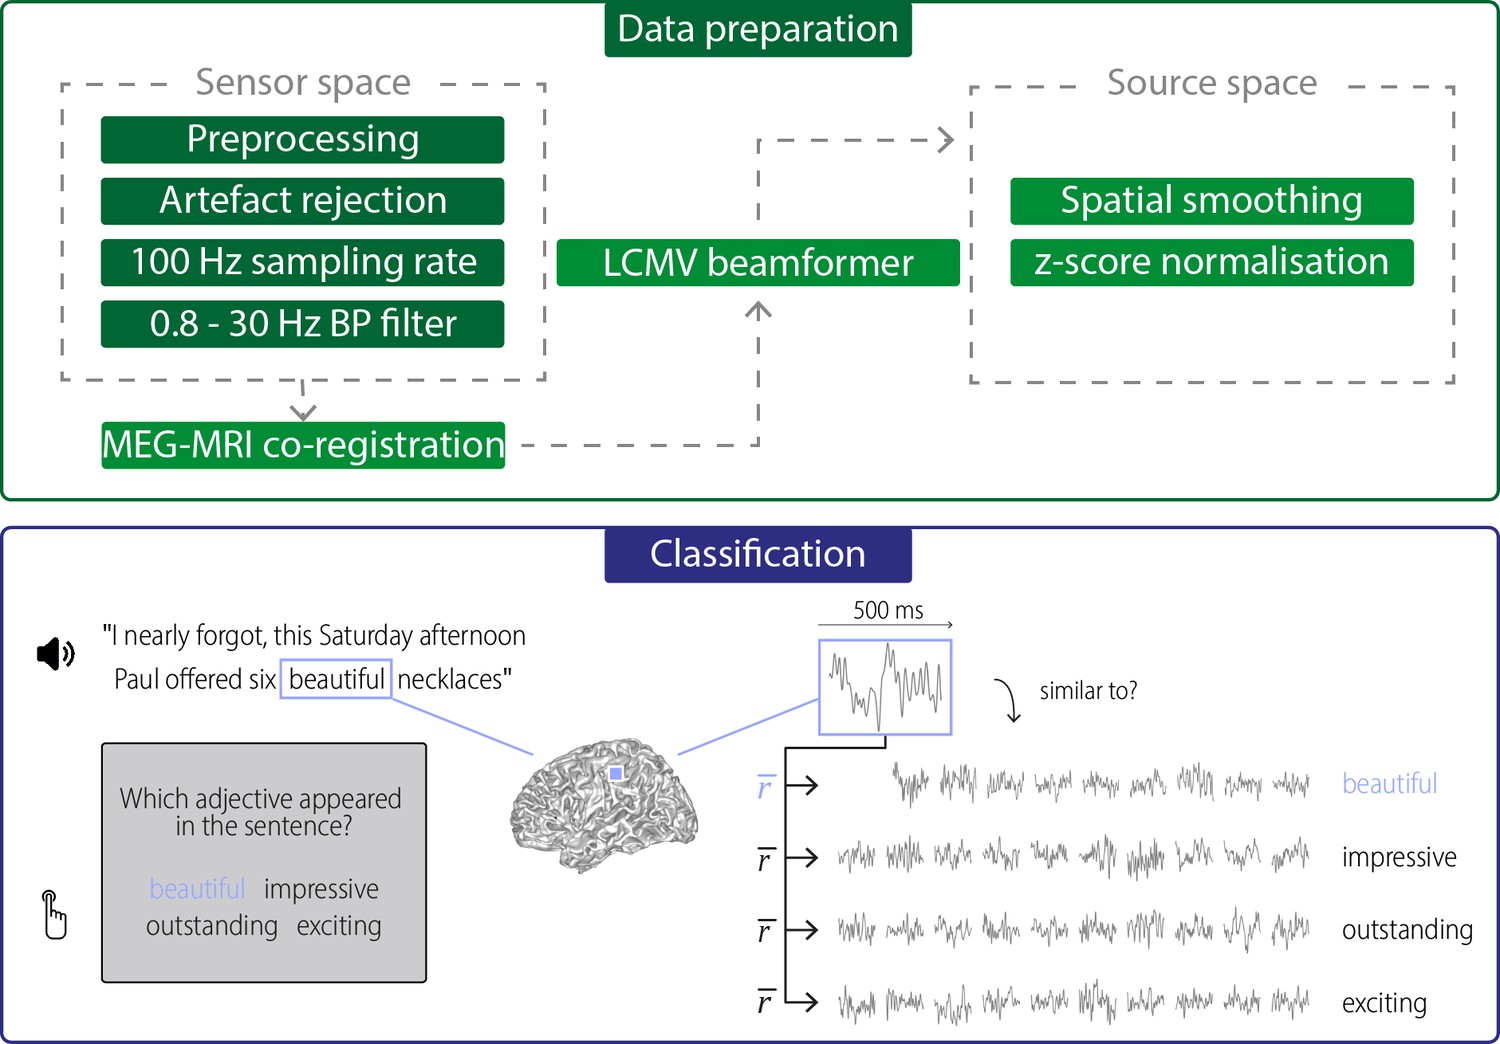
Data preparation and classification procedures.
Data preparation: Raw data were first de-noised and SQUID jumps were removed (preprocessing). Eye and heart artefacts and noisy channels were removed via visual inspection and ICA. Clean data were then down-sampled to 100 Hz and bandpass-filtered for further analysis. Data were projected into source space using an LCMV beamformer after a semi-automatic co-registration of MEG and individual anatomical MRIs. In source space, data were spatially smoothed (FWHM = 3 mm) and the time series for each grid point and trial was z-scored. Classification: Neural activity during hearing/seeing the target words was extracted for each grid point, using a 500-ms windows aligned to the onset of the target word. For each trial, this activity (during hearing “beautiful” in the above example) was compared with activity to the same target word in other trials (within-target distances), and with the activity to the three alternative words in other trials (between-target distances). Distances were quantified using Pearson correlations of the spatio-temporal searchlight activity and were averaged across repetitions of a word (). The target word was then classified as that word for which the average correlation was strongest.
Figure 2 with 3 supplements
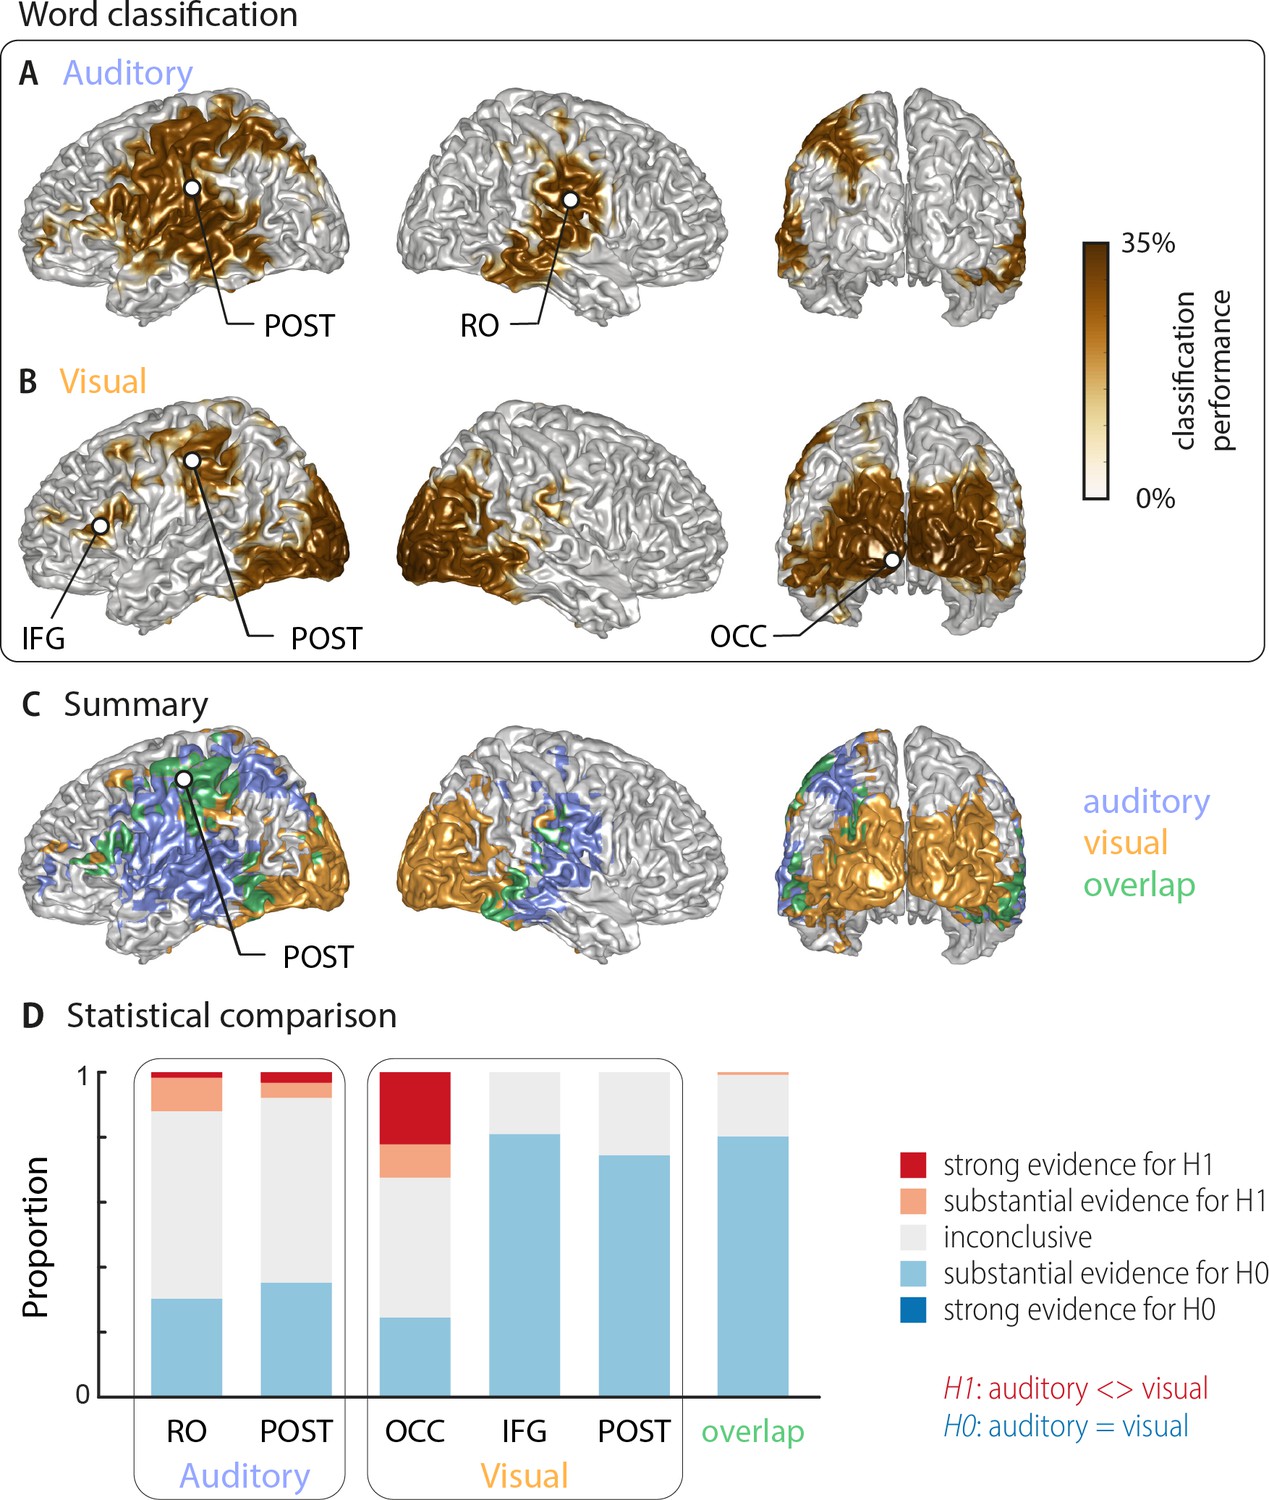
Word classification based on MEG activity regardless of behavioural performance (‘stimulus classification’).
Surface projections show areas with significant classification performance at the group level (n = 18; cluster-based permutation statistics, corrected at p<0.001 FWE). Results show strongest classification in temporal regions for the auditory condition (A) and occipital areas for the visual condition (B). Cluster peaks are marked with dots. Panel (C) overlays the significant effects from both conditions, with the overlap shown in green. The overlap contains bilateral regions in middle and inferior temporal gyrus, the inferior frontal cortex and dorsal regions of the postcentral and supramarginal gyrus (SMG). The peak of the overlap is in the postcentral gyrus. (D) Grid point-wise Bayes factors for a difference between auditory and visual word classification performance for all grid points in the ROIs characterised by a significant contribution to word classification in at least one modality in panel A or B (red: evidence for a difference between conditions, that is in favour of H1 [alternative hypothesis]; blue: evidence for no difference between conditions, that is in favour of H0 [null hypothesis]. RO – Rolandic Operculum; POST – postcentral gyrus; IFG – inferior frontal gyrus; OCC – occipital gyrus).
Figure 2—figure supplement 1
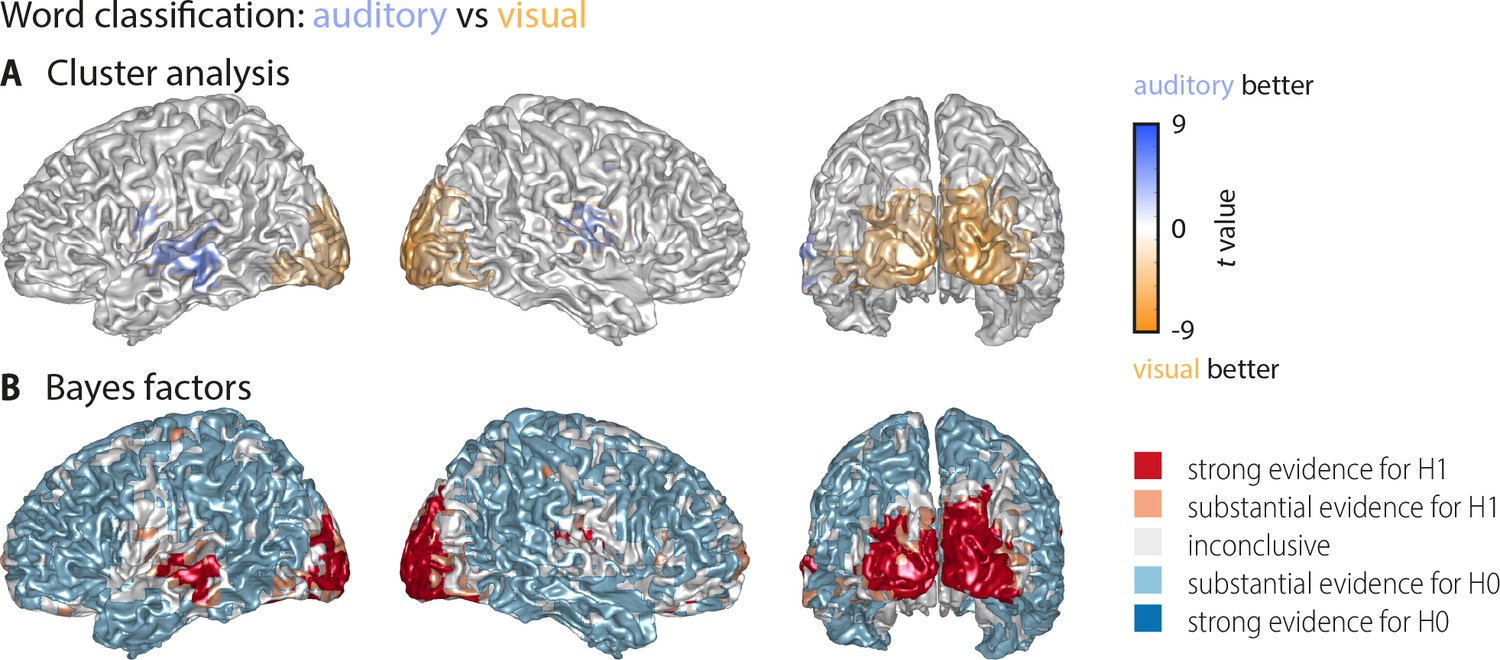
Whole-brain statistical maps for the comparison between auditory and visual word classification (Figure 2).
(A) Results of a cluster-based permutation analysis (n = 18; 3000 within-subject permutations, corrected at p<0.05 FWE). Shown are only those grid points that exhibit significant word classification in at least one condition. Auditory classification was significantly stronger in frontotemporal cortex (left: Tsum = 348.47, p<0.001; right: Tsum = 269.62, p<0.001). Visual classification was significantly stronger in a large bilateral occipital cluster (Tsum = −1755.58, p<0.001). Not shown are two clusters in which visual classification was stronger than auditory classification but which themselves did not exhibit significant classification versus baseline (a right frontopolar region: Tsum = −156.86, p<0.001; a left precentral region: Tsum = −31.50, p=0.002). (B) Results of a Bayes factor analysis derived from a comparison of the auditory and visual word classification (n = 18; red: evidence for significant modality difference, that is in favour of H1 [alternative hypothesis]; blue: evidence for no modality difference, that is in favour of H0 [null hypothesis]). The resulting Bayes factors show that for many grid points there was either substantial evidence for no difference between conditions, or inconclusive evidence. There was substantial or strong evidence for a modality difference in auditory and visual cortices and some frontal grid points.
Figure 2—figure supplement 2

Results of the audiovisual condition.
(A) Behavioural performance of all 20 participants. Scaling of the figure is identical to Figure 2. Dots represent individual participants, boxes denote median and interquartile ranges, whiskers denote minimum and maximum (no outliers present). MEG data of two participants (shaded in a lighter colour) were not included in neural analyses due to excessive artifacts. (B) Word classification regardless of behavioural performance (‘stimulus classification’, n = 18). Surface projections show areas with significant classification performance at the group level (surface projection of the cluster-based permutation statistics, corrected at p<0.001 FWE). Strongest classification performance was observed in right auditory and bilateral visual sensory areas, with performance ranging from 25.63% to 33.43% (with a chance level of 25%). Statistical analysis yielded two clusters: a large bilateral cluster covering occipital and temporal regions that peaked in the right inferior occipital gyrus (right OCC; Tsum = 461.36, p<0.001) and a left-hemispheric cluster that peaked in the middle temporal pole (left TP; Tsum = 12.62, p<0.001). Cluster peaks are marked with dots TP – temporal pole; OCC – occipital gyrus.
Figure 2—figure supplement 3
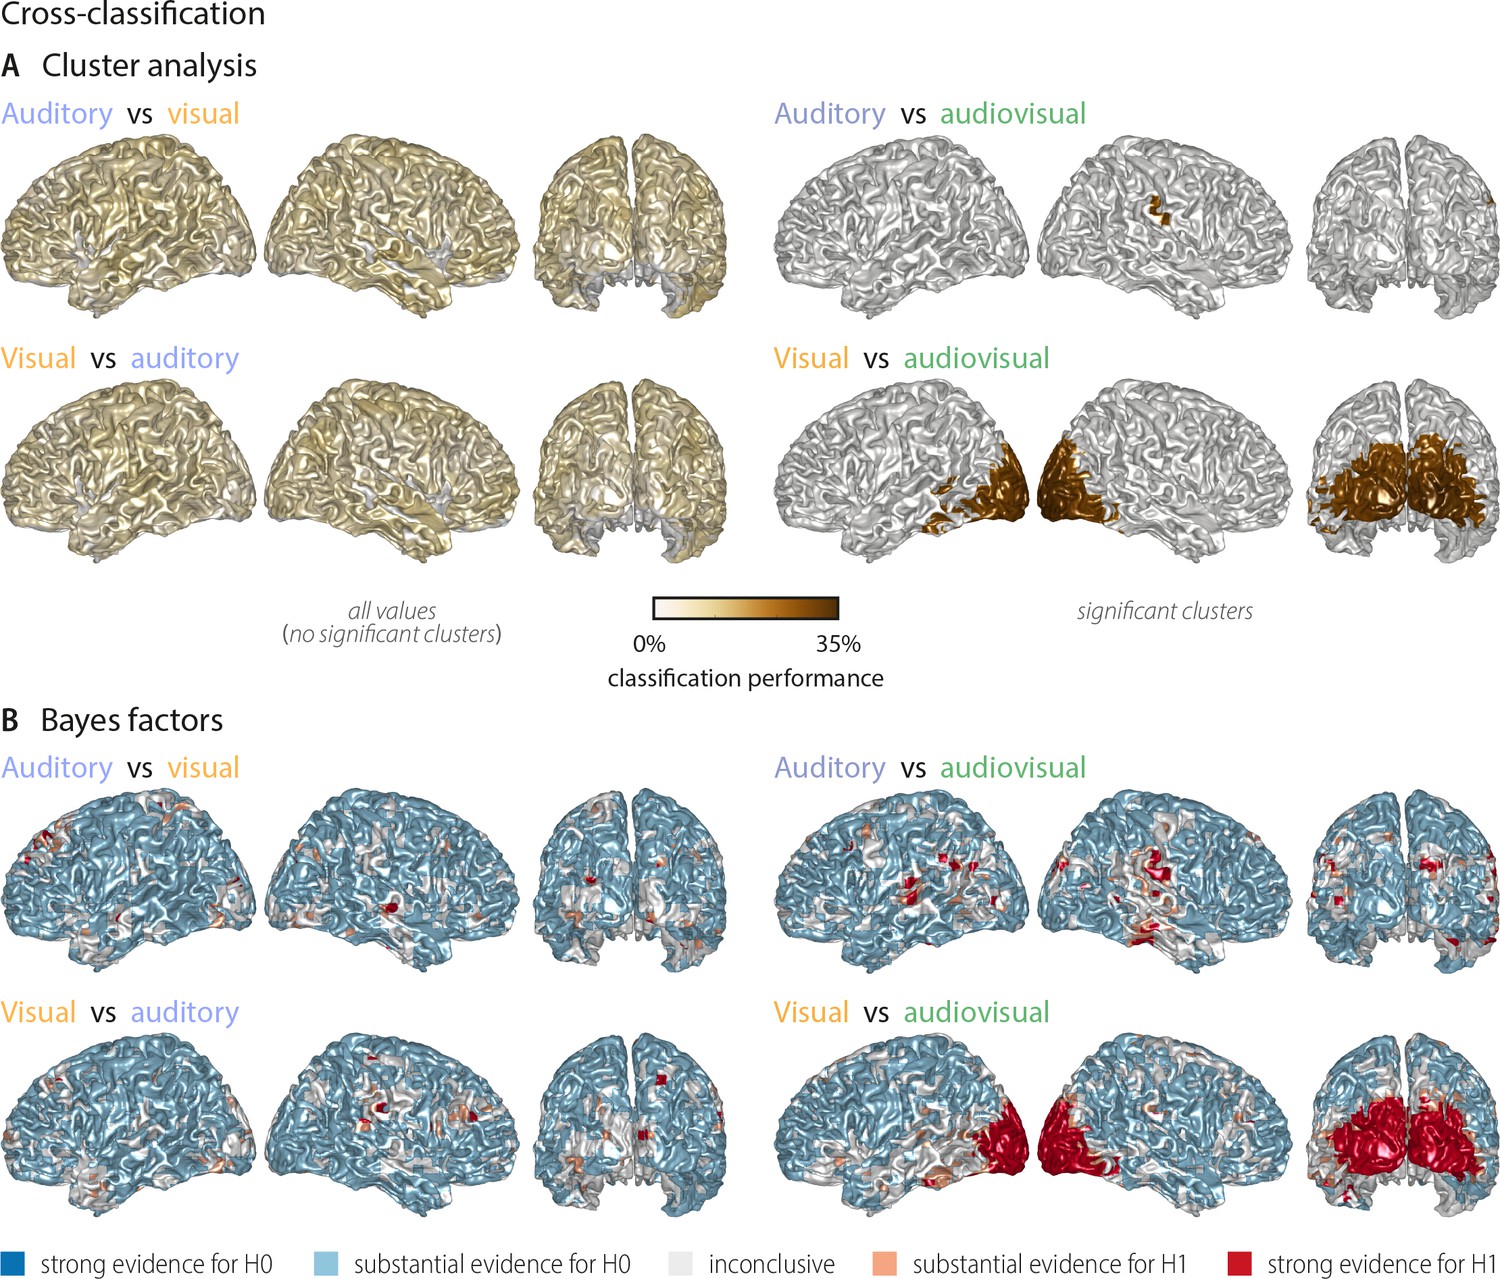
Cross-classification between auditory, visual conditions and audiovisual conditions (n = 18).
(A) Results of a group-level t-test based on cluster-based permutation. Left panel: No significant cross-classification performance between the auditory and visual conditions was found (n = 18; neither at p<0.001, nor at a more lenient p<0.05), supporting the notion that auditory and visual word identities are largely represented in different networks. Right panel: Areas where word identity in the auditory (upper panel) or visual (lower panel) conditions can be predicted significantly based on word representations obtained from the audiovisual condition. Auditory word identities can be significantly classified from audiovisual word representations in a small region in right temporal and supramarginal gyrus (Tsum = 2.61, p<0.001). Visual word identities can be classified from audiovisual word presentations in a large cluster in bilateral occipital cortex (Tsum = 224.62, p<0.001) and a small left-hemispheric cluster in the left inferior temporal gyrus (Tsum = 7.05, p<0.001). Colour scale is adapted from Figure 2, to allow a comparison of results. (B) Results of a Bayes factor analysis derived from a comparison of the actual cross-classification performance to a distribution of performance values after data randomisation (red: evidence for significant cross-decoding, that is in favour of H1 [alternative hypothesis]; blue: evidence for no significant cross-decoding, that is in favour of H0 [null hypothesis]). The resulting Bayes factors show that for most grid points there was substantial evidence for no cross-classification between the auditory and visual conditions, while there was substantial or strong evidence for cross-classification between the auditory (visual) and the audiovisual condition.
Figure 3 with 2 supplements
Cortical areas in which neural word representations predict participants’ response.
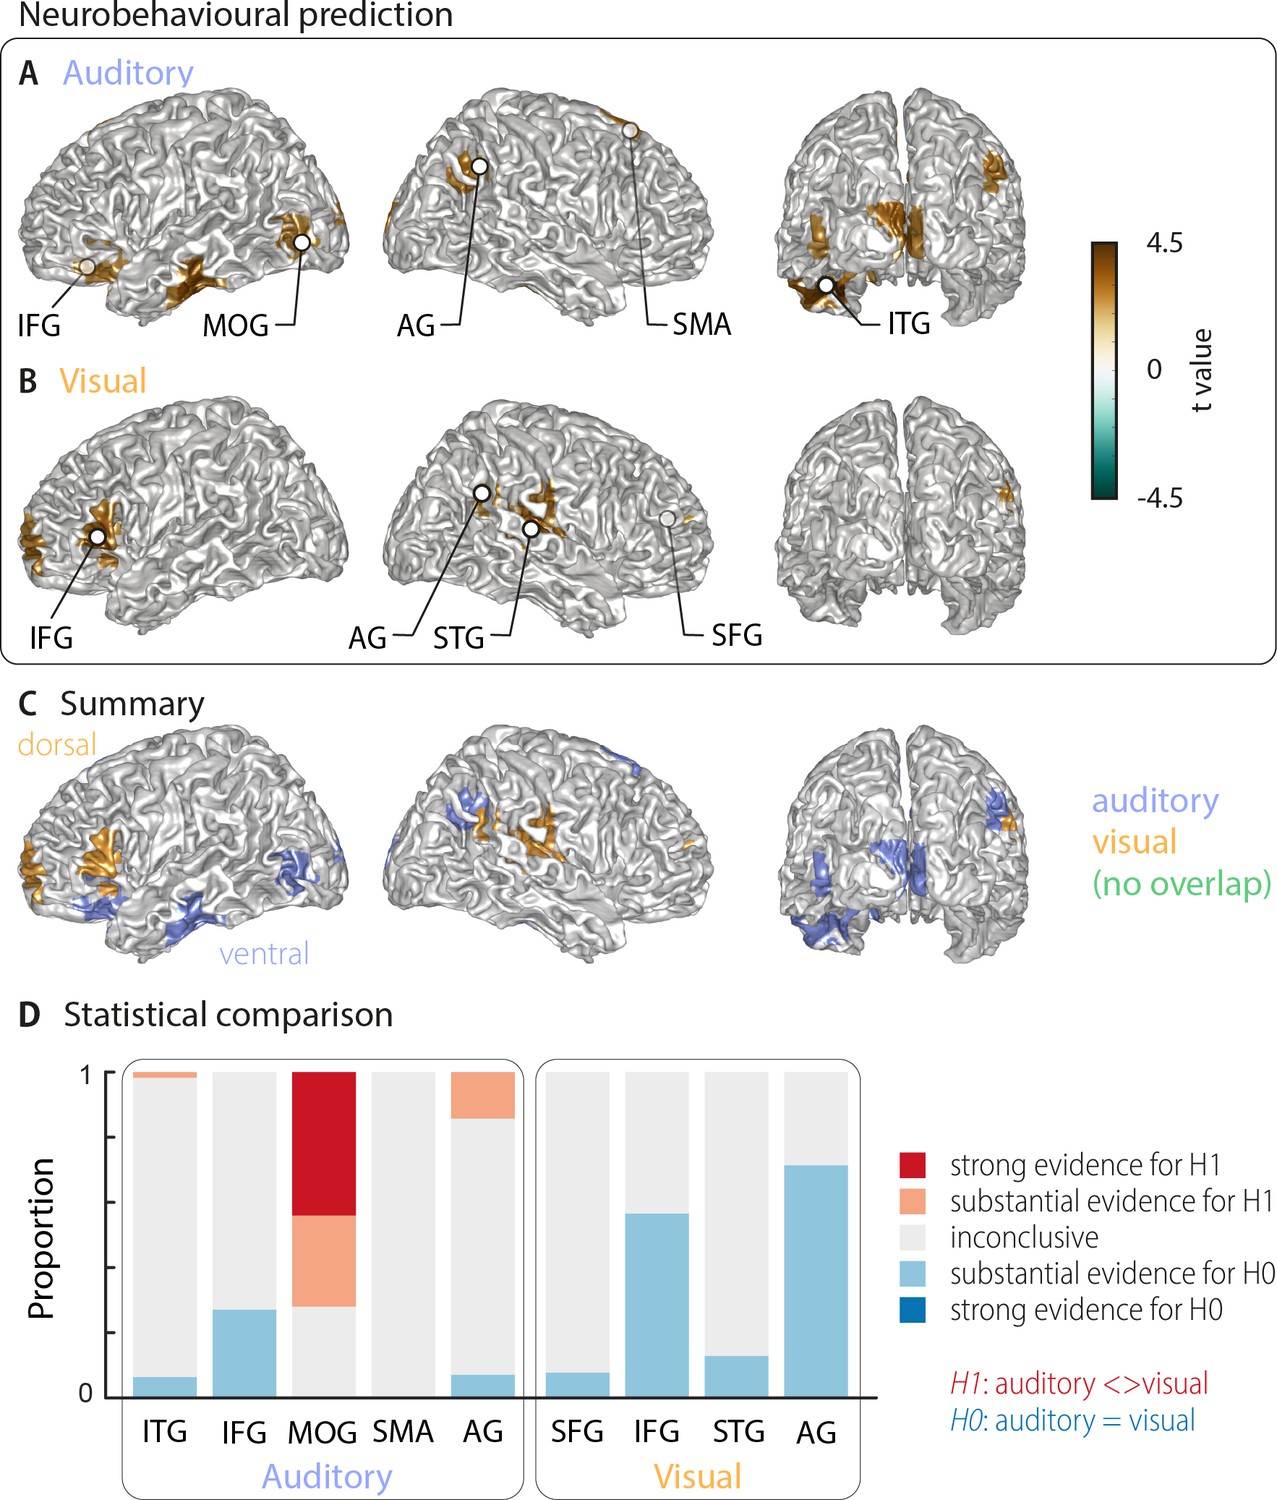
Coloured areas denote significant group-level effects (surface projection of the cluster-based permutation statistics, corrected at p<0.05 FWE). (A) In the auditory condition (n = 18), we found five clusters (cluster peaks are marked with dots). Three were in left ventral regions, in the inferior frontal gyrus, the inferior temporal gyrus, and the occipital gyrus, the other two were in the right hemisphere, in the angular gyrus and the supplementary motor area. (B) In the visual condition (n = 15; three participants were excluded due to near ceiling performance), we found four clusters: In the left (dorsal) inferior frontal gyrus, the right anterior cingulum stretching to left dorsal frontal regions, in the right angular gyrus and the right superior temporal gyrus (all peaks are marked with dots). Panel (C) overlays the significant effects from both conditions. There was no overlap. However, both auditory and visual effects were found in adjacent regions within the left IFG and the right AG. Panel (D) shows distributions of grid point-wise Bayes factors for a difference between auditory and visual conditions for these clusters (red: evidence for differences between conditions, that is in favour of H1 [alternative hypothesis]; blue: evidence for no difference between conditions, that is in favour of H0 [null hypothesis]).
Figure 3—figure supplement 1
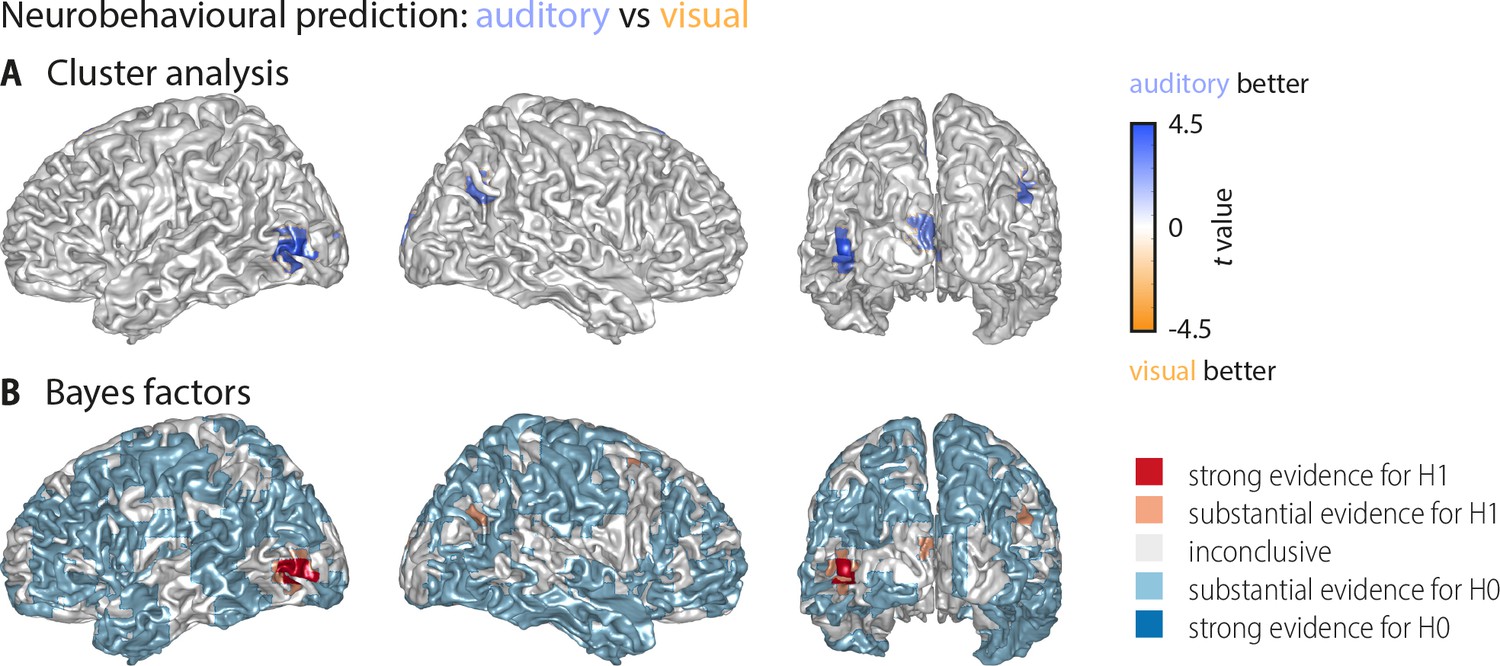
Whole-brain statistical maps for the comparison between auditory and visual neurobehavioural prediction (Figure 3).
(A) Results of a cluster-based permutation analysis (n = 18; 3000 within-subject permutations, corrected at p<0.05 FWE). Shown are only those grid points that exhibit significant word classification in at least one condition. Behavioural prediction was statistically stronger in the auditory condition in left middle occipital gyrus (Tsum = 114.57, p<0.001), left calcarine gyrus (Tsum = 47.45, p<0.001), right posterior angular gyrus (Tsum = 31.02, p=0.006), and bilateral supplementary motor area (Tsum = 75.98, p<0.001, not visible due to medial location). Not shown is a cluster in which prediction in the visual condition was stronger than in the auditory condition but that did not show significant prediction versus baseline (a right middle frontal cluster: Tsum = −35.78, p=0.001). (B) Results of a Bayes factor analysis derived from a comparison of the auditory and visual neurobehavioural prediction (n = 15; red: evidence for significant modality difference, that is in favour of H1 [alternative hypothesis]; blue: evidence for no modality difference, that is in favour of H0 [null hypothesis]). The resulting Bayes factors show that for most grid points there was either substantial evidence for no difference between the auditory and visual conditions, or inconclusive evidence. There was substantial or strong evidence for a modality difference in left middle occipital and calcarine gyrus, as well as in right angular gyrus.
Figure 3—figure supplement 2
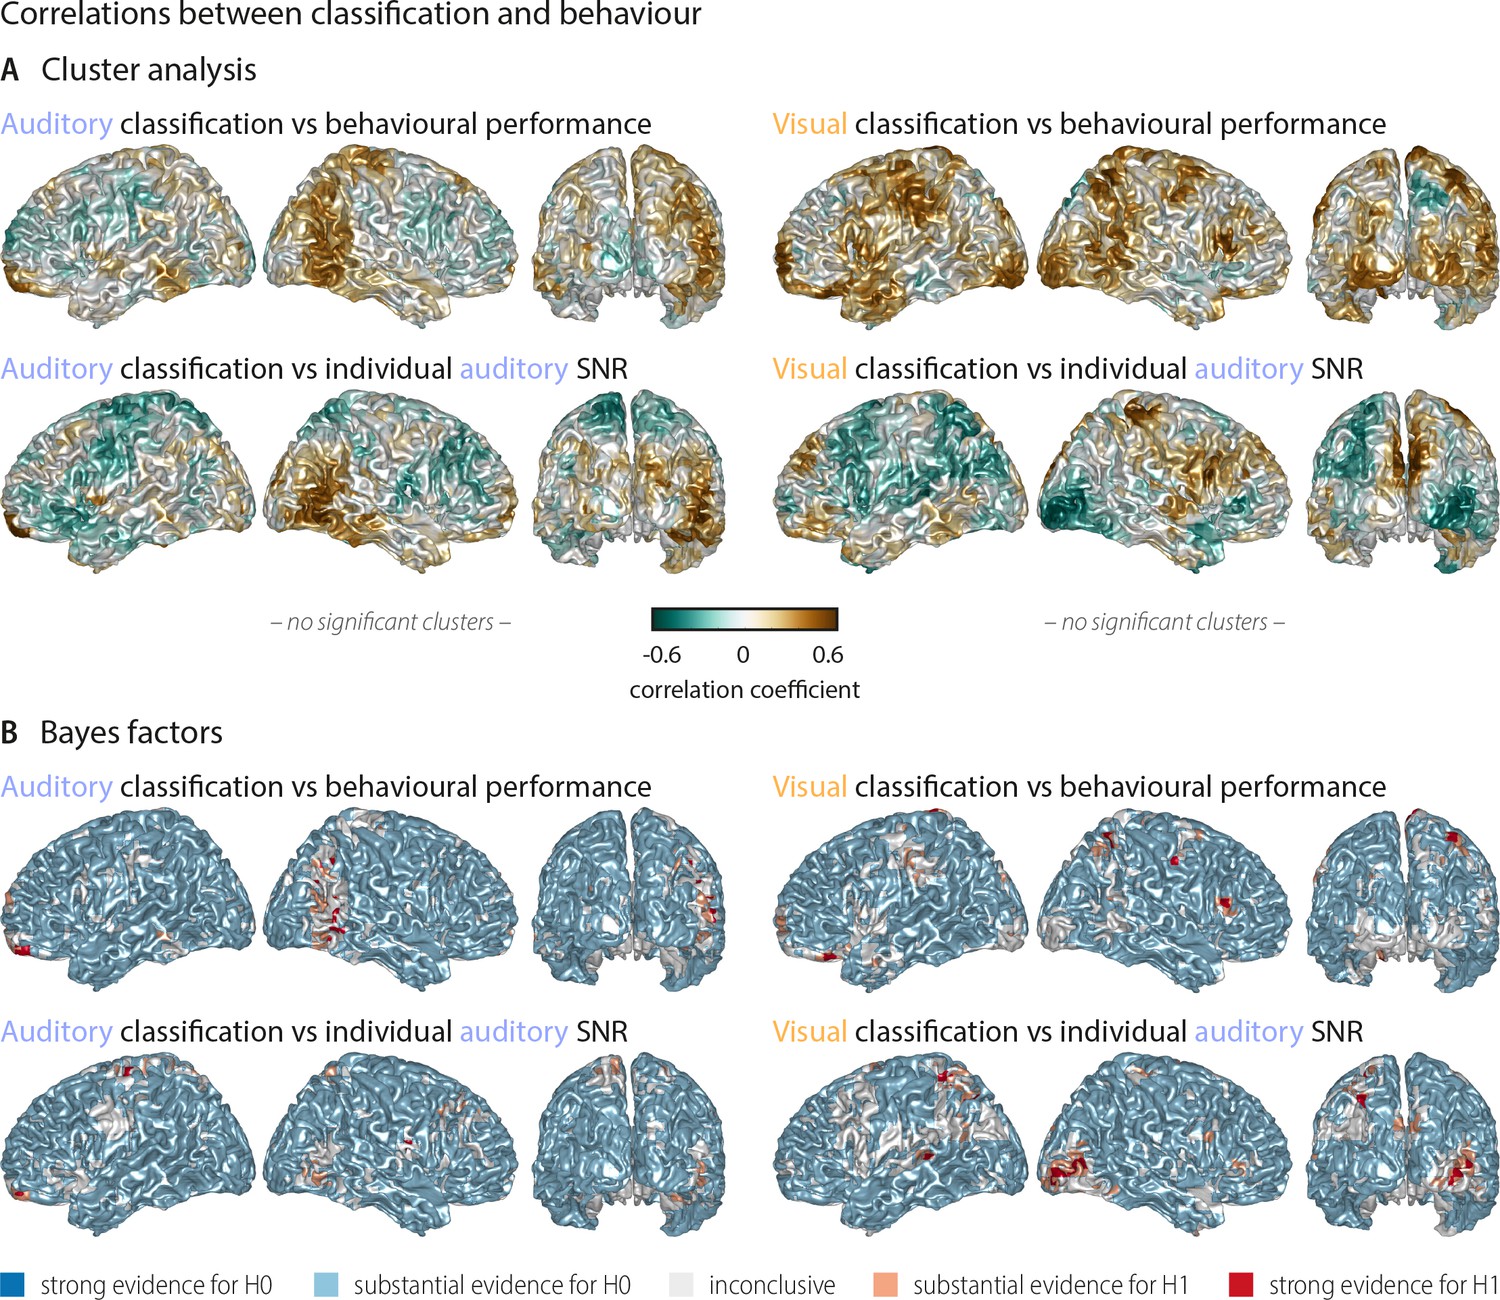
Correlations between word classification and behavioural indices.
(A) Surface projection of rho-values from correlations between neural classification and behaviour. No significant clusters were found at an alpha-level of 0.05, supporting that stimulus classification performance alone does not predict behaviour. Upper panel: Correlation between auditory (visual) word classification and participants’ performance in the auditory (visual) conditions. Lower panel: Correlation between auditory (visual) word classification and participant-specific SNR values used for the auditory condition. (B) Results of a Bayes factor analysis for correlation coefficients (red: evidence for significant correlation, that is in favour of H1 [alternative hypothesis]; blue: evidence for no significant correlation, that is in favour of H0 [null hypothesis]). For the large majority of brain regions, there is substantial evidence for no correlation. Exceptions are scattered grid points, most notably in right occipital regions for a (negative) correlation between visual word classification and individual auditory SNR values across participants.
Figure 4
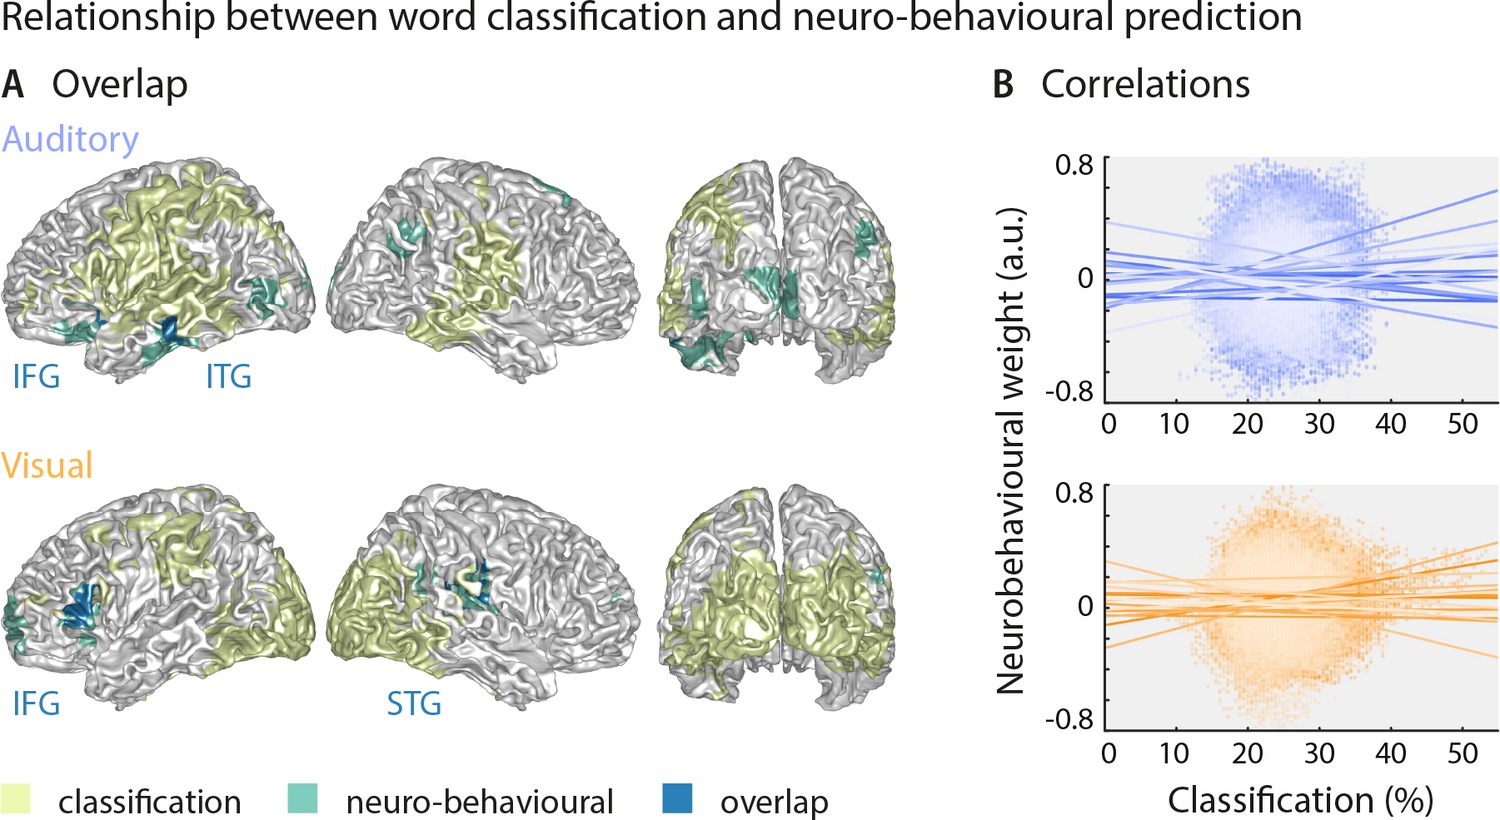
Largely distinct regions provide strong stimulus classification and mediate behavioural relevance.
(A) Areas with significant stimulus classification (from Figure 2) are shown in yellow, those with significant neuro-behavioural results (from Figure 3) in green, and the overlap in blue. The overlap in the auditory condition (N = 14 grid points) comprised parts of the left inferior and middle temporal gyrus (ITG), and the orbital part of the left inferior frontal gyrus (IFG). The overlap in the visual condition (N = 27 grid points) comprised the triangular part of the inferior frontal gyrus (IFG), and parts of the superior temporal gyrus (STG), extending dorsally to the Rolandic operculum. (B) Results of a regression between word classification performance and neurobehavioural weights. Individual participant’s slopes and all individual data points are shown. A group-level t-test on betas yielded no consistent relationship (both ts <0.50, both ps = 81). Corresponding Bayes factors (both bf10s < 1/3) provide substantial evidence for no consistent relationship.
Author response image 1
Author response image 2
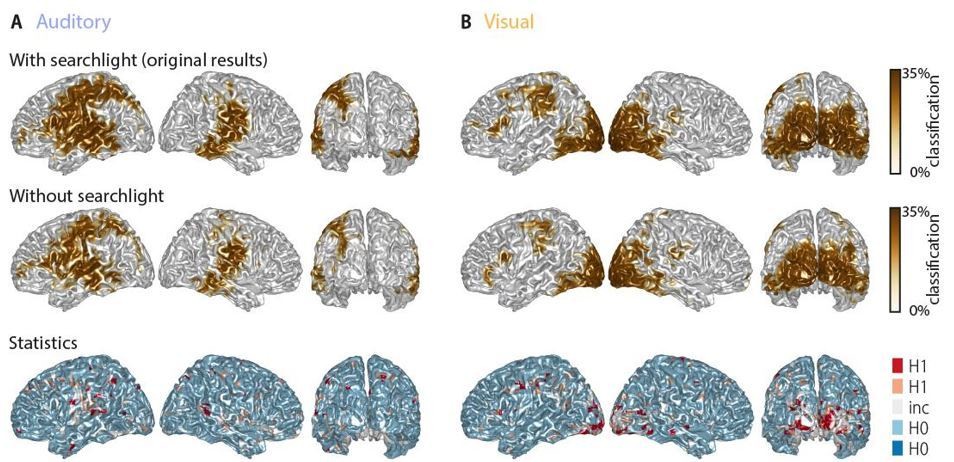
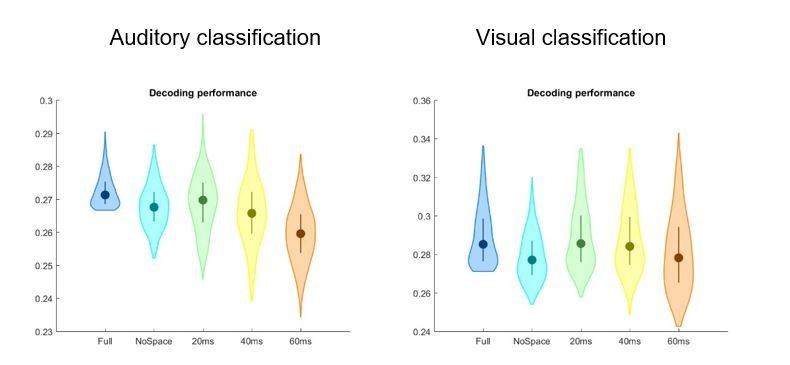
Word classification performance with and without a spatial searchlight.
Top panel: original results including a 1.2-cm searchlight (as in Figure 2 in the manuscript). Middle panel: classification results without searchlight. Bottom panel: Bayes factors of a group-level t-test comparing classification performance with and without searchlight. The majority of grid points (66.9% in the auditory and 63.9% in the visual condition) showed evidence for no difference (i.e. BF10 < 1/3) between tests, while only a small fraction of grid points show evidence for a strong or substantial difference between test. There is no systematic improvement when including the searchlight.
Author response image 3
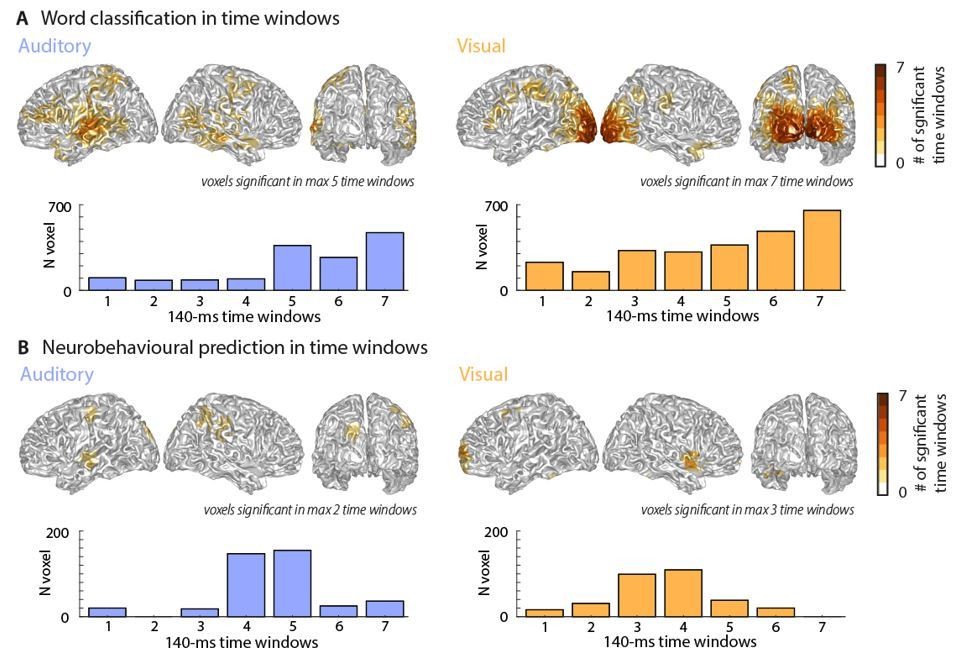
Classification performance and neurobehavioural prediction over time.
Top panels represent cumulative whole-brain histograms of the significant grid points across all 7 epochs and bottom panels represent the epoch-specific number of grid points that are significant in each epoch. Please note that these results are very conservative due to the Bonferroni-corrected threshold of ɑ = 0.0071. The maps resemble those of the full-window analysis presented in the manuscript.
Tables
Table 1
Peak effects of stimulus classification performance based on MEG activity.
Labels are taken from the AAL atlas (Tzourio-Mazoyer et al., 2002). For each peak, MNI coordinates, and classification performance (mean and SEM) are presented. Chance level for classification was 25%. Abbreviations as used in Figure 2 are given in parentheses.
| Atlas label | MNI coordinates | Classification % (SEM) | ||
|---|---|---|---|---|
| X | Y | Z | ||
| Auditory peaks | ||||
| Rolandic Oper R (RO) | 41 | –14 | 20 | 28.89 (0.78) |
| Postcentral L (POST) | −48 | –21 | 25 | 29.04 (1.00) |
| Visual peaks | ||||
| Calcarine L (OCC) | −5 | –101 | −7 | 33.92 (1.53) |
| Frontal Inf Tri L (IFG) | −48 | 23 | 1 | 26.70 (0.83) |
| Postcentral L (POST) | −51 | –24 | 47 | 26.85 (1.02) |
| Peak of overlap | ||||
| Postcentral L (POST) | −47 | –15 | 52 | 26.50 (0.67) |
Table 2
Peak effects for the neuro-behavioural analysis.
Labels are taken from the AAL atlas (Tzourio-Mazoyer et al., 2002). For each local peak, MNI coordinates, regression beta (mean and SEM across participants) and corresponding t-value are presented. Abbreviations as used in Figure 3 are given in parentheses.
| Atlas label | MNI coordinates | Beta (SEM) | t-value | ||
|---|---|---|---|---|---|
| X | Y | Z | |||
| Auditory | |||||
| Temporal Inf L (ITG) | −41 | – 23 | −26 | 0.106 (0.024) | 4.40 |
| Frontal Inf Orb L (IFG) | −28 | 25 | –9 | 0.082 (0.031) | 2.66 |
| Occipital Mid L, Occipital Inf L (MOG) | −46 | –83 | −4 | 0.079 (0.029) | 2.75 |
| Supp Motor Area R (SMA) | 3 | 11 | 52 | 0.089 (0.027) | 3.33 |
| Angular R (AG) | 49 | –67 | 40 | 0.079 (0.027) | 2.87 |
| Visual | |||||
| Frontal Inf Tri L (IFG) | −57 | 30 | 4 | 0.075 (0.017) | 4.34 |
| Frontal Sup Medial R, Cingulum Ant R (SFG) | 9 | 47 | 15 | 0.080 (0.028) | 2.86 |
| Temporal Sup R (STG) | 38 | –30 | 10 | 0.086 (0.023) | 3.77 |
| Angular R (AG) | 60 | –55 | 34 | 0.073 (0.020) | 3.55 |
Additional files
-
Supplementary file 1
Target words used in this study (9 adjectives and nine numbers, each presented in 10 different sentences).
Note that adjectives were comparable with regard to their positive valence (Scott et al., 2019).
- https://cdn.elifesciences.org/articles/56972/elife-56972-supp1-v2.docx
-
Transparent reporting form
- https://cdn.elifesciences.org/articles/56972/elife-56972-transrepform-v2.docx
Download links
A two-part list of links to download the article, or parts of the article, in various formats.
Downloads (link to download the article as PDF)
Open citations (links to open the citations from this article in various online reference manager services)
Cite this article (links to download the citations from this article in formats compatible with various reference manager tools)
Shared and modality-specific brain regions that mediate auditory and visual word comprehension
eLife 9:e56972.
https://doi.org/10.7554/eLife.56972


