Spatio-temporal associations between deforestation and malaria incidence in Lao PDR
- Malaria Elimination Initiative, The Global Health Group, University of California, San Francisco, United States
- Department of Epidemiology and Biostatistics, University of California, San Francisco, United States
- Department of Biostatistics and Epidemiology, School of Public Health and Health Sciences, University of Massachusetts Amherst, United States
- Division of Epidemiology and Biostatistics, School of Public Health, University of California, Berkeley, United States
- Center for Malariology, Parasitology and Entomology, Ministry of Health, Lao People's Democratic Republic
Figures
Figure 1
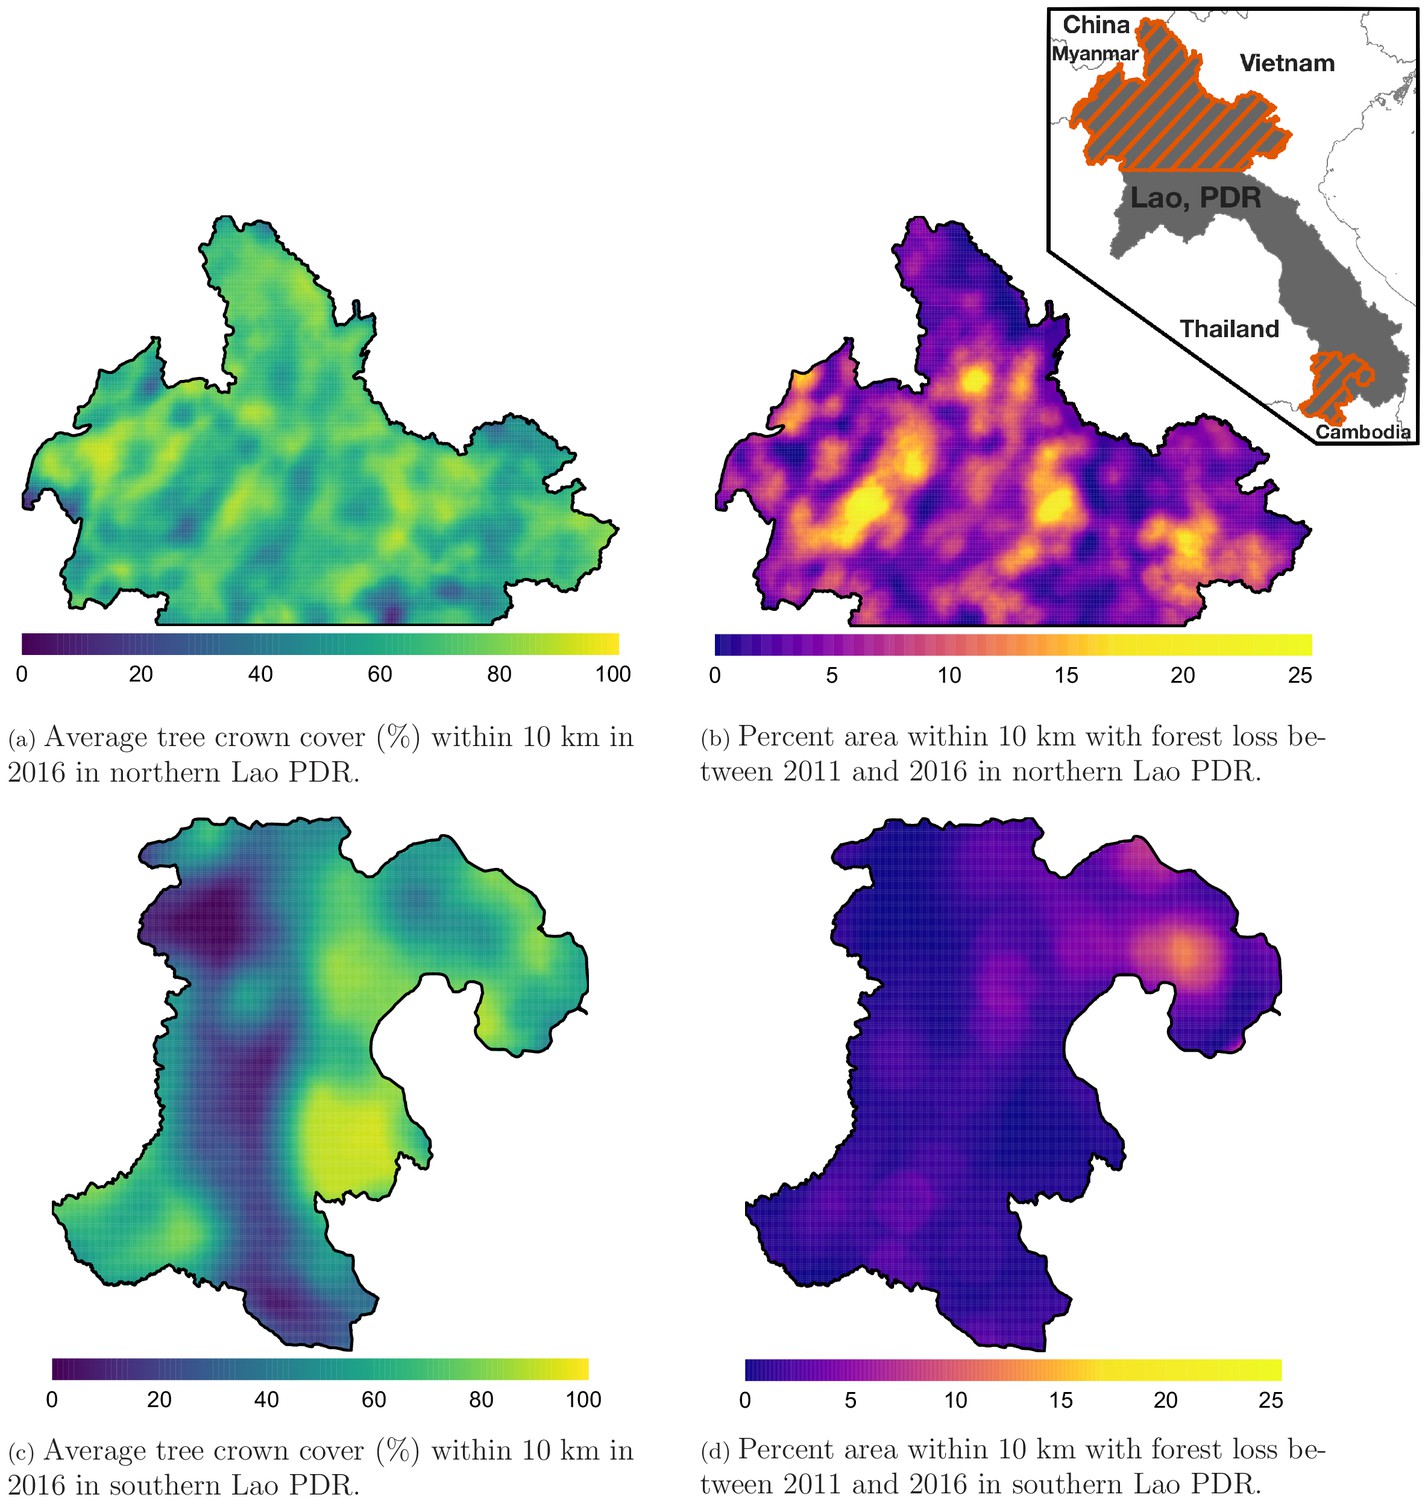
Average tree crown cover (%) in 2016 (left) and percent area that experienced forest loss between 2011 and 2016 (right) within a 10 km radius in northern (top) and southern (bottom) Lao PDR.
See Materials and methods for details on forest and deforestation metrics. Upper right indent maps northern and southern (Champasak province) Lao PDR regions.
Figure 2
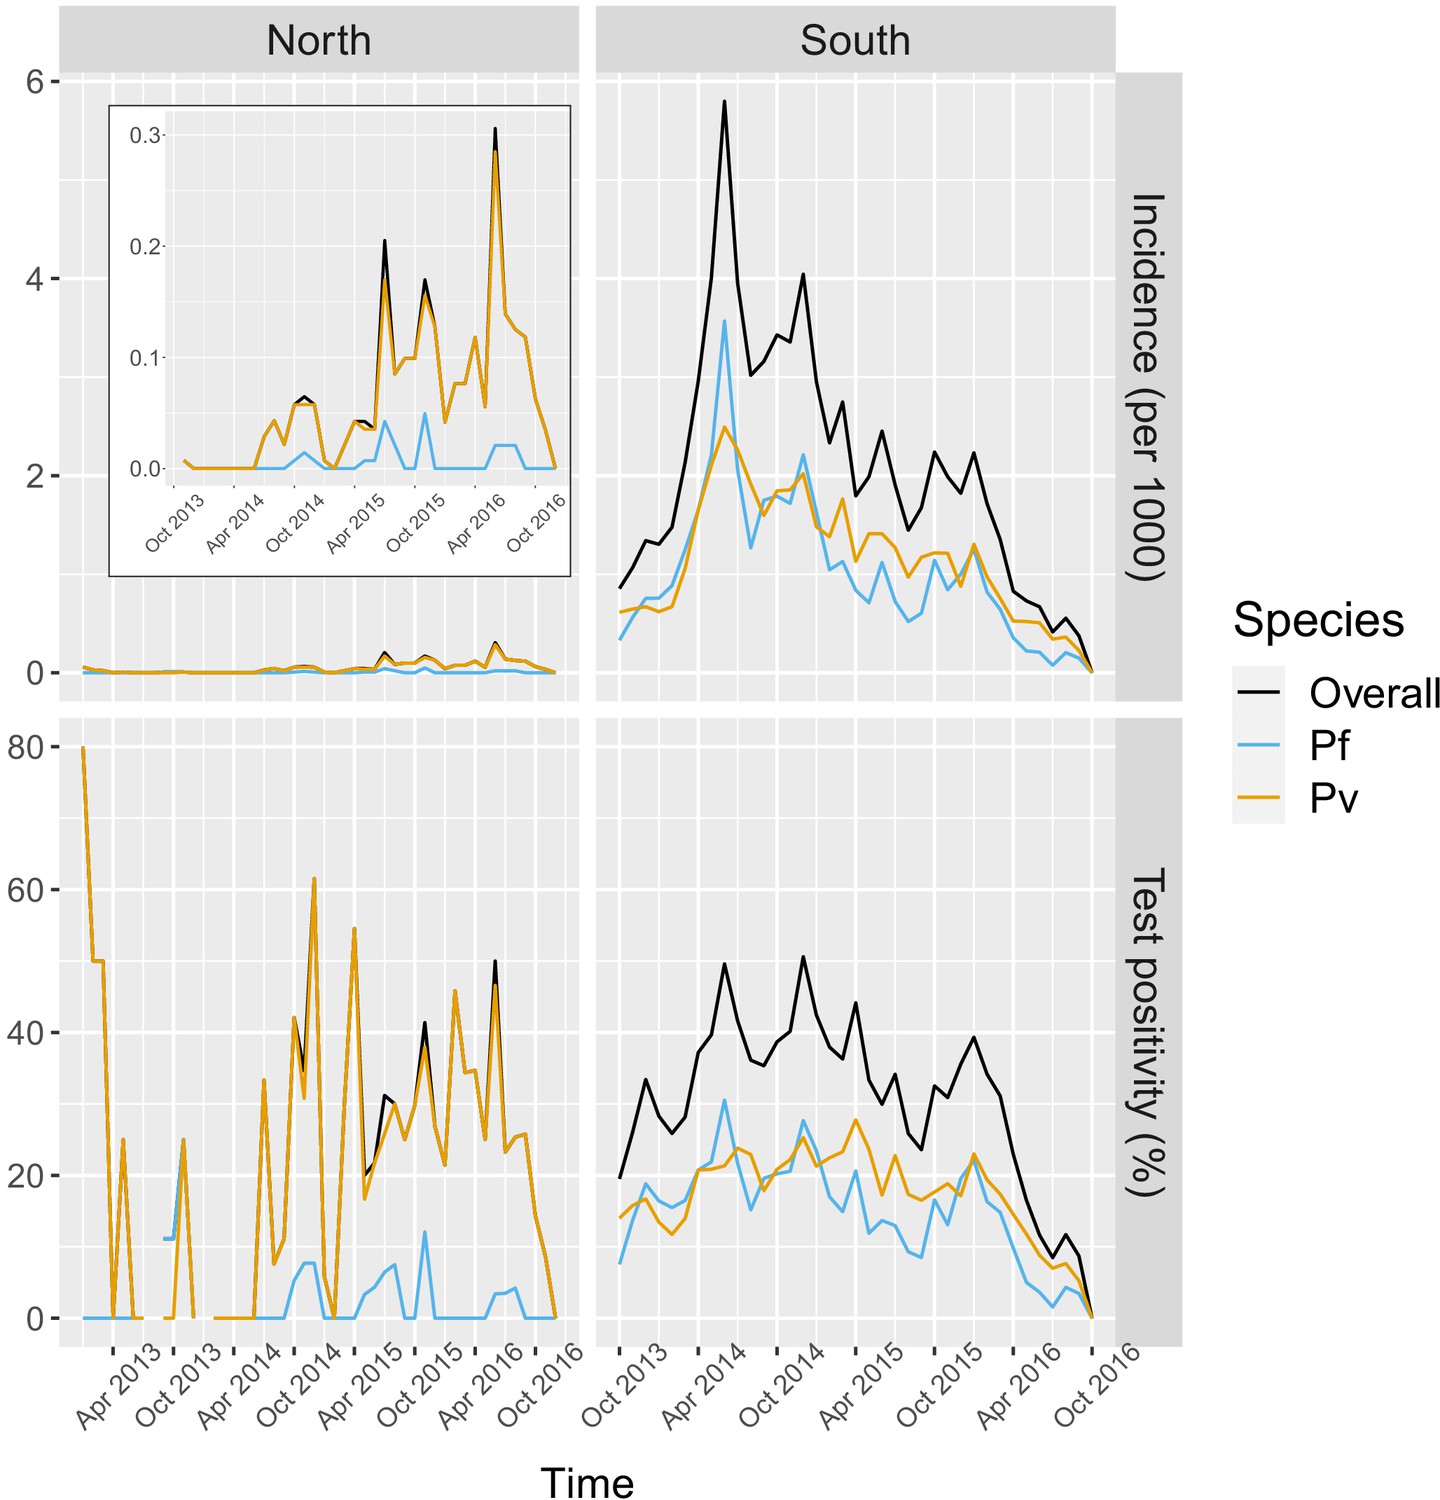
Malaria incidence (per 1000) and test positivity (%) over time.
Upper left boxed indent zooms in malaria incidence in the North to better show the temporal variation (see y axis for scale).
-
Figure 2—source data 1
Data for Figure 2.
- https://cdn.elifesciences.org/articles/56974/elife-56974-fig2-data1-v2.zip
Figure 3
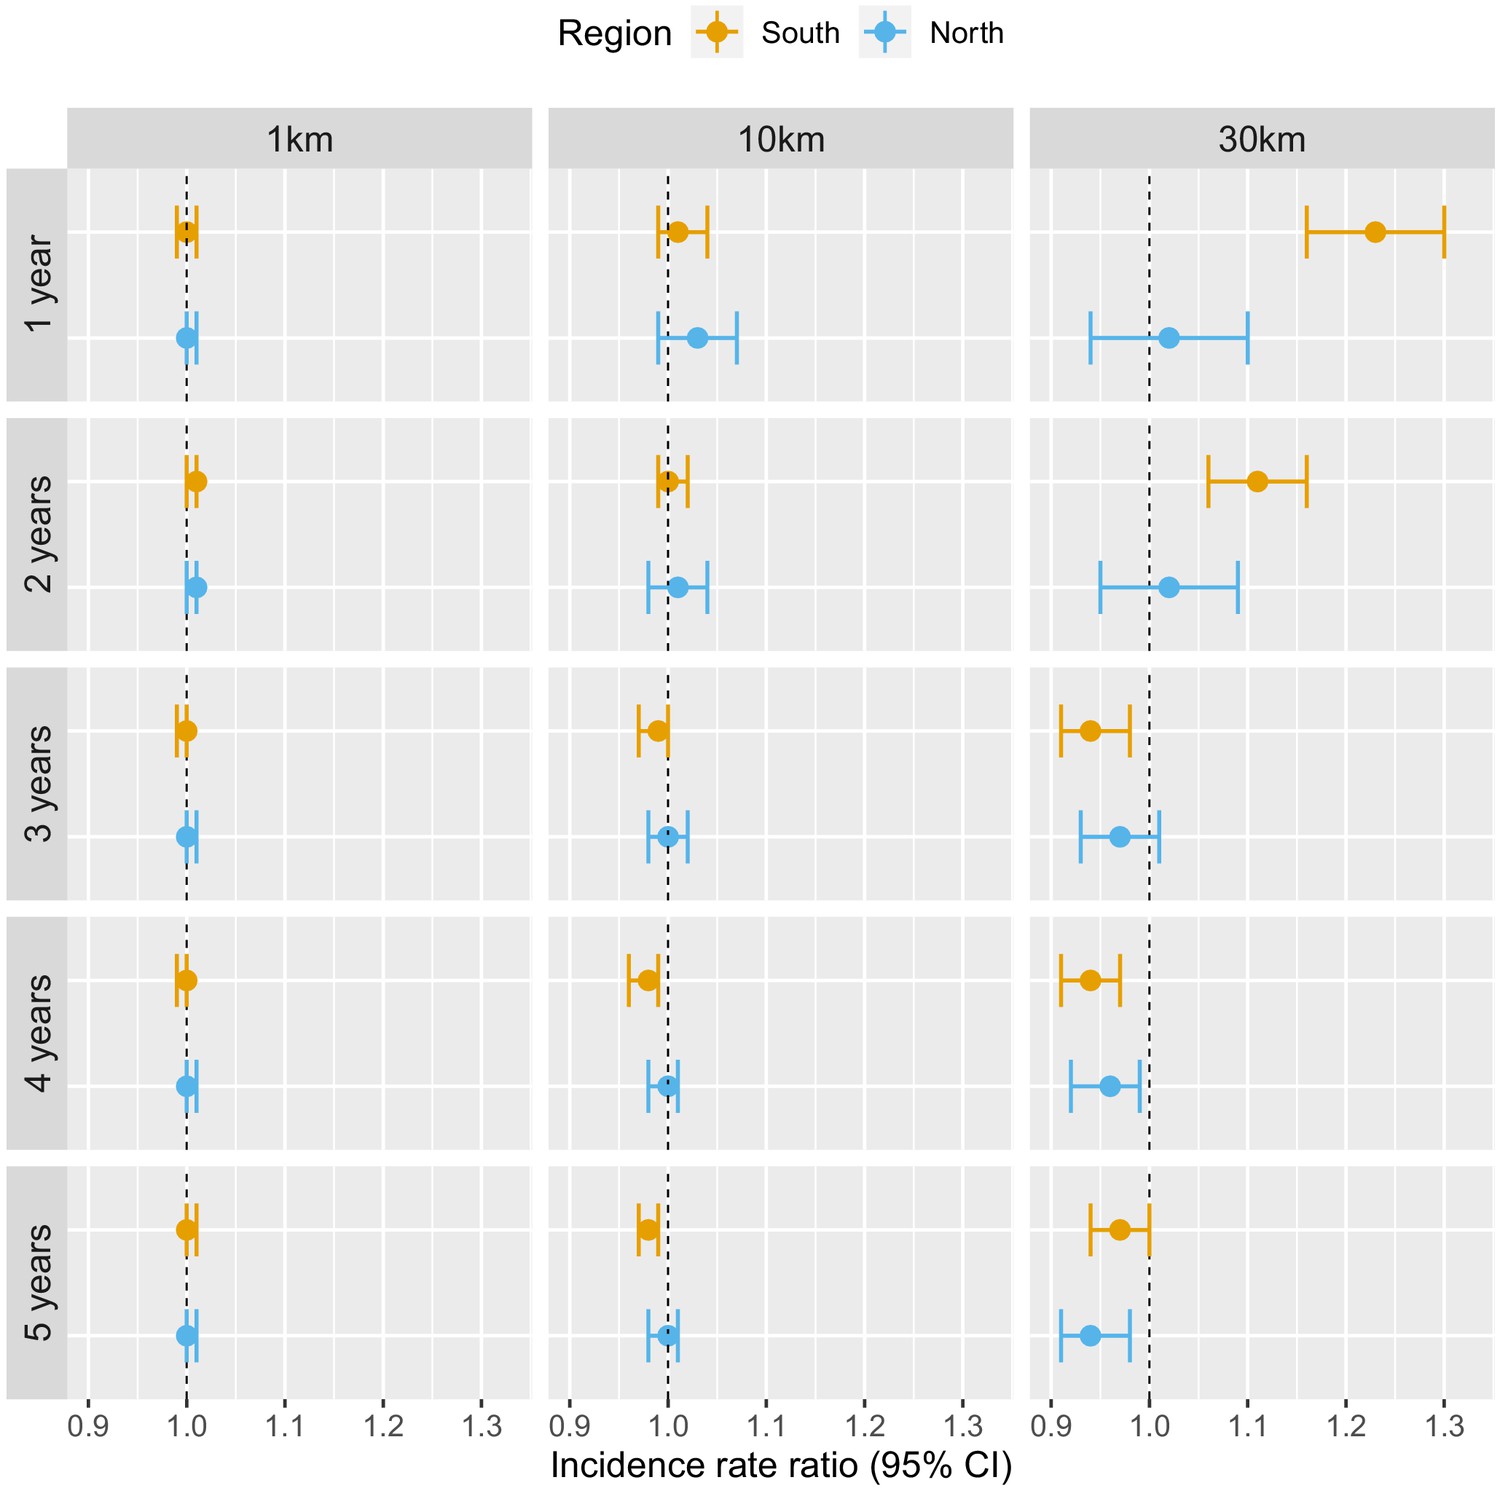
Associations between malaria incidence and a 0.1% increase in the area that experienced deforestation within 1, 10, or 30 km (left-right) of a village in the previous 1–5 years (top-down) in Lao PDR.
Adjusted for the probability of seeking treatment, the spatio-temporal structure of the data, the environmental covariates selected in the model and forest cover within 30 km in the year before the deforestation temporal scale considered as well as for malaria incidence in the previous 1 and 2 years. See Materials and methods for details.
-
Figure 3—source data 1
Data for Figure 3.
- https://cdn.elifesciences.org/articles/56974/elife-56974-fig3-data1-v2.zip
Figure 4

Associations between malaria incidence and a 0.1% increase in the area that experienced deforestation within 1, 10, or 30 km (left-right) of a village in the previous 1–5 years (top-down) in southern Lao PDR, differentiated by malaria species.
Adjusted for the probability of seeking treatment, the spatio-temporal structure of the data, the environmental covariates selected in the model and forest cover within 30 km in the year before the deforestation temporal scale considered as well as for malaria incidence in the previous 1 and 2 years. See Materials and methods for details.
-
Figure 4—source data 1
Data for Figure 4.
- https://cdn.elifesciences.org/articles/56974/elife-56974-fig4-data1-v2.zip
Figure 5
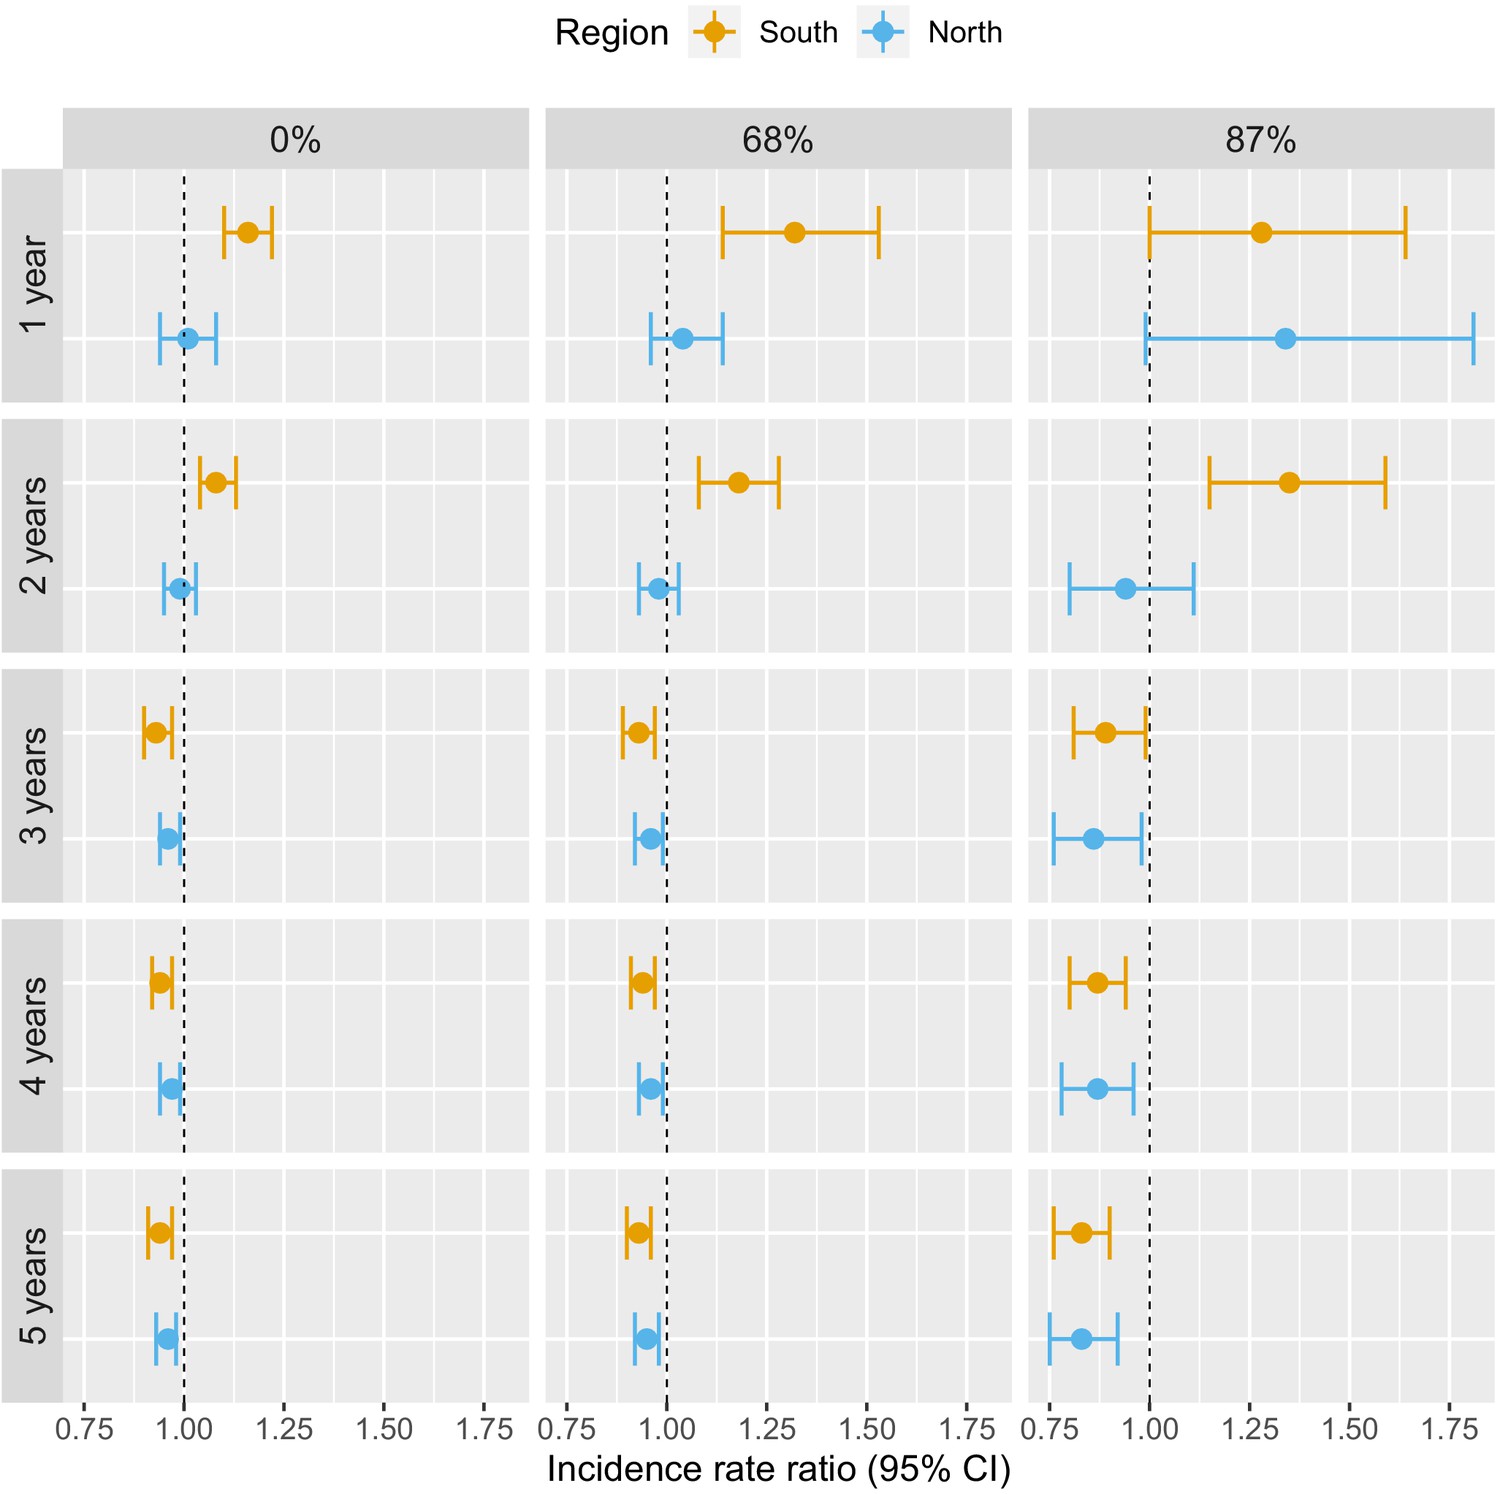
Associations between malaria incidence and a 0.1% increase in the area that experienced deforestation within 30 km of a village in the previous 1–5 years (top-down) and within areas with tree crown cover density above 0%, 68%, and 87% (left-right) in Lao PDR.
Adjusted for the probability of seeking treatment, the spatio-temporal structure of the data, the environmental covariates selected in the model and forest cover within 30 km in the year before the deforestation temporal scale considered as well as for malaria incidence in the previous 1 and 2 years. See Materials and methods for details.
-
Figure 5—source data 1
Data for Figure 5.
- https://cdn.elifesciences.org/articles/56974/elife-56974-fig5-data1-v2.zip
Figure 6
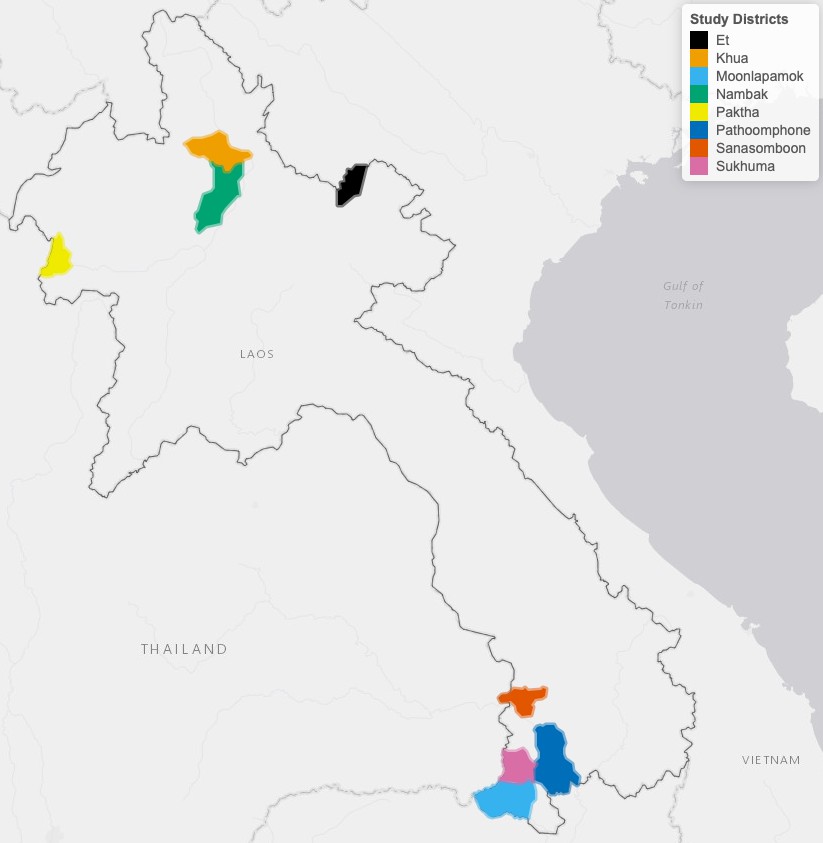
Map of study’s districts.
Figure 7
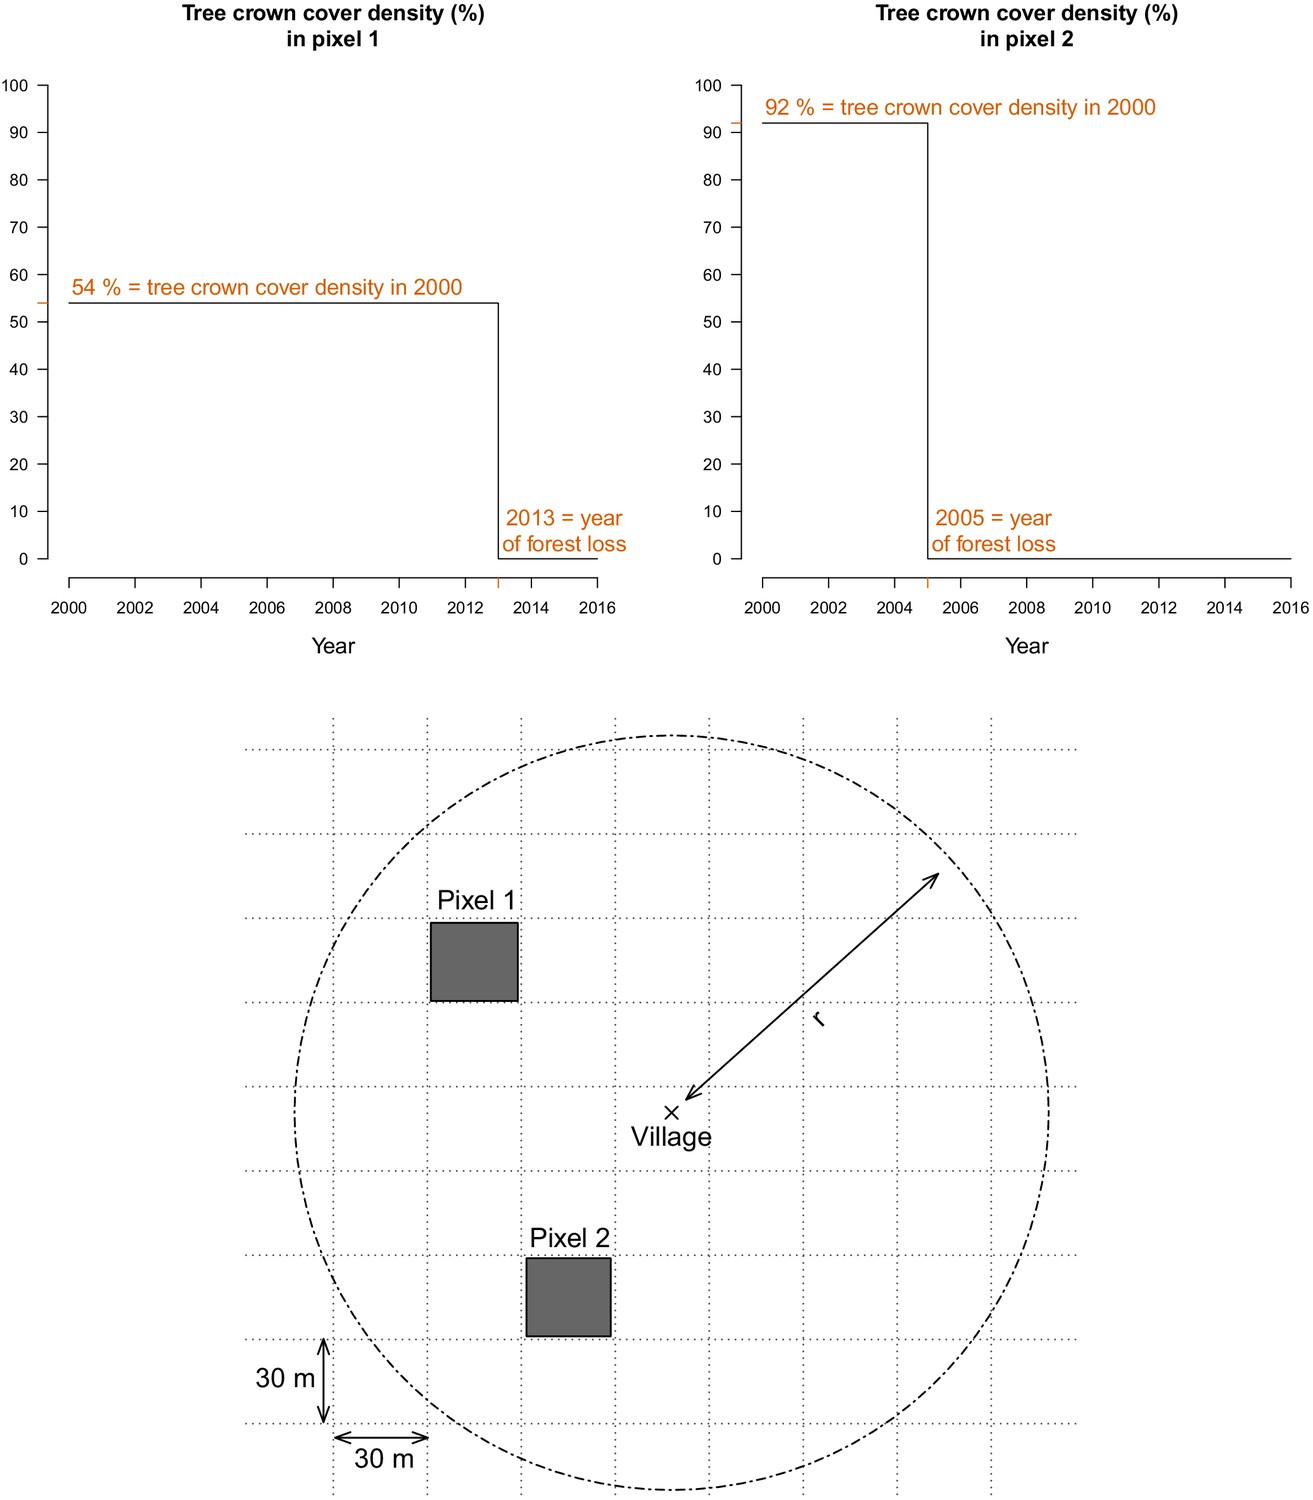
For every 30 m Landsat pixel within a buffer radius r (1, 10, and 30 km) of study’s villages, the tree crown cover density in 2000 and the year of forest loss were combined to derive the deforestation and forest cover variables.
The two upper plots highlight the raw data at two example pixels from the lower plot.
Figure 8
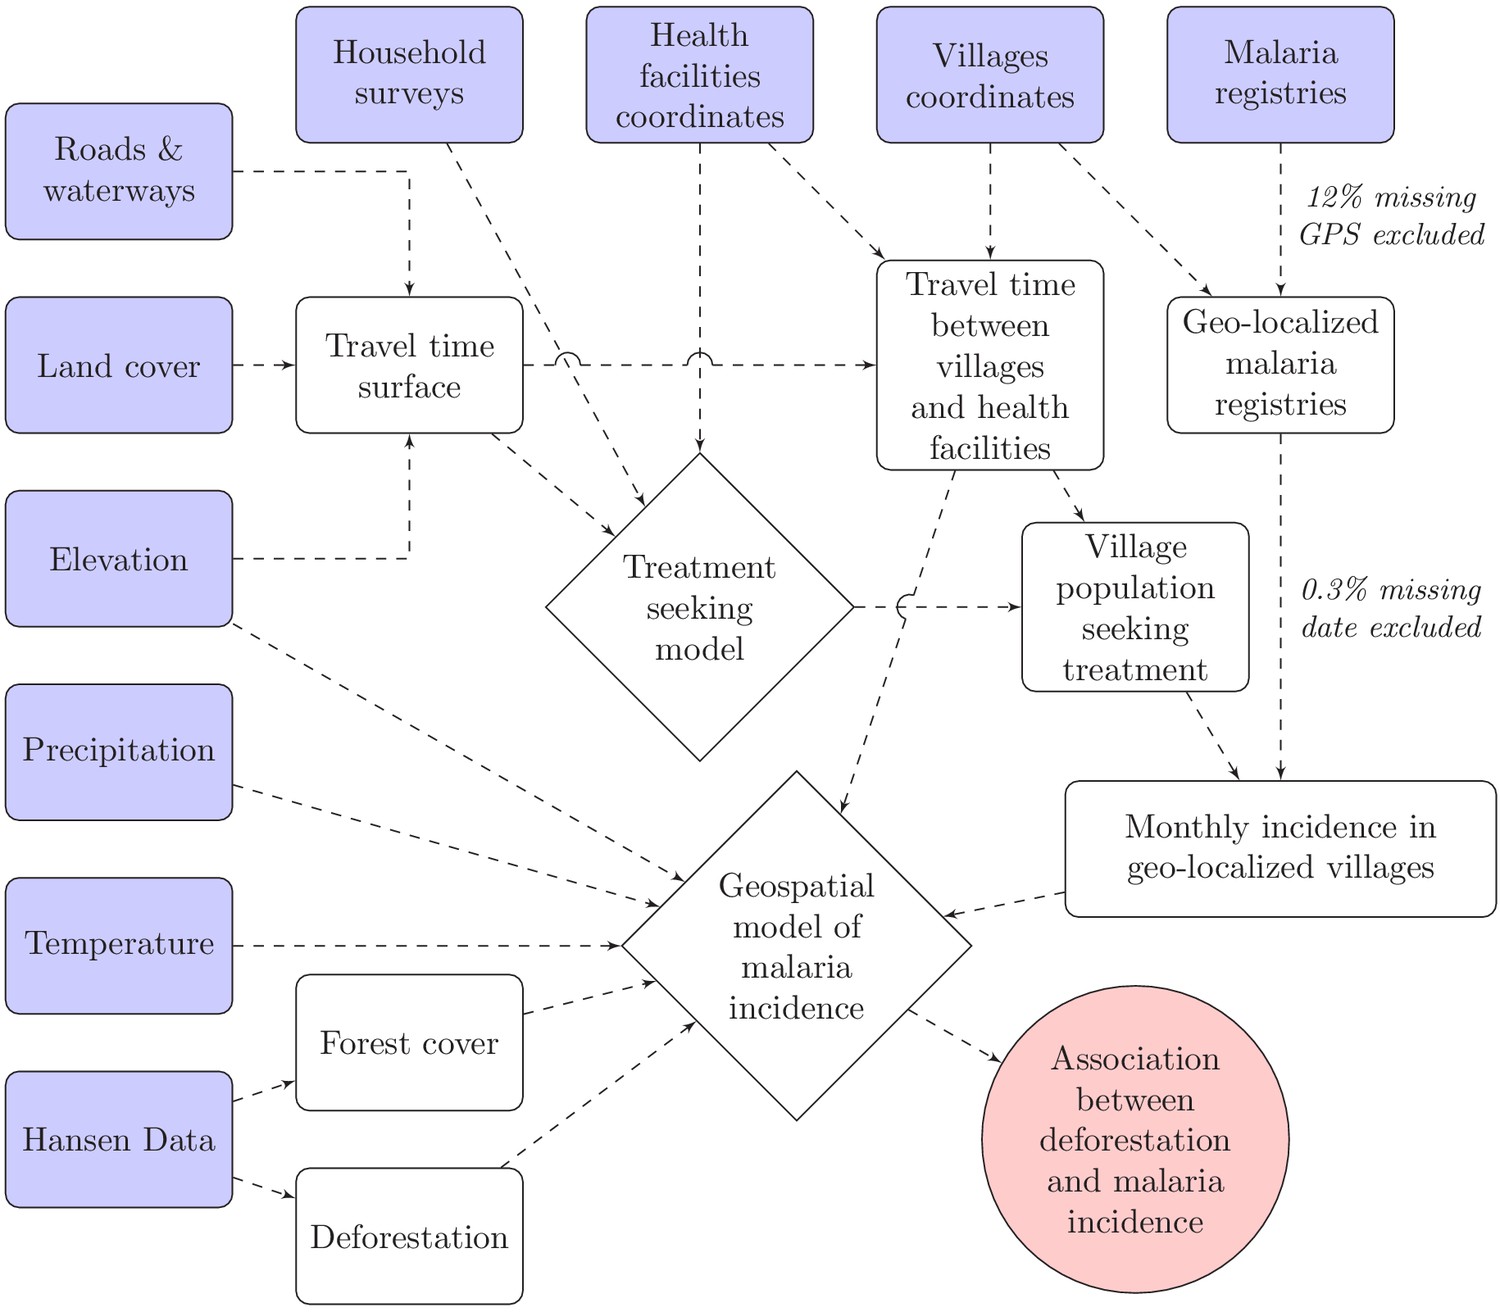
Conceptual model for our analysis showing how the raw input data (blue boxes) were combined via intermediate data (white boxes) and models (white diamonds) to produce our estimated outputs (red circle).
Appendix 1—figure 1
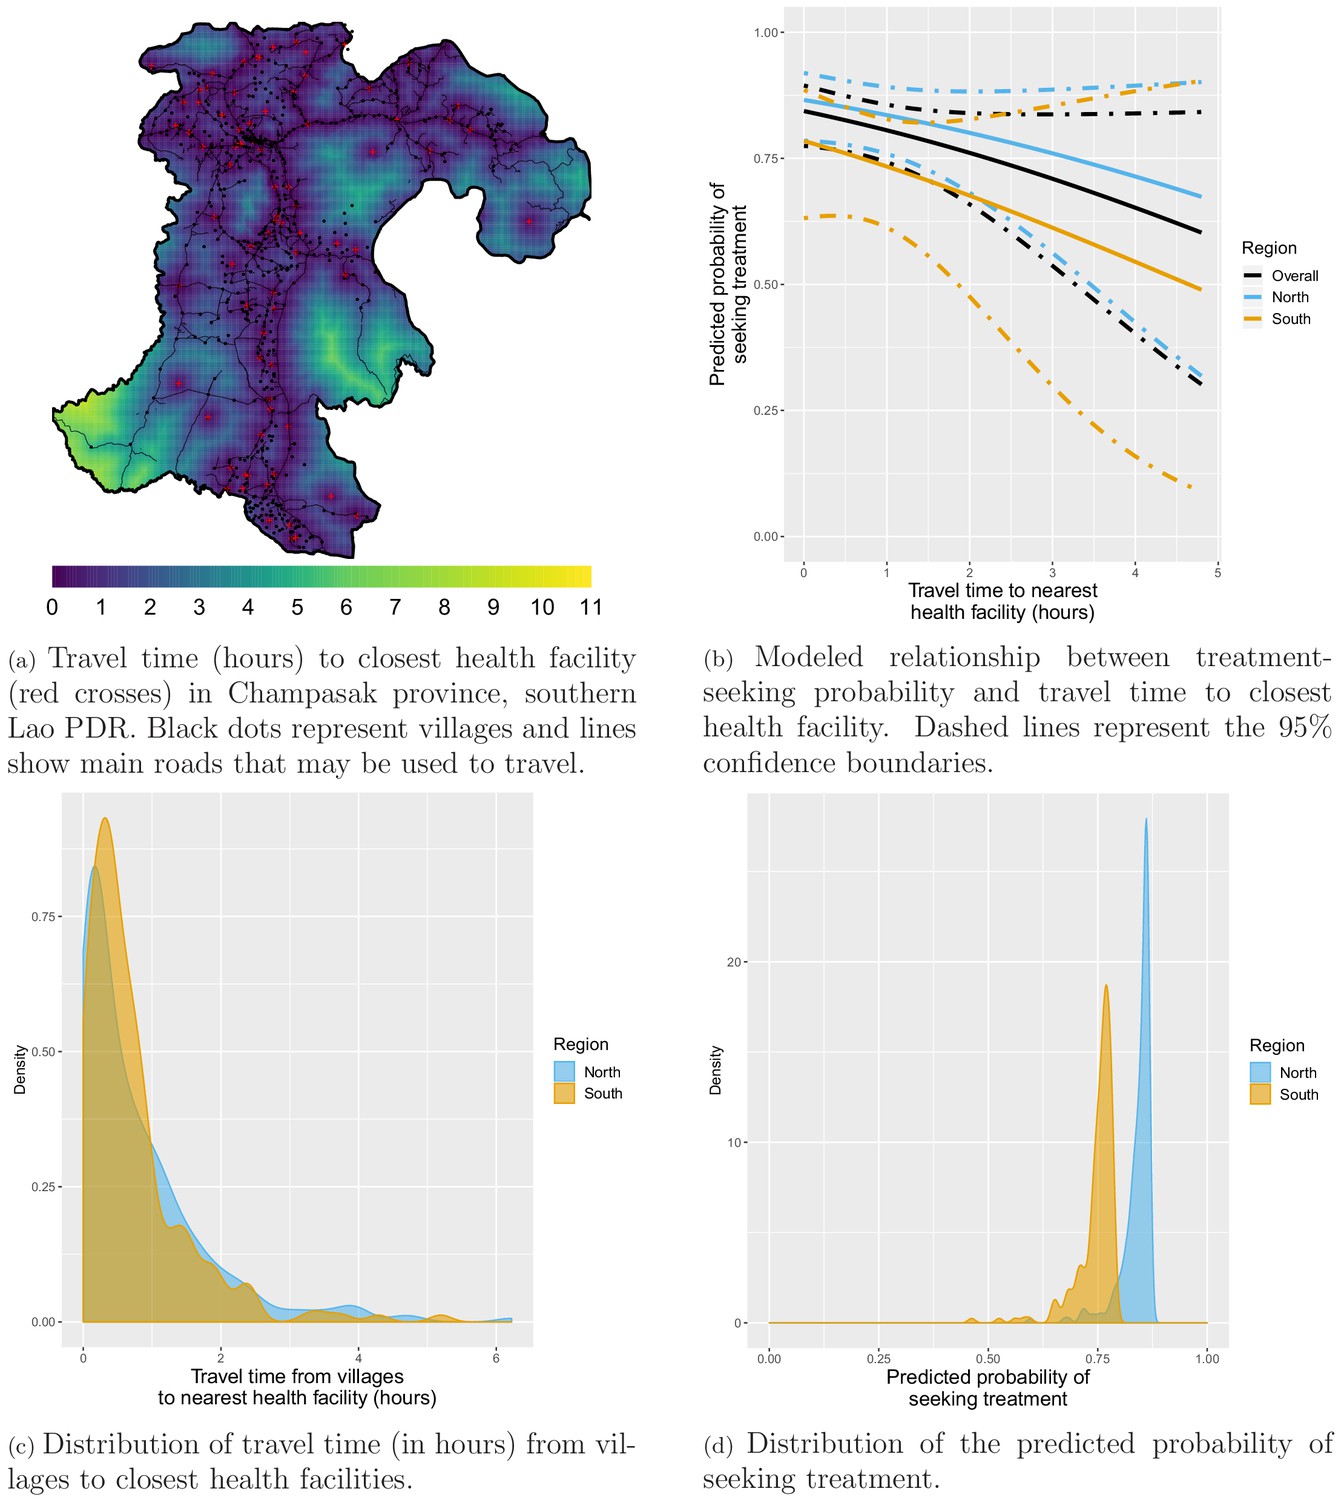
Treatment-seeking modeling plots. Note that treatment-seeking at public health facilities is implied all along the manuscript.
Appendix 1—figure 2
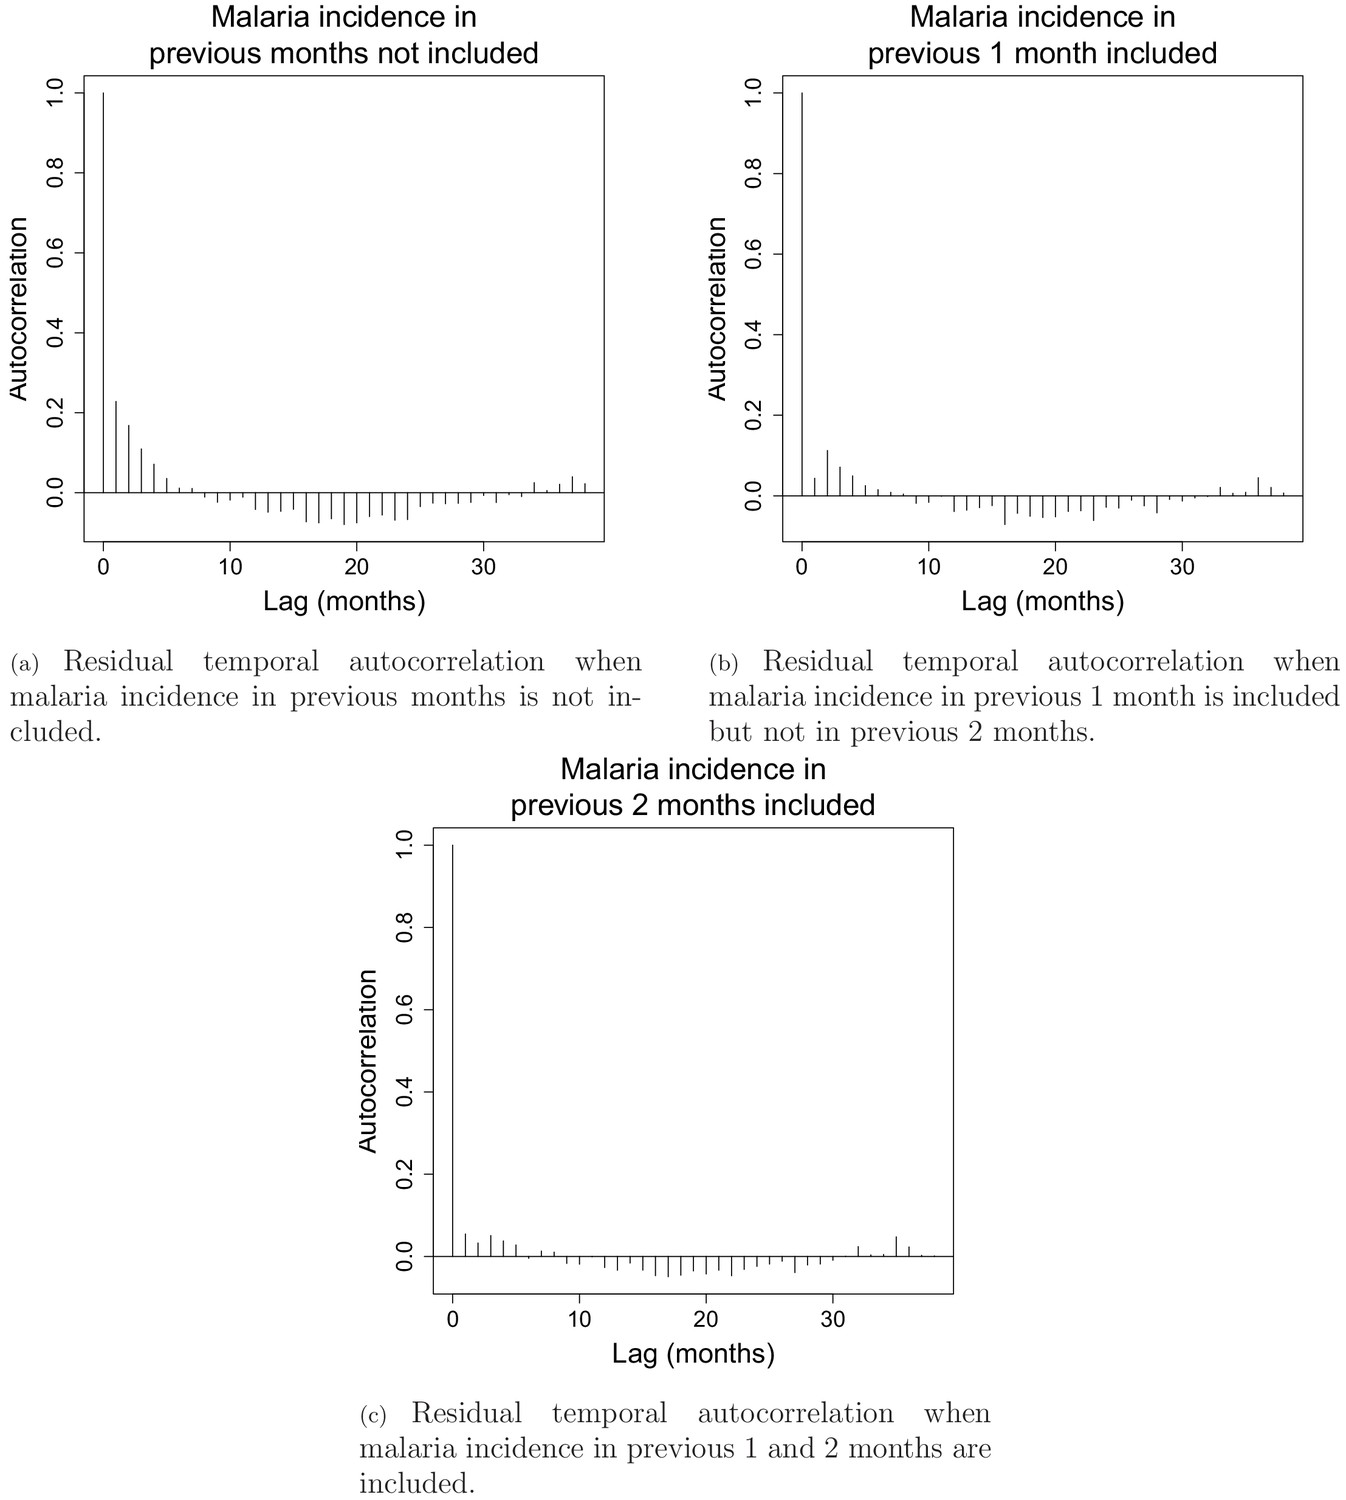
Residual temporal autocorrelation when malaria incidence in previous 1 and 2 months are included or not.
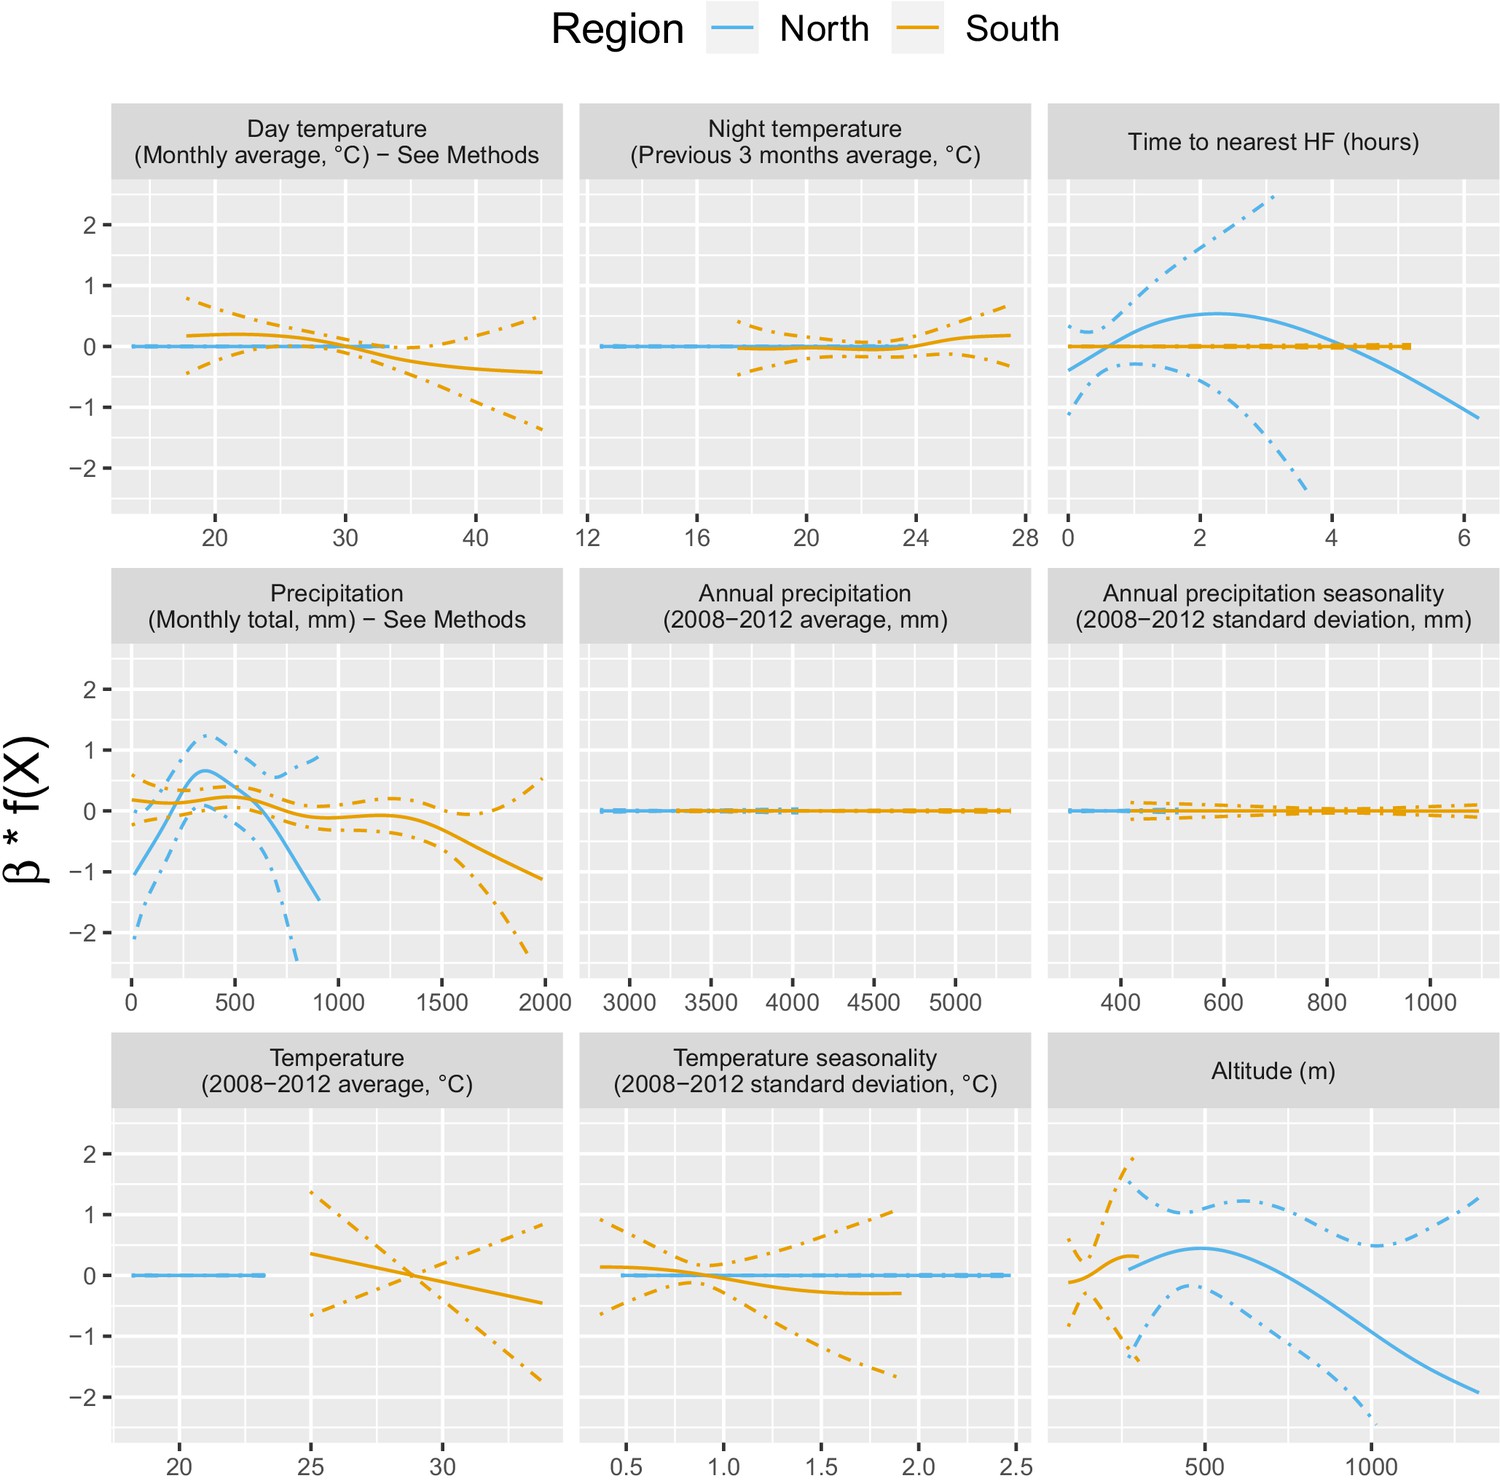
Appendix 1—figure 3
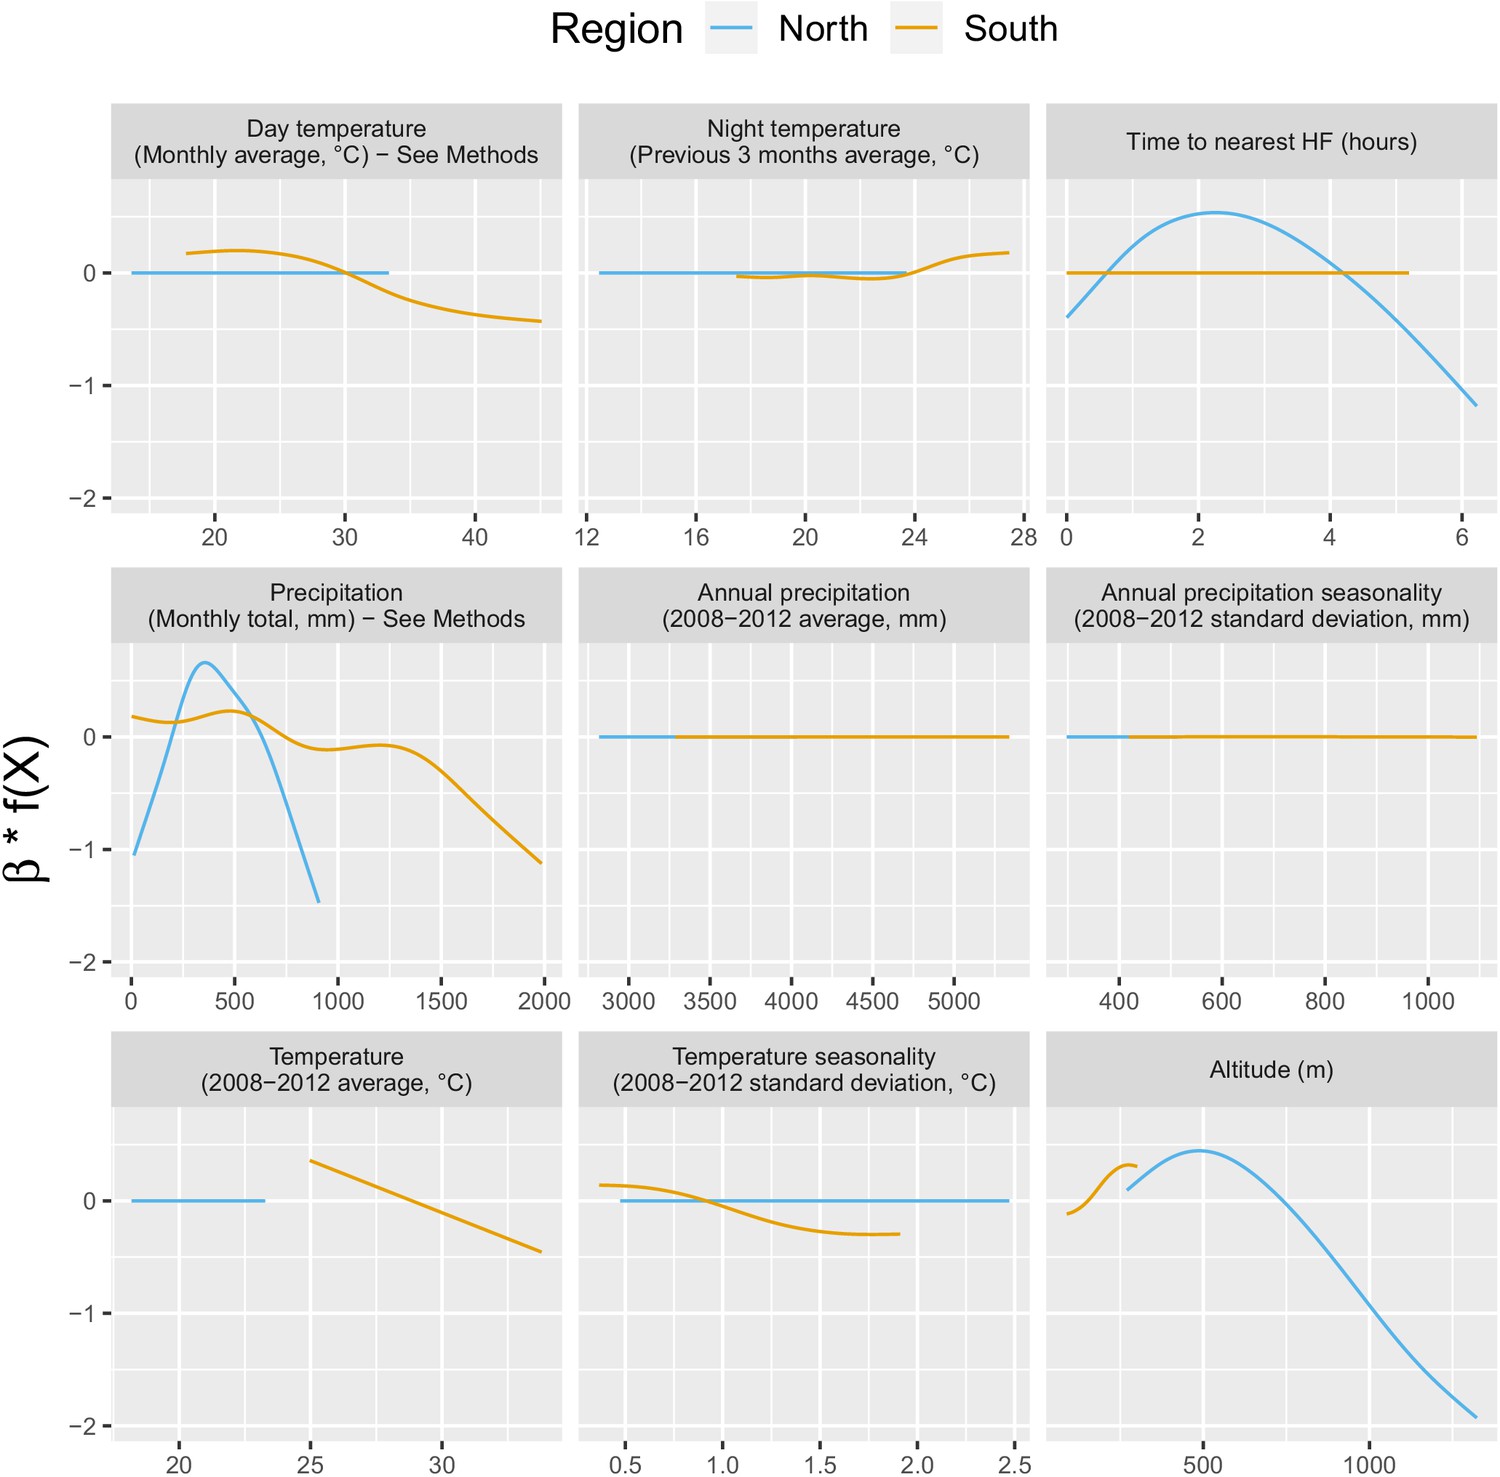
Relationships between malaria incidence and the environmental covariates in the multivariable model described in equation 2 (30 km radius and 1-year temporal lag), additionally adjusted for the probability of seeking treatment, the spatio-temporal structure of the data (, and village random intercepts) and malaria incidence in the previous 1 and 2 months.
See Materials and methods for details. Note that 95% confidence intervals (see Appendix 1—figure 13) have been hidden for better visualization.
Appendix 1—figure 4
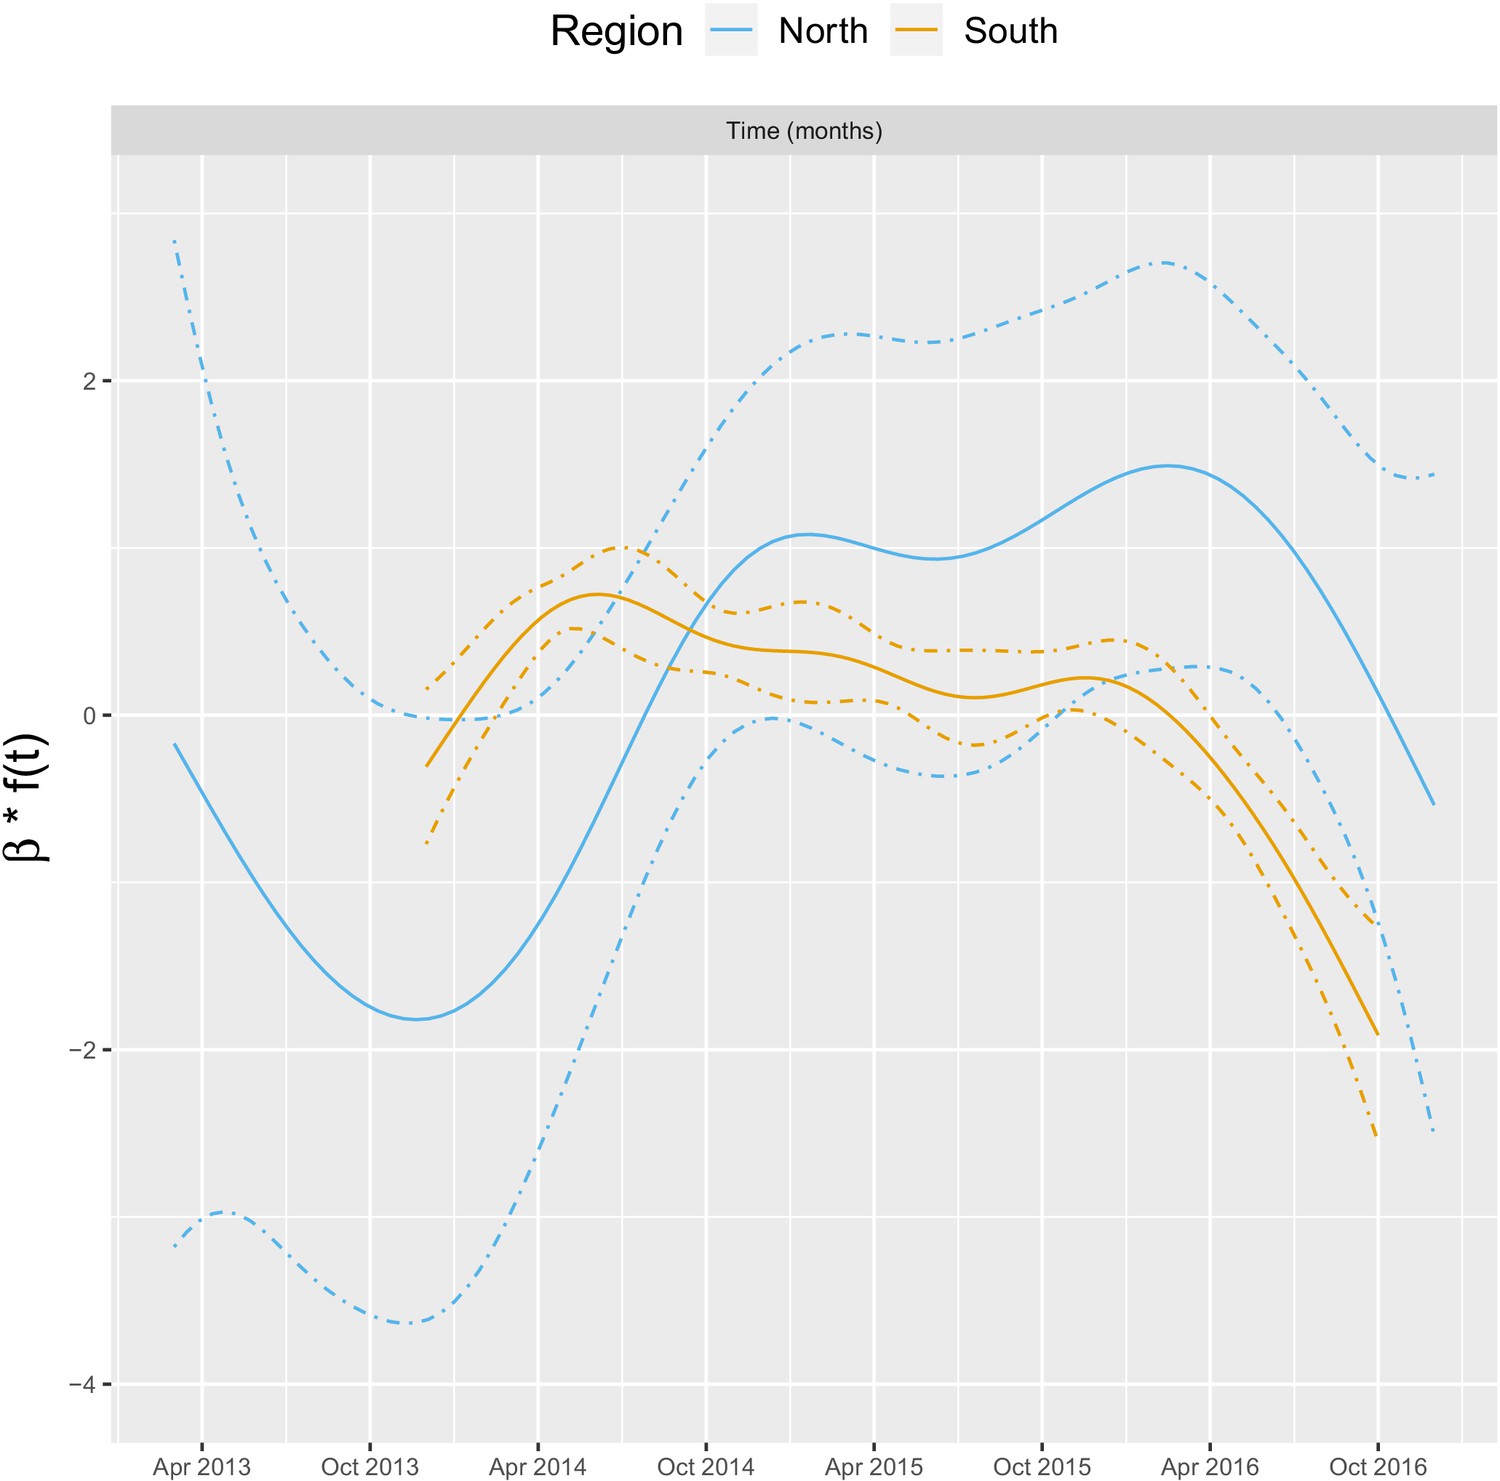
Relationships between malaria incidence and the temporal trend in the multivariable model described in equation 2 (30 km radius and - year temporal lag), additionally adjusted for the probability of seeking treatment, the spatial structure of the data ( and village random intercepts) and malaria incidence in the previous 1 and 2 months.
See Materials and methods for details.
Appendix 1—figure 5
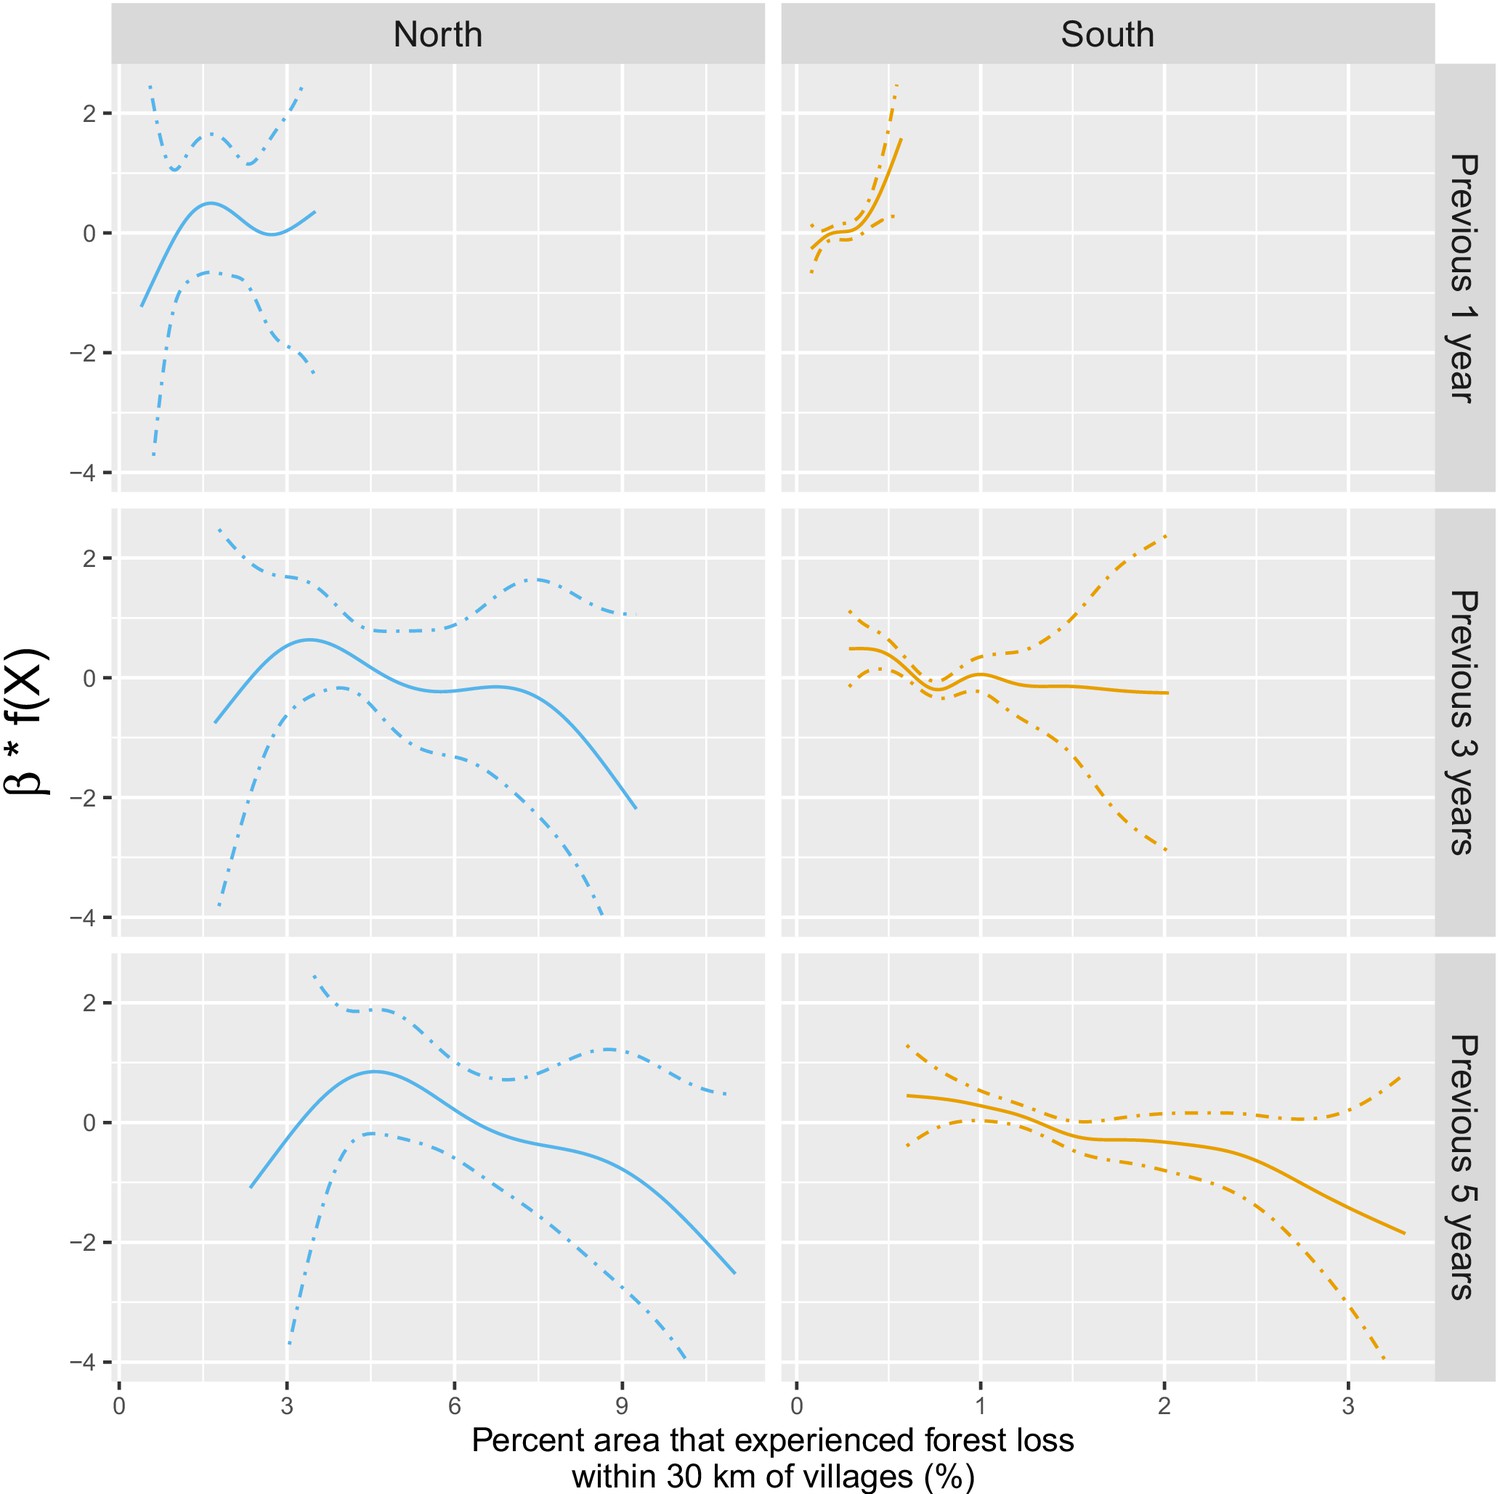
Adjusted relationship between deforestation and malaria incidence.
All models were adjusted for environmental covariates and forest cover on top of the probability of seeking treatment, the spatio-temporal structure of the data (, and village random intercepts) and malaria incidence in the previous 1 and 2 months. See Materials and methods for details. Note that scales are different between buffer radius for better visualization. Appendix 1—figure 14 shows the raw scatterplot between monthly village malaria incidence rate and deforestation. Appendix 1—figure 15 and Appendix 1—figure 16 show the raw time series of malaria incidence, forest cover and percent area that experienced forest loss.
Appendix 1—figure 6

Distribution of average tree crown cover density within 1, 10, and 30 km of villages.
Appendix 1—figure 7
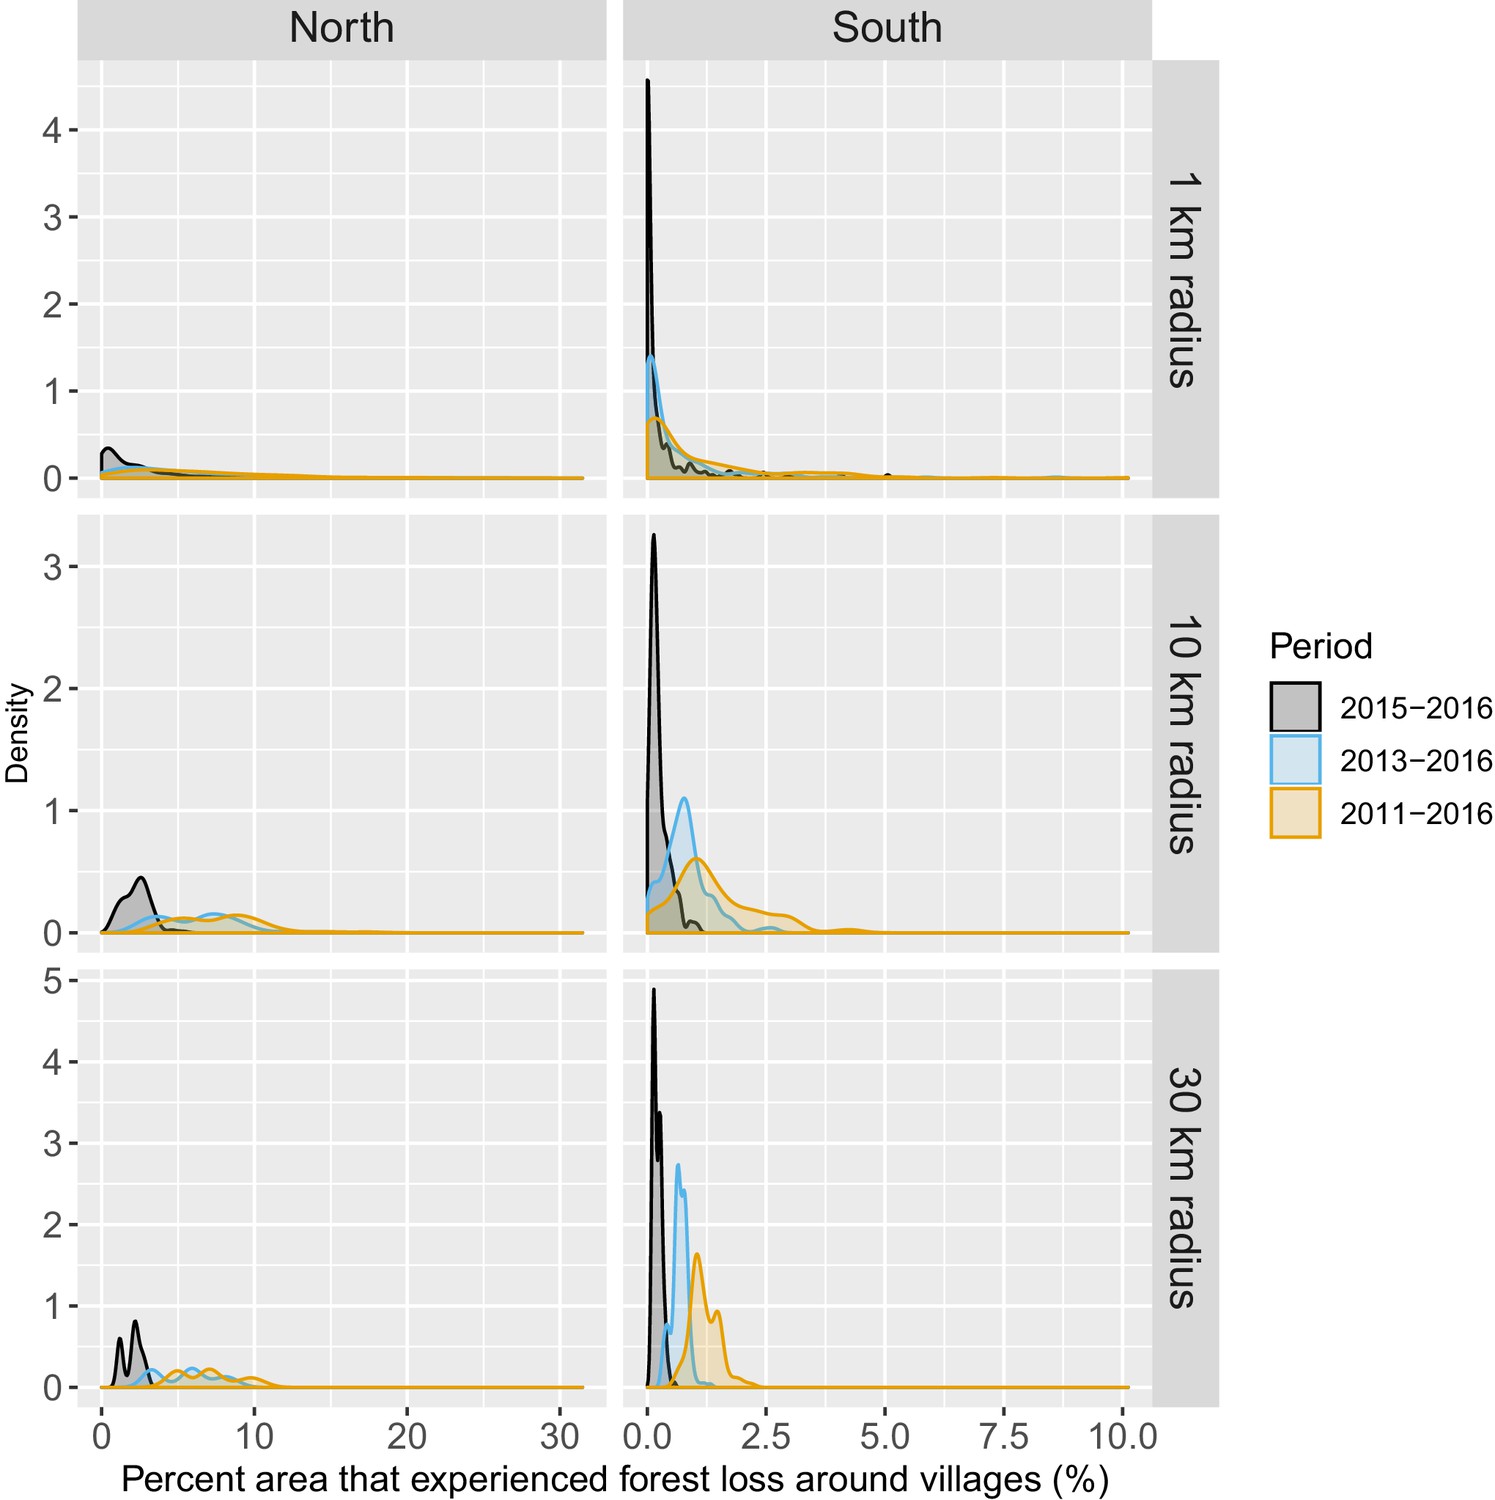
Distribution of percent area within 1, 10, and 30 km of villages that experienced forest loss between 2011 and 2016.
Note that the scales are different for every panel for better visualization of the distributions.
Appendix 1—figure 8
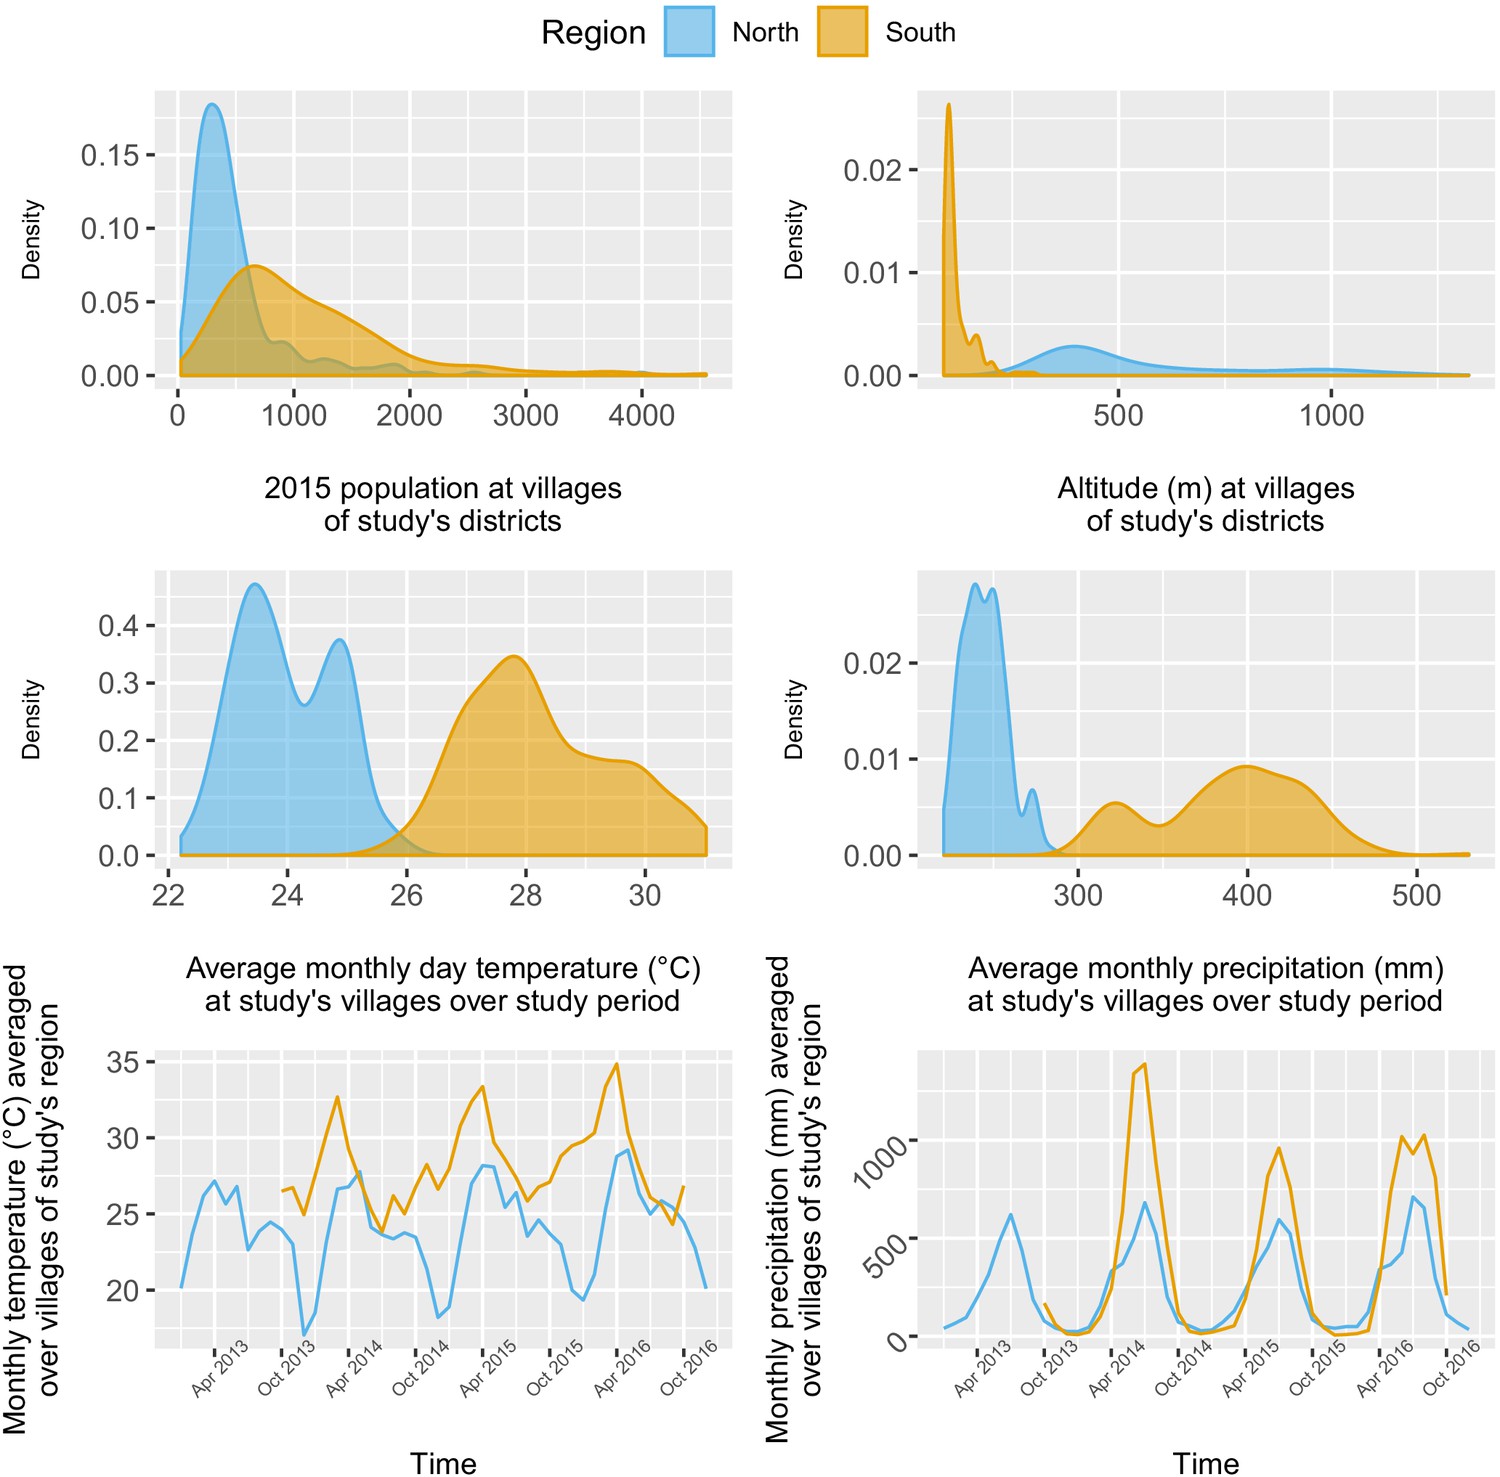
Distribution and time series of environmental covariates (population, altitude, monthly day temperature and monthly total precipitation) at study’s villages.
Appendix 1—figure 9
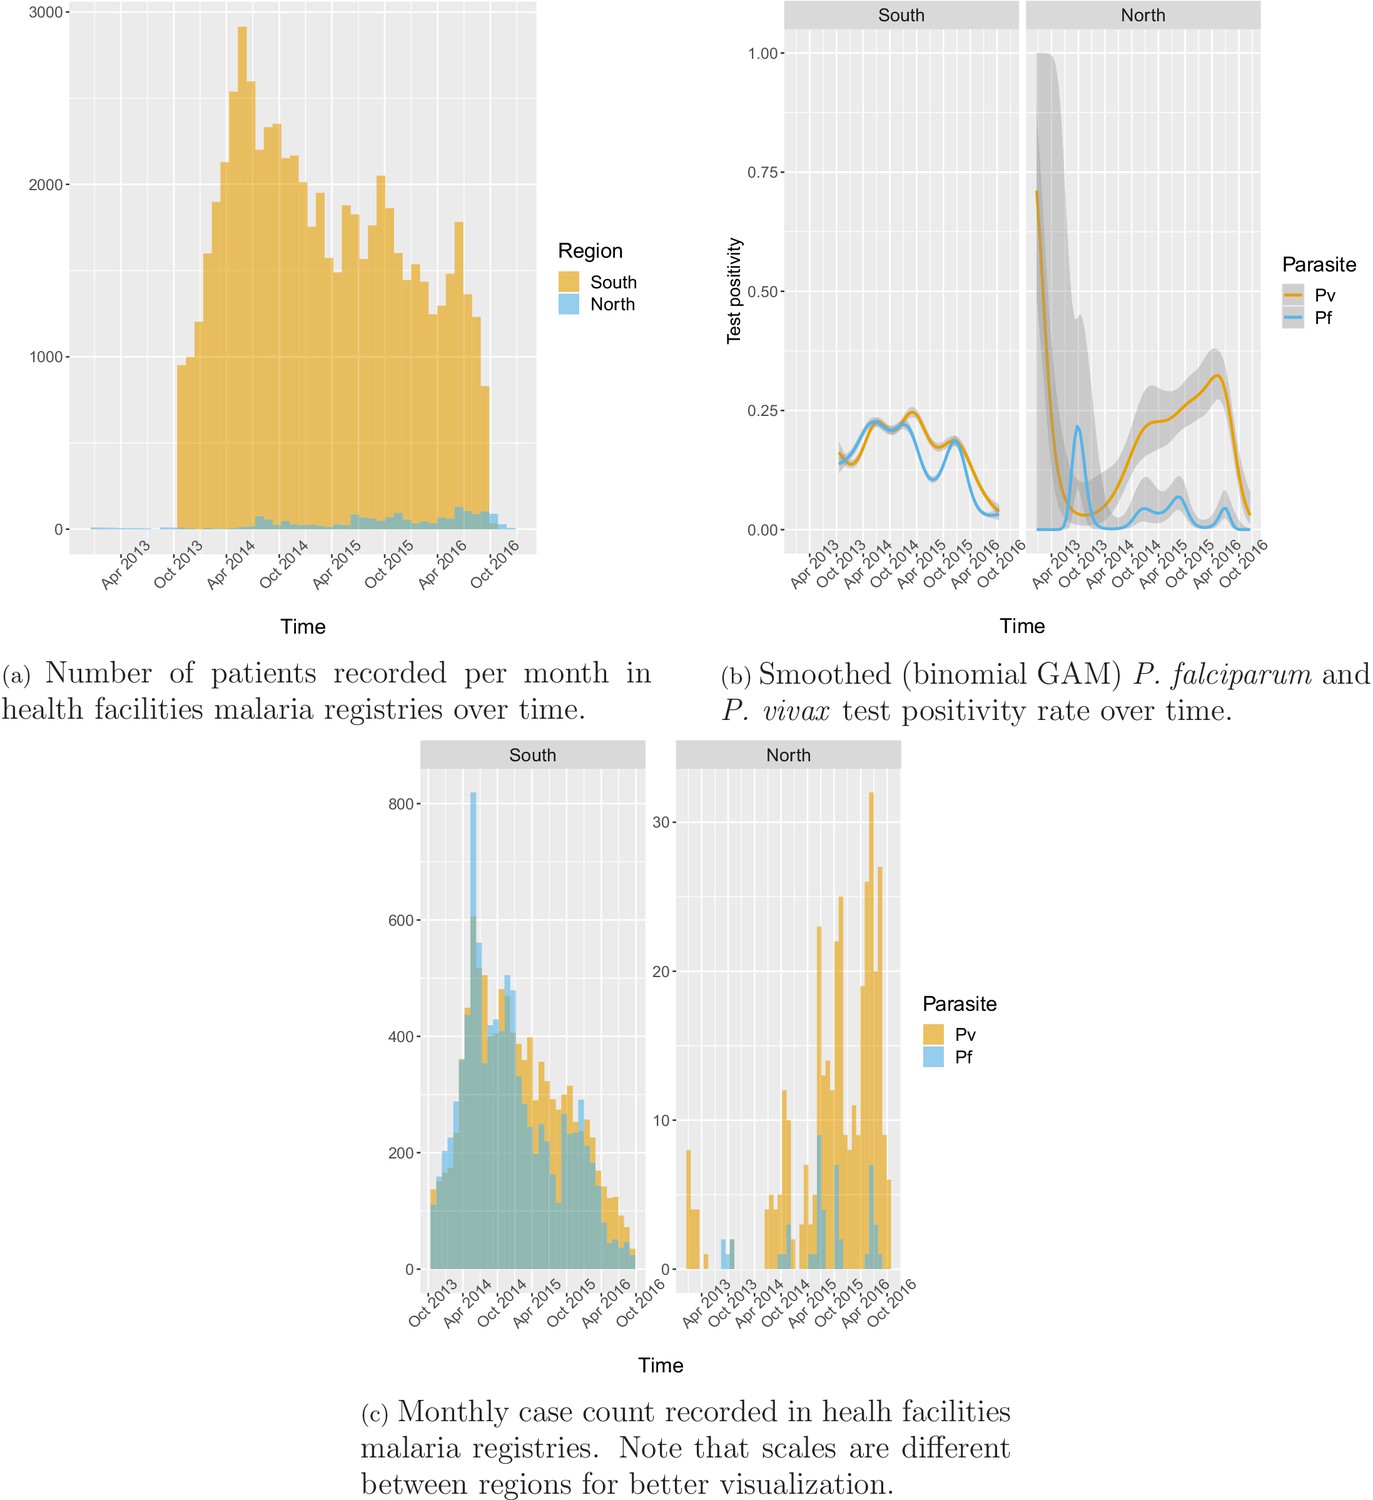
Additional figures from malaria registries: malaria infections.
Appendix 1—figure 10

Distributions of socio-economomical variables of all patients recorded in the malaria registries.
Appendix 1—figure 11
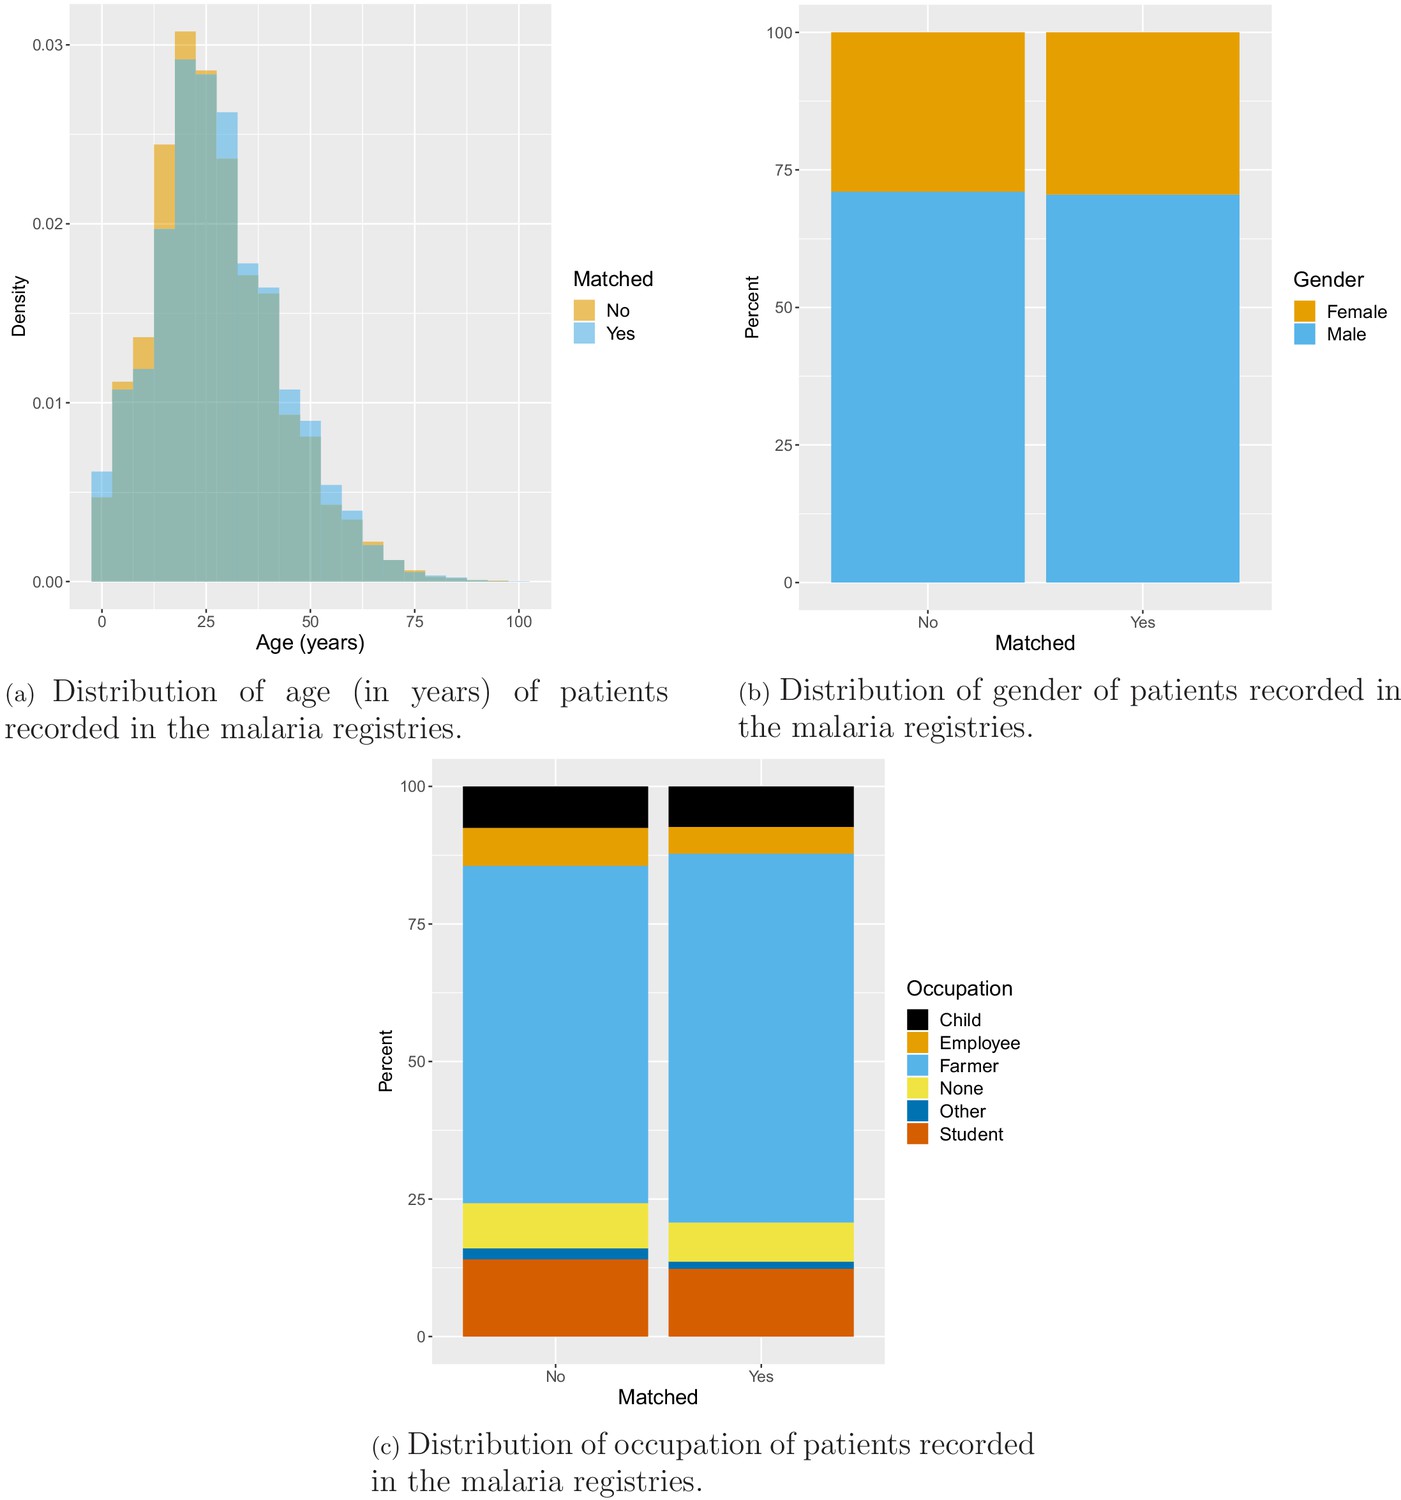
Additional figures from malaria registries: matched vs unmatched SES variables.
Appendix 1—figure 12
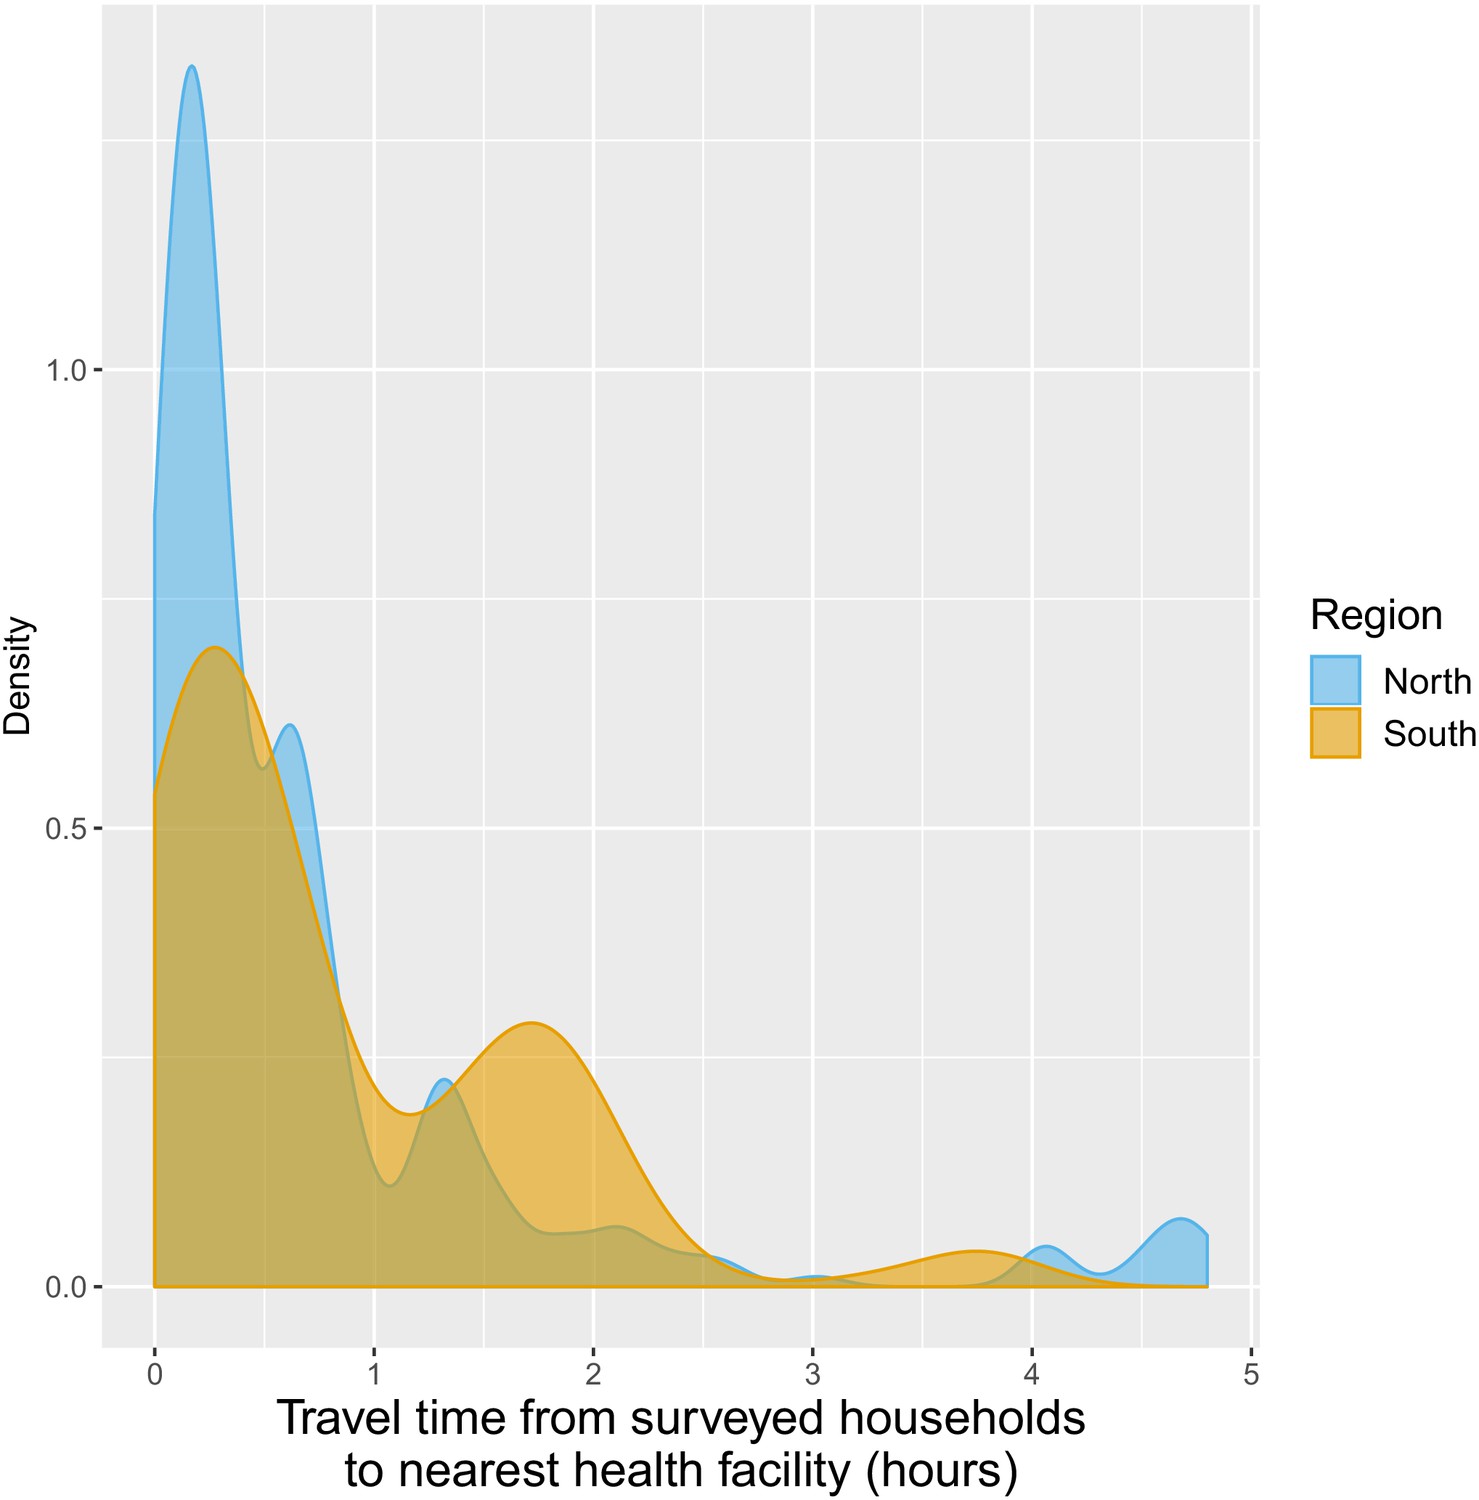
Distribution of travel time (in hours) from surveyed households to closest health facilities.
Appendix 1—figure 13
Relationships between malaria incidence and the environmental covariates in the multivariable model described in equation 2 (30 km radius and 1-year temporal lag), additionally adjusted for the probability of seeking treatment, the spatio-temporal structure of the data (, and village random intercepts) and malaria incidence in the previous 1 and 2 months.
Dashed lines are for 95% confidence intervals. Note that the y scale has been trimmed a bit for better visualization.
Appendix 1—figure 14
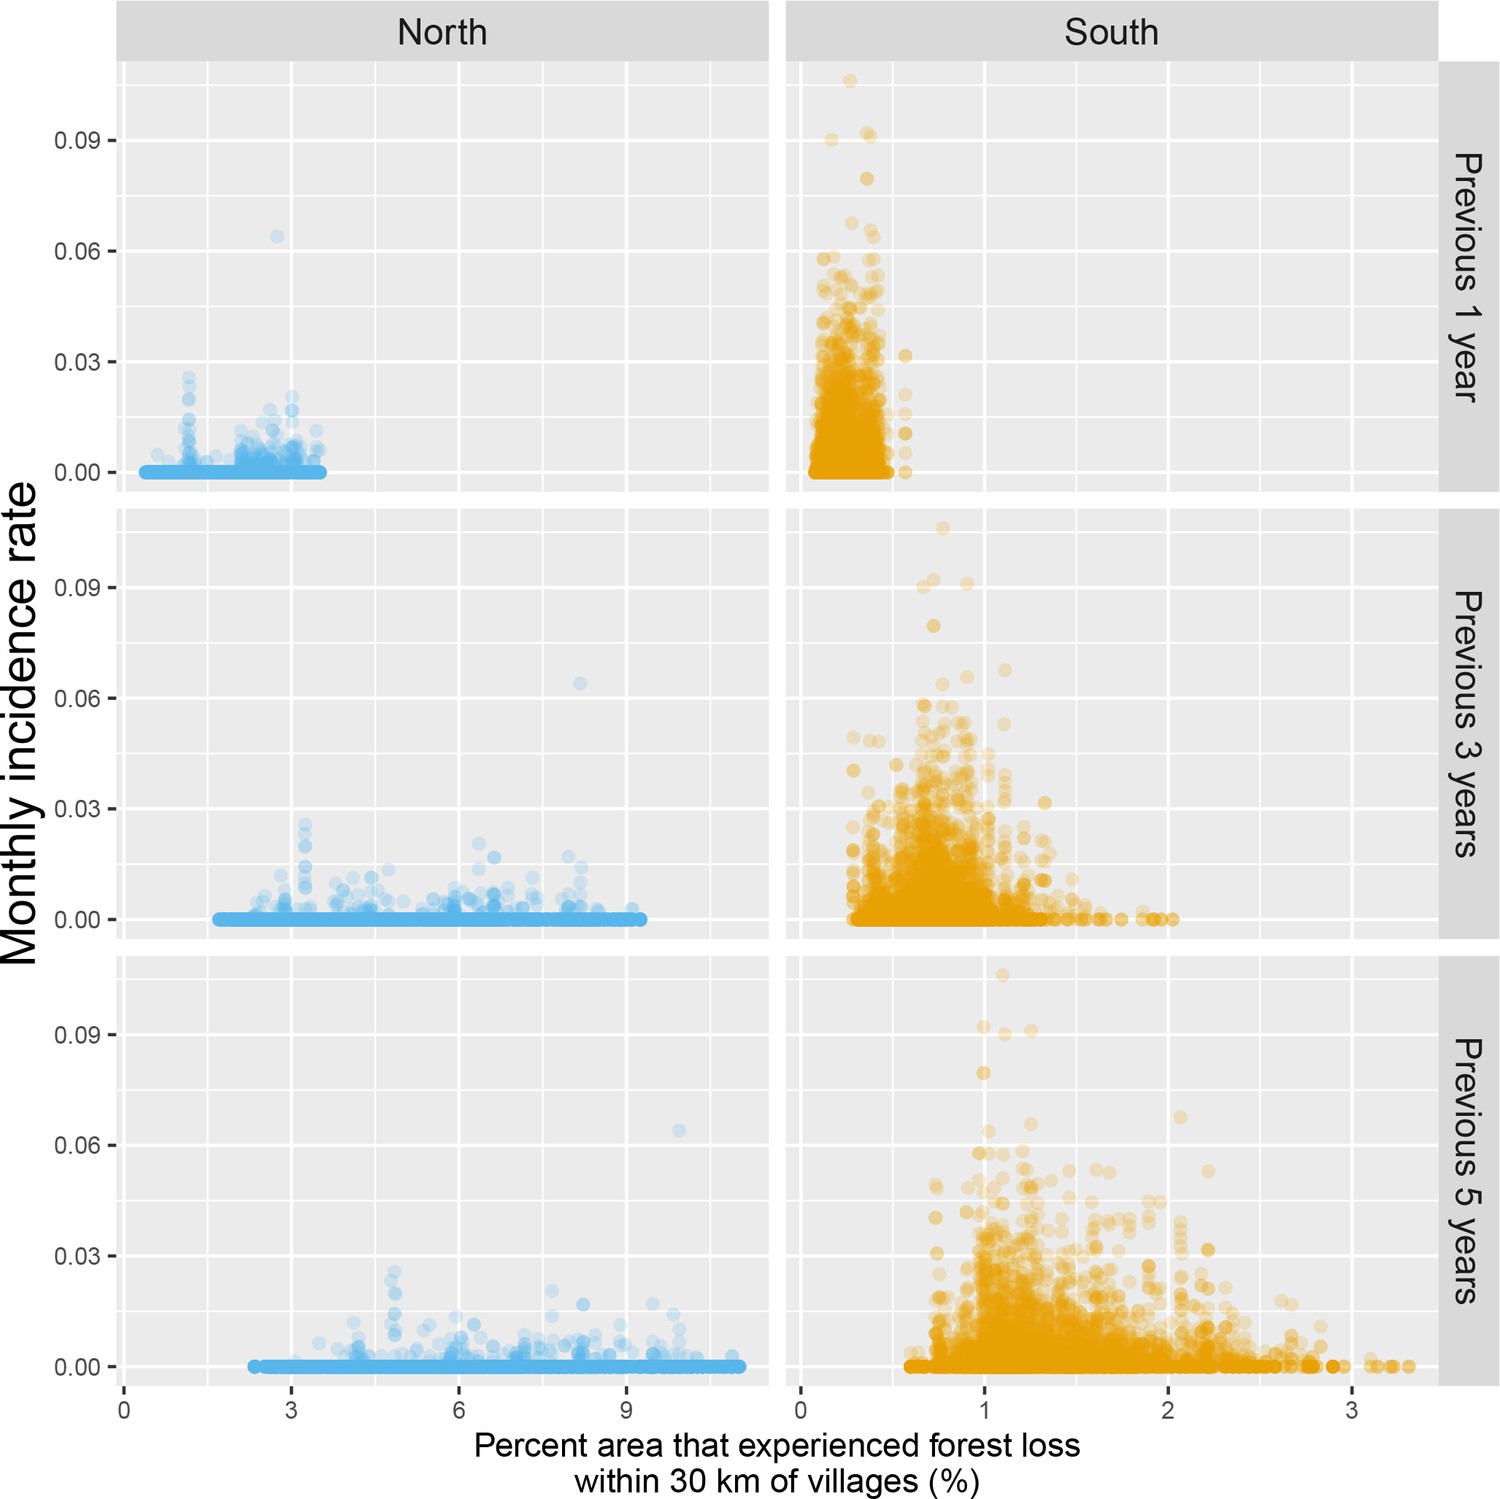
Raw scatterplot between monthly village malaria incidence rate and the percent area within 30 km of villages that experienced forest loss in the previous 1, 3, and 5 years.
Note that scales are different between regions for better visualization.
Appendix 1—figure 15
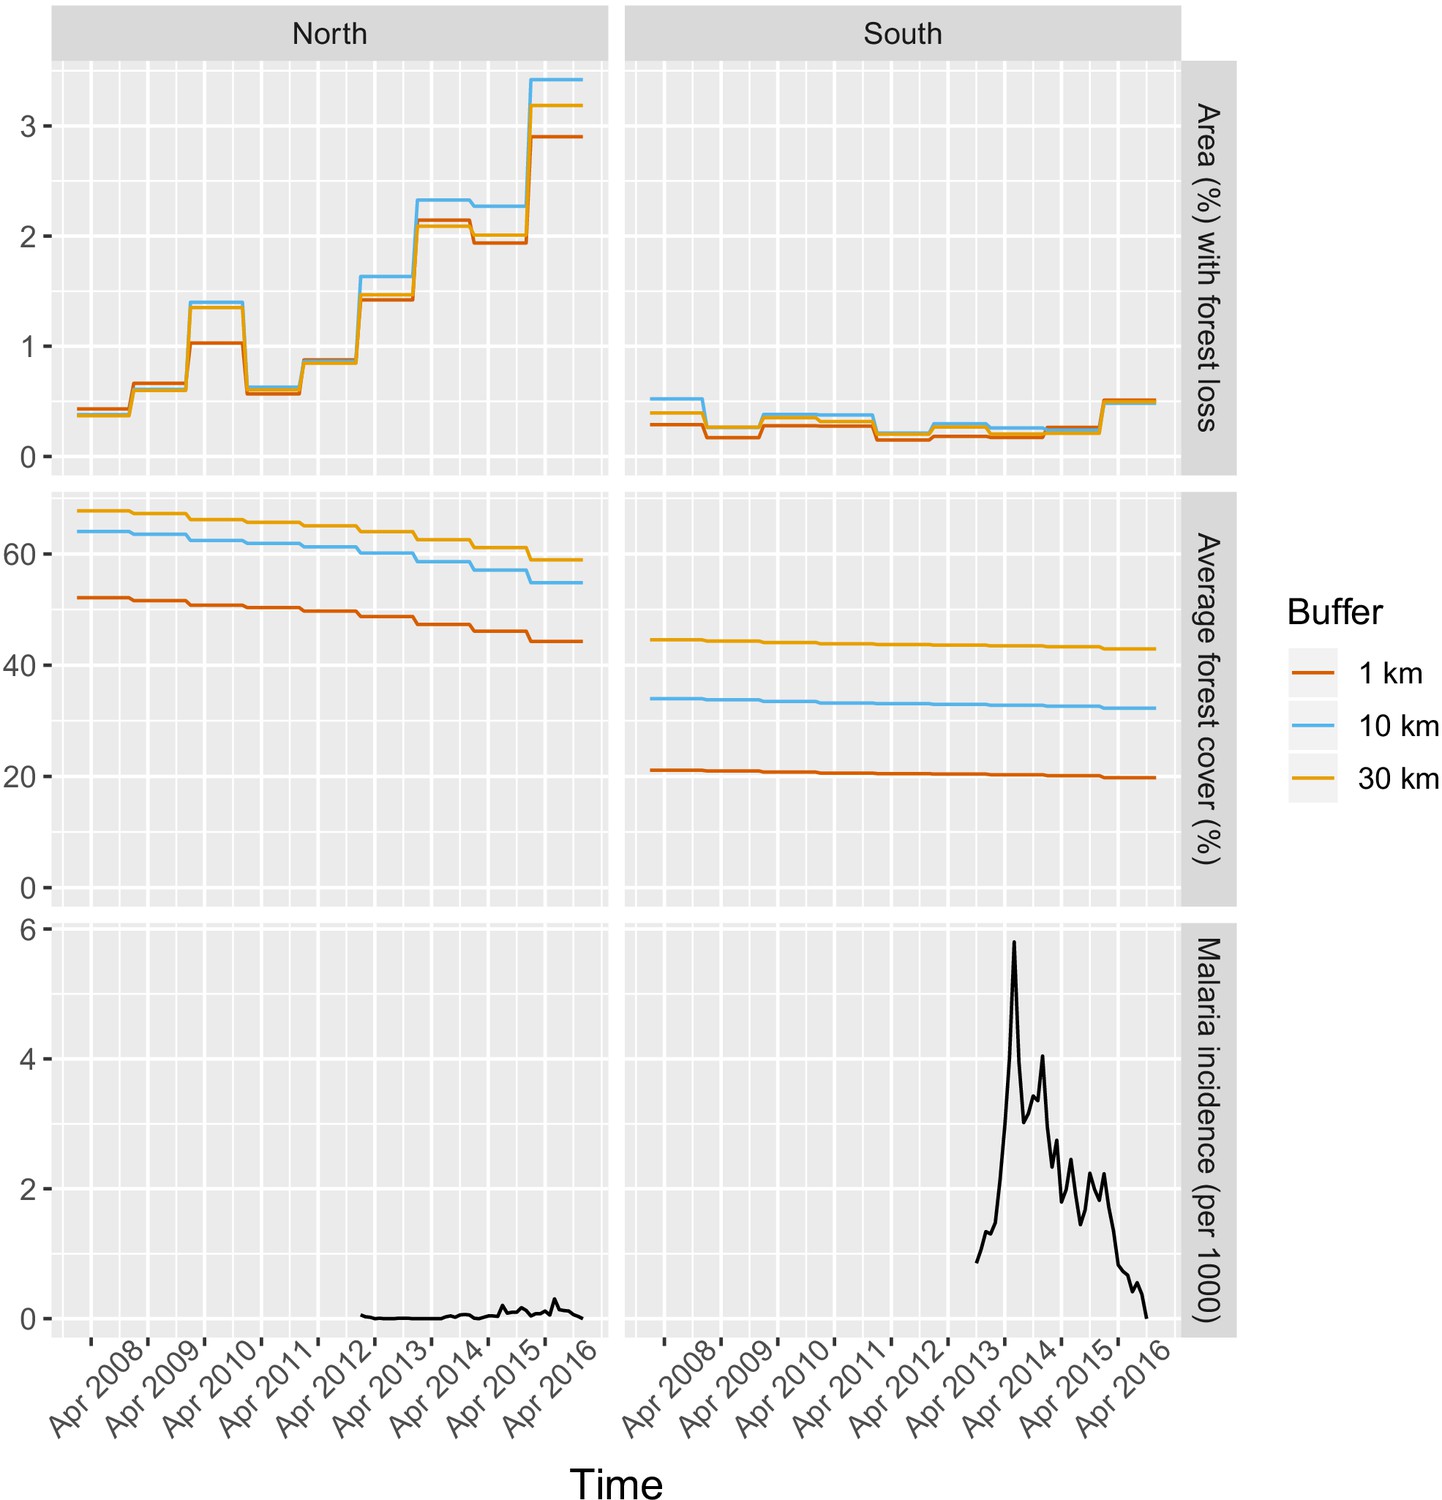
Time series of deforestation (percent area that experienced forest loss around villages), forest cover (average tree crow cover around villages) and malaria incidence, averaged over study’s villages and for varying buffer radius around villages (1, 10, and 30 km).
Appendix 1—figure 16
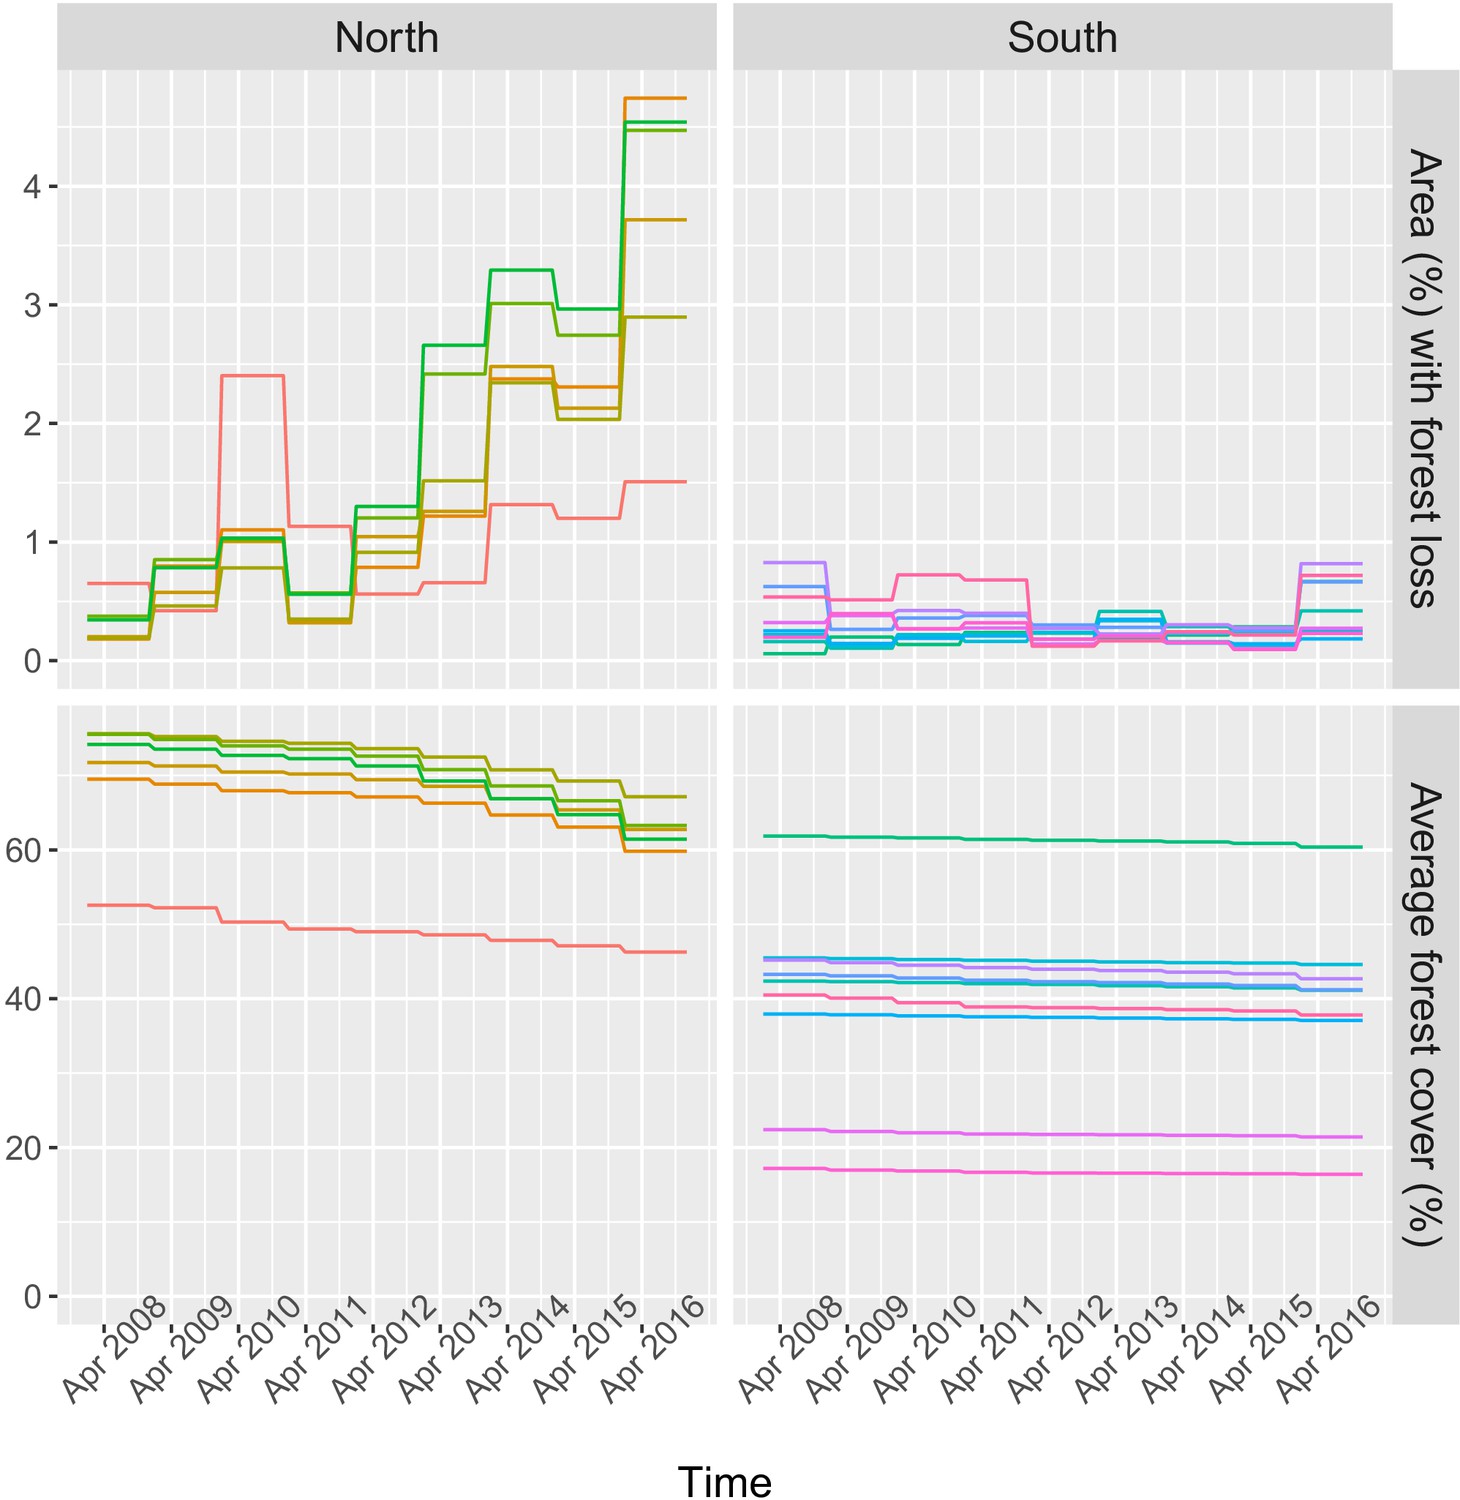
Time series of deforestation (percent area that experienced forest loss within 30 km of villages) and forest cover (average tree crow cover within 30 km of villages), for a few randomly sampled study’s villages.
Each color represents one village.
Appendix 1—figure 17
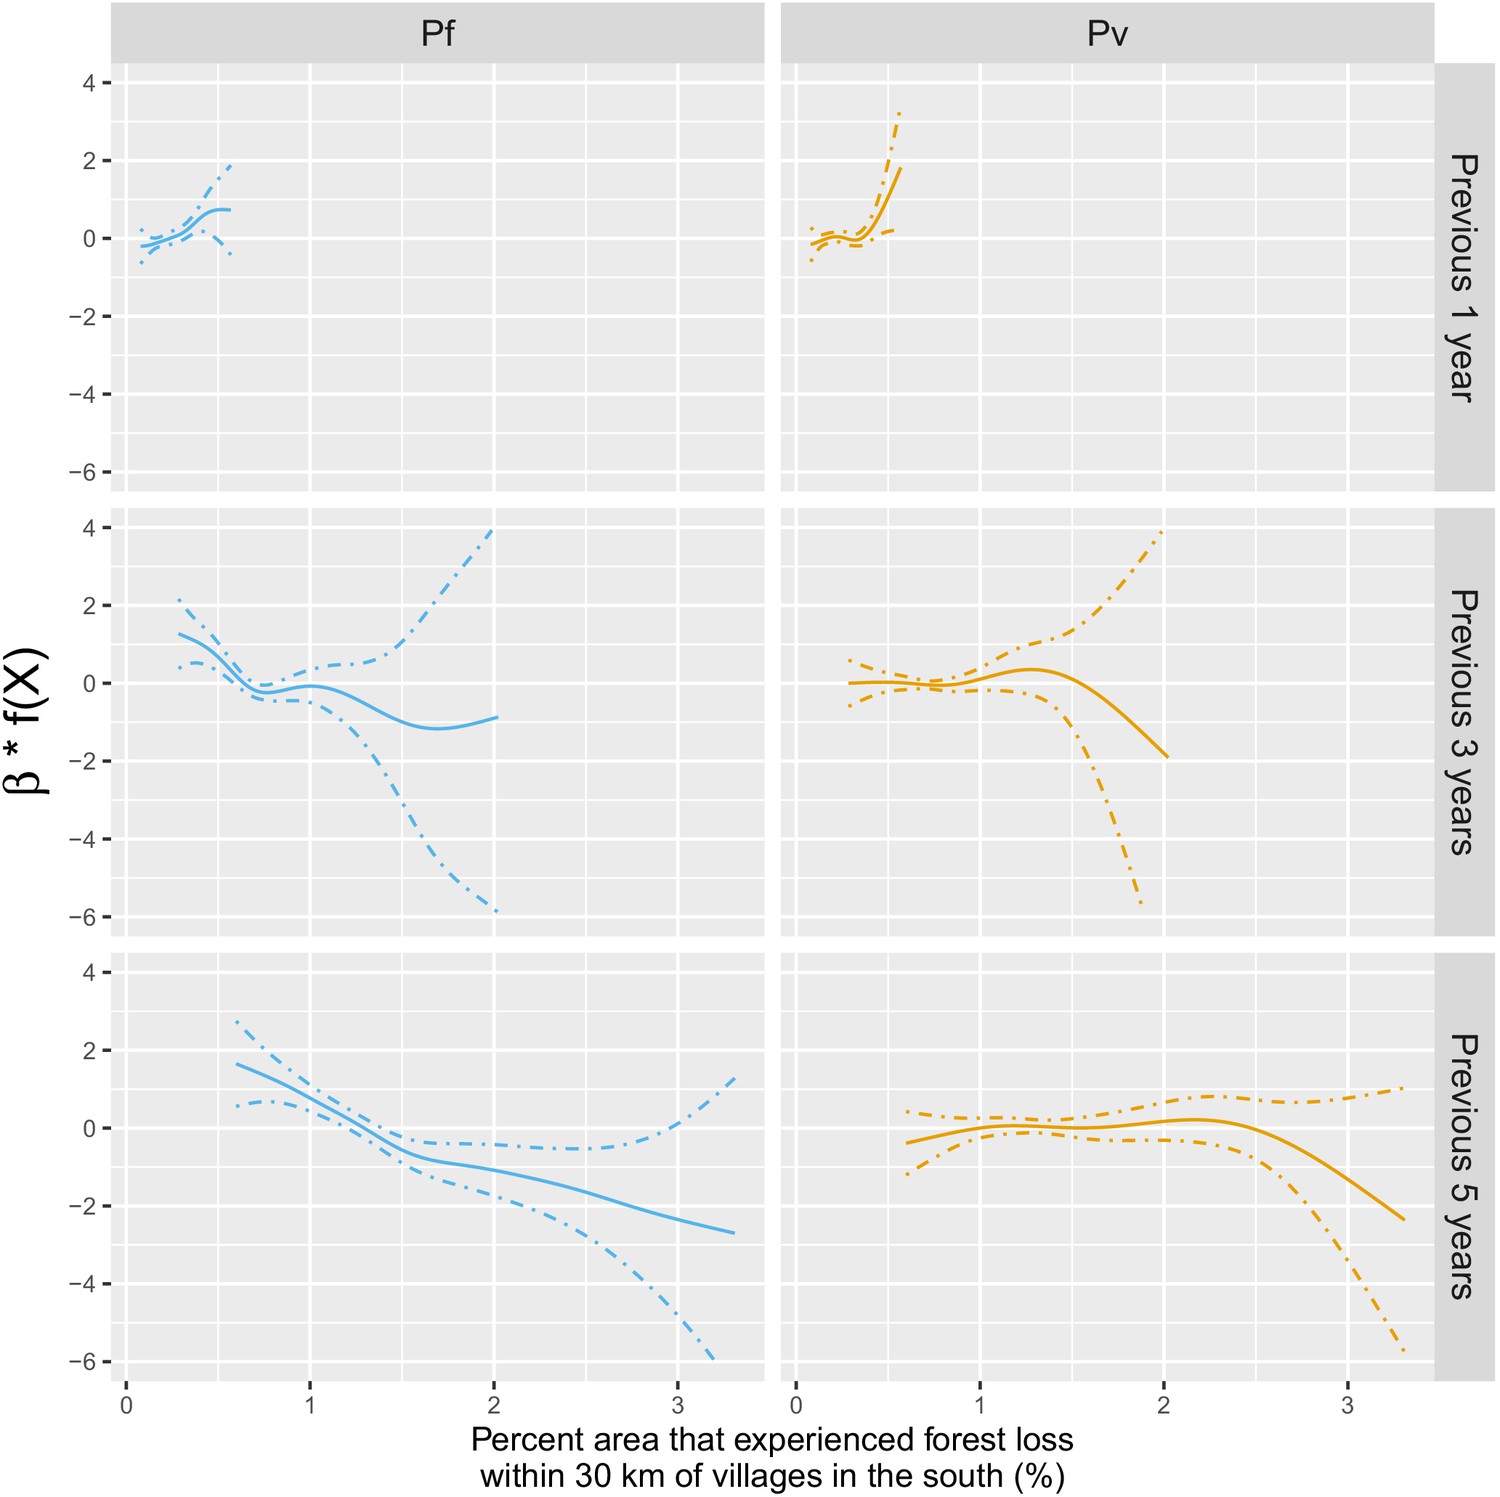
Adjusted relationship between deforestation and species-specific malaria incidence in southern Lao PDR.
All models were adjusted for environmental covariates and forest cover on top of the probability of seeking treatment, the spatio-temporal structure of the data (, and village random intercepts) and malaria incidence in the previous 1 and 2 months.
Tables
Table 1
IRR between malaria incidence and a 0.1% increase in the area that experienced deforestation within 1, 10, or 30 km (left-right) of a village in the previous 1– 5 years (top-down) in northern and southern Lao PDR.
Adjusted for the probability of seeking treatment, the spatio-temporal structure of the data, the environmental covariates selected in the model and forest cover within 30 km in the year before the deforestation temporal scale considered as well as for malaria incidence in the previous 1 and 2 years. See Materials and methods for details.
| South | North | |||||
|---|---|---|---|---|---|---|
| Time lag | Buffer radius | Buffer radius | ||||
| 1 km | 10 km | 30 km | 1 km | 10 km | 30 km | |
| Previous | 1 | 1.01 | 1.16 | 1 | 1.03 | 1.01 |
| 1 year | [0.99; 1.01] | [0.99; 1.04] | [1.10; 1.22] | [1; 1.01] | [0.99; 1.06] | [0.94; 1.08] |
| Previous | 1 | 1 | 1.08 | 1 | 1.01 | 0.99 |
| 2 years | [0.99; 1.01] | [0.98; 1.01] | [1.04; 1.13] | [1; 1.01] | [0.99; 1.04] | [0.95; 1.03] |
| Previous | 0.99 | 0.98 | 0.93 | 1 | 1.01 | 0.96 |
| 3 years | [0.99; 1] | [0.97; 1] | [0.90; 0.97] | [1; 1.01] | [0.99; 1.02] | [0.94; 0.99] |
| Previous | 0.99 | 0.98 | 0.94 | 1 | 1 | 0.97 |
| 4 years | [0.99; 1] | [0.97; 0.99] | [0.92; 0.97] | [1; 1.01] | [0.99; 1.02] | [0.94; 0.99] |
| Previous | 1 | 0.97 | 0.94 | 1 | 1.01 | 0.96 |
| 5 years | [0.99; 1] | [0.96; 0.99] | [0.91; 0.97] | [1; 1.01] | [0.99; 1.02] | [0.93; 0.98] |
-
Table 1—source data 1
Data for Table 1.
- https://cdn.elifesciences.org/articles/56974/elife-56974-table1-data1-v2.zip
Table 2
IRR between malaria incidence and a 0.1% increase in the area that experienced deforestation within 1, 10, or 30 km (left-right) of a village in the previous 1–5 years (top-down) in southern Lao PDR, differentiated by malaria species.
Adjusted for the probability of seeking treatment, the spatio-temporal structure of the data, the environmental covariates selected in the model and forest cover within 30 km in the year before the deforestation temporal scale considered as well as for malaria incidence in the previous 1 and 2 years. See Materials and methods for details.
| P. falciparum | P. vivax | |||||
|---|---|---|---|---|---|---|
| Time lag | Buffer radius | Buffer radius | ||||
| 1 km | 10 km | 30 km | 1 km | 10 km | 30 km | |
| Previous | 1 | 1.04 | 1.27 | 1 | 1 | 1.07 |
| 1 year | [0.99; 1.02] | [1.01; 1.07] | [1.18; 1.36] | [0.99; 1.01] | [0.97; 1.02] | [1.01; 1.13] |
| Previous | 1 | 1.01 | 1.15 | 1 | 1 | 1.06 |
| 2 years | [0.99; 1.01] | [0.99; 1.03] | [1.08; 1.22] | [0.99; 1.01] | [0.98; 1.01] | [1.01; 1.11] |
| Previous | 0.99 | 0.99 | 0.85 | 1 | 0.99 | 1.02 |
| 3 years | [0.98; 1] | [0.97; 1.01] | [0.80; 0.90] | [0.99; 1.01] | [0.98; 1.01] | [0.97; 1.06] |
| Previous | 0.99 | 0.98 | 0.85 | 1 | 0.99 | 1.01 |
| 4 years | [0.98; 1] | [0.96; 0.99] | [0.81; 0.88] | [0.99; 1] | [0.98; 1.01] | [0.98; 1.04] |
| Previous | 1 | 0.97 | 0.83 | 1 | 0.99 | 1.01 |
| 5 years | [0.99; 1] | [0.95; 0.98] | [0.80; 0.87] | [1; 1.01] | [0.98; 1] | [0.98; 1.04] |
-
Table 2—source data 1
Data for Table 2.
- https://cdn.elifesciences.org/articles/56974/elife-56974-table2-data1-v2.zip
Table 3
IRR between malaria incidence and a 0.1% increase in the area that experienced deforestation within 30 km of a village in the previous 1–5 years (top-down) and within areas with tree crown cover density above 0%, 68%, and 87% (left-right) in Lao PDR.
Adjusted for the probability of seeking treatment, the spatio-temporal structure of the data, the environmental covariates selected in the model and forest cover within 30 km in the year before the deforestation temporal scale considered as well as for malaria incidence in the previous 1 and 2 years. See Materials and methods for details.
| South | North | |||||
|---|---|---|---|---|---|---|
| Deforestation within areas | Deforestation within areas | |||||
| with tree crown cover density above | with tree crown cover density above | |||||
| Time lag | 0% | 68% | 87% | 0% | 68% | 87% |
| Previous | 1.16 | 1.32 | 1.28 | 1.01 | 1.04 | 1.34 |
| 1 year | [1.10; 1.22] | [1.14; 1.53] | [1; 1.64] | [0.94; 1.08] | [0.96; 1.14] | [0.99; 1.81] |
| Previous | 1.08 | 1.18 | 1.35 | 0.99 | 0.98 | 0.94 |
| 2 years | [1.04; 1.13] | [1.08; 1.28] | [1.15; 1.59] | [0.95; 1.09] | [0.93; 1.03] | [0.80; 1.11] |
| Previous | 0.93 | 0.93 | 0.89 | 0.96 | 0.96 | 0.86 |
| 3 years | [0.90; 0.97] | [0.89; 0.97] | [0.81; 0.99] | [0.94; 0.99] | [0.92; 0.99] | [0.76; 0.98] |
| Previous | 0.94 | 0.94 | 0.87 | 0.97 | 0.96 | 0.87 |
| 4 years | [0.92; 0.97] | [0.91; 0.97] | [0.80; 0.94] | [0.94; 0.99] | [0.93; 0.99] | [0.78; 0.96] |
| Previous | 0.94 | 0.93 | 0.83 | 0.96 | 0.95 | 0.83 |
| 5 years | [0.91; 0.97] | [0.90; 0.96] | [0.76; 0.90] | [0.93; 0.98] | [0.92; 0.98] | [0.75; 0.92] |
-
Table 3—source data 1
Data for Table 3.
- https://cdn.elifesciences.org/articles/56974/elife-56974-table3-data1-v2.zip
Appendix 1—table 1
Data used to parameterized the transition matrix with the travel speed between any two adjacent pixels of the map.
| Data layer | Category | Speed (km/h) |
|---|---|---|
| Digital elevation (slope) | 0°(flat) | 5 |
| 5°(uphill) | 3.71 | |
| −5°(downhill) | 5.27 | |
| Land cover | Cropland | No adjustment |
| Artificial and bare areas | No adjustment | |
| Open deciduous forest | 0.8 * Hiking speed | |
| Sparse herbaceous | 0.8 * Hiking speed | |
| Closed deciduous forest | 0.6 * Hiking speed | |
| Herbaceous | 0.6 * Hiking speed | |
| Flooded | 0.5 * Hiking speed | |
| Other forest cover | 0.4 * Hiking speed | |
| Water | 0.2 * Hiking speed | |
| Roads and rivers | Motorway/trunk | 80 |
| Primary/secondary | 60 | |
| Tertiary/unclassified | 10 | |
| Major rivers | 5 |
Appendix 1—table 2
IRR associated with a 0.1% increase in forest loss.
Adjusted for the spatio-temporal structure of the data, the environmental covariates selected in the model and forest cover within 30 km in the year before the deforestation temporal scale considered and malaria incidence in the previous 1 and 2 months. See Materials and methods for details. Sensitivity analysis: village population unadjusted for probability of seeking treatment.
| South | North | |||||
|---|---|---|---|---|---|---|
| Time lag | Buffer radius | Buffer radius | ||||
| 1 km | 10 km | 30 km | 1 km | 10 km | 30 km | |
| Previous | 1 | 1.01 | 1.16 | 1 | 1.03 | 1.01 |
| 1 year | [0.99; 1.01] | [0.99; 1.04] | [1.10; 1.22] | [1; 1.01] | [1; 1.07] | [0.94; 1.08] |
| Previous | 1 | 1 | 1.09 | 1 | 1.01 | 0.98 |
| 2 years | [0.99; 1.01] | [0.98; 1.01] | [1.04; 1.13] | [1; 1.01] | [0.99; 1.04] | [0.94; 1.01] |
| Previous | 0.99 | 0.98 | 0.93 | 1 | 1.01 | 0.96 |
| 3 years | [0.99; 1] | [0.97; 1] | [0.90; 0.97] | [1; 1.01] | [0.99; 1.02] | [0.93; 0.99] |
| Previous | 0.99 | 0.98 | 0.94 | 1 | 1 | 0.97 |
| 4 years | [0.99; 1] | [0.97; 0.99] | [0.92; 0.97] | [1; 1.01] | [0.99; 1.02] | [0.94; 0.99] |
| Previous | 1 | 0.97 | 0.94 | 1 | 1.01 | 0.95 |
| 5 years | [0.99; 1] | [0.96; 0.99] | [0.91; 0.97] | [1; 1.01] | [0.99; 1.02] | [0.93; 0.98] |
Appendix 1—table 3
IRR [95% CI] associated with a 1% increase in average tree crown density.
Adjusted for the probability of seeking treatment, the spatio-temporal structure of the data, the environmental covariates selected in the model and malaria incidence in the previous 1 and 2 months. See Materials and methods for details.
| South | North | |||||
|---|---|---|---|---|---|---|
| Time lag | Buffer radius | Buffer radius | ||||
| 1 km | 10 km | 30 km | 1 km | 10 km | 30 km | |
| Current | 1 | 1.07 | 1.06 | 0.99 | 1.01 | 1.10 |
| year | [0.99; 1.01] | [1.04; 1.10] | [1; 1.12] | [0.97; 1.02] | [0.96; 1.05] | [0.99; 1.23] |
| Previous | 1 | 1.07 | 1.09 | 1 | 1.01 | 1.12 |
| 1 year | [0.99; 1.02] | [1.05; 1.10] | [1.03; 1.15] | [0.97; 1.02] | [0.97; 1.06] | [0.99; 1.26] |
| Previous | 1 | 1.07 | 1.09 | 1 | 1.02 | 1.10 |
| 2 years | [0.99; 1.02] | [1.05; 1.10] | [1.03; 1.16] | [0.98; 1.03] | [0.97; 1.06] | [0.98; 1.25] |
| Previous | 1 | 1.07 | 1.10 | 1.01 | 1.02 | 1.10 |
| 3 years | [0.99; 1.02] | [1.04; 1.10] | [1.04; 1.16] | [0.98; 1.03] | [0.97; 1.07] | [0.98; 1.24] |
Appendix 1—table 4
AIC fit of univariate models when including each of the seven monthly climatic variation one at a time as unique covariate in equation 2, solely adjusted for the probability of seeking treatment, the spatio-temporal structure of the data (, and village random intercepts).
AIC selected are in bold.
| Outcome model | ||||
|---|---|---|---|---|
| South | North | South P. falciparum | South P. vivax | |
| Day temperature | ||||
| Current month | 18,546 | 1671 | 13,226 | 14,575 |
| Previous month | 18,556 | 1702 | 13,224 | 14,590 |
| 2 months ago | 18,578 | 1669 | 13,249 | 14,594 |
| 3 months ago | 18,559 | 1672 | 13,232 | 14,593 |
| Over current and previous month | 18,556 | 1670 | 13,231 | 14,583 |
| Over current and previous 2 months | 18,570 | 1670 | 13,248 | 14,588 |
| Over current and previous 3 months | 18,573 | 1680 | 13,249 | 14,592 |
| Night temperature | ||||
| Current month | 18,413 | 1669 | 13,120 | 14,474 |
| Previous month | 18,453 | 1670 | 13,155 | 14,520 |
| 2 months ago | 18,547 | 1673 | 13,231 | 14,576 |
| 3 months ago | 18,581 | 1672 | 13,251 | 14,596 |
| Over current and previous month | 18,296 | 1664 | 13,044 | 14,397 |
| Over current and previous 2 months | 18,263 | 1669 | 13,014 | 14,385 |
| Over current and previous 3 months | 18,262 | 1663 | 13,007 | 14,385 |
| Precipitation | ||||
| Current month | 18,532 | 1693 | 13,198 | 14,593 |
| Previous month | 18,520 | 1669 | 13,181 | 14,575 |
| 2 months ago | 18,538 | 1658 | 13,207 | 14,594 |
| 3 months ago | 18,579 | 1664 | 13,243 | 14,596 |
| Over current and previous month | 18,570 | 1672 | 13,239 | 14,596 |
| Over current and previous 2 months | 18,543 | 1670 | 13,187 | 14,590 |
| Over current and previous 3 months | 18,555 | 1674 | 13,212 | 14,591 |
Additional files
-
Source code 1
Code for Figure 2.
- https://cdn.elifesciences.org/articles/56974/elife-56974-code1-v2.zip
-
Source code 2
Code for Figure 3.
- https://cdn.elifesciences.org/articles/56974/elife-56974-code2-v2.zip
-
Source code 3
Code for Figure 4.
- https://cdn.elifesciences.org/articles/56974/elife-56974-code3-v2.zip
-
Source code 4
Code for Figure 5.
- https://cdn.elifesciences.org/articles/56974/elife-56974-code4-v2.zip
-
Transparent reporting form
- https://cdn.elifesciences.org/articles/56974/elife-56974-transrepform-v2.pdf
Download links
A two-part list of links to download the article, or parts of the article, in various formats.
Downloads (link to download the article as PDF)
Open citations (links to open the citations from this article in various online reference manager services)
Cite this article (links to download the citations from this article in formats compatible with various reference manager tools)
Spatio-temporal associations between deforestation and malaria incidence in Lao PDR
eLife 10:e56974.
https://doi.org/10.7554/eLife.56974


