m6A RNA methylation impacts fate choices during skin morphogenesis
- Howard Hughes Medical Institute, Robin Chemers Neustein Laboratory of Mammalian Cell Biology and Development, The Rockefeller University, United States
- Bioinformatics Resource Center, The Rockefeller University, United States
- Electron Microscopy Resource Center, The Rockefeller University, United States
- Department of Pharmacology, Weill Cornell Medicine, Cornell University, United States
Figures
Figure 1 with 1 supplement
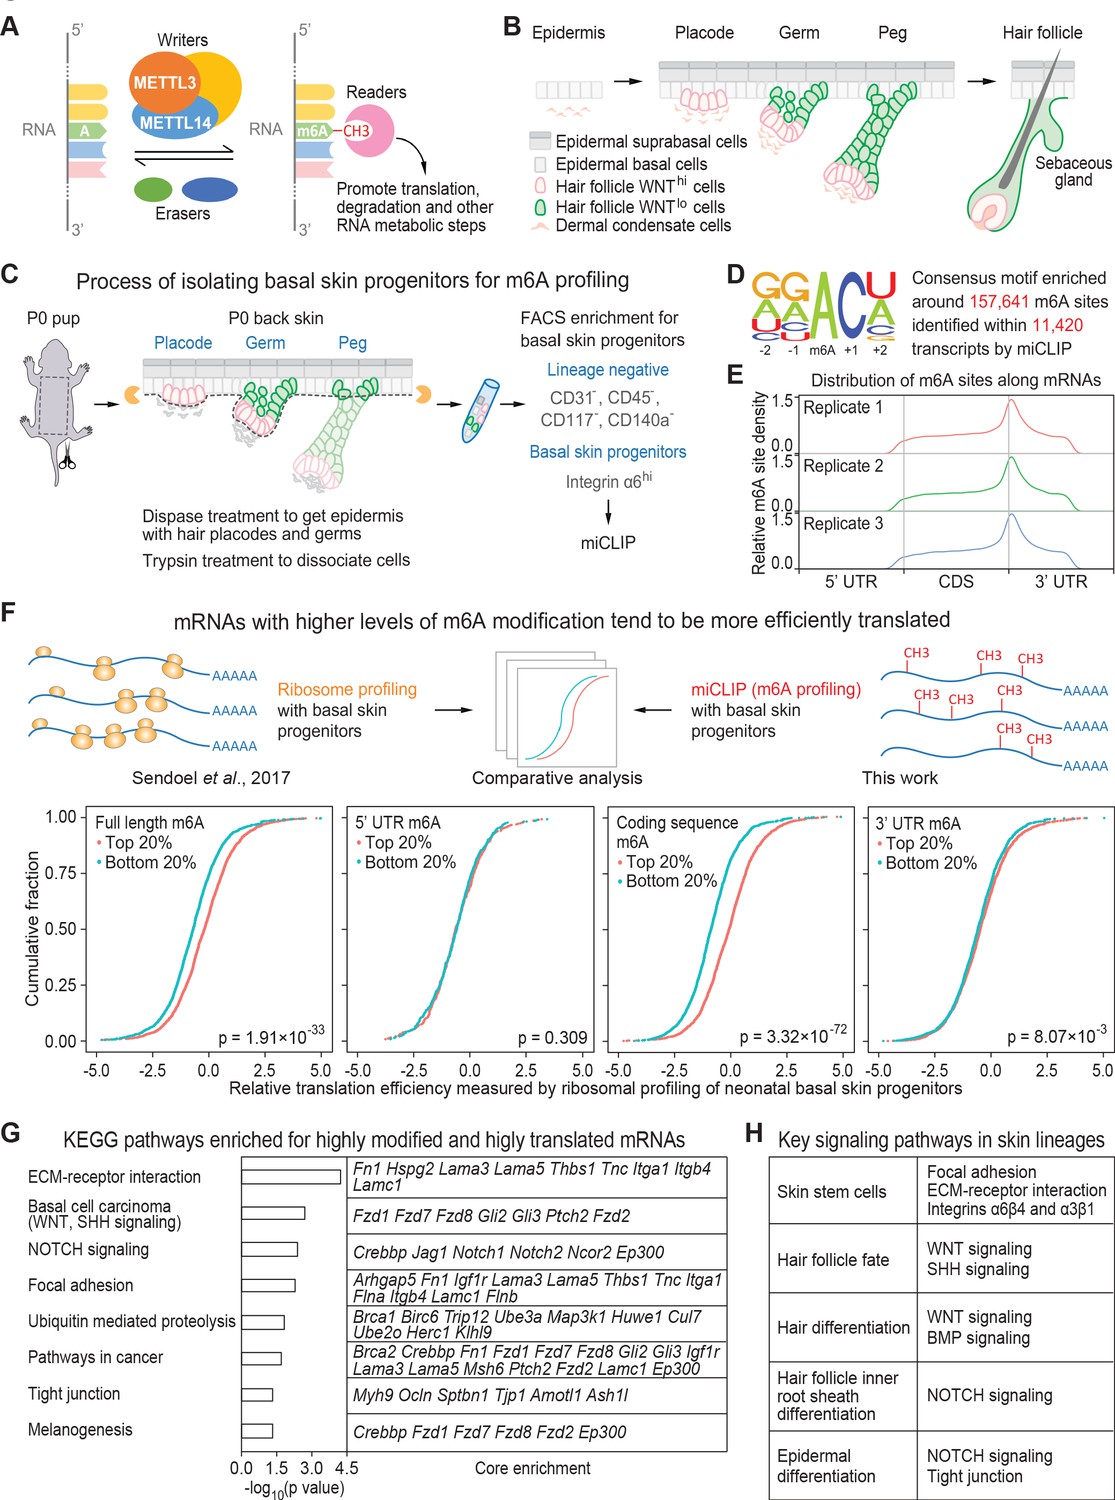
miCLIP and ribosomal profiling analyses of the mouse skin epithelial progenitors.
(A) Schematic depicting the major factors involved in regulating the cellular dynamics of m6A modification. (B) Schematic depicting embryonic development of mammalian epithelial skin progenitors. WNThi/lo implies cells that show strong WNT or low WNT signaling as judged by Axin2-LacZ transgene expression (Matos et al., 2020). HF morphogenesis occurs in temporal waves, with mature HFs emerging shortly after birth. (C) Schematic depicting the process for enzymatically isolating epithelial progenitors from mouse skin at age P0. For miCLIP, cells were subjected to FACS purification as described in the Materials and methods. (D) Consensus sequence motif enriched around miCLIP-identified m6A sites in P0 skin progenitor mRNAs. (E) Metagene plots depicting the distribution of miCLIP-identified m6A sites along mRNAs. Data from three independent replicates are shown. (F) Schematic depicts comparison of the miCLIP data, which measures m6A modification to the ribosome profiling data, which landscapes bound ribosomes on neonatal skin progenitor mRNAs. The empirical cumulative distribution function (ECDF) plots compare the relative mRNA translation efficiency of the top 20% and bottom 20% of m6A-modified mRNAs. The data reveal that transcripts with higher levels of m6A modification (assessed by the sum of normalized-to-input uTPM value of m6A along the full-length transcript) tend to have higher levels of translation efficiency. The correlation between translation efficiency and the sum of normalized-to-input uTPM value of m6A at different regions of the mRNAs (5’ UTR, coding sequence, 3’ UTR) shows that the coding sequence m6A gives the best correlation to translation efficiency. The p values were calculated through Wilcoxon rank sum test. (G) GSEA of the overlap between mRNAs that are the top 20% heavily m6A-modified in coding sequence (assessed by the sum of normalized-to-input uTPM value of m6A along coding sequence) and the top 20% most efficiently translated mRNAs (assessed by ribosome profiling). Shown are the top eight enriched KEGG signaling pathways, each of which has a p value <0.05 and >5 enriched mRNAs. (H) Pathways known to play essential roles in regulating skin lineage specification.
Figure 1—figure supplement 1
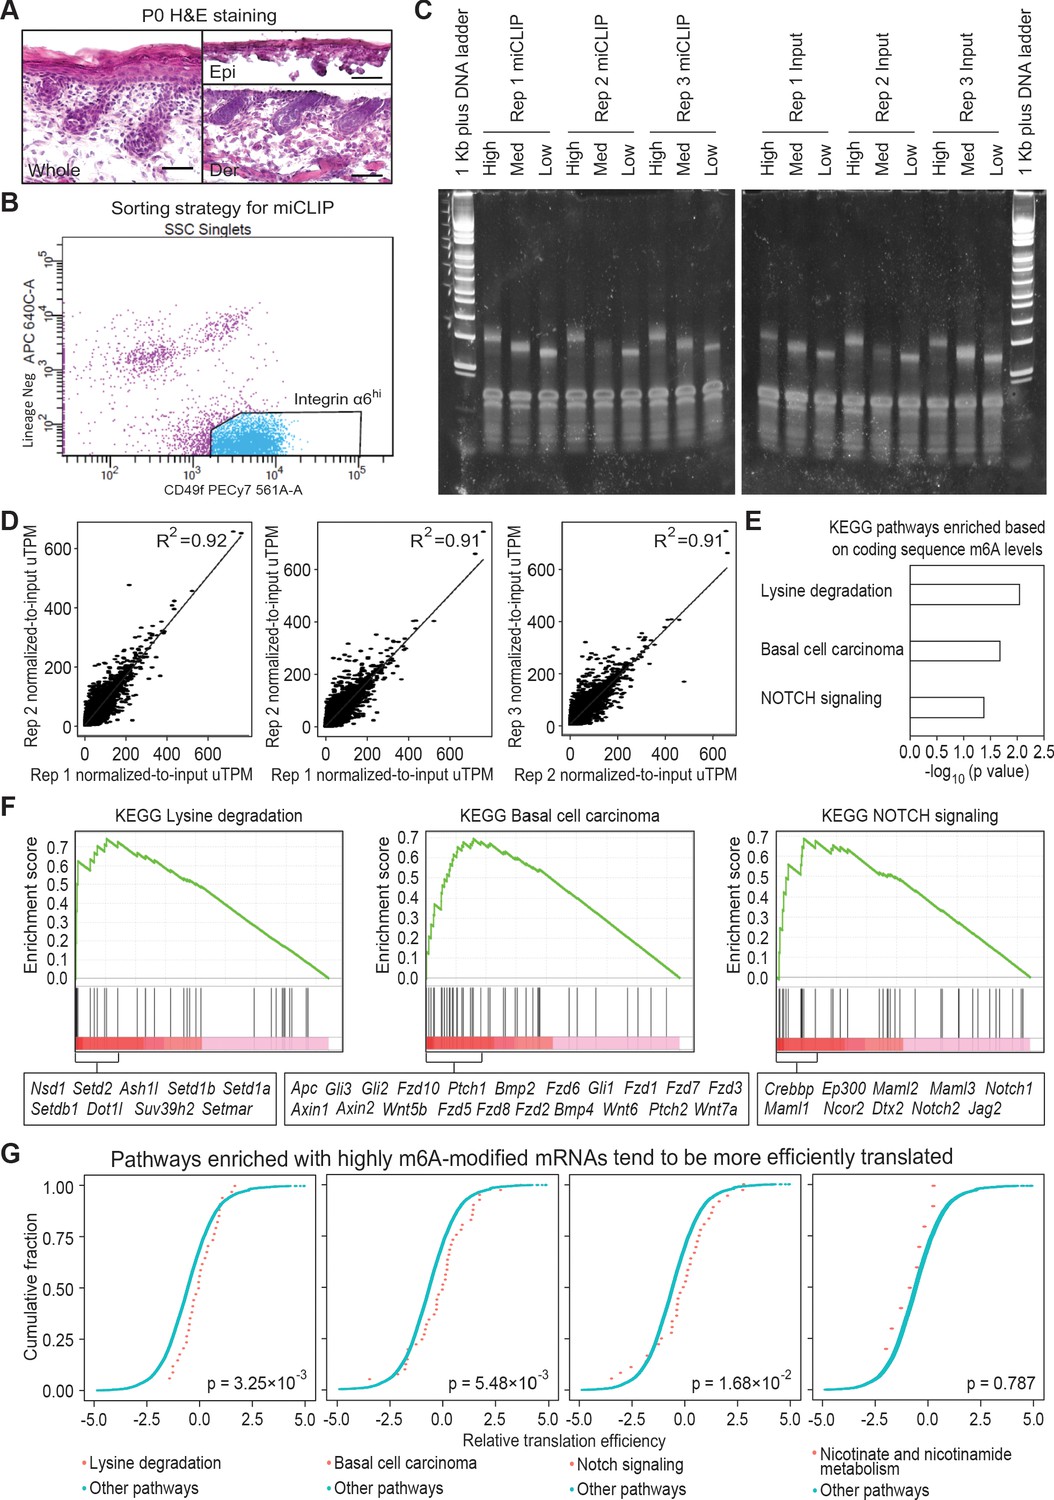
miCLIP experiment setup and correlation analysis.
(A) Hematoxylin and eosin (H and E) stained sagittal sections of wild-type P0 back skin before and after dispase treatment (scale bars: 50 µm). (B) Sorting strategy to isolate basal skin progenitors for miCLIP analysis. Live (DAPI-) cell singlets were gated upon the lineage negative markers and integrin α6 (CD49f) signals to get the integrin α6 high population, which is collected for RNA isolation. (C) TBE-acrylamide gel examining PCR-amplified libraries of miCLIP and corresponding input samples. The cDNA library of each sample is separated based on fragment size as High, Med and Low. Individual PCR reactions were set up to get best optimization for each specific range of fragment size. (D) Correlation analysis of the normalized-to-input miCLIP uTPM among the three biological replicates. (E) GSEA of mRNAs based on the sum of normalized-to-input uTPM value of m6A along coding sequence. Shown are the top three enriched KEGG signaling pathways, each with a p value <0.05. Note that in contrast to Figure 1, all mRNAs were analyzed, rather than analyzing only the overlap between the top 20% modified mRNAs and the top 20% efficiently translated mRNAs. (F) Enrichment plots of the selected KEGG signaling pathways from total m6A mRNA analysis. Genes with core enrichment of the pathways are listed beneath the plots. (G) ECDF plots of translation efficiency of mRNAs in the selected KEGG signaling pathways versus those in other pathways. The three pathways highlighted in (E) and (F) enriched with heavily modified mRNAs tend to be more efficiently translated. Note that a control pathway without enriching mRNAs containing high m6A in coding sequence (nicotinate and nicotinamide metabolism), does not show such a trend. The p values were calculated through Wilcoxon rank sum test.
Figure 2 with 2 supplements
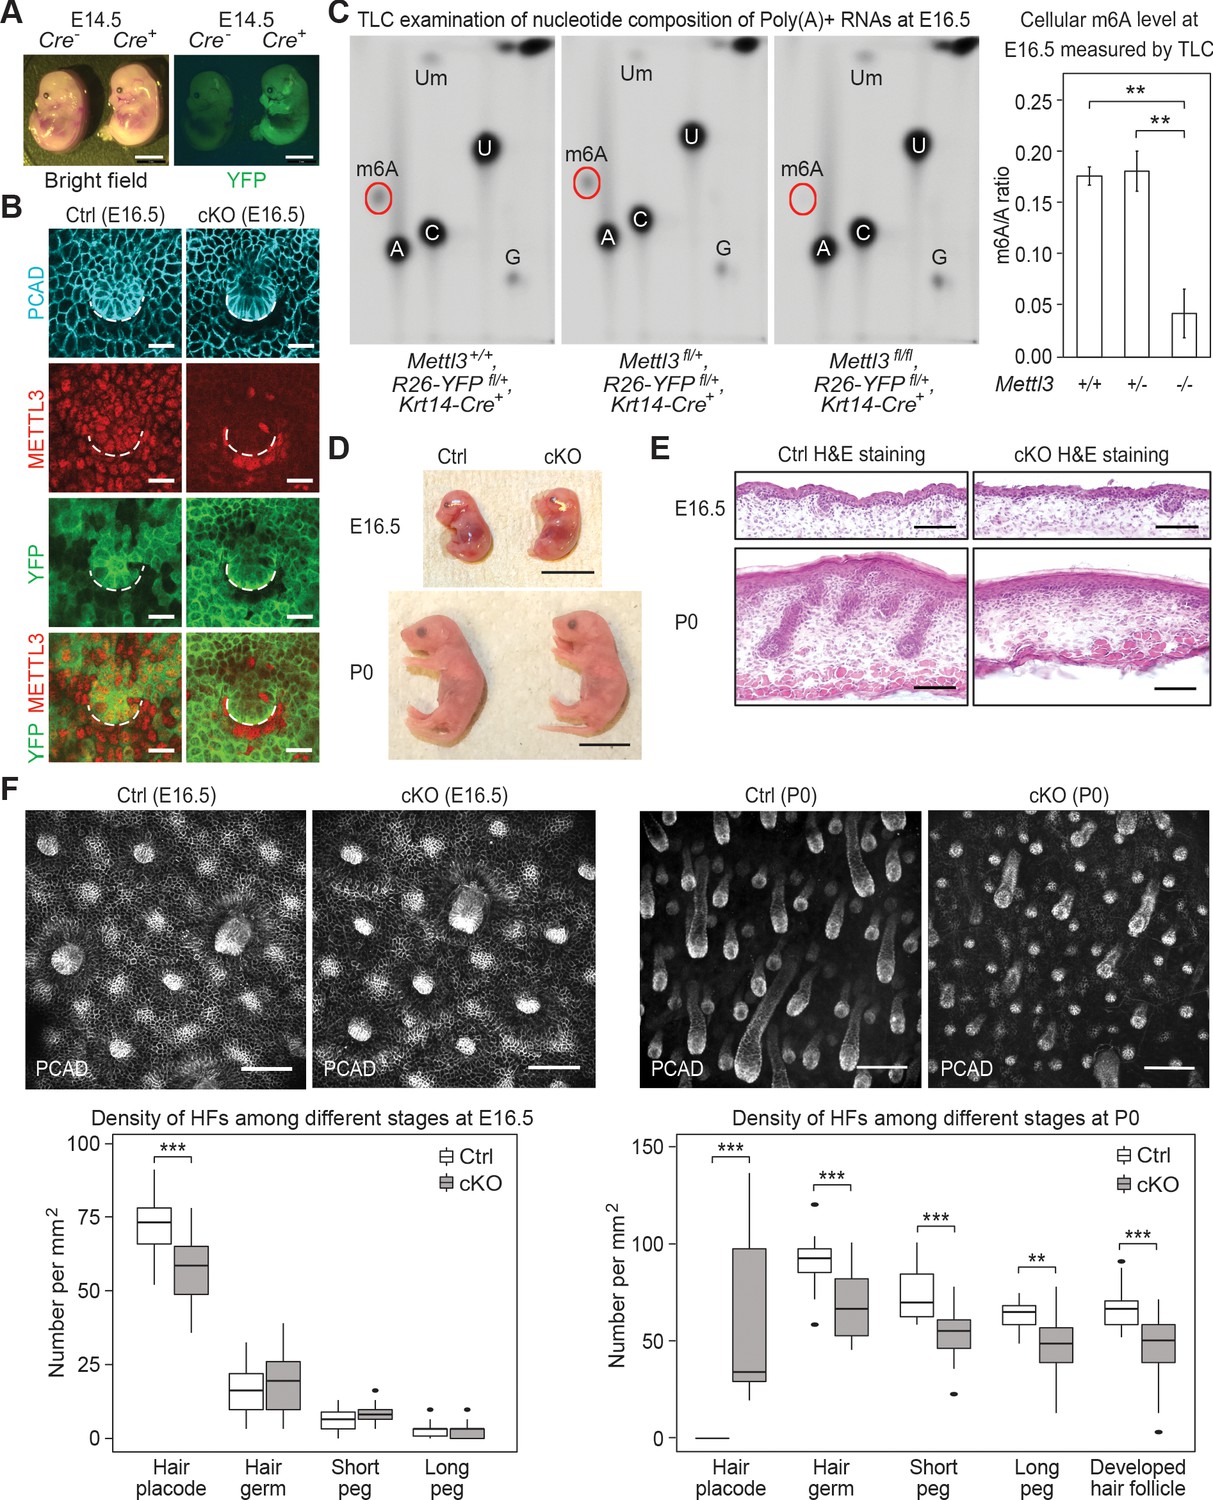
Krt14-Cre driven conditional Mettl3 knockout mice display severe defects in HF morphogenesis.
(A) Representative pictures of Krt14-Cre-/-, Rosa26-YFPfl/+ and Krt14-Cre+/-, Rosa26-YFPfl/+ littermate embryos demonstrating the onset of uniform YFP expression in the E14.5 skin epithelium (scale bars: 2 mm). (B) Confocal images of E16.5 whole-mount back skin immunolabeled for P-cadherin (PCAD), METTL3 and YFP (scale bars: 20 µm). Note that nuclear METTL3 immunofluorescence is selectively depleted from the YFP+ cells in cKO skin. White dashed lines denote the dermal-epidermal border. (C) Left panel: representative pictures of thin layer chromatography (TLC) on Poly(A)+ RNA samples isolated from E16.5 skin epithelial cells. Right panel: quantification of m6A levels based on TLC (error bars: standard deviation, for Mettl3+/+ n = 2 biological replicates, for each of the other conditions n = 3 biological replicates, **p<0.01 by unpaired two-tailed Student’s t-test). (D) Representative pictures of E16.5, P0 control and cKO littermates (scale bars: 1 cm). (E) Hematoxylin and eosin (H and E) stained back skin sagittal sections at indicated time points (scale bars: 100 µm). (F) Confocal images of whole-mount back skin immunolabeled for PCAD at indicated time points (scale bars: 100 µm) and quantification of HFs at different developmental stages (for E16.5, n = 3 biological replicates ×10 images per replicate and for P0, n = 18 images from four biological replicates, **p<0.01 and ***p<0.001 by unpaired two-tailed Student’s t-test).
-
Figure 2—source data 1
Quantification of m6A/A ratio through TLC signals in (C).
- https://cdn.elifesciences.org/articles/56980/elife-56980-fig2-data1-v2.xlsx
-
Figure 2—source data 2
Quantification of HF density in (F).
- https://cdn.elifesciences.org/articles/56980/elife-56980-fig2-data2-v2.xlsx
Figure 2—figure supplement 1
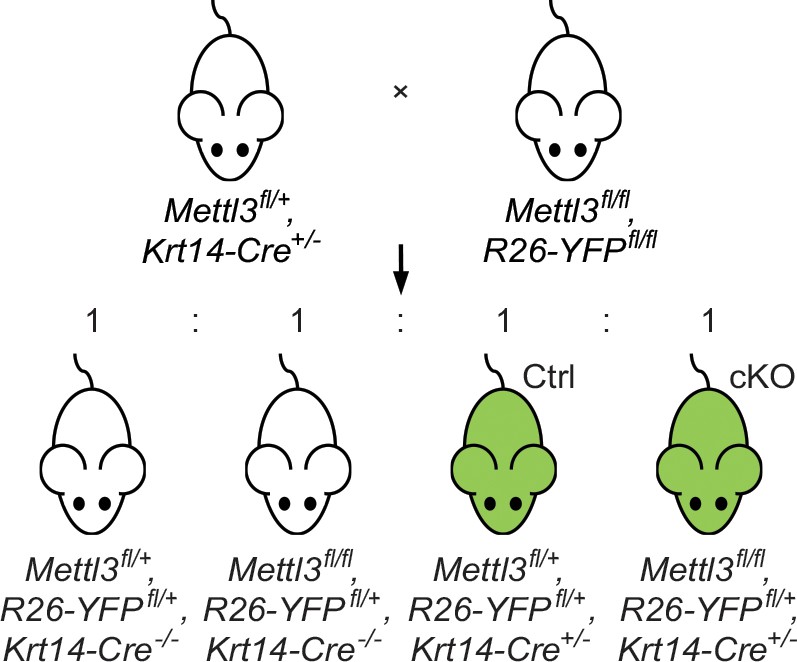
Breeding strategy to generate the Mettl3 cKO animals and the control (Ctrl) littermates.
By mating the Mettl3+/fl, K14-Cre+/- and Mettl3fl/fl, Rosa26-YFPfl/fl breeders, we got offspring with 4 kinds of genotypes being born at Mendel’s ratio, among which Mettl3+/fl, Rosa26-YFP+/fl, K14-Cre+/- and Mettl3fl/fl, Rosa26-YFP+/fl, K14-Cre+/- littermates were used as control (Ctrl) and conditional knockout (cKO) objects for our study.
Figure 2—figure supplement 2
Additional information on the Mettl3 cKO phenotypes.
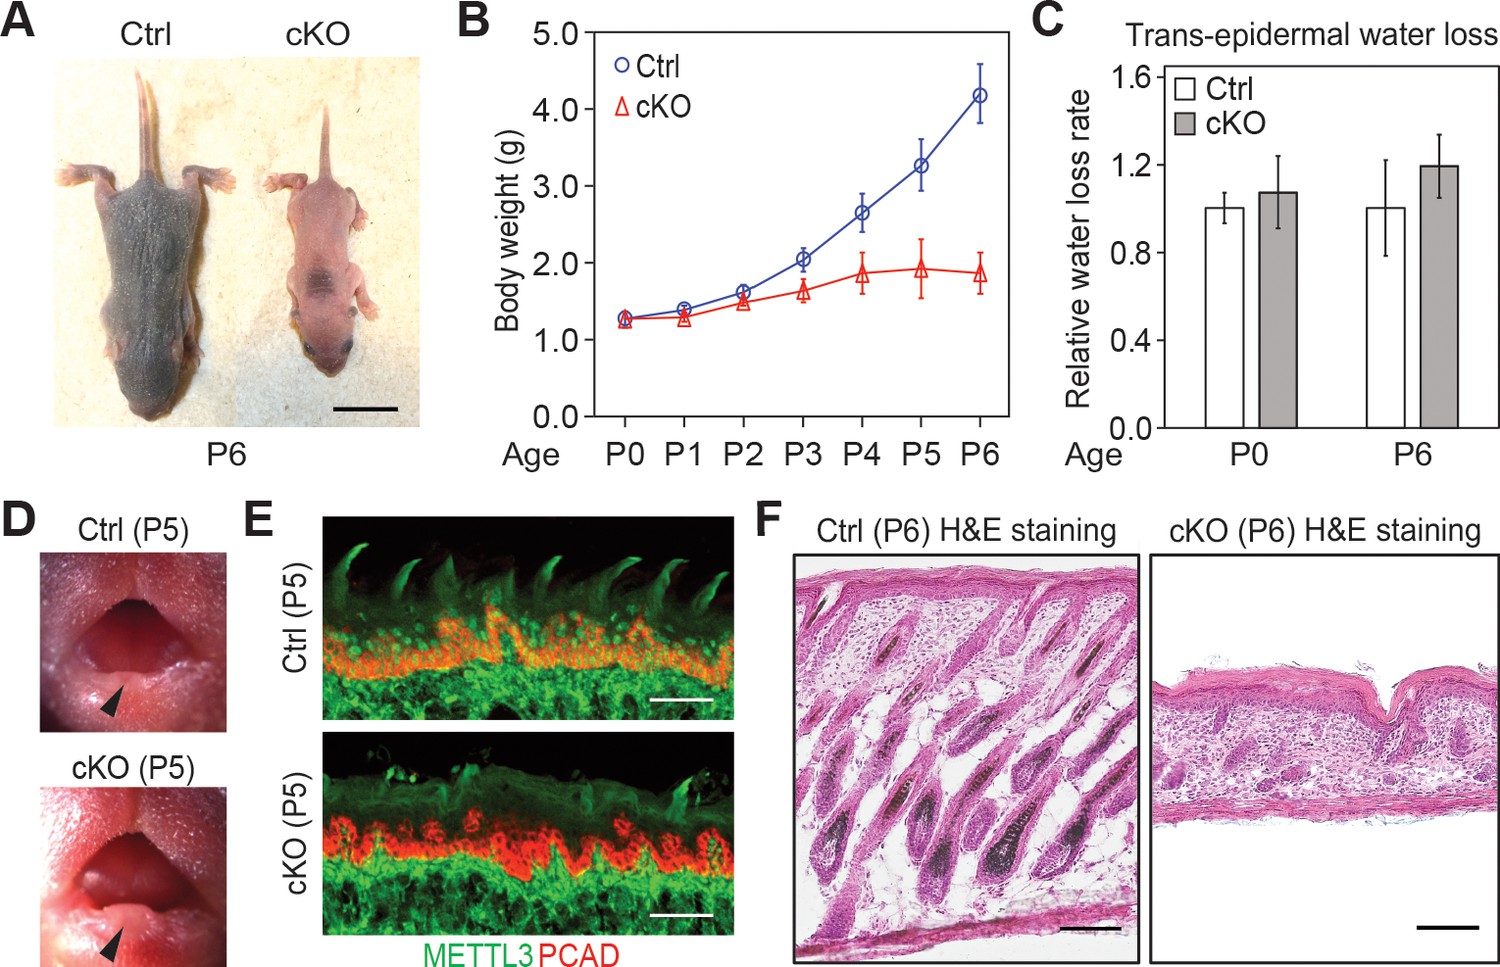
(A) Representative pictures of P6 control and cKO littermates (scale bars: 1 cm). (B) Quantification of body weights of control and cKO littermates (error bars: standard deviation, for each condition n = 5 biological replicates from three litters). (C) Measurements of TEWL (error bars: standard deviation, for each condition n = 4 biological replicates, for the comparison between control and cKO at each time point, p>0.05 by unpaired two-tailed Student’s t-test). (D) Representative pictures of P5 pups’ mouths demonstrating the growth of the teeth (black arrows). (E) Images of P5 tongue sagittal sections immunolabeled for METTL3 and PCAD demonstrating the tongue surface of the Mettl3 cKO animals tends to be smoother than that of the control animals, which suggests filiform papillae are not well-formed in the cKO animals (scale bars: 50 µm). (F) Hematoxylin and eosin (H and E) stained P6 back skin sagittal sections (scale bars: 100 µm).
-
Figure 2—figure supplement 2—source data 1
Quantification of neonates' body weights in (B).
- https://cdn.elifesciences.org/articles/56980/elife-56980-fig2-figsupp2-data1-v2.xlsx
-
Figure 2—figure supplement 2—source data 2
Quantification of TEWL in (C).
- https://cdn.elifesciences.org/articles/56980/elife-56980-fig2-figsupp2-data2-v2.xlsx
Figure 3 with 1 supplement
Loss of m6A results in diminished WNT signaling and signs of perturbed HF fate.
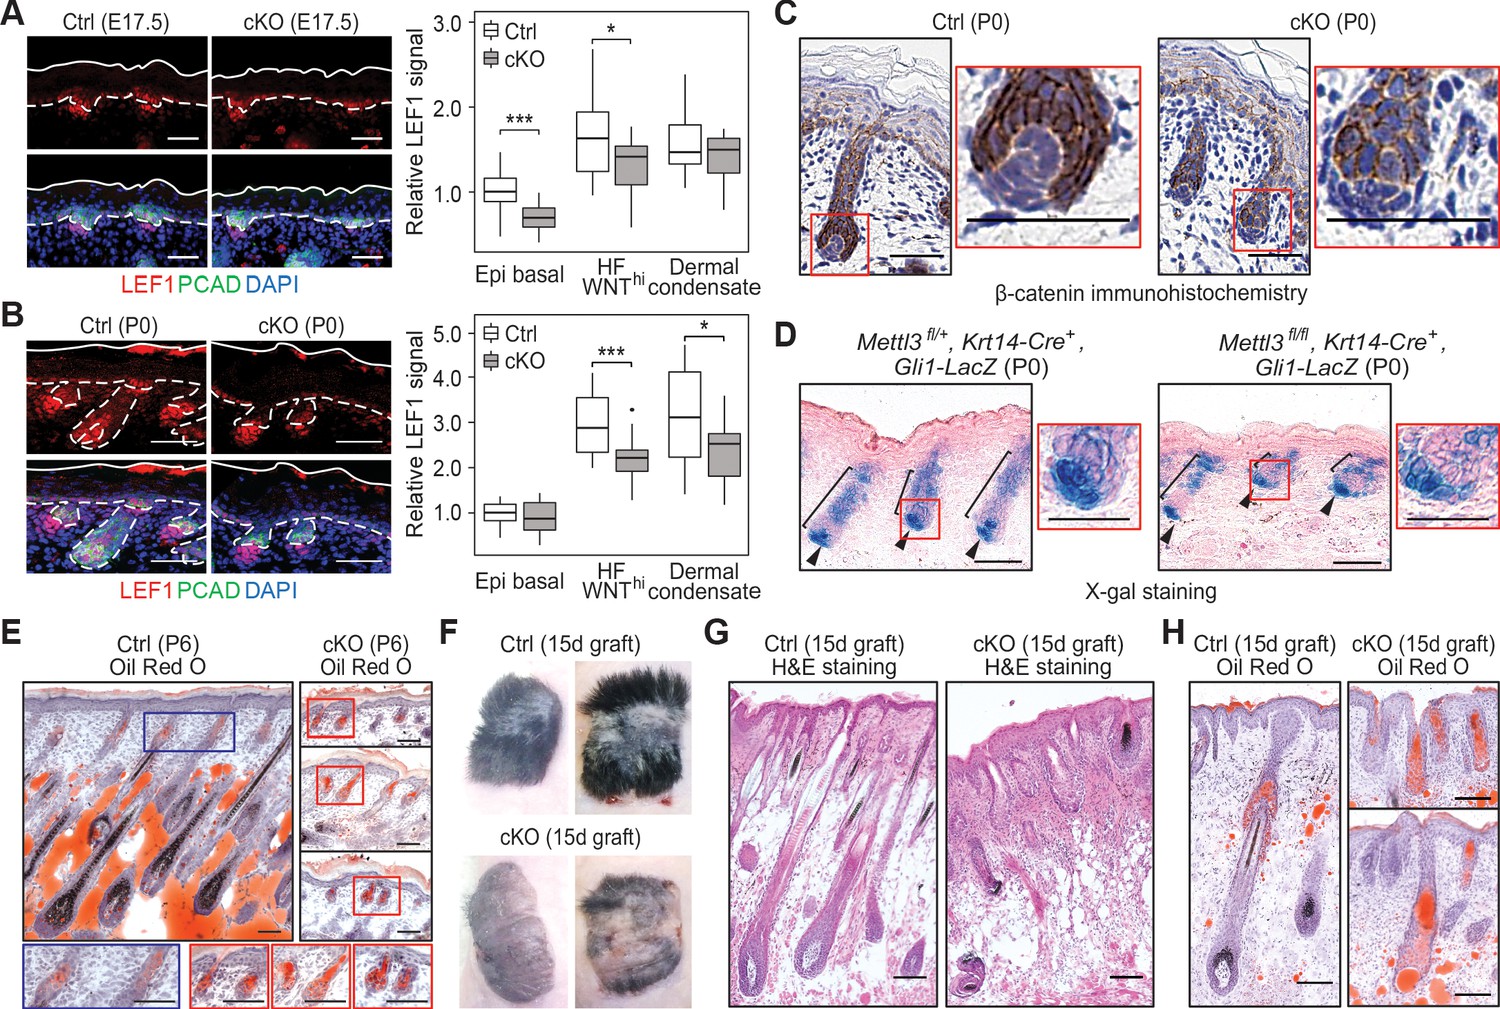
(A) Left panel: representative images from E17.5 sagittal sections immunolabeled for LEF1 and PCAD (scale bars: 50 µm). White solid lines denote skin surface and dashed lines denote dermal-epidermal border. Right panel: quantification of LEF1 immunofluorescence at indicated compartments (for each condition n = 3 biological replicates ×7 images per replicate, *p<0.05 and ***p<0.001 by unpaired two-tailed Student’s t-test). (B) Left panel: representative images from P0 sagittal sections immunolabeled for LEF1 and PCAD (scale bars: 50 µm). Solid and dashed lines as in (A). Right panel: quantifications of LEF1 immunofluorescence in indicated compartments (for each condition n = 3 biological replicates ×7 images per replicate, *p<0.05 and ***p<0.001 by unpaired two-tailed Student’s t-test). (C) Representative images from P0 sagittal sections with immunohistochemistry staining of β-catenin, counter-stained with hematoxylin (scale bars: 50 µm). (D) Representative images from P0 sagittal sections stained with X-gal and nuclear fast red to examine the expression of the Gli1-LacZ transgene, a proxy for SHH signaling (scale bars: 100 µm). (E) Representative images from P6 sagittal sections stained with Oil Red O and counterstained with hematoxylin to visualize signs of HF to sebocyte fate switching within the epithelium (scale bars: 100 µm). The staining in the control dermis reflects adipocyte-derived lipids, missing in the cKO pups, which lose weight after birth. (F) Representative pictures of control (Ctrl) and cKO back skins engrafted onto Nude (Nu/Nu) mice and analyzed 15 days later. (G) Representative Hematoxylin and eosin (H and E) stained sagittal sections of 15-dayengrafted back skins (scale bars: 100 µm). (H) Representative sagittal sections as in (G) and counterstained with Oil Red O and hematoxylin (scale bars: 100 µm).
-
Figure 3—source data 1
Quantification of LEF1 immunofluorescence signals at E17.5 in (A).
- https://cdn.elifesciences.org/articles/56980/elife-56980-fig3-data1-v2.xlsx
-
Figure 3—source data 2
Quantification of LEF1 immunofluorescence signals at P0 in (B).
- https://cdn.elifesciences.org/articles/56980/elife-56980-fig3-data2-v2.xlsx
Figure 3—figure supplement 1
Examination of METTL3 and YFP expression in the grafted skin.
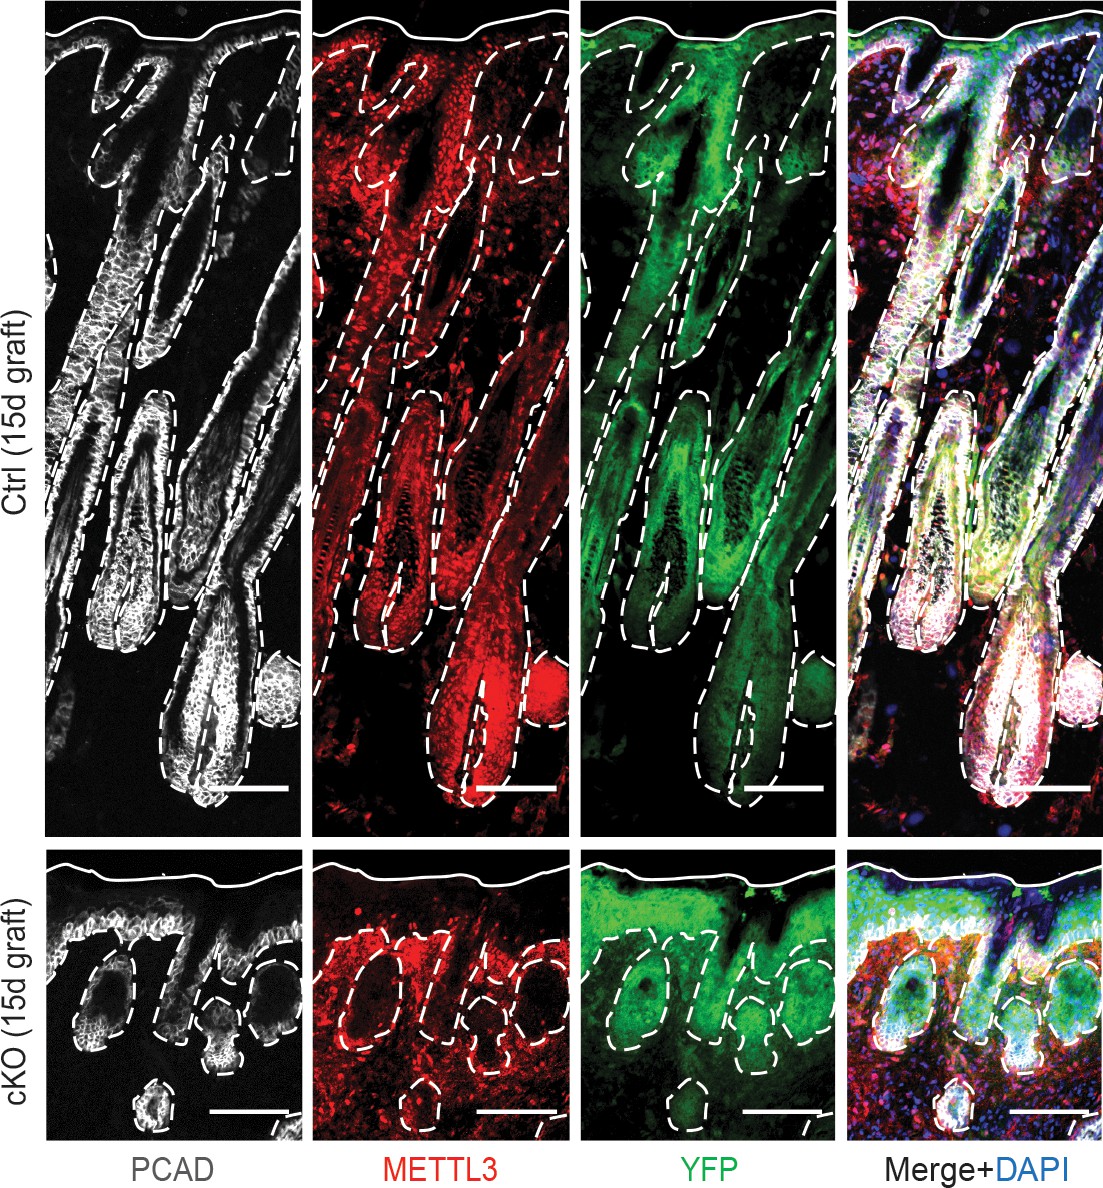
Images of back skin engrafted to Nude (Nu/Nu) mice for 15 days immunolabeled for PCAD, METTL3 and YFP demonstrating in the grafted tissue METTL3 is still largely depleted in the cKO epithelium (scale bars: 100 µm). White solid lines indicate skin surface and dashed lines indicate epithelial-dermal border.
Figure 4 with 1 supplement

Perturbations in WNT-driven dermal papilla engulfment and in actin-mediated cellular polarity within Mettl3 cKO HFs.
(A) Ultrastructure of HF in control and Mettl3 cKO mice in P0 back skin. Matrix (Mx) cells engulf the dermal papilla (DP, colored in pink) in the control HF but often fail to do so in the cKO. Dashed line indicates the boundary between matrix and dermal papilla. The boundary between dermal papilla cell #1 and matrix cell #2 is magnified in the panel below. BM, basement membrane. Scale bars: 10 µm (upper panel), 600 nm (lower panel). Ap, apoptotic bodies. (B) Representative images from P0 sagittal sections labeled for F-actin by phalloidin (scale bars: 25 µm). White solid lines denote skin surface and dashed lines denote dermal-epidermal border. Note apical polarization of F-actin in control HFs, often missing in Mettl3 cKO follicles.
Figure 4—figure supplement 1
Analysis of DNA fragmentation, apoptosis and cell division angles in HF morphogenesis.
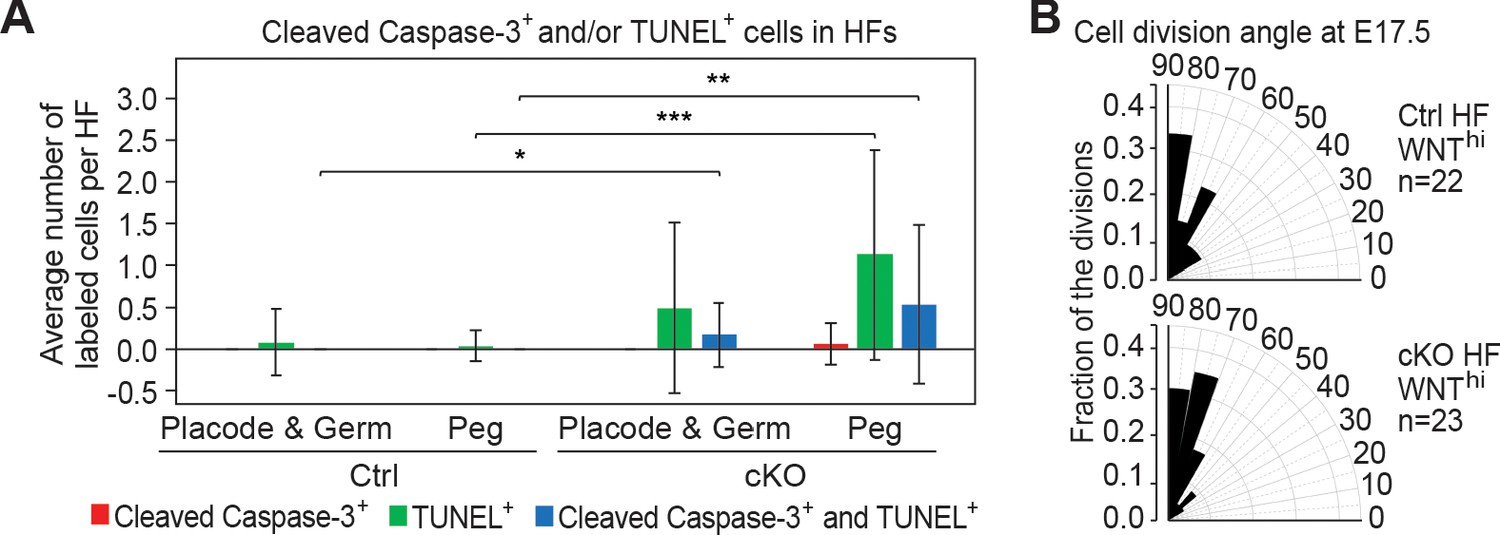
(A) Quantification of TUNEL+ and cleaved Caspase-3+ cells in HFs at different developmental stages [placodes (Plcd), germs and pegs] at P0. Quantifications are from images of P0 sagittal sections immunolabeled for cleaved Caspase-3 and stained for TUNEL (error bars: standard deviation, for each condition >25 HFs from 3 biological replicates were analyzed, *p<0.05 **p<0.01 ***p<0.001 by unpaired two-tailed Student’s t-test). Double-staining is indicative of apoptosis, while TUNEL positivity on its own represents increased DNA fragmentation, which could be indicative of cytolysis or other forms of DNA damage. (B) Radial histograms depicting the spindle orientations of HF WNThi cells during anaphase/telophase at E17.5, assessed by triple immunofluorescence for Survivin, integrin β4 (CD104) and PCAD as described in Ouspenskaia et al., 2016; Williams et al., 2011. For each condition, three biological replicates are analyzed and n indicates the total number of anaphase/telophase cells examined.
-
Figure 4—figure supplement 1—source data 1
Quantification of cell death events in HFs in (A).
- https://cdn.elifesciences.org/articles/56980/elife-56980-fig4-figsupp1-data1-v2.xlsx
-
Figure 4—figure supplement 1—source data 2
Quantification of cell division angles in (B).
- https://cdn.elifesciences.org/articles/56980/elife-56980-fig4-figsupp1-data2-v2.xlsx
Figure 5 with 1 supplement
Single-cell transcriptomics of Mettl3 cKO compared to control skin epithelial lineages.
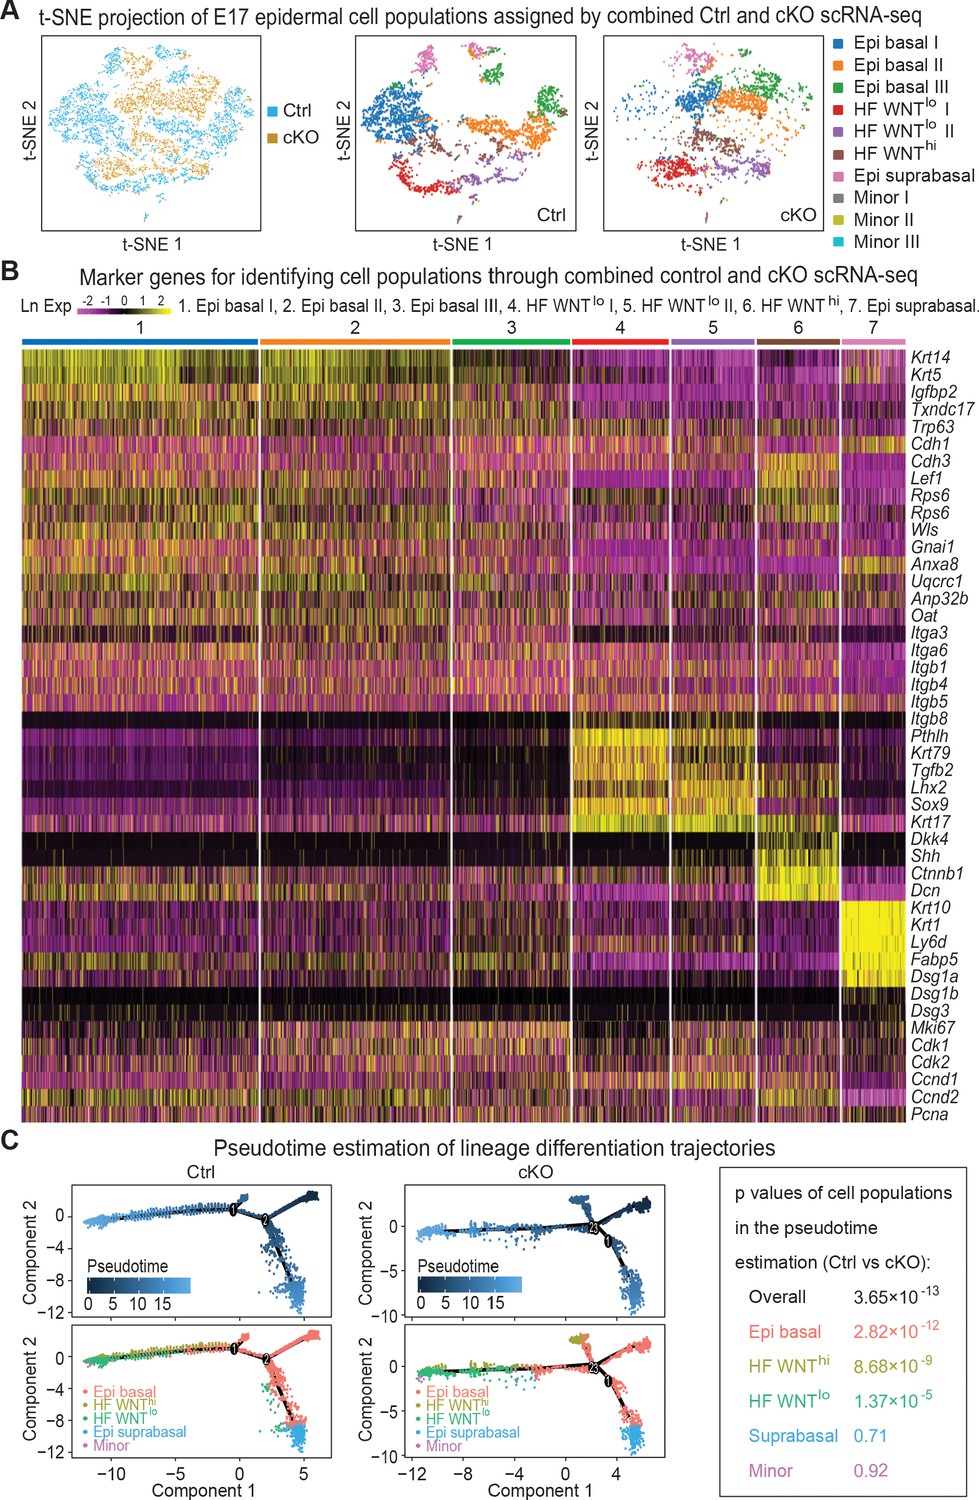
(A) YFP+ progenitors were FACS-enriched from E17 control and Mettl3 cKO whole back skins and subject to scRNA-seq as described in the Materials and methods. Shown are the data from unbiased clustering of the single cells projected by t-SNE. (Clustering was performed on all cells from control and cKO samples pooled together.) Seven major clusters and three minor clusters were identified, which are present in both samples. (B) Heat map illustrating how the seven populations were identified based upon their expression of established marker genes. Each column depicts data from one single cell belonging to the cluster that is indicated at the top. Each row illustrates cluster-wide expression data for the specific mRNA listed at the right. Color coding of each cluster is according to the color scheme in the t-SNE plots in (A). (C) Pseudotime plots showing the estimated lineage trajectories of each of the clusters as derived from the scRNA-seq data. The p values were calculated through Pearson's chi-square test.
Figure 5—figure supplement 1
Cell isolation for scRNA-seq analysis and cell identity verification.
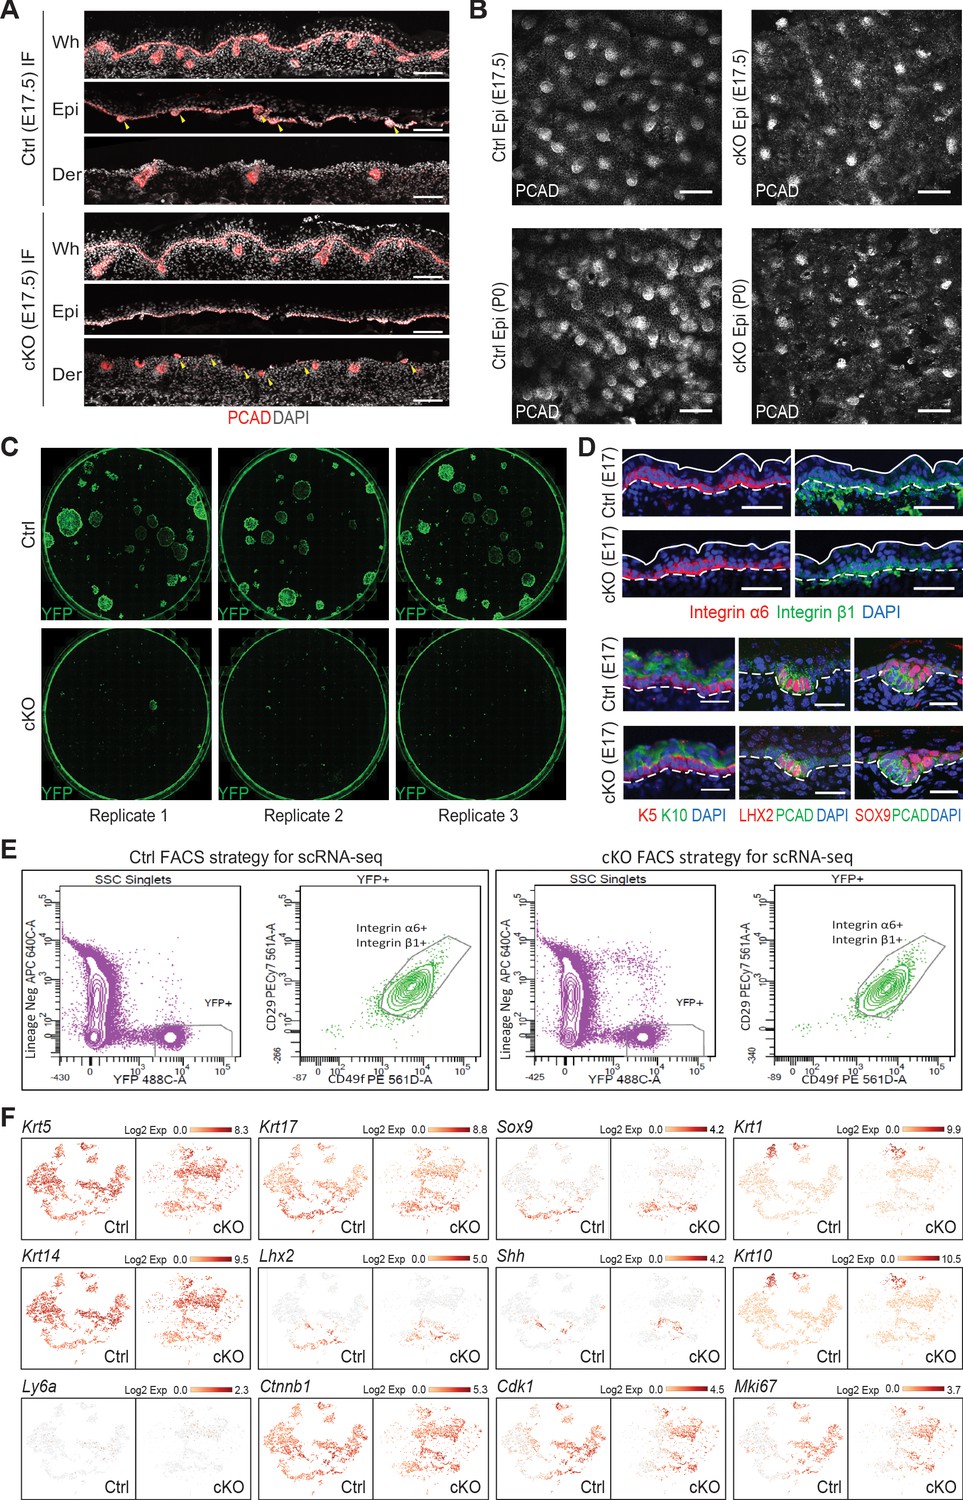
(A) Images of E17.5 back skin sagittal sections before (whole skin, Wh) and after dispase treatment immunolabeled for PCAD demonstrating Mettl3 cKO affects the separation of developing HFs between the epidermis (Epi) and dermis (Der) fractions (scale bars: 100 µm). Yellow arrows are pointing to the hair placodes and hair germs, which were found in the epidermal fraction in the control sample but the dermal fraction the cKO sample. (B) Confocal images of the epidermis fractions separated by dispase treatment immunolabeled for PCAD at indicated time points (scale bars: 100 µm). (C) Colony formation assay demonstrating cKO cells do not survive in vitro culturing conditions. Each picture was scanned from a well of 6-well plates with YFP+ cells FACS isolated from E16.5 back skin cultured for 10 days. Cells were then fixed and immunolabeled for YFP. Shown are representative images. (D) Images of E17.5 back skin sagittal sections immunolabeled for selected lineage markers (for integrins α6, β1, scale bars: 50 µm; for the others scale bars: 25 µm). White solid lines indicate skin surface and dashed lines indicate dermal-epithelial border. (E) Sorting strategy to isolate YFP+ epidermal cells for scRNA-seq analysis. Live (DAPI-) cell singlets were first gated upon the lineage negative markers and YFP signal to get the YFP+ population. The YFP+ population was further gated on surface integrins α6 (CD49f) and β1 (CD29) to enrich for skin progenitors, which were collected for scRNA-seq. (F) t-SNE plots to visualize the expression of selected marker genes. See legend of Figure 7C and t.
Figure 6 with 2 supplements
Investigation of RNAs whose levels diminish upon METTL3 loss.
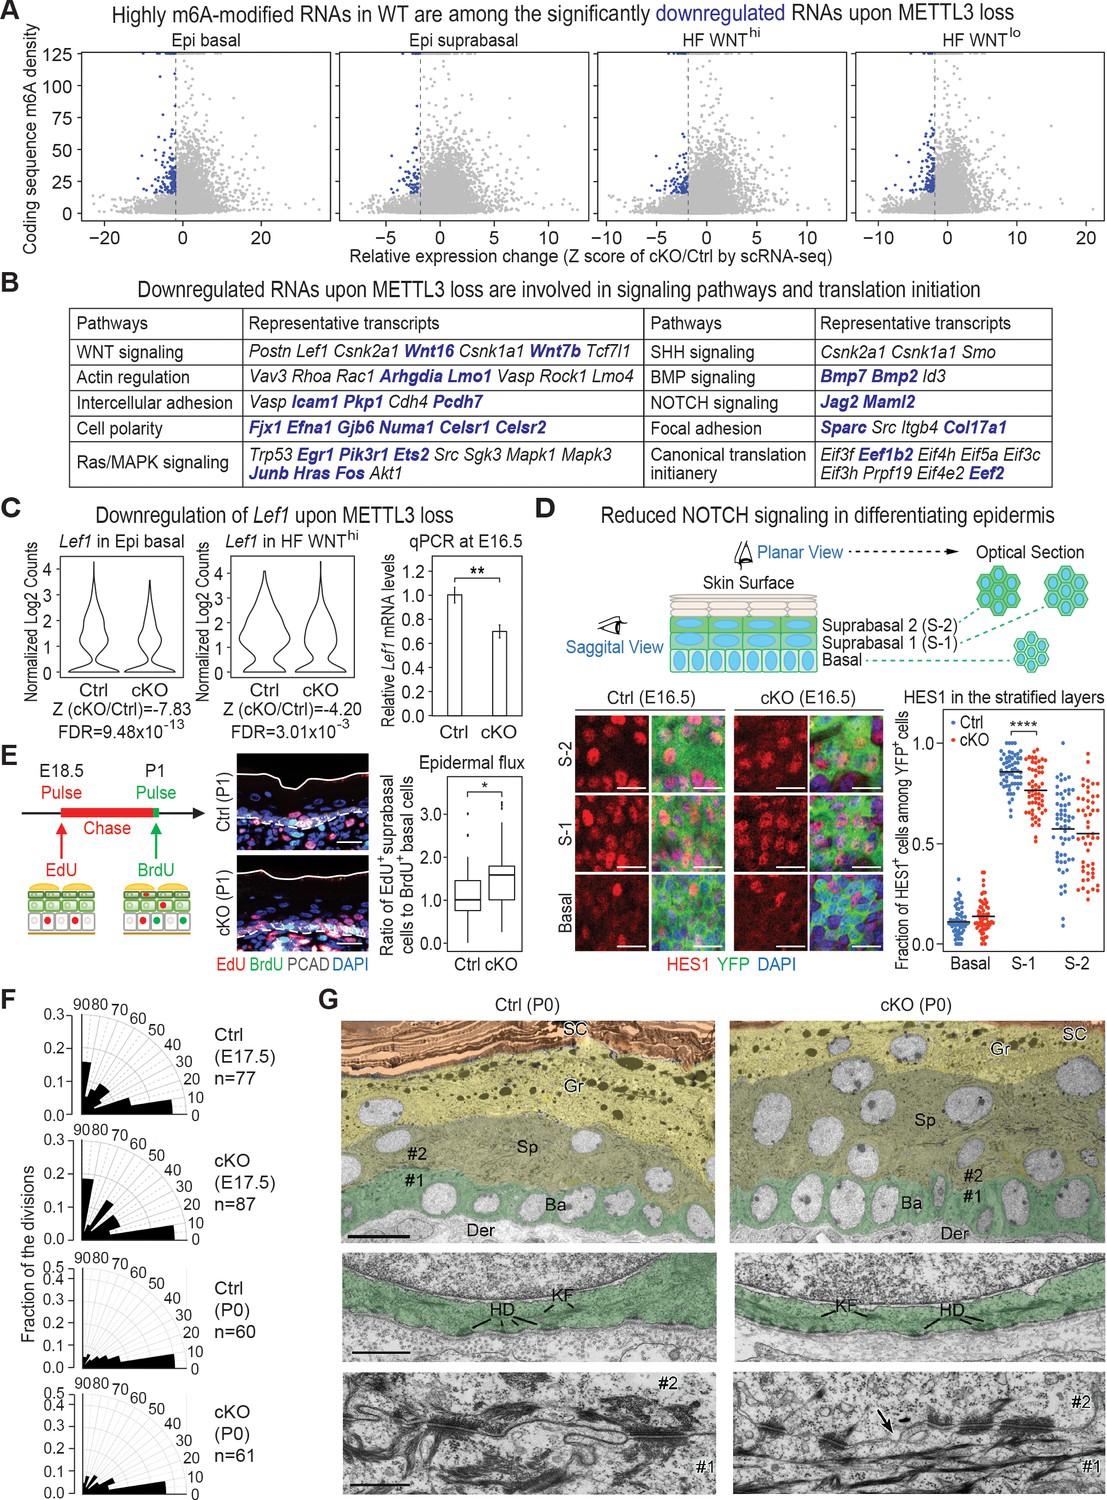
(A) scRNA-seq data from Figure 5A were binned according to four major classifications: Epi basal, Epi suprabasal, HF WNThi and HF WNTlo. Scatter plots of mRNAs in these cells were then analyzed according to their expression changes (cKO/Ctrl) assessed by scRNA-seq Z score and to their coding sequence m6A density in wild-type (WT) skin epithelium assessed by the miCLIP SN-uTPM per nt value. Dots on the left of the dashed line in each plot indicate RNAs which from scRNA-seq have a Z score (cKO/Ctrl)<−1.96 (Supplementary file 3). Among those, blue dots denote mRNAs with m6A coding sequence SN-uTPM per nt among the top 20% (Supplementary file 4). (B) Major pathways and their associated RNAs that were downregulated upon METTL3 loss. Shown are the data for the basal epidermal progenitors, which at E17 contained both epidermal and hair placode cells. mRNAs highlighted in blue correspond to blue dots in (A), and were among the most significantly downregulated upon METTL3 loss but heavily m6A-modified in wild-type. Note that many of these pathways also corresponded to those whose heavily m6A-modified mRNAs were also efficiently translated. (C) Violin plots illustrating the relative expression levels of Lef1 mRNA in the Mettl3 cKO versus control basal epidermal progenitors and WNThi progenitors. Z score assessment of expressional difference between cKO and control [Z (cKO/Ctrl)] and false discovery rate (FDR) is calculated by MAST. The down-regulation was verified with qPCR on total RNA samples extracted from YFP+ skin epithelial cells FACS isolated from E16.5 embryos with Tbp mRNA as internal control (error bars: standard deviation, for each condition n = 3 biological replicates, **p<0.01 by unpaired two-tailed Student’s t-test). (D) Confocal images of E16.5 whole-mount back skin immunolabeled for HES1 and YFP (scale bars: 20 µm). HES1 expression was quantified in the stratified layers of skin epithelium (middle line corresponds to the mean; for each condition, the data are from two biological replicates; ****p<0.0001 by unpaired two-tailed Student’s t-test). (E) Pulse-chase assay examining the rate of epidermal cell flux from basal to suprabasal layers. Control and cKO animals were pulsed at E18.5 with EdU and the signal was then chased until P1. Before tissue collection, the P1 pups were treated with a short (1 hr) BrdU pulse. P1 back skin sagittal sections were subjected to immunofluorescence to examine the EdU and BrdU labeling in the basal versus suprabasal layers of the epidermis (scale bars: 25 µm). White solid lines denote skin surface and dashed lines denote dermal-epidermal border. Cell flux rates were quantified based on the ratio of EdU+ cells in the suprabasal layer to BrdU+ basal cells (for each condition n = 4 biological replicates ×10 images per replicate, *p<0.05 by unpaired two-tailed Student’s t-test). (F) Radial histograms depicting the division orientation of epidermal basal cells during anaphase/telophase at E17.5 and P0, assessed by IF staining of Survivin, integrin β4 (CD104) and PCAD as described in Williams et al., 2011. For each condition, three biological replicates were analyzed and n indicates the total number of anaphase/telophase cells examined from the embryos. (G) Ultrastructure of epidermis in control and Mettl3 cKO P0 back skin. Ba, basal layer, colored in green; Sp, spinous layer, colored in greenish yellow; Gr, granular layer, colored in yellow; SC, stratum corneum, colored in orange. Note the increased numbers of cells in the spinous layer of cKO, and the presence of nuclei in many cells of the granular layer. The boundary between dermis (Der) and the basal layer is shown in the middle panel. KF, keratin filaments; HD, hemidesmosomes. The border between cell #1 (basal) and cell #2 (suprabasal) is shown in the lower panel. Intercellular membranes are sealed in the control. Note small gaps (arrow) are present at the intercellular border, more frequently in cKO than in control. Scale bars: 10 µm (upper panel), 600 nm (middle and lower panel).
-
Figure 6—source data 1
Lef1 qPCR in (C).
- https://cdn.elifesciences.org/articles/56980/elife-56980-fig6-data1-v2.xlsx
-
Figure 6—source data 2
Quantification of HES1 immunofluorescence signals in (D).
- https://cdn.elifesciences.org/articles/56980/elife-56980-fig6-data2-v2.xlsx
-
Figure 6—source data 3
Quantification of EdU+ and BrdU+ cells in (E).
- https://cdn.elifesciences.org/articles/56980/elife-56980-fig6-data3-v2.xlsx
-
Figure 6—source data 4
Quantification of cell division angles in (F).
- https://cdn.elifesciences.org/articles/56980/elife-56980-fig6-data4-v2.xlsx
Figure 6—figure supplement 1

Correlation between the levels of m6A modification and changes in steady-state RNA levels upon Mettl3 ablation.
Correlation analysis of the Z score (cKO/Ctrl) from scRNA-seq to different parameters of assessing m6A modification levels. The different parameters tested include m6A site number (site #), m6A site density per nt of RNA (site # per nt), sum of normalized-to-input uTPM from the m6A sites (SN-uTPM) and the SN-uTPM values per nt of RNA (SN-uTPM per nt). For each of the parameter, we also checked the value in the full-length RNA and on the 5’ UTR, coding sequence (CDS), 3’ UTR, respectively. The correlation analysis is performed with Z score (cKO/Ctrl) values from Epi basal, Epi suprabasal, HF WNThi and HF WNTlo groups of cells. In all the four groups, we found the CDS SN-uTPM per nt parameter had the highest level of correlation indicated by the R2 value (boxed in red). Plots that were generated from the Epi basal group of cells are shown.
Figure 6—figure supplement 2
Additional analysis of epidermal perturbations upon Mettl3 cKO.
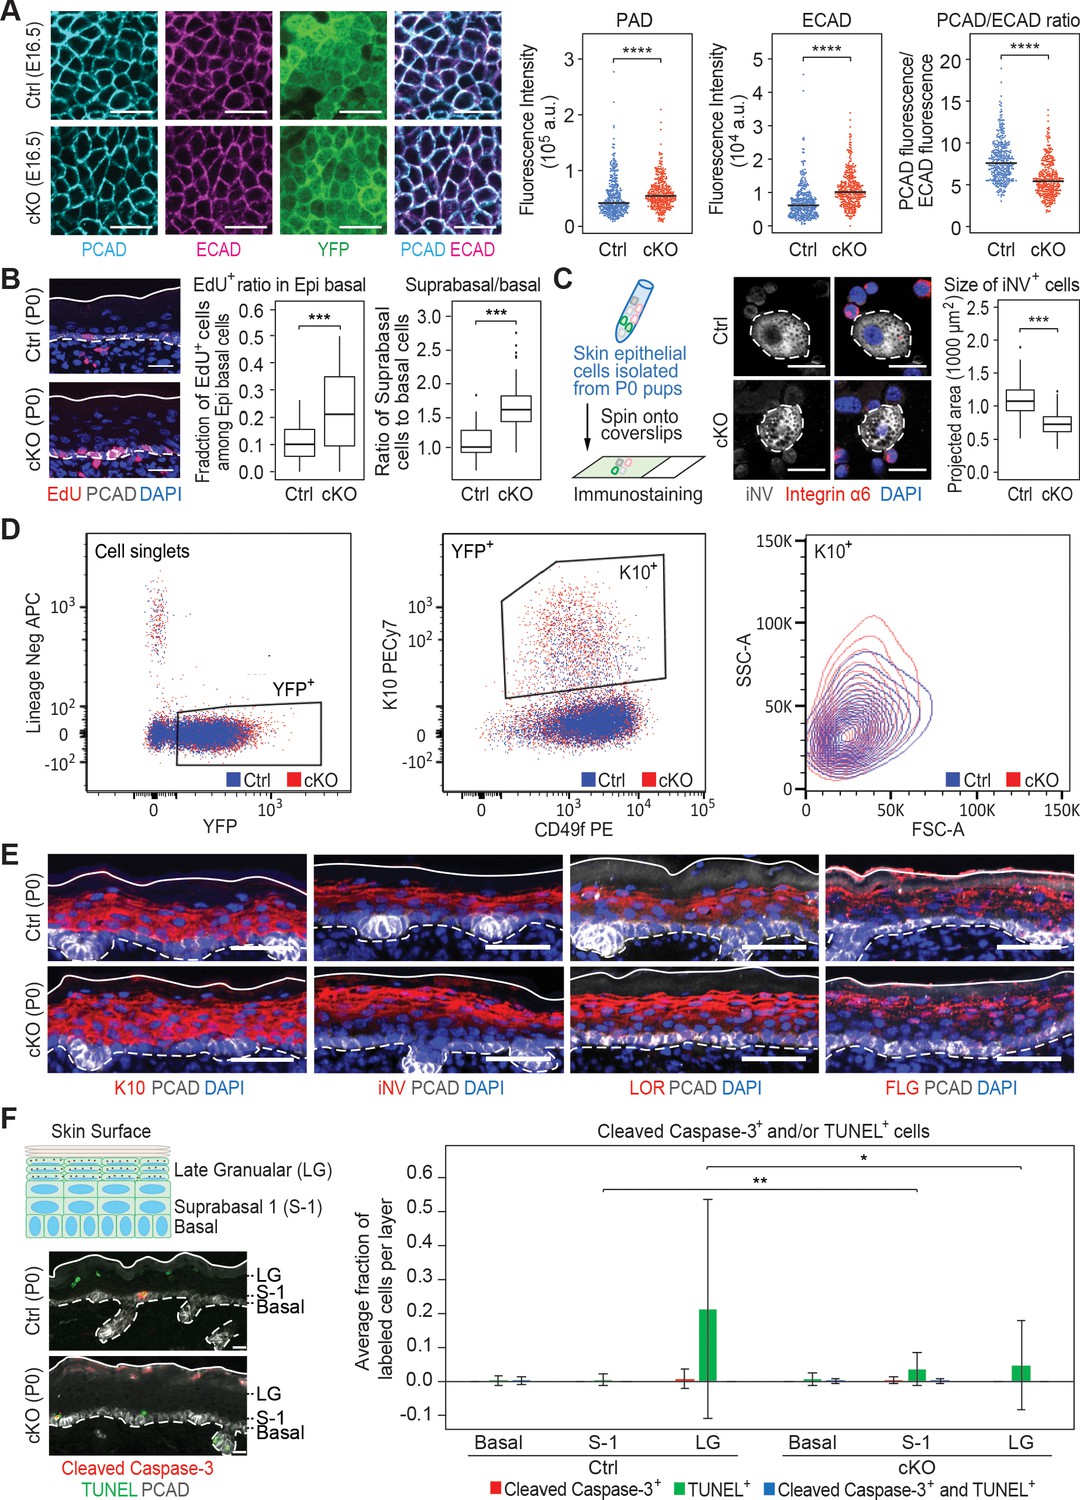
(A) Confocal images of E16.5 whole-mount back skin immunolabeled for PCAD, ECAD and YFP (scale bars: 20 µm). PCAD and ECAD expression was quantified in the basal progenitors of skin epithelium (middle line corresponds to the median; for each condition the data are from two biological replicates; ****p<0.0001 by Mann Whitney test). (B) Left panel: representative images from P0 sagittal sections with a 45-min EdU pulse prior to tissue collection (scale bars: 25 µm). Solid lines, skin surface boundary; dashed lines, dermal-epidermal border. Middle panel: quantification of the ratio of EdU+ cells among all basal cells (for each condition n = 3 biological replicates ×10 images per replicate, ***p<0.001 by unpaired two-tailed Student’s t-test). Right panel: quantification of the suprabasal cell number/basal cell number ratio according to DAPI staining of the nuclei (for each condition n = 5 biological replicates ×10 images per replicate, ***p<0.001 by unpaired two-tailed Student’s t-test). (C) Left panel: schematic depicting process of the cytospin. Middle panel: representative images of differentiated suprabasal keratinocytes from cytospin of epidermal cells (scale bars: 25 µm). Dashed lines highlight differentiated suprabasal keratinocytes with positive involucrin (iNV) immunolabeling and negative integrin α6 immunolabeling. Right panel: quantification of projected area of the iNV+ differentiated cells (for each condition n = 3 biological replicates ×43 cells per replicate, ***p<0.001 by unpaired two-tailed Student’s t-test). (D) Representative flow cytometry analysis of the K10+ suprabasal cells. For each sample, live (Aqua-) cell singlets are first gated upon the lineage negative markers and YFP signal to get the YFP+ population. The YFP+ population is further gated upon surface integrin α6 (CD49f) and K10 immuno-staining signals to get the K10+ population, which is then projected upon forward scatter (FSC-A)/side scatter (SSC-A) for analysis. Forward scatter reflects cell size, with higher value corresponding to bigger size. Side scatter reflects cell shape. As more differentiated suprabasal cells are more granular, they tend to have higher SSC-A values. Comparison between the control and cKO K10+ cells’ profiles indicates that cKO has more highly differentiated cells than control and these highly differentiated cells in cKO animals tend to have smaller sizes. Totally four biological replicates were examined for each condition. Shown are representative results. (E) Images of P0 back skin sagittal sections immulabeled for K10, involucrin (iNV), loricrin (LOR) and filaggrin (FLG) demonstrating the expression pattern of standard differentiation markers is not severely interrupted by Mettl3 cKO (scale bars: 50 µm). Solid and dashed lines as in (B). (F) Representative images of P0 back skin sagittal sections with cleaved Caspase-3 immunostaining and TUNEL staining (scale bars: 20 µm). White solid lines indicate skin surface and dashed lines indicate dermal-epithelial border. Quantification of TUNEL+ and cleaved Caspase-3+ cells in the designated layers at P0. Only double-positive cells denote apoptosis; TUNEL+ only cells are typically seen as granular cells lose their nuclei and transition as dead flattened cells to the stratum corneum. This is defective in Mettl3 cKO skin. The TUNEL+ cells in the suprabasal 1 layer likely correspond to the occasional cytolytic suprabasal cells that we saw at the ultrastructural level (not shown). Quantification of the labeled cells is shown (error bars: standard deviation, for each condition n = 3 biological replicates × 10 images per replicate, *p<0.05 and **p<0.01 by unpaired two-tailed Student’s t-test).
-
Figure 6—figure supplement 2—source data 1
Quantification of PCAD, ECAD immunofluorescence signals in (A).
- https://cdn.elifesciences.org/articles/56980/elife-56980-fig6-figsupp2-data1-v2.xlsx
-
Figure 6—figure supplement 2—source data 2
Quantification of EdU+ cells and the suprabasal/basal cell number ratio in (B).
- https://cdn.elifesciences.org/articles/56980/elife-56980-fig6-figsupp2-data2-v2.xlsx
-
Figure 6—figure supplement 2—source data 3
Quantification of cell sizes by cytospin in (C).
- https://cdn.elifesciences.org/articles/56980/elife-56980-fig6-figsupp2-data3-v2.xlsx
-
Figure 6—figure supplement 2—source data 4
Quantification of cell death events in epidermis in (F).
- https://cdn.elifesciences.org/articles/56980/elife-56980-fig6-figsupp2-data4-v2.xlsx
Figure 7 with 1 supplement
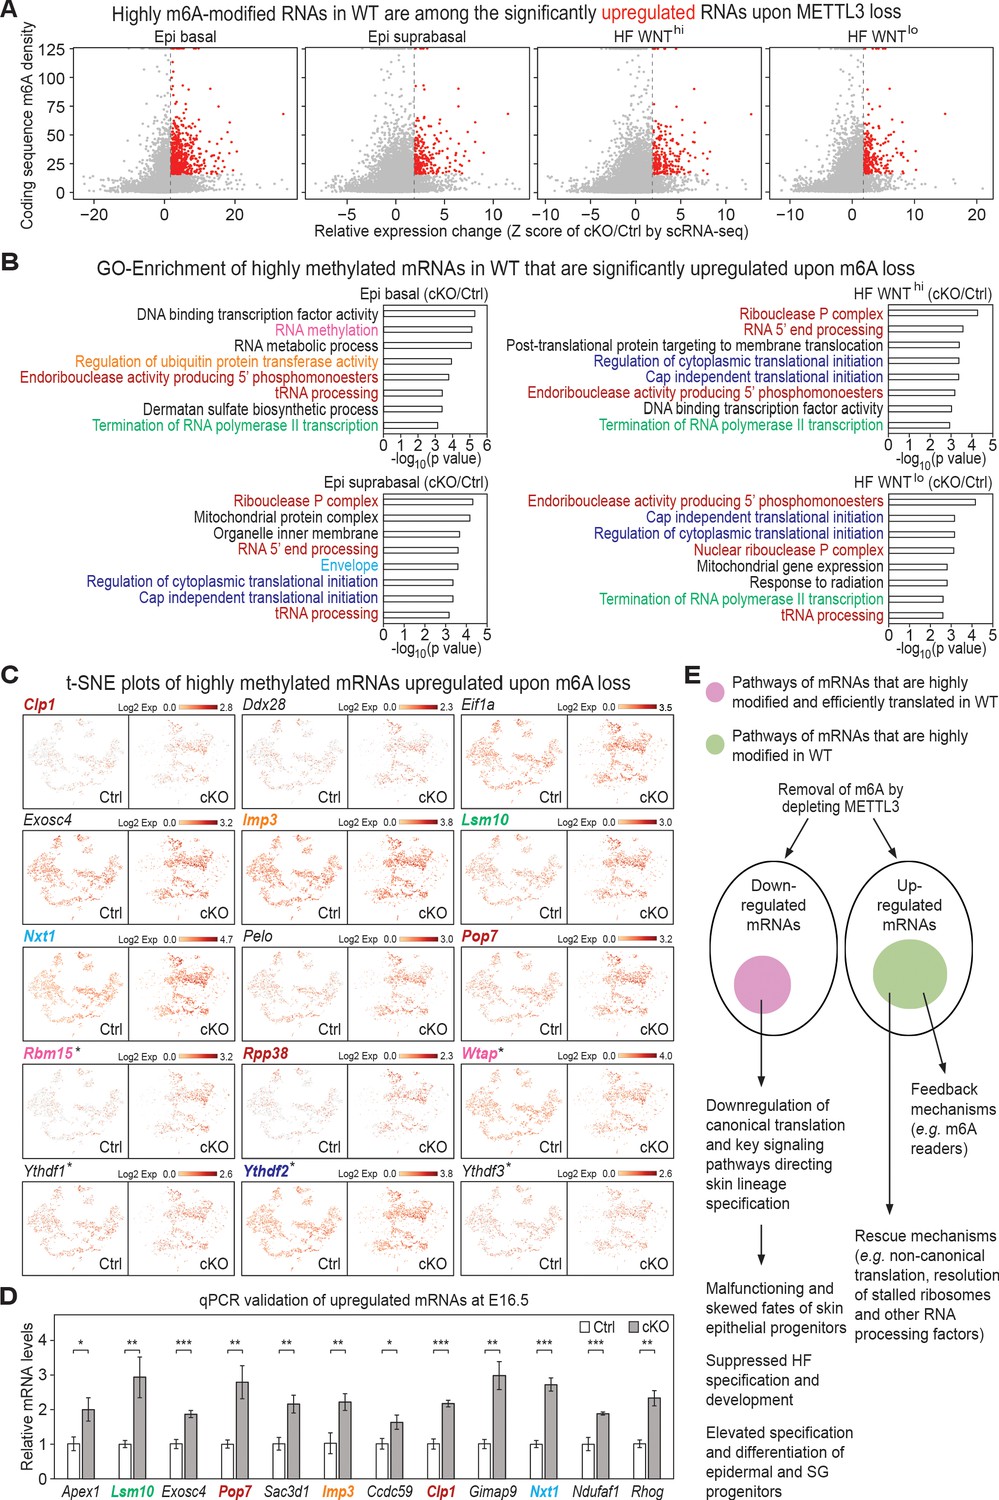
Investigation of RNAs upregulated upon METTL3 loss.
(A) Scatter plots of mRNAs in the indicated groups of cells (as in Figure 5A) based on expression changes (cKO/Ctrl) assessed by scRNA-seq Z score and correlated with the coding sequence m6A density in wild-type (WT) skin epithelium assessed by the miCLIP SN-uTPM per nt value. Dots on the right of the dashed line in each plot indicate RNAs which from scRNA-seq have a Z score (cKO/Ctrl)>1.96 (Supplementary file 3). Among those, red dots denote mRNAs whose m6A coding sequence SN-uTPM per nt was among the top 20% (Supplementary file 4). (B) GSEA of transcripts with Z score (cKO/Ctrl)>1.96, FDR <0.05 in scRNA-seq and m6A coding sequence SN-uTPM per nt among the top 20% indicating the GO terms enriched. (C) Examination of the expression of selected upregulated mRNAs on the t-SNE plots. mRNA names are color-coded according to the GO terms they belong to in (B). Those mRNAs whose names are in black are known to be involved in translation regulation, and scored as elevated significantly upon METTL3 loss. *denotes mRNAs encoding factors related to m6A dynamics. (D) qPCR validation of increased levels of mRNAs in cKO/Ctrl. qPCR is on total RNA samples extracted from YFP+ skin epithelial cells FACS isolated from E16.5 embryos with Tbp mRNA as internal control (error bars: standard deviation, for each condition n = 3 biological replicates, *p<0.05 **p<0.01 ***p<0.001 by unpaired two-tailed Student’s t-test). (E) Proposed model summarizing the effects of m6A loss on mRNA translation and degradation in the skin epithelia, and the consequences to their integrity and fate choices. The ovals represent all mRNAs that were either downregulated or upregulated significantly upon METTL3 loss. Pink circle: by first examining mRNAs that were heavily modified by m6A and also efficiently translated (Figure 1), and then independently identifying mRNAs that were among the most significantly downregulated upon METTL3 loss, we discovered considerable overlap in their pathways, suggestive of a translation block. The finding that a number of mRNAs involved in canonical translation were also significantly downregulated added to this notion. Factors involved in WNT signaling, NOTCH signaling and adhesion were featured prominently, in agreement with the morphogenetic defects observed. Green circle: these mRNAs were significantly upregulated upon METTL3 loss and were heavily m6A-modified in wild-type skin, but they did not correlate with translation efficiency. Rather, they encompassed mRNAs indicative of translational rescue pathways as well as feedback mechanisms.
-
Figure 7—source data 1
qPCR of selected transcripts in (D).
- https://cdn.elifesciences.org/articles/56980/elife-56980-fig7-data1-v2.xlsx
Figure 7—figure supplement 1
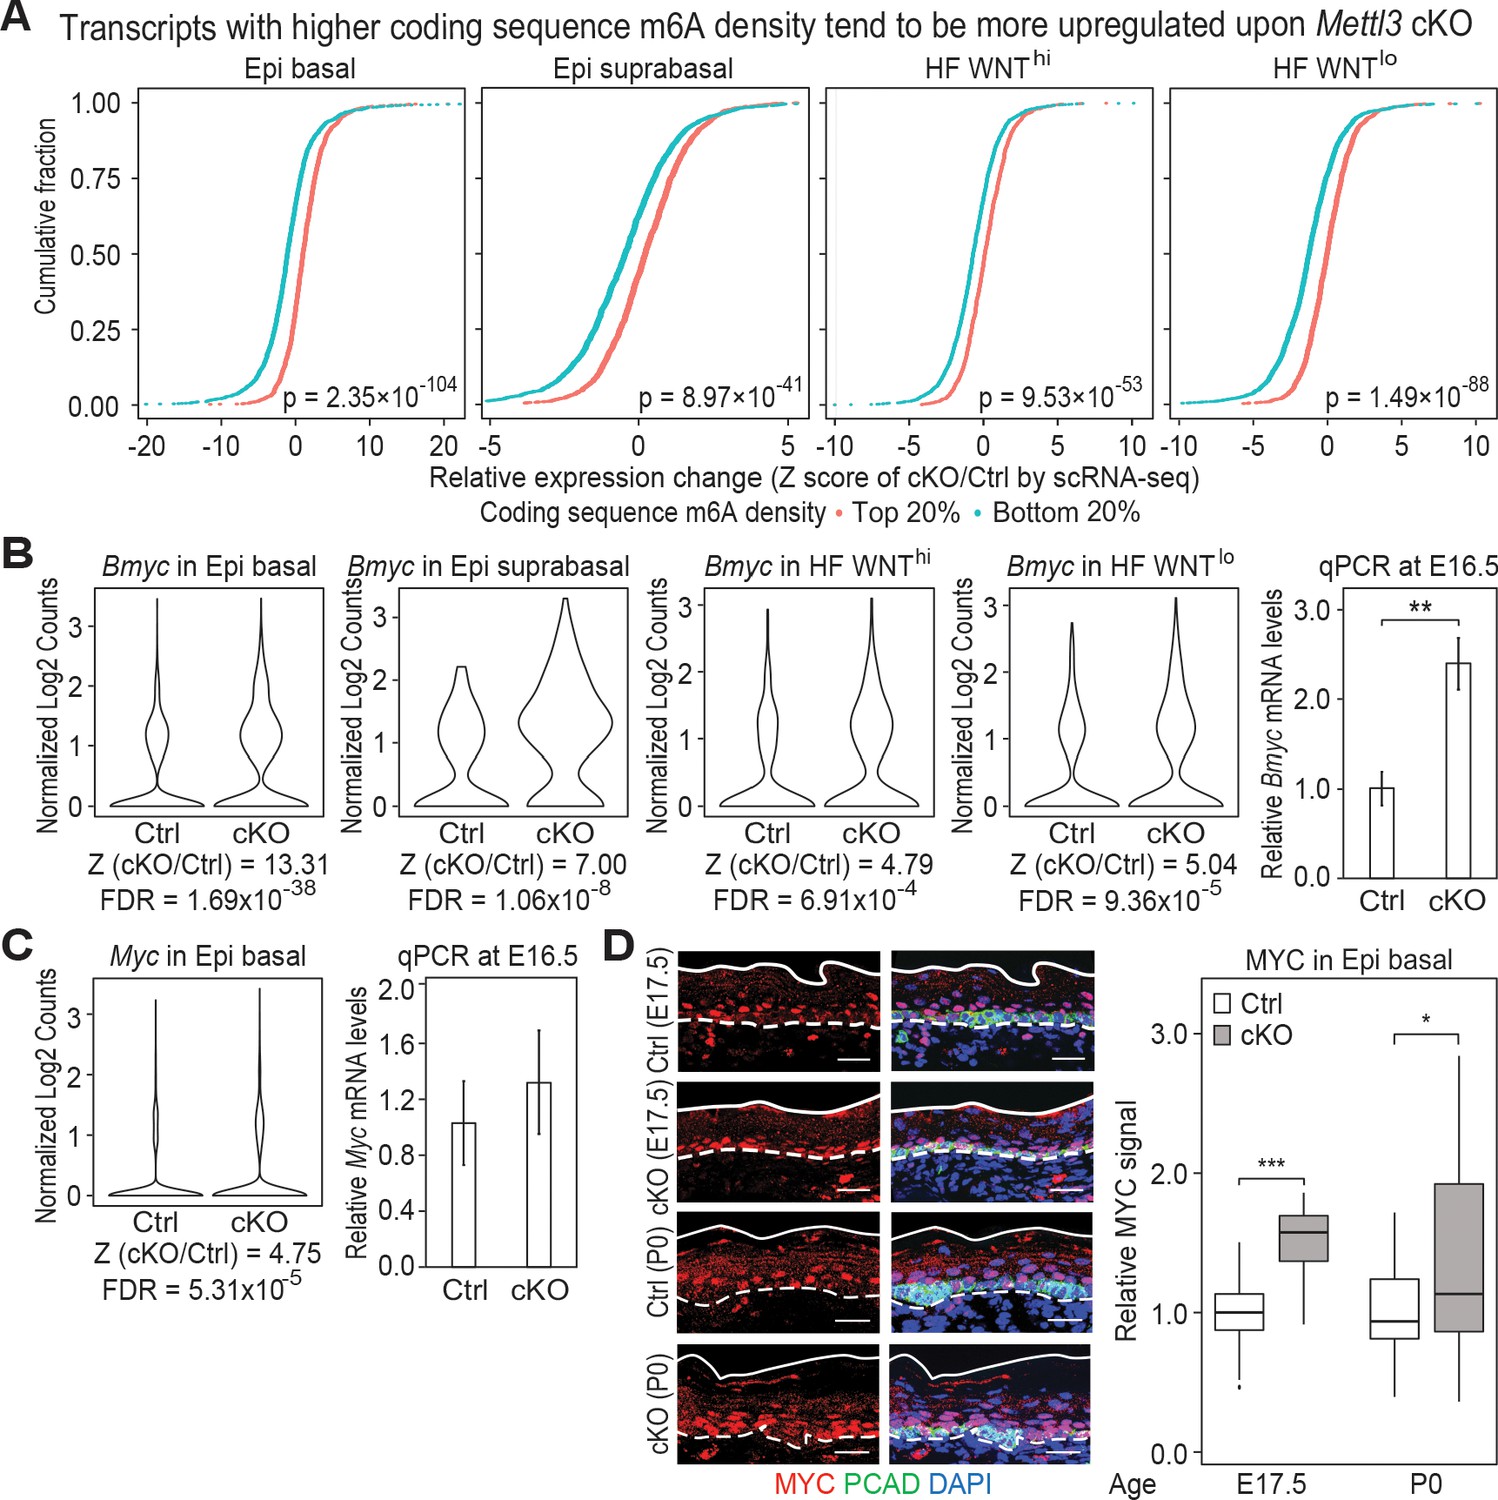
Additional analysis of features affected by the upregulated genes upon Mettl3 cKO.
(A) ECDF plots of the Z score (cKO/Ctrl) from scRNA-seq demonstrate transcripts with higher levels of m6A modification (assessed by the coding sequence SN-uTPM per nt value from miCLIP) in wild-type tend to be more upregulated upon METTL3 loss. The p values were calculated through Wilcoxon rank sum test. (B, C) Violin plots illustrating the relative expression levels of Bmyc and Myc mRNA in corresponding groups of Mettl3 cKO versus control cells. Z score assessment of expressional difference between cKO and control [Z (cKO/Ctrl)] and false discovery rate (FDR) is calculated by MAST. The upregulation is verified with qPCR on total RNA samples extracted from YFP+ skin epithelial cells FACS isolated from E16.5 embryos with Tbp mRNA as internal control (error bars: standard deviation, for each condition n = 3 biological replicates, **p<0.01 by unpaired two-tailed Student’s t-test). (D) Images from E17.5 and P0 sagittal sections immunolabeled for MYC and PCAD (scale bars: 25 µm). White solid lines denote skin surface and dashed lines denote dermal:epidermal border. Quantifications of MYC immunofluorescence specifically in the Epi basal cells (identified based on PCAD staining) reveals the upregulation of MYC in cKO samples (for each condition n = 3 biological replicates ×7 images per replicate, *p<0.05 and ***p<0.001 by unpaired two-tailed Student’s t-test).
-
Figure 7—figure supplement 1—source data 1
Bmyc qPCR in (B).
- https://cdn.elifesciences.org/articles/56980/elife-56980-fig7-figsupp1-data1-v2.xlsx
-
Figure 7—figure supplement 1—source data 2
Myc qPCR in (C).
- https://cdn.elifesciences.org/articles/56980/elife-56980-fig7-figsupp1-data2-v2.xlsx
-
Figure 7—figure supplement 1—source data 3
Quantification of MYC immunofluorescence signals in (D).
- https://cdn.elifesciences.org/articles/56980/elife-56980-fig7-figsupp1-data3-v2.xlsx
Tables
Appendix 1—key resources table
| Reagent type (species) or resource | Designation | Source or reference | Identifiers | Additional information | |
|---|---|---|---|---|---|
| Genetic reagent (M. musculus) | C57BL/6J | Jackson lab | Stock #: 000664 | ||
| Genetic reagent (M. musculus) | Mettl3flox | PMID:31412241 J. Brüning (Max Planck Institute for Metabolism Research and Policlinic for Endocrinology, Diabetes and Preventive Medicine) | |||
| Genetic reagent (M. musculus) | Krt14-Cre | PMID:10411913 E. Fuchs (Rockefeller University) | MGI:1926500 | ||
| Genetic reagent (M. musculus) | Rosa26-YFPflox | Jackson lab | Stock #: 006148 | ||
| Genetic reagent (M. musculus) | Gli-LacZ | PMID:12361967 A. Joyner (MSKCC) | MGI:2449767 | ||
| Genetic reagent (M. musculus) | Nude (Nu/Nu) | Charles River Laboratories | Strain code: 088 | ||
| Antibody | Rat anti-BrdU | Abcam | Cat. #: ab6326 RRID:AB_305426 | IMF (1:200) | |
| Antibody | Rat anti-CD104 | BD Pharmingen | Cat. #: 553745 RRID: AB_395027 | IMF (1:500) | |
| Antibody | Armenian hamster anti-CD29 | BioLegend | Cat. #: 102201 RRID:AB_312878 | IMF (1:500) | |
| Antibody | Rat anti-CD49f | BioLegend | Cat. #: 313602 RRID:AB_345296 | IMF (1:1000) | |
| Antibody | Rabbit anti-Cleaved Caspase-3 | R&D Systems | Cat. #: AF835 RRID:AB_2243952 | IMF (1:200) | |
| Antibody | Rabbit anti-ECAD | Cell Signaling | Cat. #: 3195 RRID:AB_2291471 | IMF (1:500) | |
| Antibody | Rabbit anti-FLG | E. Fuchs (Rockefeller University) | IMF (1:2000) | ||
| Antibody | Rabbit anti-HES1 | E. Fuchs (Rockefeller University) | IMF (1:200) | ||
| Antibody | Rabbit anti-iNV | BioLegend | Cat. #: 924401 RRID:AB_2565452 | IMF (1:2000) | |
| Antibody | Guinea pig anti-K5 | E. Fuchs (Rockefeller University) | IMF (1:500) | ||
| Antibody | Rabbit anti-K10 | Covance | Cat. #: PRB-159P-100 RRID:AB_291580 | IMF (1:1000) Flow (1:500) | |
| Antibody | Guinea pig anti-LEF1 | E. Fuchs (Rockefeller University) | IMF (1:5000) | ||
| Antibody | Rabbit anti-LHX2 | E. Fuchs (Rockefeller University) | IMF (1:5000) | ||
| Antibody | Rabbit anti-LOR | E. Fuchs (Rockefeller University) | IMF (1:4000) | ||
| Antibody | Rabbit anti-METTL3 | Abcam | Cat. #: ab195352 RRID:AB_2721254 | IMF (1:100-1:500) | |
| Antibody | Rabbit anti-MYC | Abcam | Cat. #: ab32072 RRID:AB_731658 | IMF (1:100) | |
| Antibody | Goat anti-PCAD | R&D Systems | Cat. #: AF761 RRID:AB_355581 | IMF (1:300-1:600) | |
| Antibody | Rabbit anti-SOX9 | Millipore | Cat. #: AB5535 RRID:AB_2239761 | IMF (1:1000) | |
| Antibody | Rabbit anti-Survivin | Cell Signalling | Cat. #: 2808 RRID:AB_2063948 | IMF (1:500) | |
| Antibody | Chicken anti-GFP/YFP | Abcam | Cat. #: ab13970 RRID:AB_300798 | IMF (1:1000-1:1200) | |
| Antibody | anti-CD29 PECy7 | Thermo Fisher Scientific | Cat. #: 25-0291-82 RRID: AB_1234962 | FACS (1:1000) | |
| Antibody | anti-CD31 APC | Thermo Fisher Scientific | Cat. #: 17-0311-82 RRID:AB_657735 | FACS (1:1000) | |
| Antibody | anti CD45-APC | Thermo Fisher Scientific | Cat. #: 17-0451-83 RRID:AB_469393 | FACS (1:1000) | |
| Antibody | anti-CD49f PE | Thermo Fisher Scientific | Cat. #: 12-0495-81 RRID:AB_891478 | FACS (1:1000) | |
| Antibody | anti-CD49f PECy7 | Thermo Fisher Scientific | Cat. #: 25-0495-82 RRID:AB_10804881 | FACS (1:1000) | |
| Antibody | anti CD117-APC | Thermo Fisher Scientific | Cat. #: 17-1172-81 RRID:AB_469432 | FACS (1:1000) | |
| Antibody | anti CD140a-APC | Thermo Fisher Scientific | Cat. #: 17-1401-81 RRID:AB_529482 | FACS (1:500) | |
| Antibody | Mouse anti-rabbit IgG PE-Cy7 | Santa Cruz | Cat. #: sc-516721 | Flow (1:300) | |
| Chemical compound, drug | Alexa Fluor 647 Phalloidin | Thermo Fisher Scientific | Cat. #: A22287 RRID:AB_2620155 | IMF (1:50) | |
| Commercial assay or kit | In situ cell death detection kit, TMR red | Sigma-Aldrich | Cat. #: 12156792910 | ||
| Commercial assay or kit | Click-iT EdU cell proliferation kit for imaging, Alexa Fluor 647 dye | Thermo Fisher Scientific | Cat. #: C10340 | ||
| Commercial assay or kit | LIVE/DEADfixable Aqua dead cell stain kit, for 405 nm excitation | Thermo Fisher Scientific | Cat. #: L34957 | ||
| Commercial assay or kit | Fixation/ permeabilization solution kit | BD Biosciences | Cat. #: 554714 | ||
| Commercial assay or kit | Dynabeads mRNA purification kit | Thermo Fisher Scientific | Cat. #: 61006 | ||
| Commercial assay or kit | Direct-zol RNA miniprep kit | Zymo Research | Cat. #: R2051 | ||
| Commercial assay or kit | RQ1 RNase-free DNase | Promega | Cat. #: M6101 | ||
| Commercial assay or kit | High-capacity cDNA reverse transcription kit | Thermo Fisher Scientific | Cat. #: 4368814 | ||
| Commercial assay or kit | Power SYBR Green PCR Master Mix | Thermo Fisher Scientific | Cat. #: 4367660 | ||
| Commercial assay or kit | Chromium single cell 3' reagent kit | 10x Genomics | Cat. #: PN-120267 | ||
| Chemical compound, drug | TRI Reagent LS | Sigma-Aldrich | Cat. #: T3934 | ||
| Software, algorithm | Zen | Zeiss | https://www.zeiss.com/microscopy/int/products/microscope-software/zen.html | ||
| Software, algorithm | Fiji ImageJ | ImageJ | https://imagej.net/Fiji | ||
| Software, algorithm | Andor IQ3 | Oxford Instruments | https://andor.oxinst.com/products/iq-live-cell-imaging-software/ | ||
| Software, algorithm | GraphPad Prism 8.2 | GraphPad | https://www.graphpad.com/ | ||
| Software, algorithm | BD FACSDiva | BD Biosciences | https://www.bdbiosciences.com/en-us/instruments/research-instruments/research-software/flow-cytometry-acquisition/facsdiva-software | ||
| Software, algorithm | FlowJo | FlowJo, LLC | https://www.flowjo.com/solutions/flowjo | Version 10 | |
| Software, algorithm | R | CRAN | https://cran.r-project.org | R Version 3.6.3 Bioconductor Version 3.10 | |
| Software, algorithm | Flexbar | PMID:24832523 | https://github.com/seqan/flexbar | Version 2.5 | |
| Software, algorithm | pyCRAC | S. Granneman (SynthSys) | http://sandergranneman.bio.ed.ac.uk/pycrac-software | Version 1.1.3 | |
| Software, algorithm | Novoalign | Novocraft | http://www.novocraft.com/products/novoalign/ | Version 3.04.06 | |
| Software, algorithm | CIMS | C. Zhang (Columbia University) | https://zhanglab.c2b2.columbia.edu/index.php/CTK_Documentation | ||
| Software, algorithm | Bedtools | PMID:20110278 A. Quinlan (University of Utah) | https://github.com/arq5x/bedtools2.git | Version 2.25.0 | |
| Software, algorithm | Samtools | PMID:19505943 H. Li (Harvard University) | http://samtools.sourceforge.net | Version 1.2 | |
| Software, algorithm | Cell Ranger | 10x Genomics | https://support.10xgenomics.com/single-cell-gene-expression/software/overview/welcome | Version 2.1.1 | |
| Software, algorithm | Seurat | PMID:29608179 R. Satija (New York University) | https://satijalab.org/seurat/ | Version 2.3.4 | |
| Software, algorithm | Monocle | PMID:28114287 C. Trapnell (University of Washington) | http://cole-trapnell-lab.github.io/monocle-release/ | Version 2.10.1 | |
| Software, algorithm | MAST | PMID:26653891 A. McDavid (University of Rochester Medical Center) | https://www.bioconductor.org/packages/release/bioc/html/MAST.html | Version 1.8.2 | |
Additional files
-
Supplementary file 1
Summary of all identified m6A sites through miCLIP.
- https://cdn.elifesciences.org/articles/56980/elife-56980-supp1-v2.xlsx
-
Supplementary file 2
Quantification of m6A levels based on the sum of normalized-to-input uTPM value of m6A along coding sequence (CDS SN-uTPM) and GSEA.
First sheet: Rank of mRNAs based on coding sequence SN-uTPM. Second sheet: GSEA of mRNAs weighted on coding sequence SN-uTPM. The gene sets with p values <0.25 are shown. Third sheet: GSEA of mRNAs with top 20% coding sequence SN-uTPM and top 20% translation efficiency. The gene sets with p values <0.10 are shown.
- https://cdn.elifesciences.org/articles/56980/elife-56980-supp2-v2.xlsx
-
Supplementary file 3
Differential gene expression analysis through scRNA-seq.
The extent of differential gene expression assessed by Z score (reflecting the extent of differential expression) and false discovery rate (FDR) was calculated between groups of Ctrl and cKO cells with the same identity, as indicated by sheet names in the file.
- https://cdn.elifesciences.org/articles/56980/elife-56980-supp3-v2.xlsx
-
Supplementary file 4
Different parameters used to assess m6A modification levels.
- https://cdn.elifesciences.org/articles/56980/elife-56980-supp4-v2.xlsx
-
Supplementary file 5
GSEA of transcripts with Z score (cKO/Ctrl)>1.96, FDR <0.05 in scRNA-seq and m6A coding sequence SN-uTPM per nt among the top 20%.
The gene sets with p values <0.05 are shown.
- https://cdn.elifesciences.org/articles/56980/elife-56980-supp5-v2.xlsx
-
Supplementary file 6
Sequences of genotyping and qPCR primers used in this study.
- https://cdn.elifesciences.org/articles/56980/elife-56980-supp6-v2.xlsx
-
Transparent reporting form
- https://cdn.elifesciences.org/articles/56980/elife-56980-transrepform-v2.pdf
Download links
A two-part list of links to download the article, or parts of the article, in various formats.
Downloads (link to download the article as PDF)
Open citations (links to open the citations from this article in various online reference manager services)
Cite this article (links to download the citations from this article in formats compatible with various reference manager tools)
m6A RNA methylation impacts fate choices during skin morphogenesis
eLife 9:e56980.
https://doi.org/10.7554/eLife.56980


