A missense in HSF2BP causing primary ovarian insufficiency affects meiotic recombination by its novel interactor C19ORF57/BRME1
- Molecular Mechanisms Program, Centro de Investigación del Cáncer and Instituto de Biología Molecular y Celular del Cáncer (CSIC-Universidad de Salamanca), Spain
- Université de Paris, France
- Institut Jacques Monod, Université de Paris, France
- Reproductive Biology Group, Division of Developmental Biology, Department of Biology, Faculty of Science, Utrecht University, Netherlands
- Transgenic Facility, Nucleus platform, Universidad de Salamanca, Spain
- Departamento de Medicina, Universidad de Salamanca, Spain
- The Genetic Institute, "Emek" Medical Center, Israel
- Bruce and Ruth Rappaport Faculty of Medicine, Technion, Israel
- Departamento de Fisiología y Farmacología, Universidad de Salamanca, Spain
- Université Paris-Saclay, Institut de Biologie F. Jacob, Commissariat à l’Energie Atomique, France
Figures
Figure 1 with 3 supplements
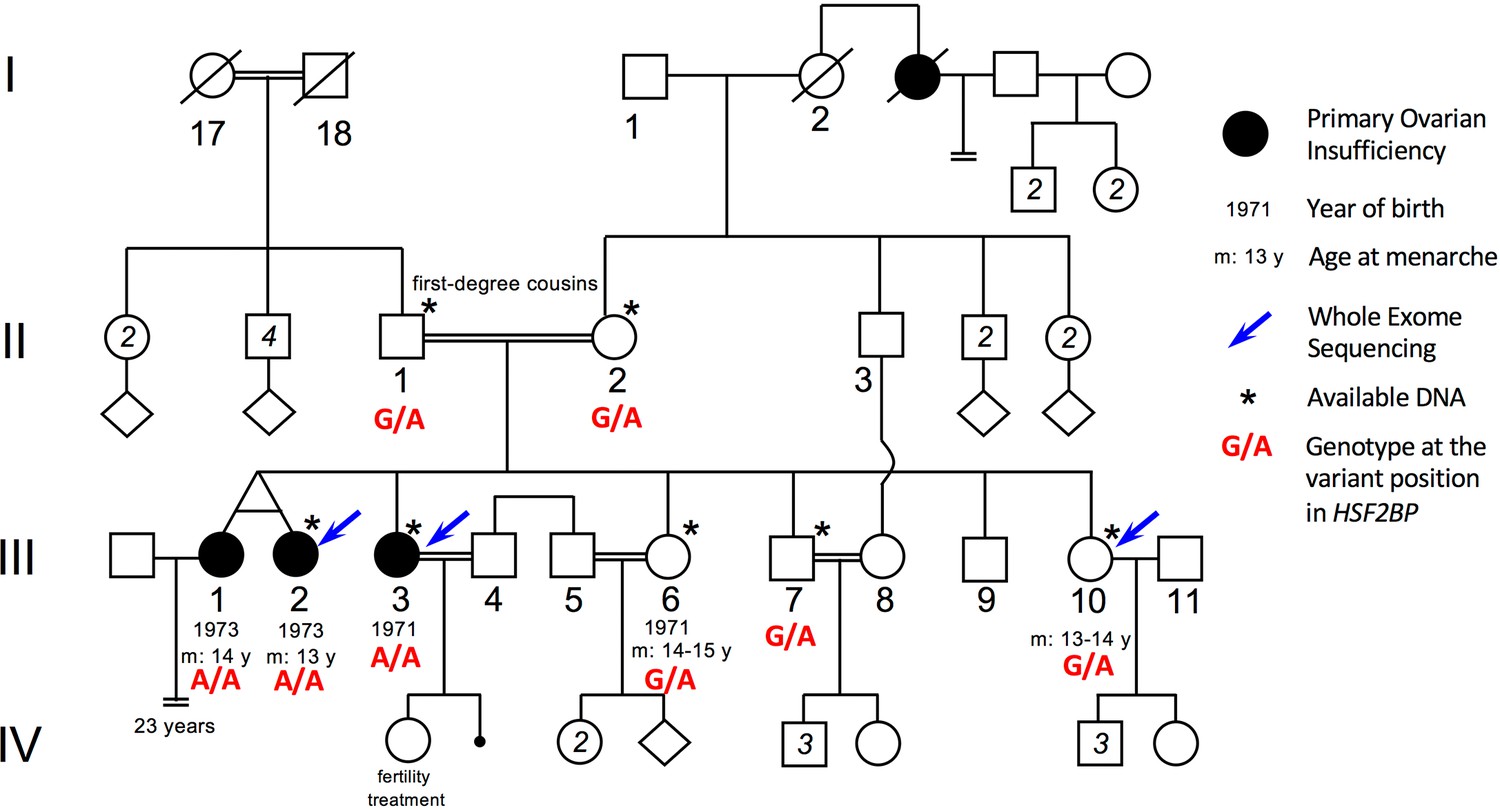
Pedigree of the consanguineous family with the variant HSF2BP-S167L.
III-1 and III-2 are monozygotic twins, who appear phenotypically dizygotic. Clinical investigation confirmed POI, with normal 46, XX karyotype (500 bands and SKY spectral karyotyping). Year of birth and age of menarche are indicated when known. III-1 became amenorrheic at age 24 and III-2 at age 25, both after irregular menstruations since menarche. III-1 presents with a short stature (152 cm, within the 3–5 percentile), a normal neck, cubitus valgus and metacarpal shortening of 4–5. Ultrasound investigation showed normal uterus and ovaries. Her g-banding karyotyping was normal 46, XX (500 bands) and variants in FMR1 gene were ruled out. III-2 displays a normal secondary sexual development with no dysmorphic sign. Clinical investigation confirmed POI, with normal 46, XX karyotype (500 bands and SKY spectral karyotyping). The elder sister III-3 was also diagnosed with POI, with no further clinical information. She is 160.5 cm. She had one normal pregnancy with the help of ‘fertility treatment’, and a second unsuccessful attempt. The two fertile sisters, III-6 and III-10 had their menarche at 14–15 and 13–14 respectively, with regular menstruations ever since. They are respectively 150 cm and 151 cm, with no clinical sign, and each one had several children without difficulties. The fertile brother III-7 is 171 cm and shows no health or fertility problem. He developed frontal baldness since the age of 30. The genotype of each individual at the variant genomic position in HSF2BP is shown in red, as determined by Sanger sequencing for available DNAs (See Figure 1—figure supplement 1).
Figure 1—figure supplement 1
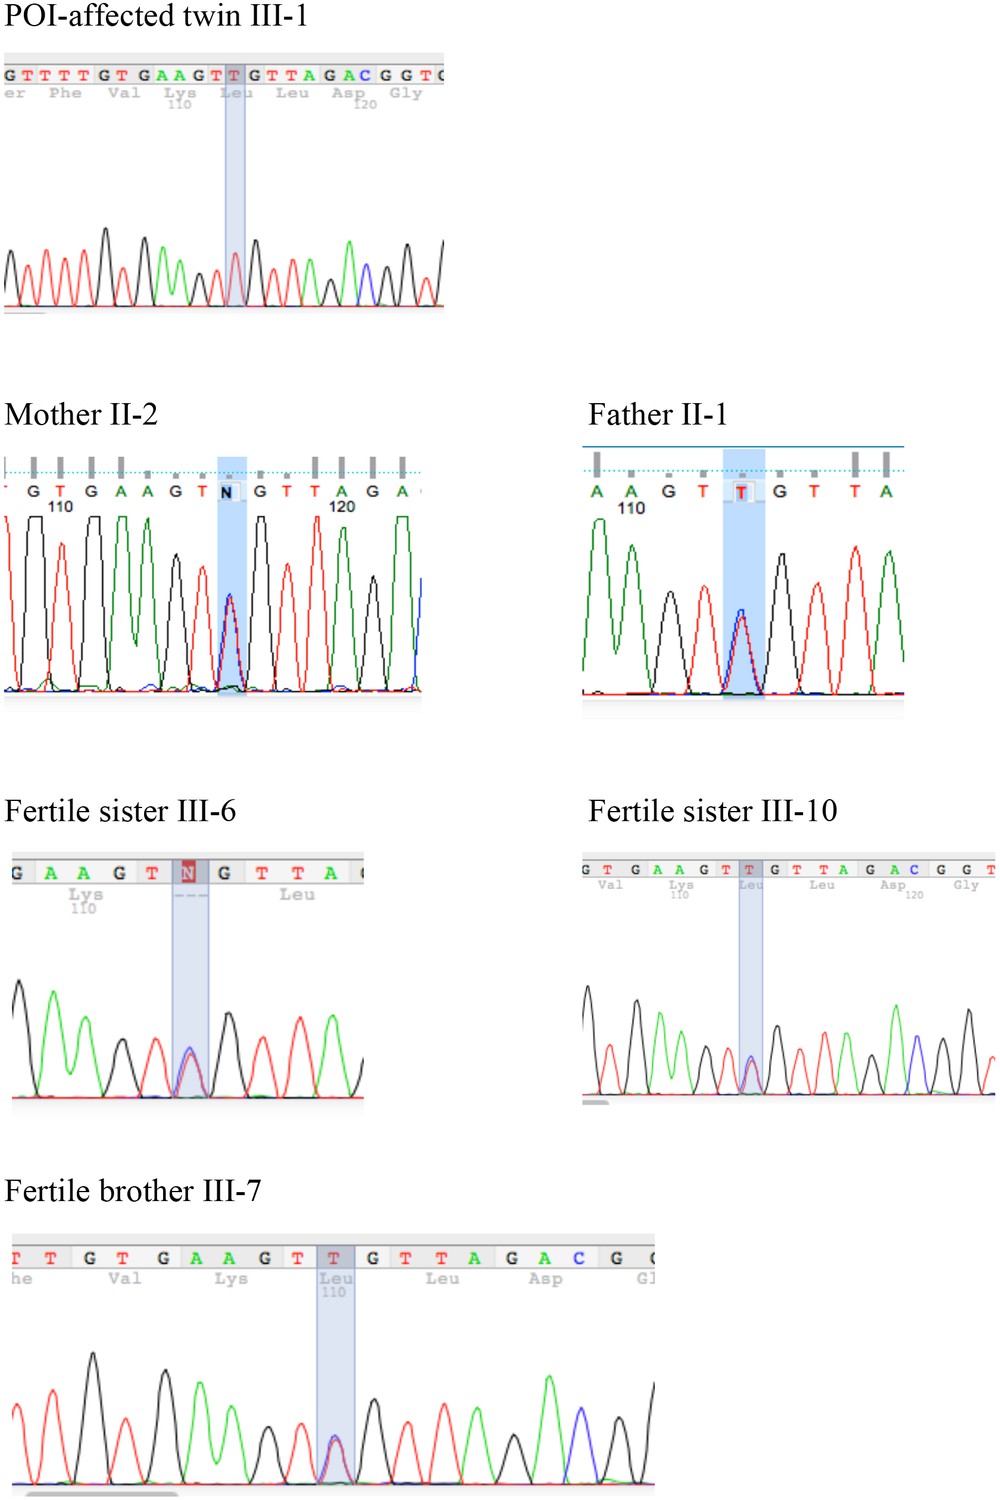
Segregation of the S167L Variant in HSF2BP in the consanguineous family shows the chromatograms obtained by Sanger sequencing of the HSF2BP-S167L variant in the family.
Figure 1—figure supplement 2
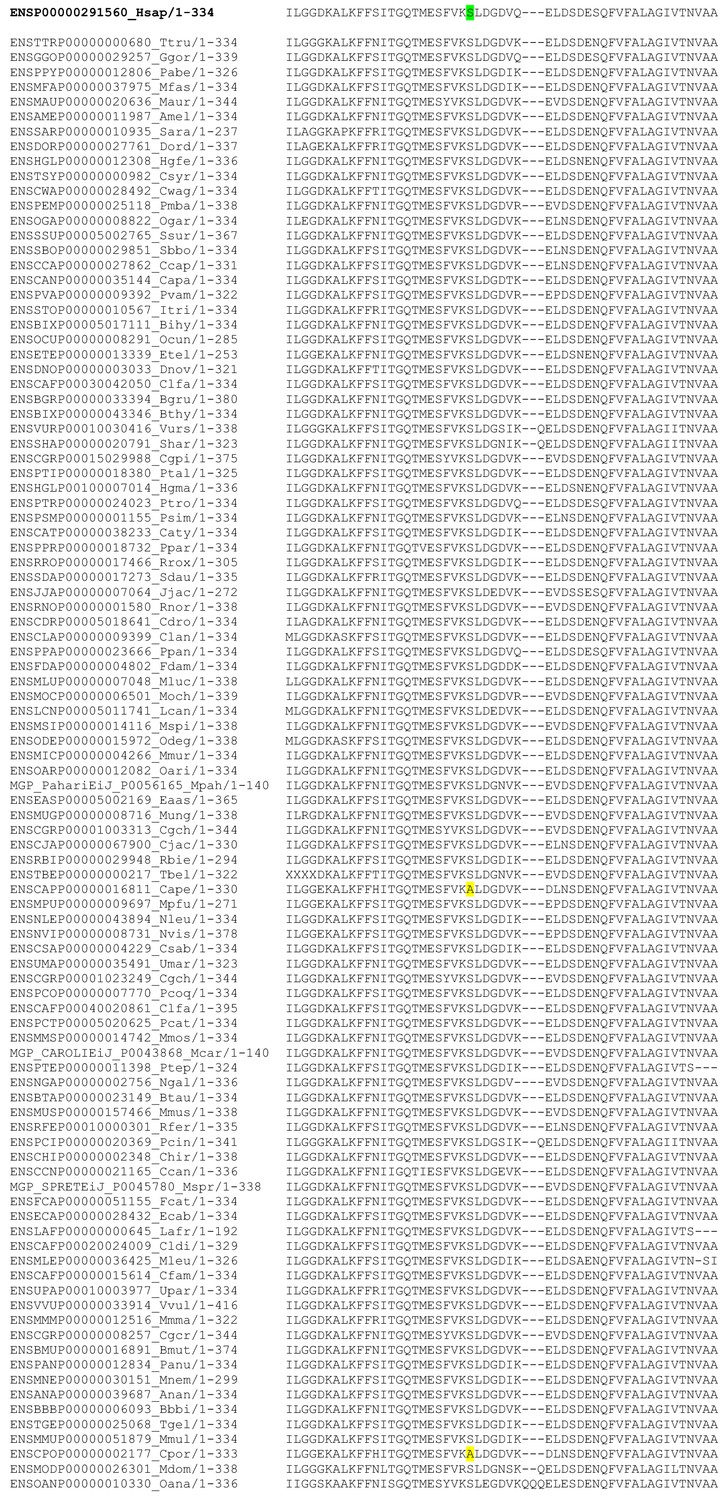
Strong conservation of the Ser167 residue in HSF2BP protein in 99 mammals.
CLUSTAL W 2.0 multiple sequence alignment of one-to-one orthologues. The human Ser167 (green) is conserved in 97 of the 99 available sequences in mammals. The only two changes are highlighted in yellow in Cavia aperea (Cape, Brazilian guinea pig) and Cavia porcellus (Cpor, guinea pig).
Figure 1—figure supplement 3
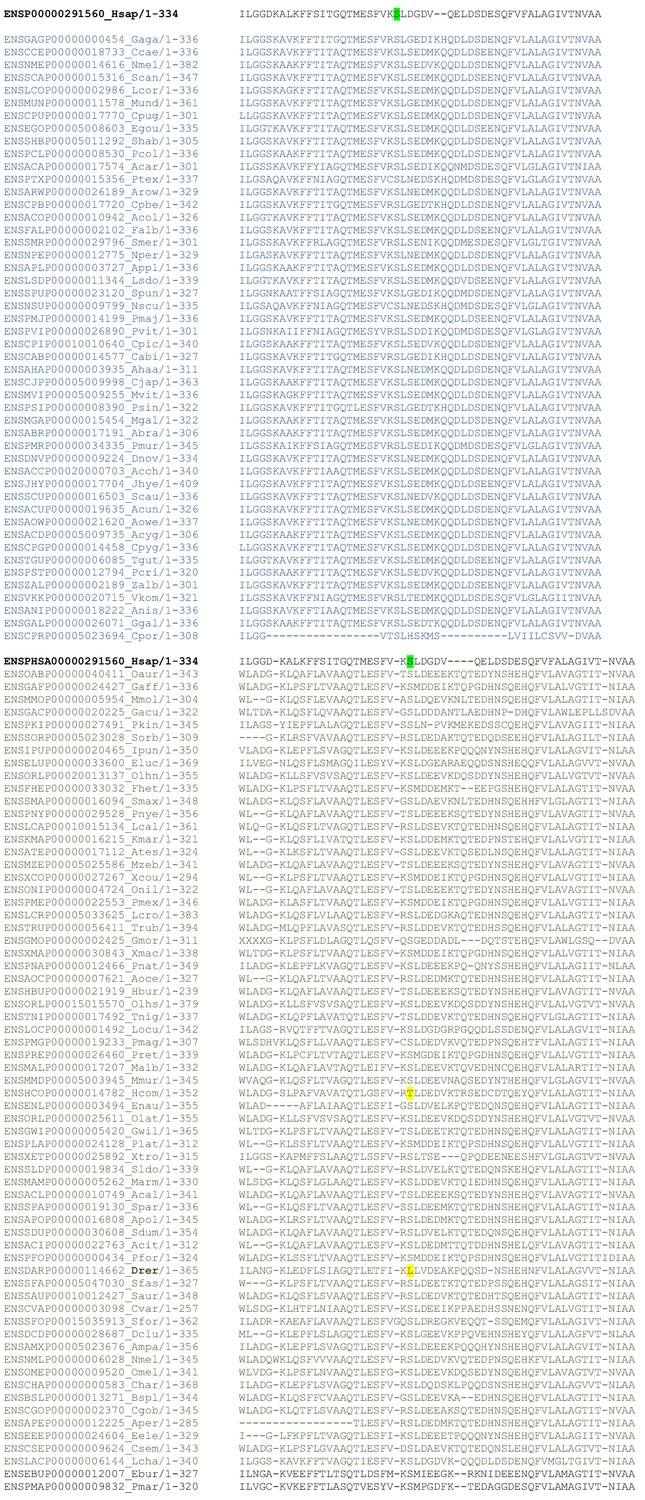
Strong conservation of the Ser167 residue in HSF2BP in 48 birds and reptiles and 64 fish species.
CLUSTAL W 2.0 multiple sequence alignment of one-to-one orthologues. The human Ser167 position (green) is strictly conserved in the 48 available sequences from birds and reptiles (sequences in dark blue) and is conserved in 63 of the 65 available sequences in fish and jawless fish (sequences in dark green). The only two changes in fish species are highlighted in yellow in Hippocampus comes (Hcom, Tiger tail seahorse) and Danio rerio (Drer, zebrafish). All other fish have a Ser in this position, including the Coelacanth and the more distantly-related jawless vertebrates, the Lamprey and the Hagfish.
Figure 2 with 2 supplements
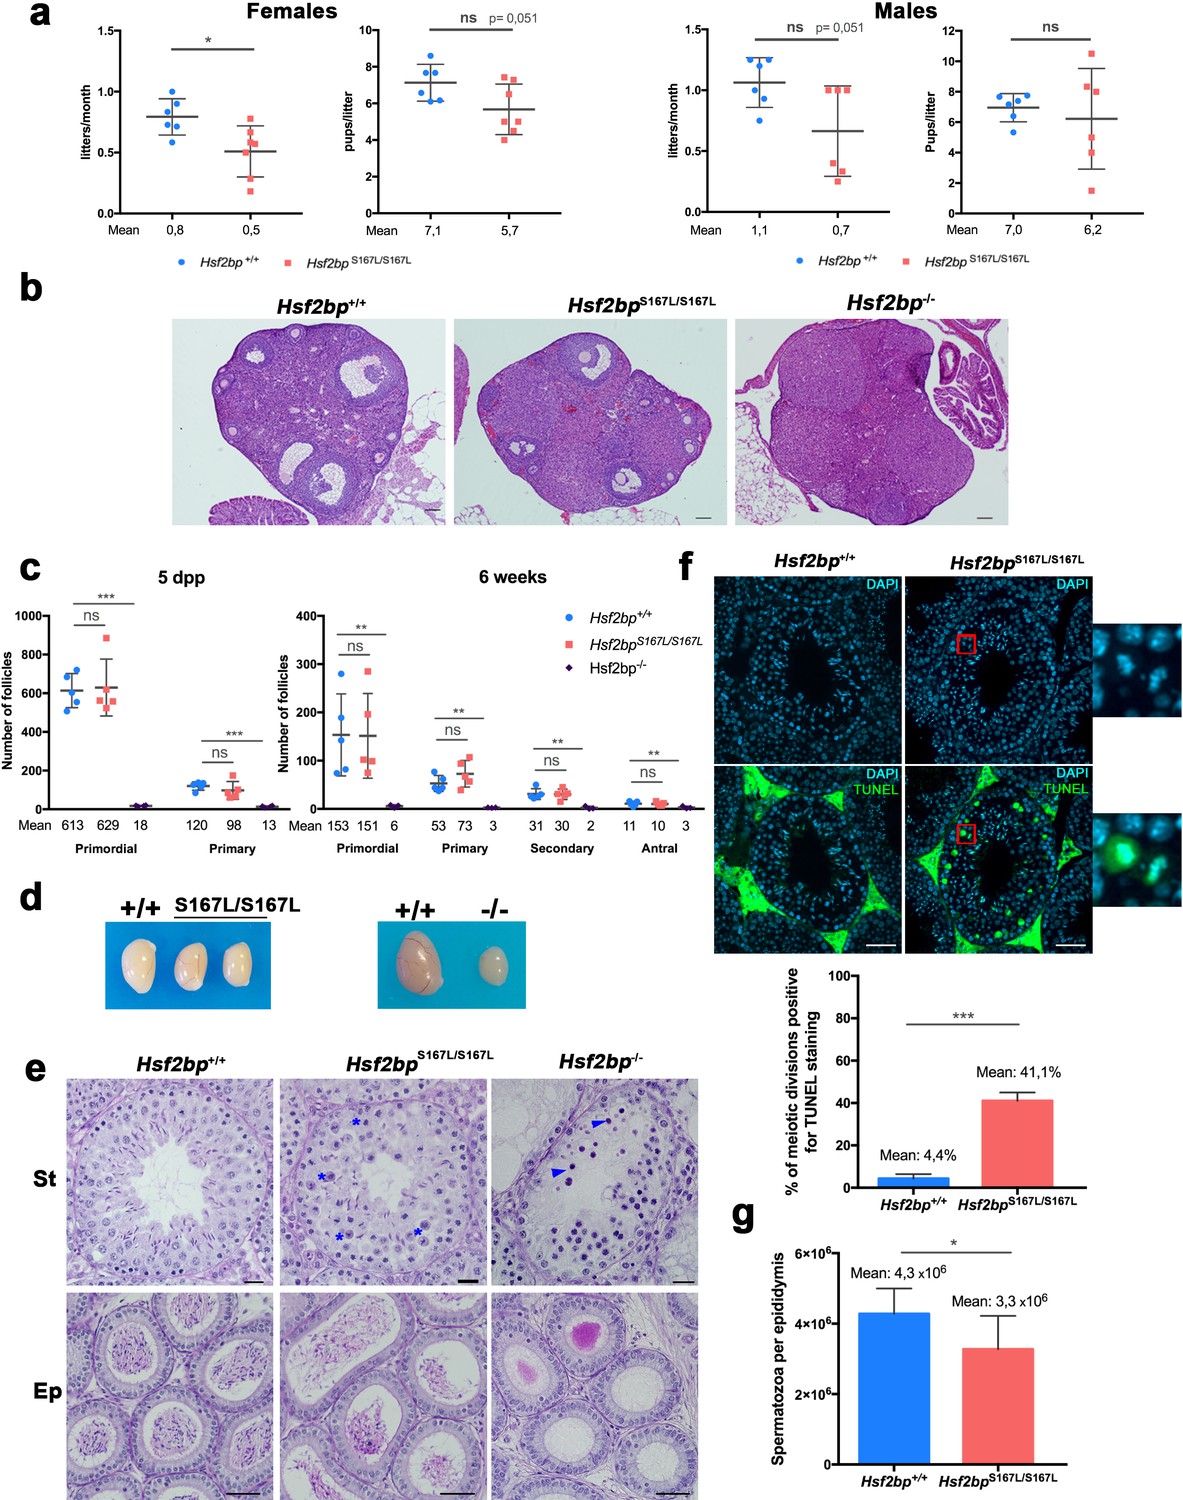
Mice carrying the HSF2BP S167L variant show a partial reduction of fertility.
(a) Fertility assessment of males and female Hsf2bpS167L/S167L and WT mice showing the number of litters per month and the number of pups per litter (see Materials and methods). Mice: Hsf2bp+/+n = 6 females/6 males, Hsf2bpS167L/S167Ln = 7 females/6 males. Two-tailed Welch’s t-test analysis: *p<0.05. (b) Hematoxylin and eosin stained sections of ovaries from adult (8 weeks) Hsf2bp+/+, Hsf2bpS167L/S167L and Hsf2bp-/- females. Hsf2bp-/- ovaries but not Hsf2bp+/+ and Hsf2bpS167L/S167L showed a strong depletion of follicles. Bar in panels 100 μm. (c) Quantification of the number of follicles (primordial, primary, secondary and antral follicles) per ovary in Hsf2bp+/+, Hsf2bpS167L/S167L and Hsf2bp-/- females at 5 dpp and 6 weeks of age showing no differences between Hsf2bp+/+ and Hsf2bpS167L/S167L but a strong reduction in the oocyte pool in Hsf2bp-/- females. Ovaries: five dpp/6 weeks = 5/5 ovaries from Hsf2bp+/+ and Hsf2bpS167L/S167L and 4/3 from Hsf2bp-/-. Two-tailed Welch’s t-test analysis: ns, no significant differences, **p<0.01, ***p<0.001. (d) Testis size of Hsf2bpS167L/S167L (left, 21% reduction) and Hsf2bp-/- mice (right, 70% reduction) in comparison with their WT counterparts. See Figure 2—figure supplement 2b for the quantification. (e) PAS and Hematoxylin stained testis sections. The S167L variant leads to a partial spermatogenic arrest with an elevated number of apoptotic meiotic divisions (blue asterisks) and a reduction of the number of spermatozoa in the epididymides in comparison with the WT control (Hsf2bp+/+). The null allele (Hsf2bp-/-) showed a complete spermatogenic arrest at epithelial stage IV and absence of spermatozoa. Massive apoptosis of spermatocytes is indicated (blue arrowheads). Bar: upper panels 10 μm, lower panels 20 μm. (St) Seminiferous tubules, (Ep) Epididymides. (f) Immunohistochemical detection of apoptotic cells by TUNEL staining showing an increase of apoptotic meiotic divisions in stage XII tubules from Hsf2bpS167L/S167L males (magnified panel). Plot under the panel represents the quantification. Mice: n = 3 adult mice for each genotype. Two-tailed Welch’s t-test analysis: ***p<0.001. Bar in panel, 25 μm. (g) Quantification of epididymal sperm in Hsf2bp+/+ and Hsf2bpS167L/S167L adult mice. Epididymides: n = 8 for each genotype. Two-tailed Welch’s t-test analysis: *p<0.05.
Figure 2—figure supplement 1
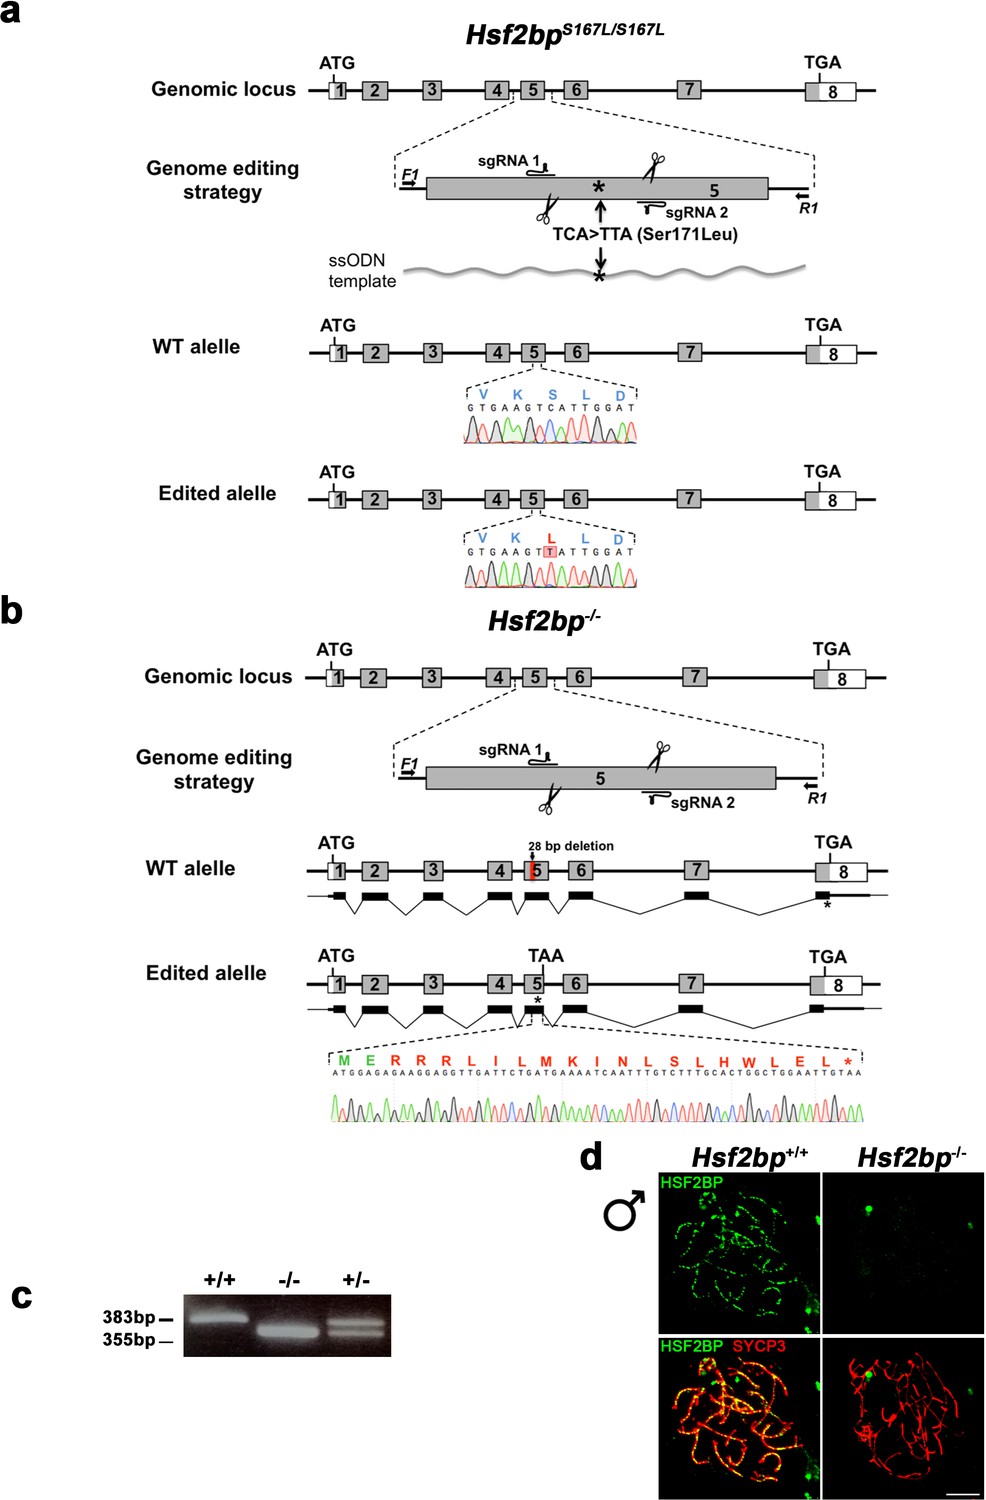
Generation and genetic characterization of Hsf2bp S167L and Hsf2bp-deficient mice.
(a–b) Diagrammatic representation of the mouse Hsf2bp locus (WT) and the genome editing strategy (see Materials and methods) for the generation the Hsf2bp Ser167Leu and null alleles. The sgRNAs are located on exon 5. The corresponding coding exons (light grey) and non-coding exons (open boxes) are represented. ATG, initiation codon; TGA/TAA and *, stop codon. The nucleotide sequence of the WT and edited allele derived from PCR amplification of DNA from Hsf2bp+/+, Hsf2bpS167L/S167L and Hsf2bp-/- mice is indicated. Arrows represent genotyping primers (F1 and R1). (a) The ssODN bears the desired mutation (TCA >TTA, S171L) on the homologous residue of the variant identified in the family affected with POI (S167L). The murine allele is referred with the human variant (S167L). (b) Thin (non-coding) and thick (coding sequences) lines under exons represent the expected transcript derived from WT and Hsf2bp edited allele. (c) PCR analysis of genomic DNA from three littermate progeny of Hsf2bp+/- heterozygote crosses. The PCR amplification with primers F1 and R1 revealed 383 and 355 bp fragments for WT and disrupted alleles, respectively. WT (+/+), heterozygous (+/-), and homozygous knock-out (-/-) animals. (d) Double immunofluorescence of spermatocytes at zygotene/zygotene-like stage obtained from Hsf2bp+/+ and Hsf2bp-/- mice using SYCP3 (red) and a rabbit polyclonal antibody against HSF2BP (green, see Materials and methods). Bar in panel, 10 μm. This immunofluorescence analysis, together with the western blot analysis showed in Figure 3c, show the absence of HSF2BP in the knock-out mice as well as the specificity of the antibodies raised against the protein. Bar in panel, 10 μm.
Figure 2—figure supplement 2
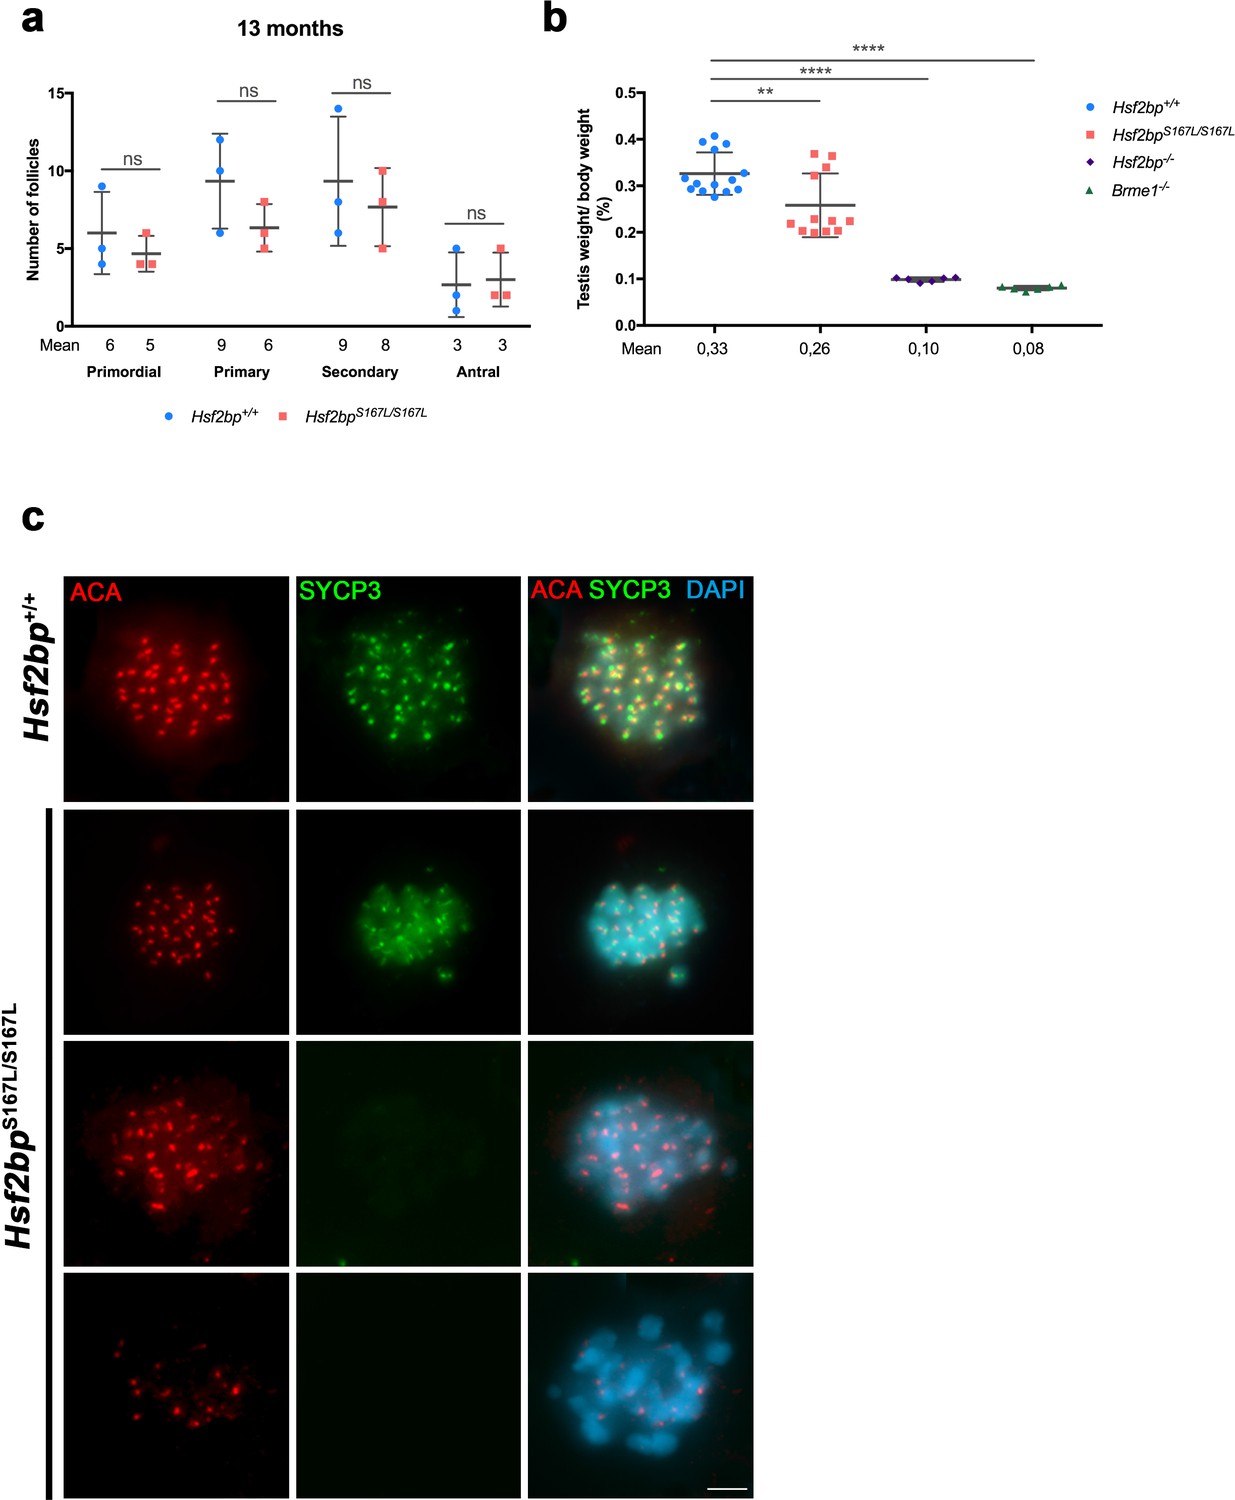
Fertility defects in Hsf2bpS167L/S167L mice.
(a) Quantification of the number of follicles per ovary showing no differences between Hsf2bp+/+ and Hsf2bpS167L/S167L females at 13 months of age. Four different oocyte stages have been identified: primordial, primary, secondary and antral follicles. Ovaries: three ovaries of each genotype. Two-tailed Welch´s t-test analysis: ns, no significant differences. (b) Testis to body weight ratio is strongly reduced in Hsf2bp-/- and Brme1-/- mutants and shows a lower reduction in the Hsf2bpS167L/S167L mutant. (c) Co-labeling of SYCP3 (green) and ACA (red) in squashed preparations of tubules from WT and S167L mice. In the mutant mice, a large number of metaphases I were apoptotic with partial or total loss of immunoreactivity for the labeled proteins. Bar in panel, 10 μm.
Figure 3 with 1 supplement
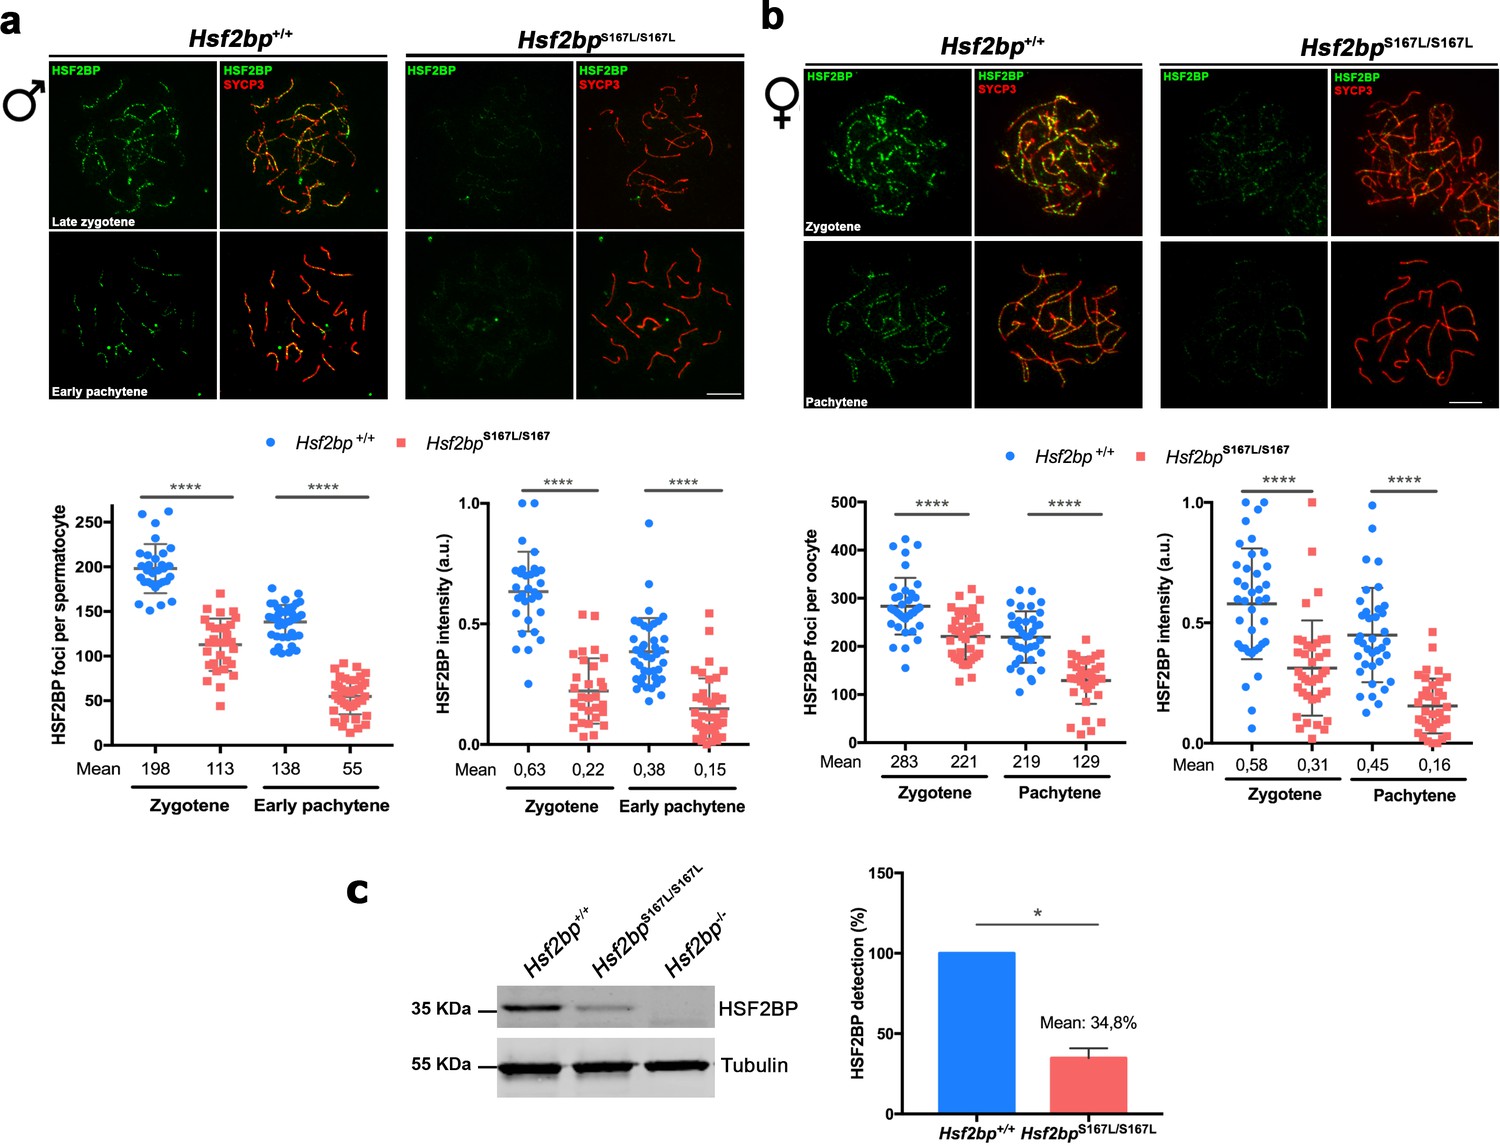
Meiocytes from Hsf2bpS167L/S167L mice show a decrease in the expression of HSF2BP.
(a–b) Double immunofluorescence of HSF2BP (green) and SYCP3 (red) in Hsf2bp+/+and Hsf2bpS167L/S167L (a) spermatocyte and (b) oocyte spreads showing a strong reduction in the labeling of HSF2BP at the chromosome axis. Plots under the panels show the quantification. Nuclei analyzed: 30 zygonemas and 40 pachynemas from two adult male mice of each genotype. In females 38/39 zygonemas and 37/35 pachynemas from two 17.5 dpc embryos of Hsf2bp+/+ and Hsf2bpS167L/S167L, respectively. Two-tailed Welch’s t-test analysis: ****p<0.0001. (c) Western blot analysis of protein extracts from 13 dpp WT, Hsf2bpS167L/S167L and Hsf2bp-/- testes using polyclonal antibodies against HSF2BP. Tubulin was used as loading control. Graph on the right represents the relative quantification of the immunoblotting. Mice: n = 2 Hsf2bp+/+, Hsf2bpS167L/S167L and Hsf2bp-/-. Two-tailed Welch’s t-test analysis: *p<0.05. Bar in panels a-c, 10 μm.
Figure 3—figure supplement 1

Hsf2bpS167L/S167L mice do not show synapsis defects.
(a–b) Double immunolabeling of spermatocyte (a) and oocyte (b) spread preparations with SYCP1 (green) and SYCP3 (red), showing that meiotic prophase proceeds with no defects in synapsis/desynapsis in Hsf2bpS167L/S167L mutants. (c) Immunofluorescence of spermatocyte spreads of WT and Hsf2bp-/- with SYCP3 (red) and SYCP1 (green). Hsf2bp-/- males show a spermatogenic arrest at a zygotene-like stage displaying synapsis between non-homologous chromosomes (partner switch phenotype). (d) Immunofluorescence of oocyte spreads (17.5 dpc) of WT and Hsf2bp-/- with SYCP3 (red) and SYCP1 (green). Hsf2bp-/- females show a delay in prophase I progression with an increase of cells with synapsis defects. Bar in panels, 10 μm.
Figure 4 with 1 supplement

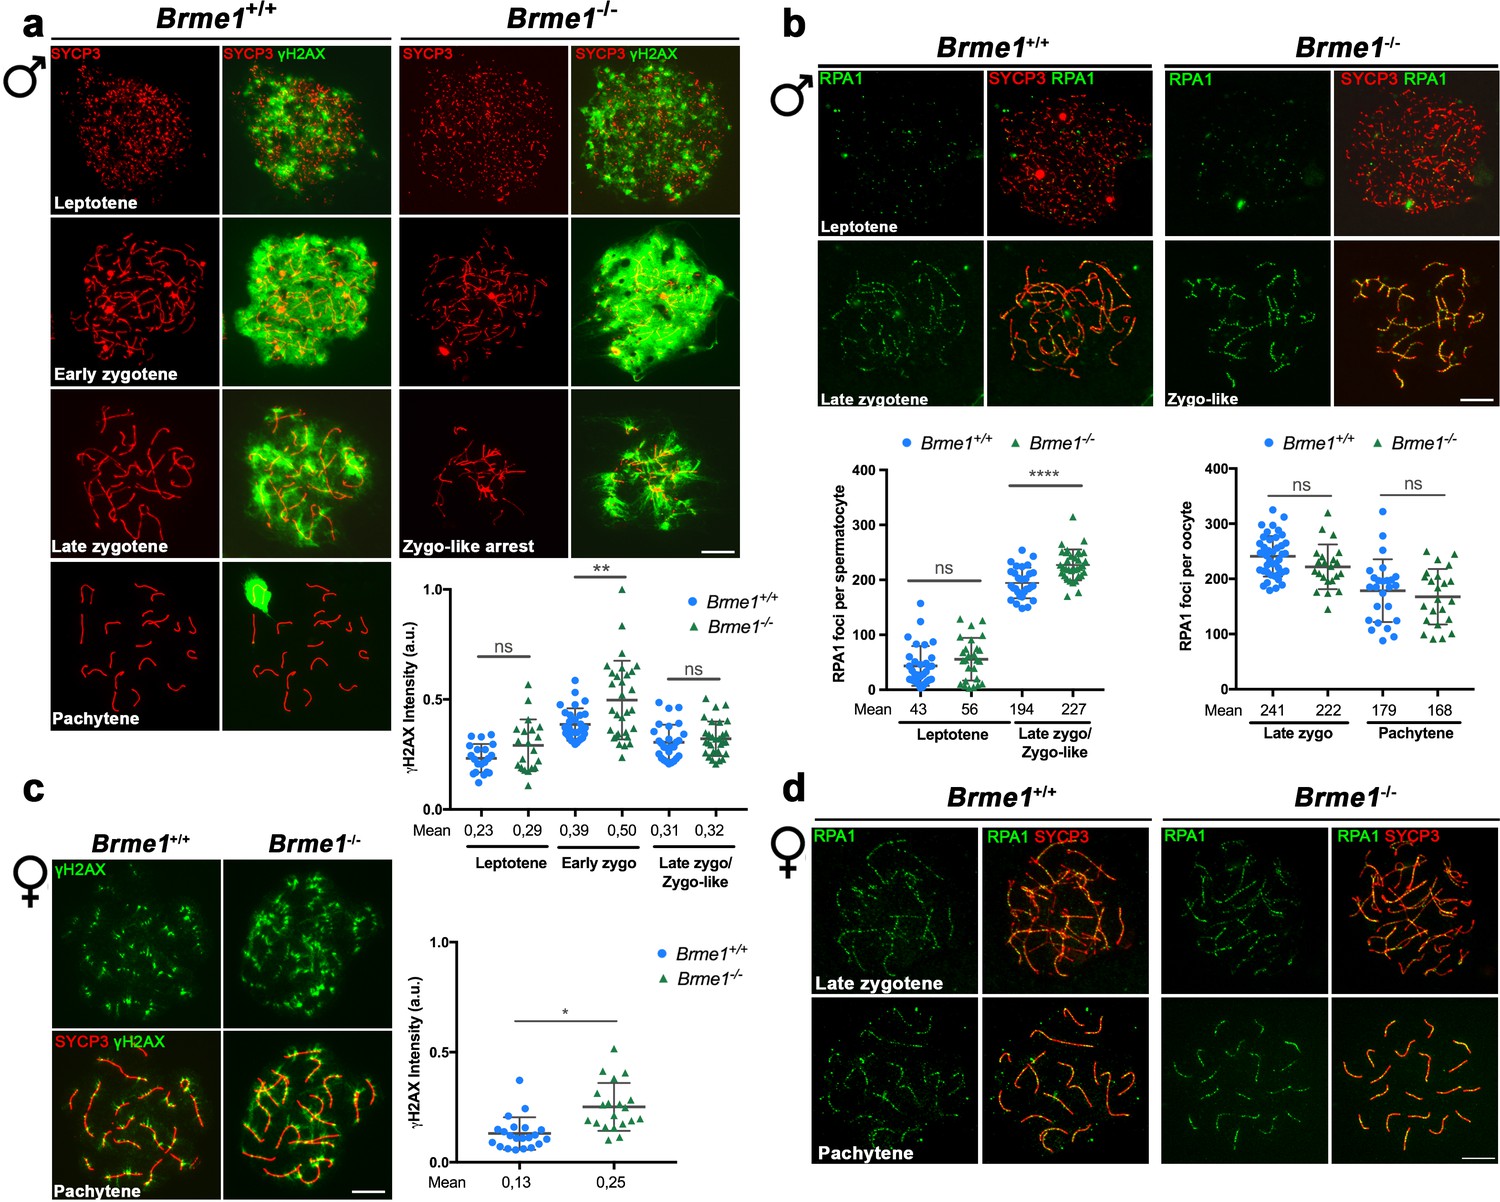
DNA repair in Hsf2bpS167L/S167L mice.
(a, c) Double labeling of γH2AX (green) and SYCP3 (red) in (a) spermatocyte and (c) oocyte spreads from WT, Hsf2bpS167L/S167L and Hsf2bp-/- mice. (a) Males display an accumulation of γH2AX patches in Hsf2bpS167L/S167L pachynemas and a strong accumulation in the whole nucleus in Hsf2bp-/- zygotene-like arrested cells. Plots on the right of the panel represent the percentage of pachynemas with γH2AX labeling (Nuclei: 364 Hsf2bp+/+ and 376 Hsf2bpS167L/S167L from three adult mice) and the quantification of γH2AX intensity on autosomes at early and mid-pachytene stages (Nuclei: 53 early and 60 mid pachynemas from three adult mice of each genotype). Two-tailed Welch’s t-test analysis: *p<0.05, ****p<0.0001. (c) In females there is an accumulation of γH2AX in Hsf2bpS167L/S167L pachynemas that is stronger in those from Hsf2bp-/- females. Nuclei: n = 21/20/19 pachynemas from 2 Hsf2bp+/+/Hsf2bpS167L/S167L/Hsf2bp-/- embryos (17.5 dpc). Two-tailed Welch’s t-test analysis: *p<0.05, ****p<0.0001. (b, d) Double immunolabeling of RPA1 (green) and SYCP3 (red) in (b) spermatocyte and (d) oocyte spreads from Hsf2bp+/+, Hsf2bp S167L/S167L and Hsf2bp-/-. (b) In males, RPA1 accumulates at early and mid-pachytene in S167L spermatocytes and in the zygotene-like arrested cells from Hsf2bp-/-. Plot on the right of the panel represents the quantification. Nuclei: n = 31/34/37 leptonemas, n = 29/29/37 zygonemas/zygonemas-like from three adult Hsf2bp+/+, Hsf2bp S167L/S167L and Hsf2bp-/- mice respectively, n = 33 early and 46 mid pachynemas from three adult Hsf2bp+/+ and Hsf2bp S167L/S167L mice. Two-tailed Welch’s t-test analysis: ns, no significant differences; **p<0.01, ****p<0.0001. (d) In females, RPA1 labeling is similar in Hsf2bp+/+, Hsf2bp S167L/S167L and Hsf2bp-/- oocytes at zygotene and pachytene. Plot on the right of the panel represents the quantification. Nuclei: Hsf2bp+/+/Hsf2bp S167L/S167L/ Hsf2bp-/- n = 42/41/23 zygonemas from two embryos (16.5 dpc) and n = 25/25/24 pachynemas from two embryos (17.5 dpc). Two-tailed Welch’s t-test analysis: ns, no significant differences. Bar in all panels, 10 μm. Extended panels for RPA1 figures in Figure 4—figure supplement 1.
Figure 4—figure supplement 1
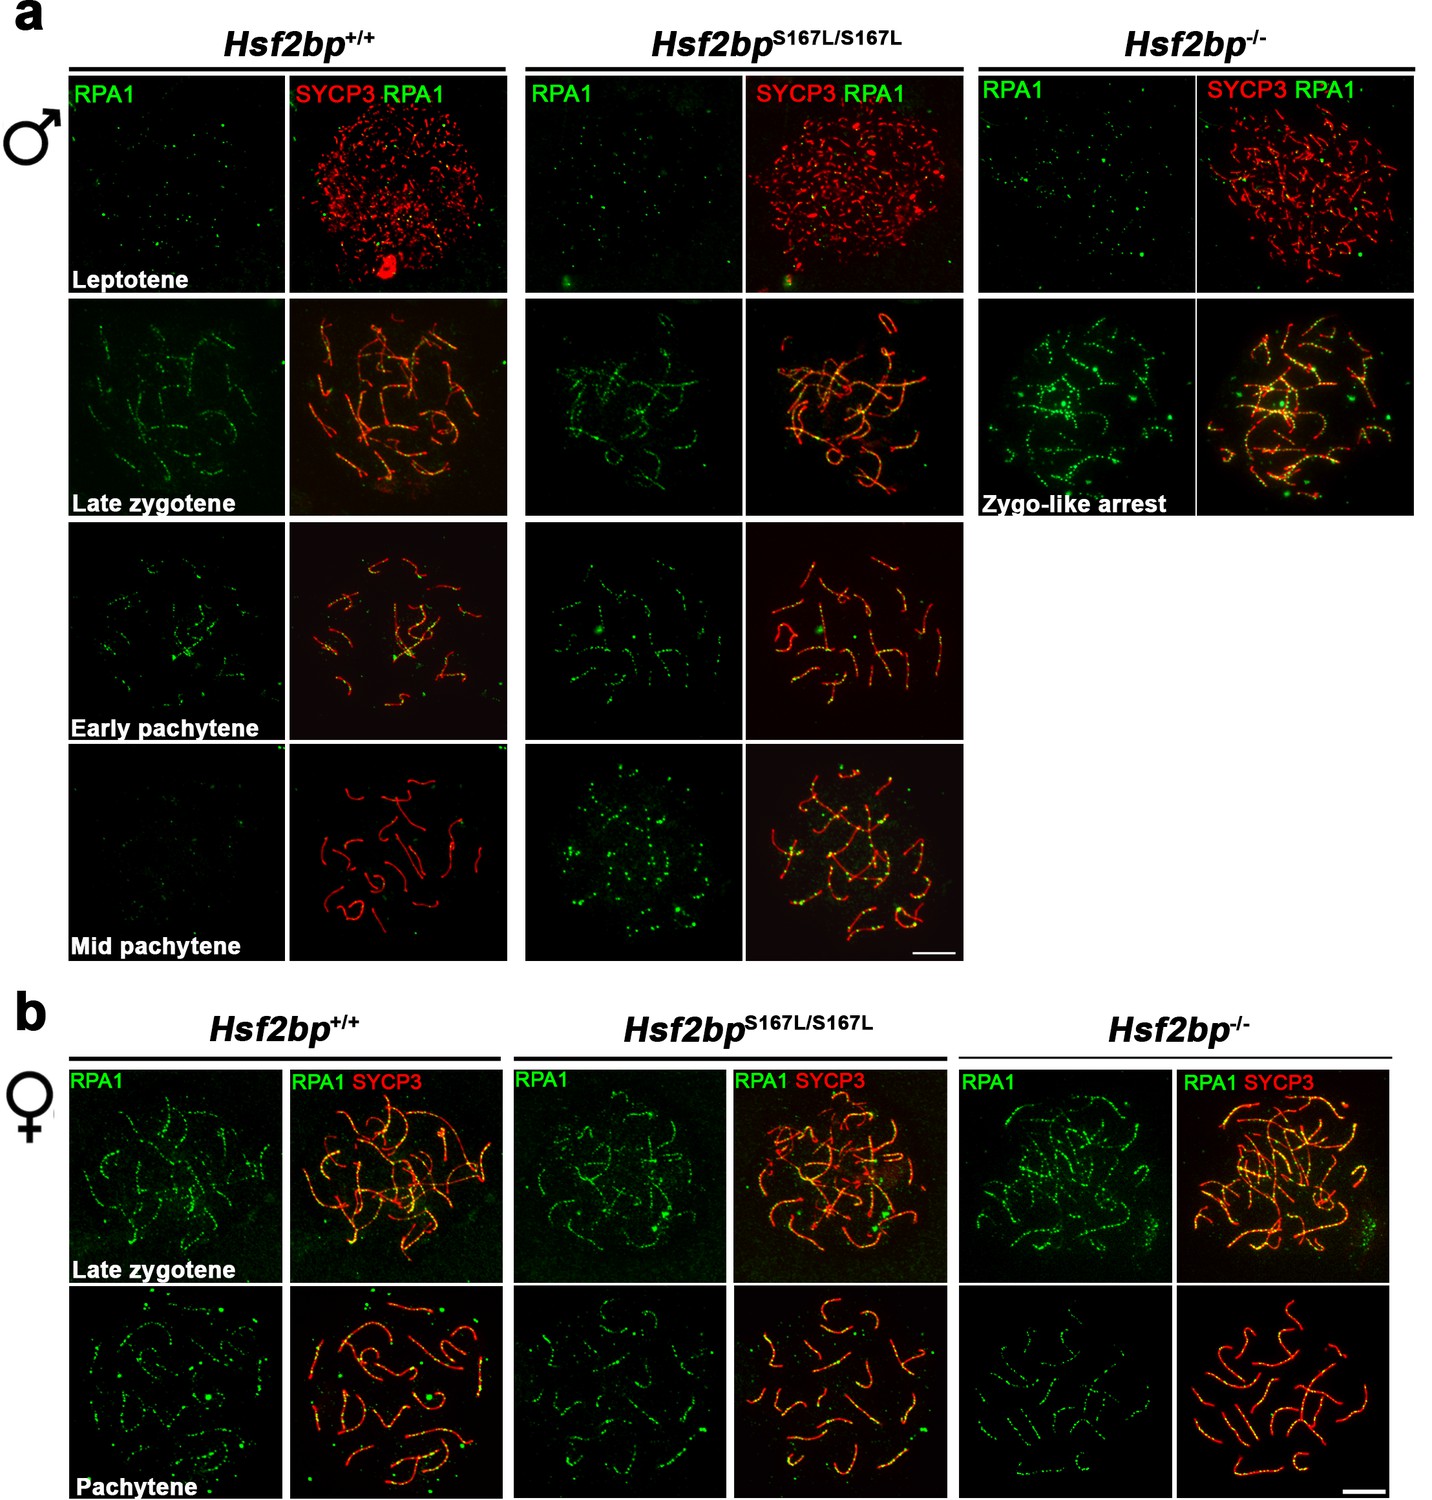
RPA localization in Hsf2bp mutants.
Extended panels for Figure 4b and d. (a–b) Double immunolabeling of RPA (green) and SYCP3 (red) in (a) spermatocyte and (b) oocyte spreads from Hsf2bp+/+, Hsf2bp S167L/S167L and Hsf2bp-/-. See quantification plots in Figure 4b and d. All the prophase I stages quantified are included on these panels. The late zygonemas and mid pachynemas from males and the pachynemas from females are also presented in Figure 4b and d, respectively. Bar in panels, 10 μm.
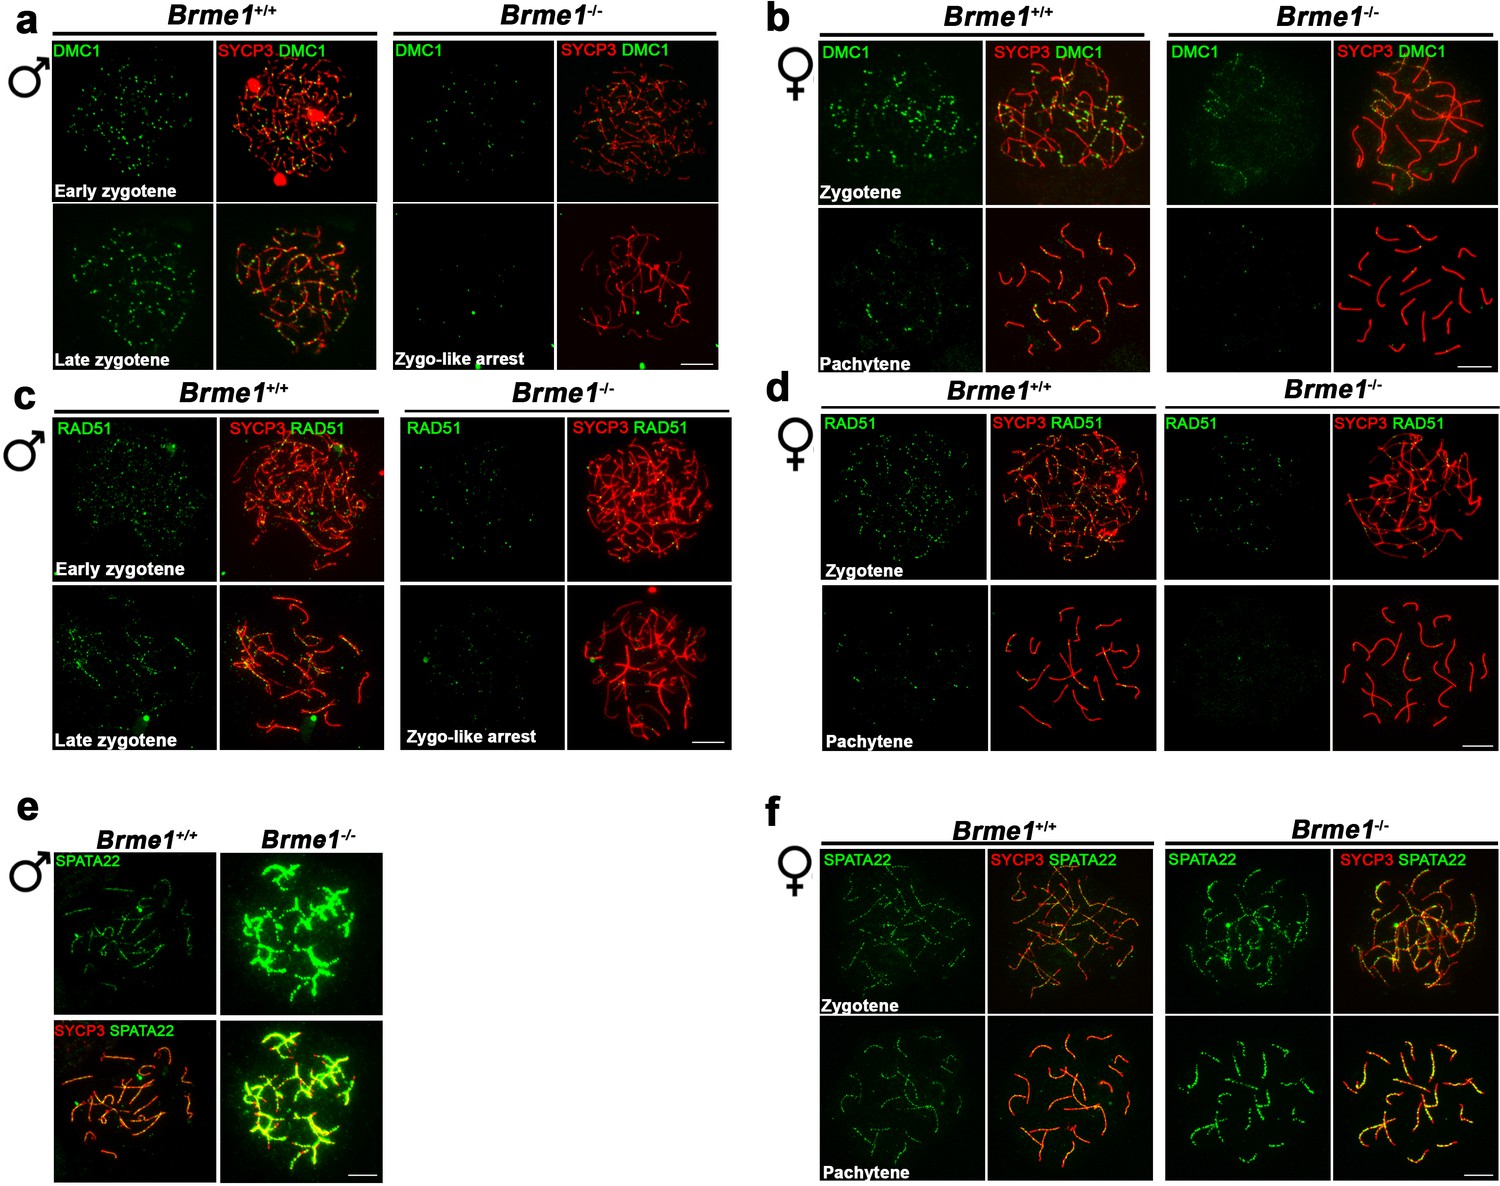
Figure 5 with 1 supplement
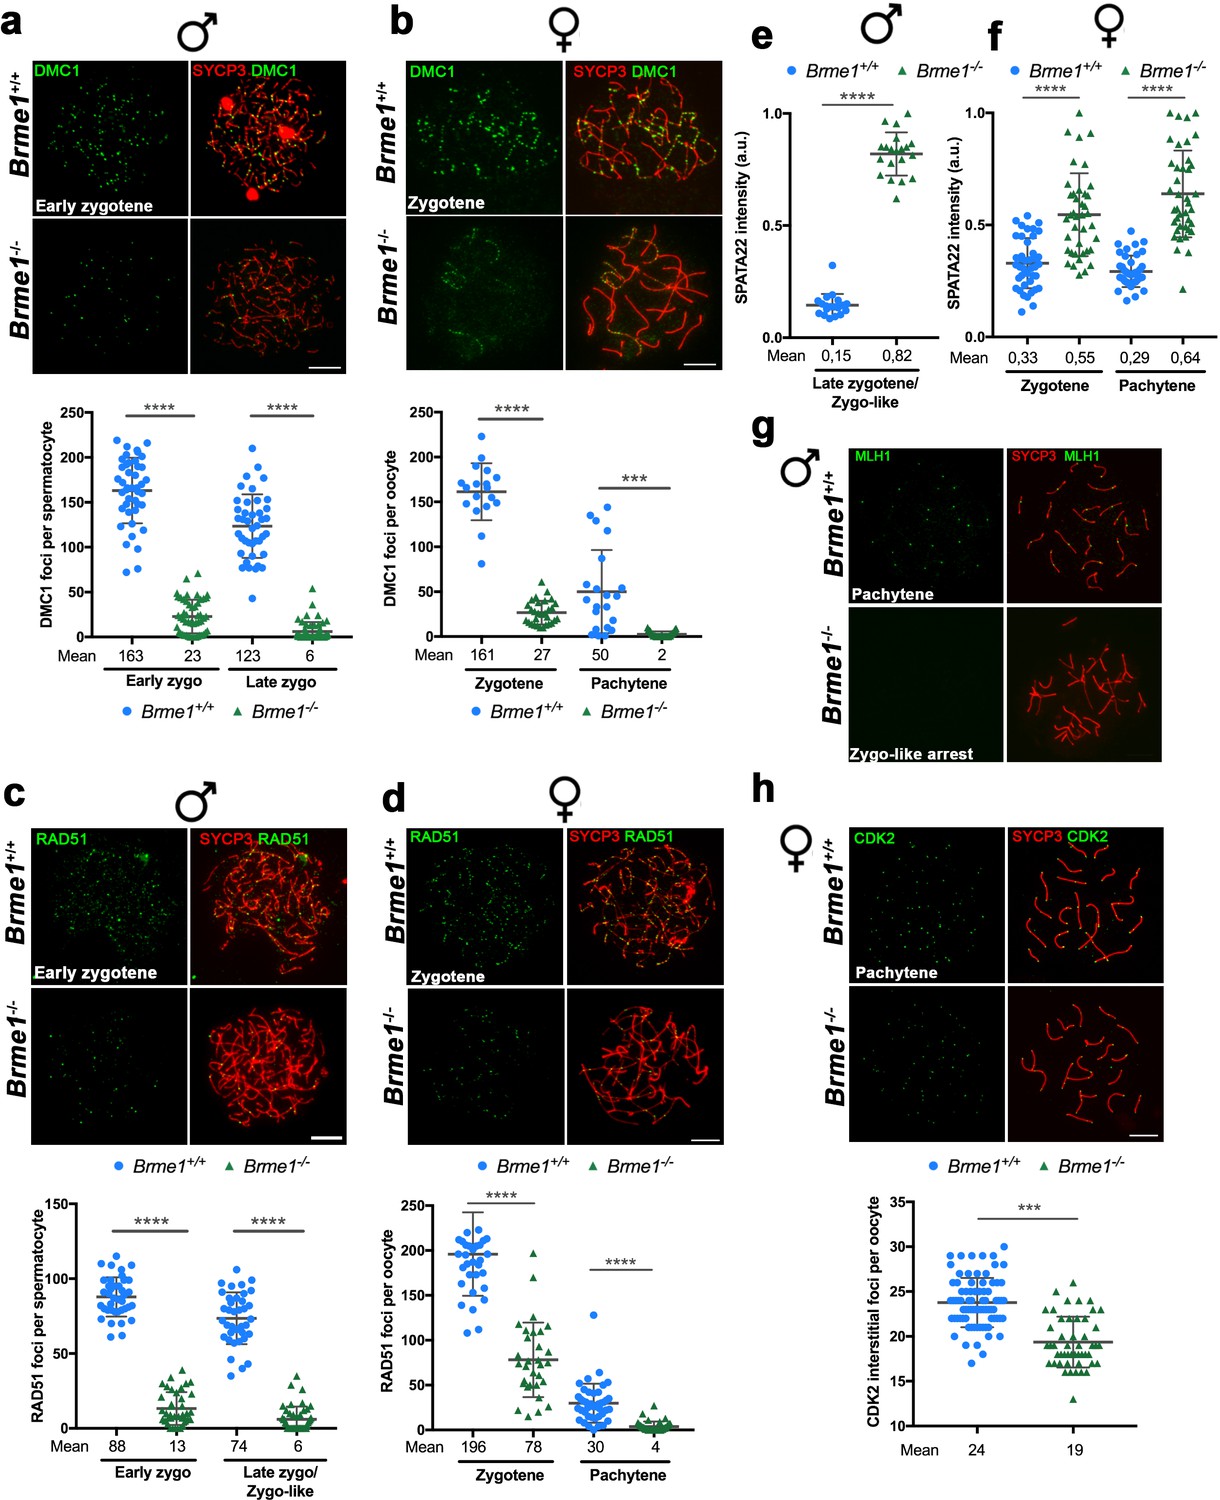
The loading of recombinases is compromised in Hsf2bpS167L/S167L mice.
Double immunolabeling of (a, c) DMC1 or (b, d) RAD51 (green) and SYCP3 (red) in Hsf2bp+/+, Hsf2bp S167L/S167L and Hsf2bp-/- (a, b) spermatocytes and (c, d) oocytes showing a strong reduction (Hsf2bp-/-) and mild reduction (Hsf2bp S167L/S167L) in the number of foci in comparison with their WT counterparts. Plots on the right of the panels represent the quantification of foci on each genotype and stage. Male nuclei DMC1: Hsf2bp+/+/Hsf2bp S167L/S167L/Hsf2bp-/-, respectively, n = 43/38/37 early zygonemas, 41/43/37 late zygonemas/zygonemas-like and 44/37 early pachynemas from two adult mice of each genotype. Male nuclei RAD51: Hsf2bp+/+/Hsf2bp S167L/S167L/Hsf2bp-/- respectively n = 39 early zygonemas from all genotypes, 37/40/43 late zygonemas/zygonema-like and 37/39 early pachynemas from two adult mice of each genotype. Oocyte nuclei DMC1: Hsf2bp+/+/Hsf2bp S167L/S167L/Hsf2bp-/- n = 18/18/22 zygonemas from two embryos and n = 21/30/23 pachynemas from two embryos (17.5 dpc). Oocyte nuclei RAD51: Hsf2bp+/+/Hsf2bp S167L/S167L/Hsf2bp-/- n = 35/35/42 zygonemas and n = 42/42/40 pachynemas from two embryos (17.5 dpc). Two-tailed Welch’s t-test analysis: ns, no significant differences, **p<0.01, ***p<0.001, ****p<0.0001. Bar in all panels, 10 μm. Extended panels for these figures in Figure 5—figure supplement 1.
Figure 5—figure supplement 1
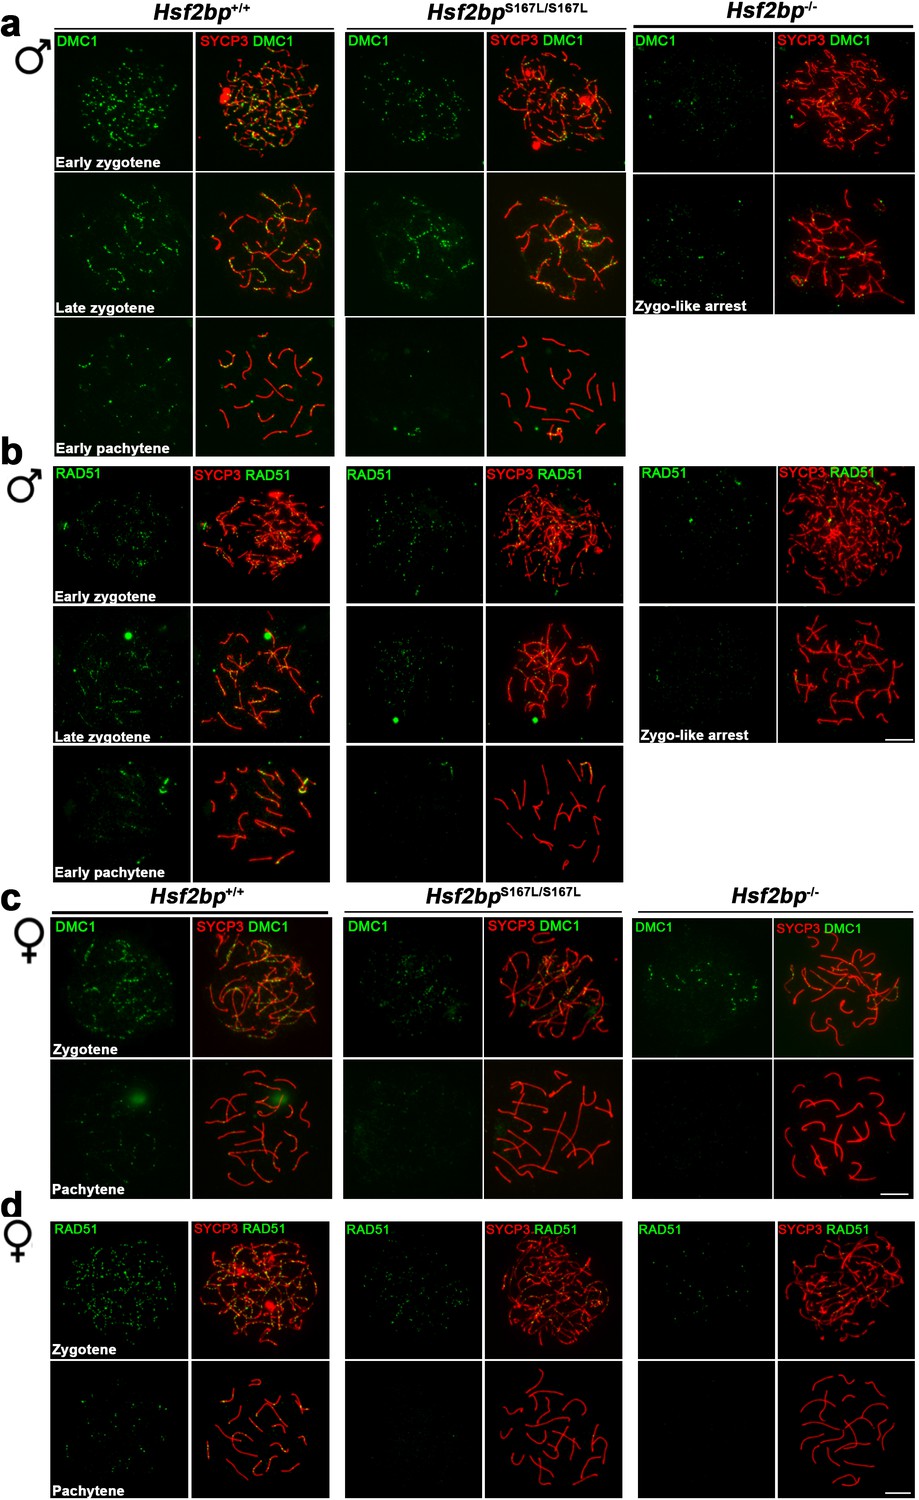
Defective loading of recombinases in Hsf2bpS167L/S167L mice.
Extended panel for Figure 5. (a–b) Double inmunolabeling of (a) DMC1 or (b) RAD51 and SYCP3 (red) in spermatocyte spreads from WT, Hsf2bpS167L/S167L and Hsf2bp-/-adult mice showing a reduction in the DMC1/RAD51 foci in mutant mice that is more pronounced in the knock-out. All the stages quantified in the plots in Figure 5a–b are represented. The early zygonemas are also presented in Figure 5a–b. (c–d) Double inmunolabeling of (c) DMC1 or (d) RAD51 and SYCP3 (red) in oocyte spreads from 17.5 dpc WT, Hsf2bpS167L/S167L and Hsf2bp-/- embryos showing a reduction in DMC1 and RAD51 foci also in mutant females with a stronger reduction in the knock-out. All the stages quantified in the plots in Figure 5c–d are represented. The zygonemas are also presented in Figure 5c–d. Bar in all panels, 10 μm.
Figure 6 with 2 supplements
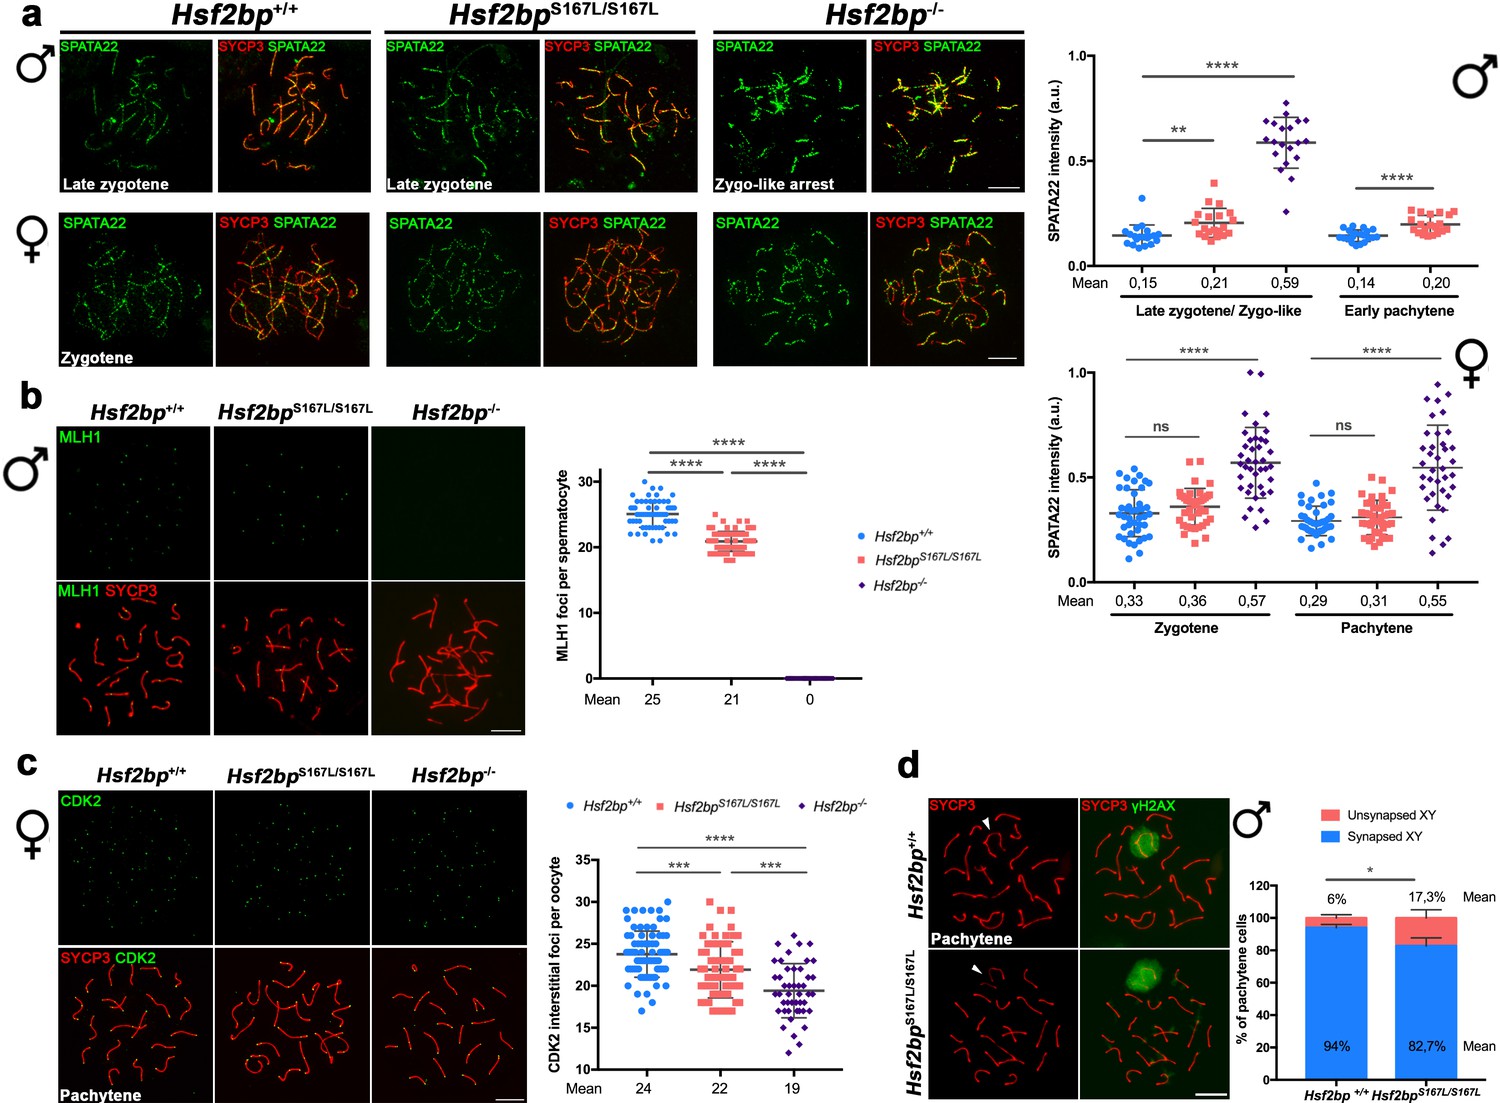
Recombination proficiency is decreased in Hsf2bpS167L/S167L mice.
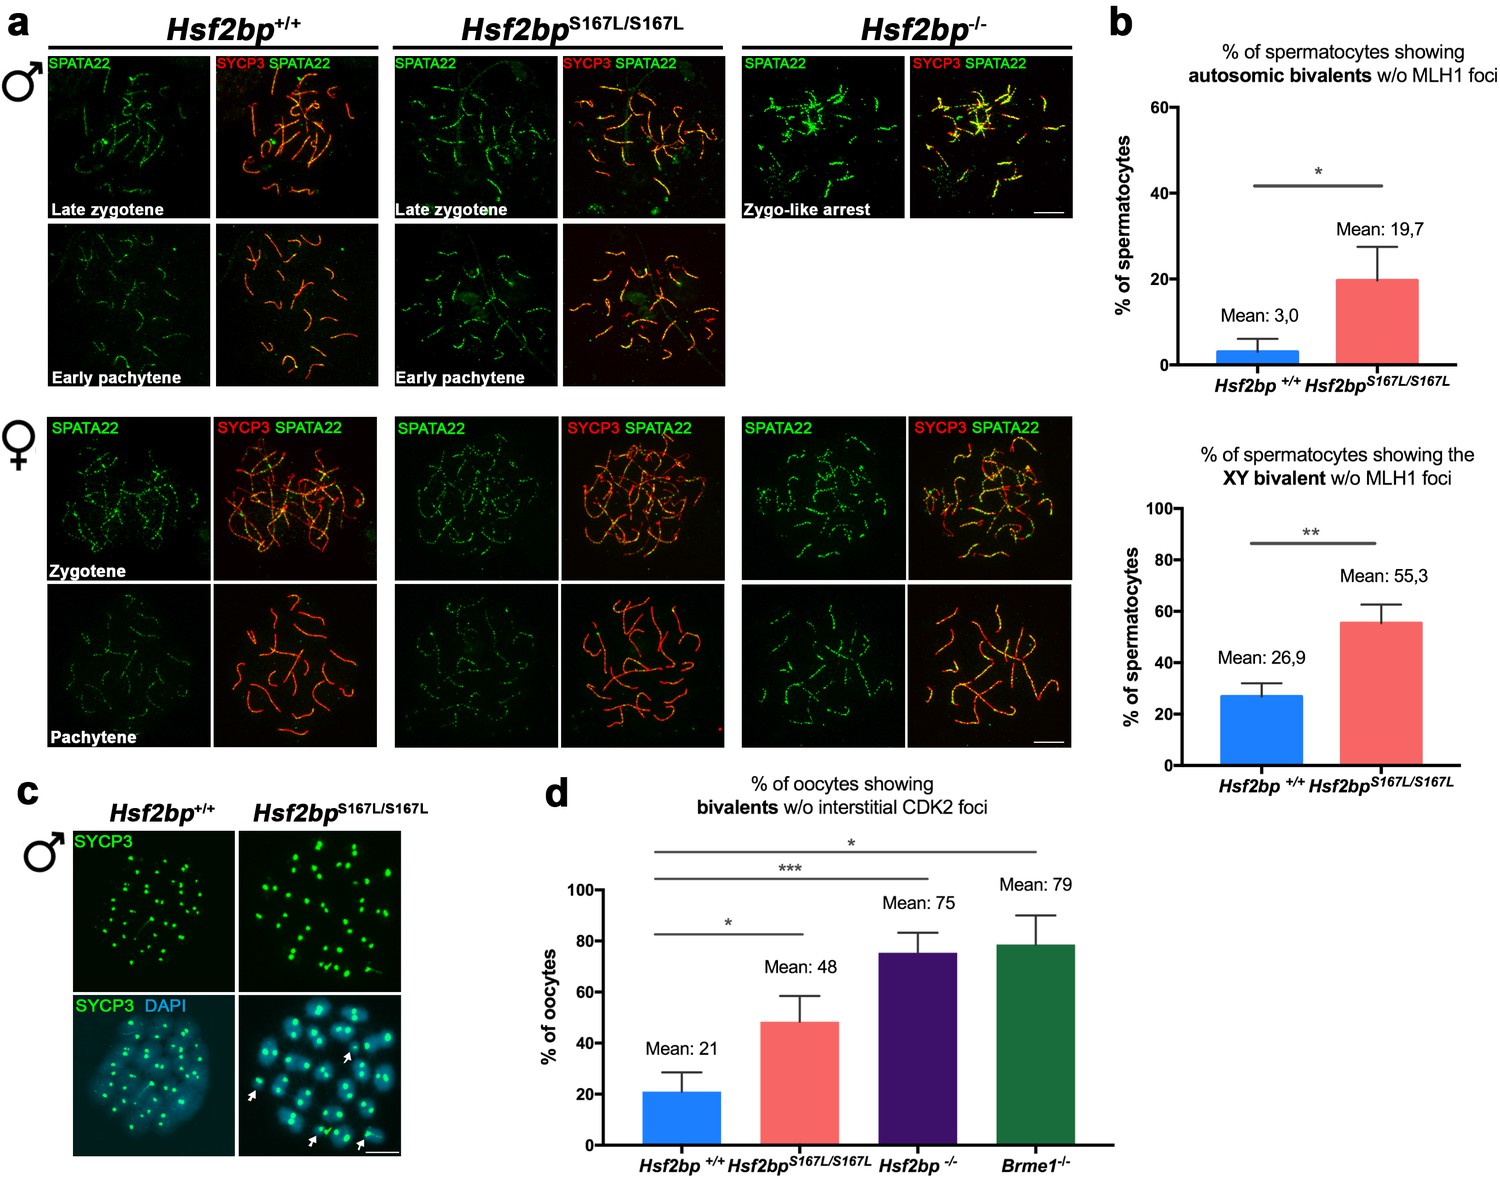
(a) Double labeling of SPATA22 (green) and SYCP3 (red) in spermatocyte (upper panel) and oocyte (lower panel) spreads from WT, Hsf2bp-/- and Hsf2bpS167L/S167L mice. SPATA22 is accumulated in knock-out spermatocytes and oocytes and shows a milder accumulation in the Hsf2bpS167L/S167L spermatocytes. Hsf2bpS167L/S167L oocytes show a slight but not significant accumulation. Plots on the right of the panel represents the quantification of SPATA22 labeling. Males nuclei: n = 20 cells for each stage from two adult mice of each genotype. Females nuclei: Hsf2bp+/+/Hsf2bp S167L/S167L/Hsf2bp-/- n = 41/40/40 zygonemas from two embryos and n = 40/39/38 pachynemas from two embryos (17.5 dpc). Two-tailed Welch’s t-test analysis: ns, no significant differences, **p<0.01, ****p<0.0001. (b) Double immunofluorescence of MLH1 (green) and SYCP3 (red) in spermatocyte spreads from WT, Hsf2bpS167L/S167L and Hsf2bp-/-. MLH1 foci are significantly reduced in the Hsf2bpS167L/S167L spermatocytes and absent in the knock-out. The plot on the right shows the quantification. See also Figure 6—figure supplement 1b for the plot showing the percentage of bivalents without CO. Nuclei: n = 61 for Hsf2bp+/+, 89 for Hsf2bpS167L/S167L and 60 for Hsf2bp-/- from three adult mice of each genotype. Two-tailed Welch’s t-test analysis: ****p<0.0001. (c) Double labeling of CDK2 (green) and SYCP3 (red) in oocyte spreads from 17.5 dpc Hsf2bp+/+, Hsf2bpS167L/S167L and Hsf2bp-/- embryos. During meiotic prophase I, CDK2 localizes to the telomeres of chromosomes from leptotene to diplotene. However, around mid-pachytene additional interstitial CDK2 signals appear at CO sites, colocalizing with MLH1. As a measure of COs, just interstitial CDK2 foci (non-telomeric) have been counted. Hsf2bp-/- and Hsf2bpS167L/S167L females show a high and moderate reduction in the number of COs, respectively. Plot on the right of the panel show the quantification. See also Figure 6—figure supplement 1d for the plot showing the percentage of bivalents without CO. Nuclei: Hsf2bp+/+/Hsf2bp S167L/S167L/Hsf2bp-/- n = 79/67/46 from three embryos (17.5 dpc). Two-tailed Welch’s t-test analysis: ***p<0.0001, ****p<0.0001. (d) Double immunofluorescence of γH2AX (green) and SYCP3 (red) in spermatocyte spreads from WT and Hsf2bpS167L/S167L mice. At pachytene, γH2AX allows the identification of the XY bivalent. Diagram on the right represents the quantification of the pachynemas with unsynapsed sex chromosomes from Hsf2bpS167L/S167L and WT mice. Nuclei: n = 150 pachynemas from three adult mice of each genotype. Two-tailed Welch’s t-test analysis: *p<0.05. Bar in all panels, 10 μm.
Figure 6—figure supplement 1
Meiotic recombination is affected in Hsf2bpS167L/S167L mice.
Extended data for Figure 6. (a) Double labeling of SPATA22 (green) and SYCP3 (red) in spermatocyte (upper panel) and oocyte (lower panel) spreads from WT, Hsf2bp-deficient mice and in the Hsf2bpS167L/S167L mutant from which the plots in Figure 6a were obtained. The late zygonemas (males) and zygonemas (females) are also presented in Figure 6a. SPATA22 is highly accumulated in knock-out spermatocytes and oocytes and shows a milder accumulation in the Hsf2bpS167L/S167L spermatocytes. Hsf2bpS167L/S167L oocytes show a slight no significant accumulation. Bar in panels, 10 μm. (b) Graph representing the percentage of spermatocytes containing autosomic bivalents (upper panel) or the XY bivalent (lower panel) without MLH1 foci in Hsf2bp+/+ and Hsf2bpS167L/S167L adult males. Nuclei: For autosomes analysis, Hsf2bp+/+/Hsf2bpS167L/S167Ln = 94/90 pachynemas and for XY analysis, Hsf2bp+/+/Hsf2bpS167L/S167Ln = 62/59 pachynemas from three adult mice of each genotype. Two-tailed Welch's t-test analysis: *p<0.05, **p<0.01. (c) Labeling of spermatocyte spreads with SYCP3 (green) showing the presence of univalents (arrows) in Hsf2bpS167L/S167Lmetaphases I (MI) and all bivalents in Hsf2bp+/+metaphases I. (d) Graph representing the percentage of oocytes containing bivalents without interstitial CDK2 foci (as a measure of CO) from Hsf2bp+/+, Hsf2bpS167L/S167L, Hsf2bp-/- and Brme1-/- embryonic females (17.5 dpc). Nuclei: Hsf2bp+/+/Hsf2bpS167L/S167L/Hsf2bp-/-/Brme1-/- n = 79/67/46/49 from three embryos (17.5 dpc) of each genotype with the exception of two embryos for Brme1-/-. Two-tailed Welch's t-test analysis: *p<0.05, ***p<0.001.
Figure 6—figure supplement 2
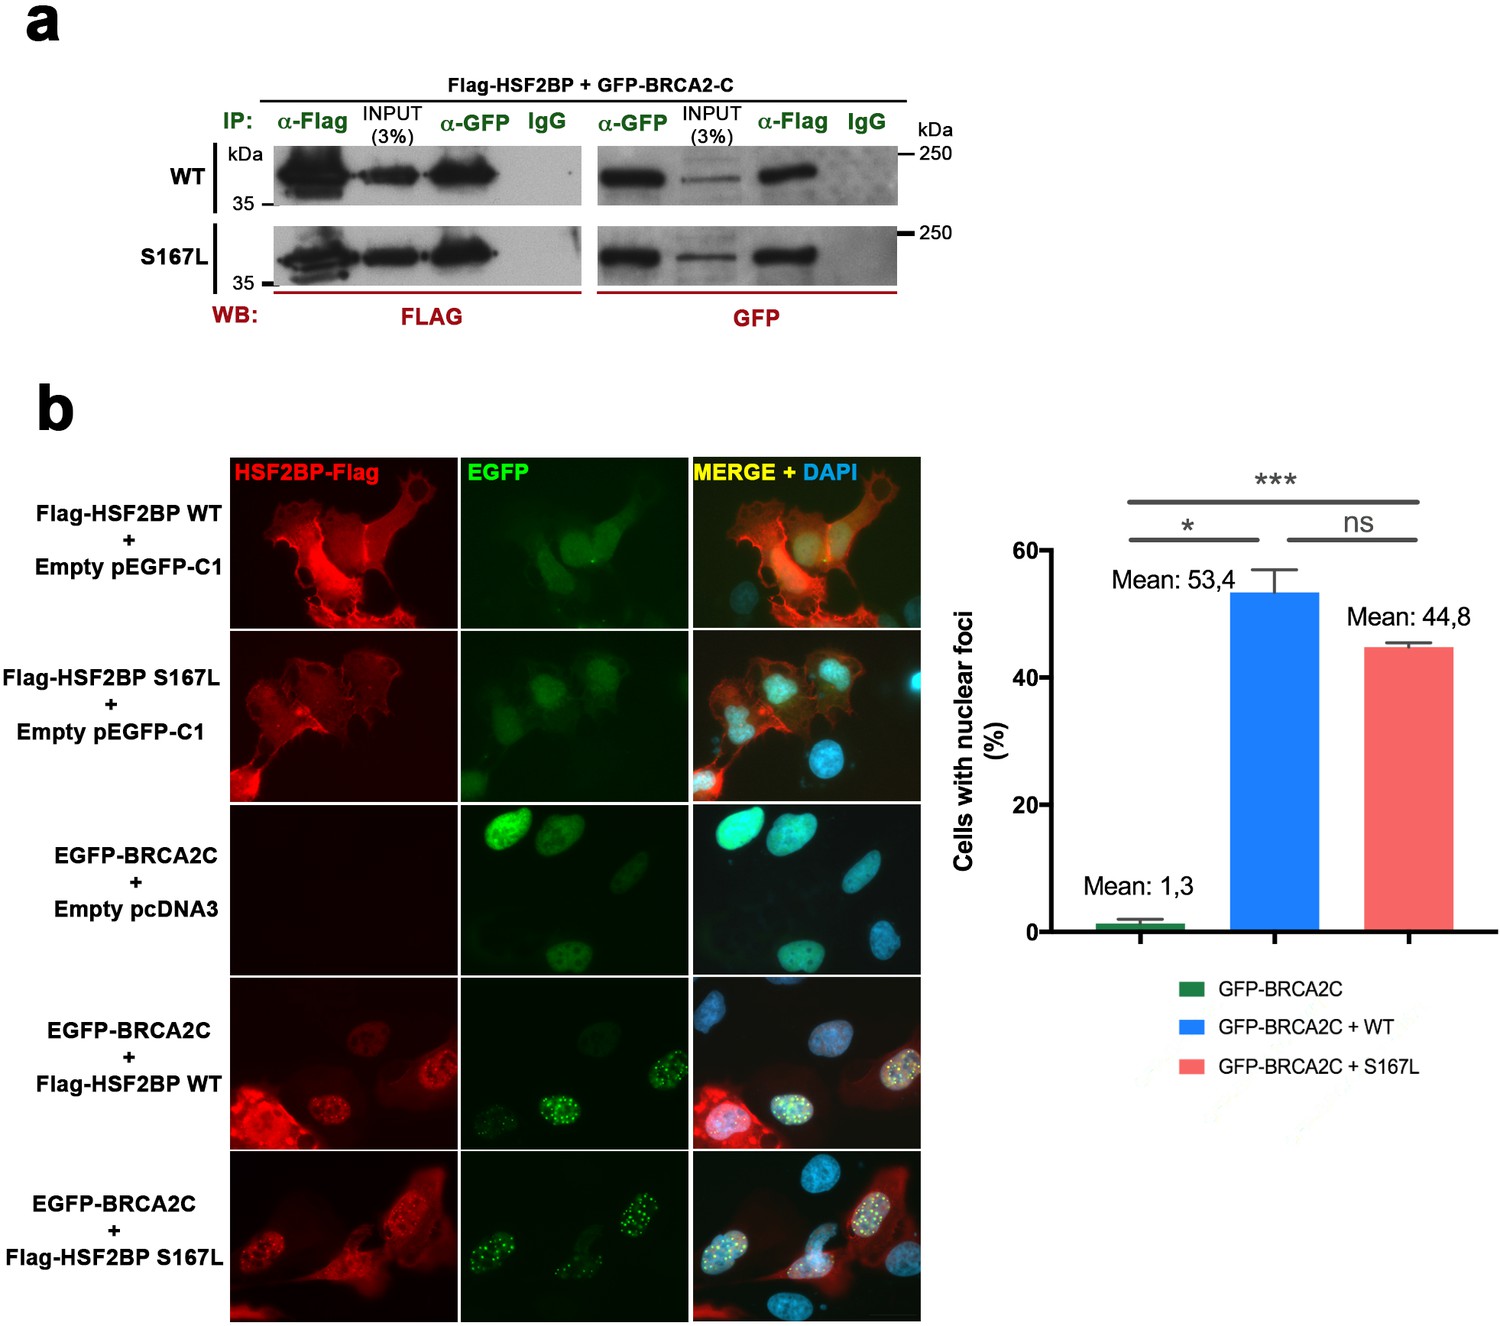
Comparative interaction of HSF2BP-S167L and HSF2BP-WT with BRCA2.
(a) HEK293T cells were transfected with Flag-HSF2BP (WT, upper panel. S167L, panel below) and GFP-BRCA2-C (Cterm). Protein complexes were immunoprecipitated (IP: green text) overnight with either an anti-Flag or anti-EGFP or IgGs (negative control) and were analyzed by immunoblotting with the indicated antibody (WB: red text). Both HSF2BP variants (WT and S167L) co-immunoprecipitate (co-IP) with BRCA2-C similarly. (b) Double immunofluorescence of U2OS cells transfected with plasmids encoding Flag-HSF2BP (WT or S167L) and EGFP-BRCA2-C alone or together and immuno-detected with antibodies against Flag (Flag-HSF2BP, red) and against EGFP (EGFP-BRCA2-C, green). HSF2BP transfected alone (both WT and S167L version) is delocalized and labels the whole cell (S167L less intense) whereas BRCA2-C shows a nuclear localization. When we co-transfected BRCA2-C with HSF2BP or HSF2BP-S167L they both gave rise to a similar nuclear punctate pattern (see quantification in the graph on the right of the panel). Cells: n > 450 from two independent transfections of each condition. Bar in panel, 20 μm. Two-tailed Welch's t-test analysis: ns, no significant differences; *p<0.05; ***p<0.001.
Figure 7 with 6 supplements
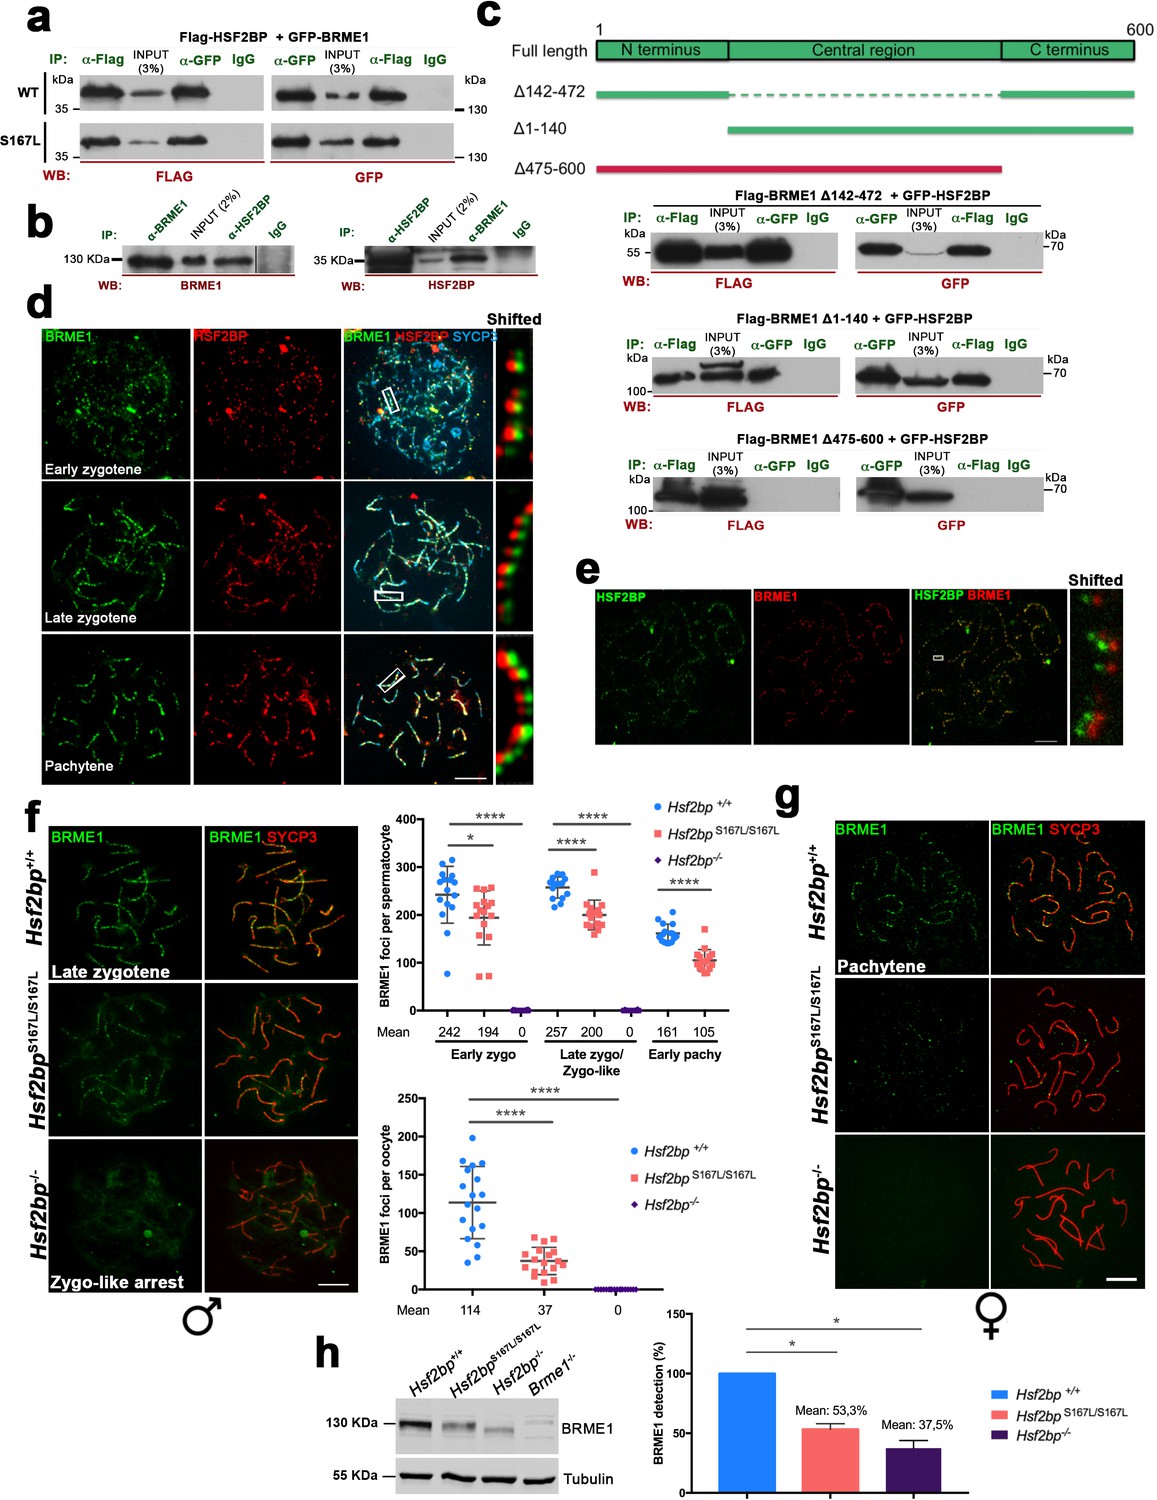
BRME1, a novel HSF2BP interactor that colocalizes to the recombination nodules.
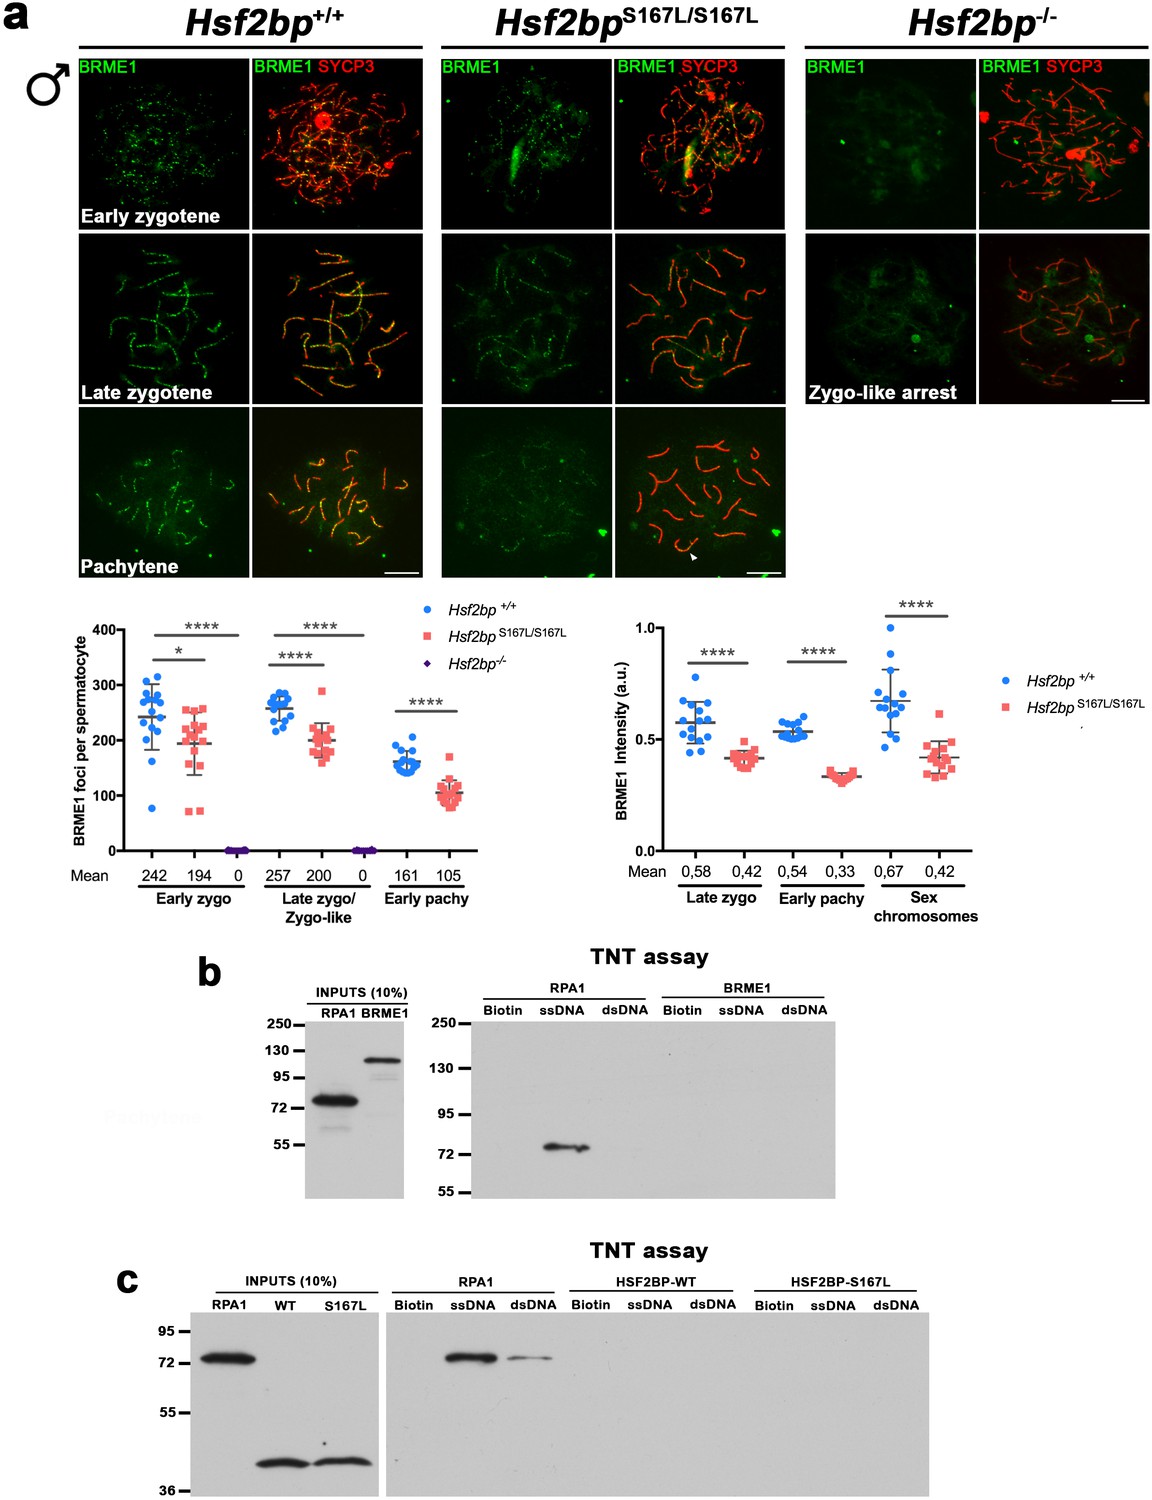
(a) HEK293T cells were transfected with Flag-HSF2BP (WT, upper panel; S167L, lower panel) and its novel interactor GFP-BRME1. Protein complexes were immunoprecipitated (IP: green text) with either anti-Flag or anti-EGFP or IgGs (negative control) and analysed by immunoblotting with the indicated antibody (WB: red text). Both HSF2BP variants (WT and S167L) co-immunoprecipitated similarly with BRME1. (b) IP of testis extracts with antibodies against BRME1, HSF2BP and IgGs as a negative control (IP: green text) and western blot with the indicated antibodies (WB: red text) (c) Schematic representation of full-length BRME1 protein and the corresponding deletion (Δ) constructs (filled boxes) generated to decipher the essential BRME1 region for interacting with HSF2BP (green positive interaction and red no interaction). Western blots under the scheme show the Co-IP experiments. HEK293T cells were transfected with GFP-HSF2BP and the different delta constructs of Flag-BRME1. The Δ475–600 abolishes the interaction, indicating that the C terminus of BRME1 is the essential region of interaction with HSF2BP. (d) Triple immunofluorescence of BRME1 (green), HSF2BP (red) and SYCP3 (blue) in WT spermatocyte spreads showing high colocalization between BRME1 and HSF2BP at late zygotene and pachytene (See Supplementary file 1d for quantification). Bar in panel, 10 μm. (e) Double immunolabeling of spermatocyte spread preparations with HSF2BP (green) and BRME1 (red) analyzed by Stimulated emission depletion (STED) microscopy. Bar in panel, 5 μm. (f–g) Double immunofluorescence of BRME1 (green) and SYCP3 (red) in (f) spermatocytes and (g) oocyte spreads from Hsf2bp+/+, Hsf2bpS167L/S167L and Hsf2bp-/- showing a strong reduction of BRME1 staining in the S167L mutant and absence in the Hsf2bp knock-out. Plots next to the panel represent the quantification. See also extended Figure 7—figure supplement 4a. Male nuclei: Hsf2bp+/+/Hsf2bpS167L/S167L/Hsf2bp-/-: n = 16/16/20 early and 15/15/16 late zygonemas, 16/16 /- pachynemas from two adult mice. Female nuclei: n = 18 pachynemas from two embryos (17.5 dpc) of each genotype. Two-tailed Welch’s t-test analysis: *p<0.05, ****p<0.0001. Bar in panels, 10 μm. (h) Western blot analysis of protein extracts from 13 dpp WT, Hsf2bpS167L/S167L and Hsf2bp-/- testes using an antibody against BRME1. Tubulin was used as loading control. Graph on the right represents the relative quantification of the immunoblotting. Mice: n = 2 Hsf2bp+/+, Hsf2bpS167L/S167L and Hsf2bp-/-. Two-tailed Welch’s t-test analysis: *p<0.05.
Figure 7—figure supplement 1
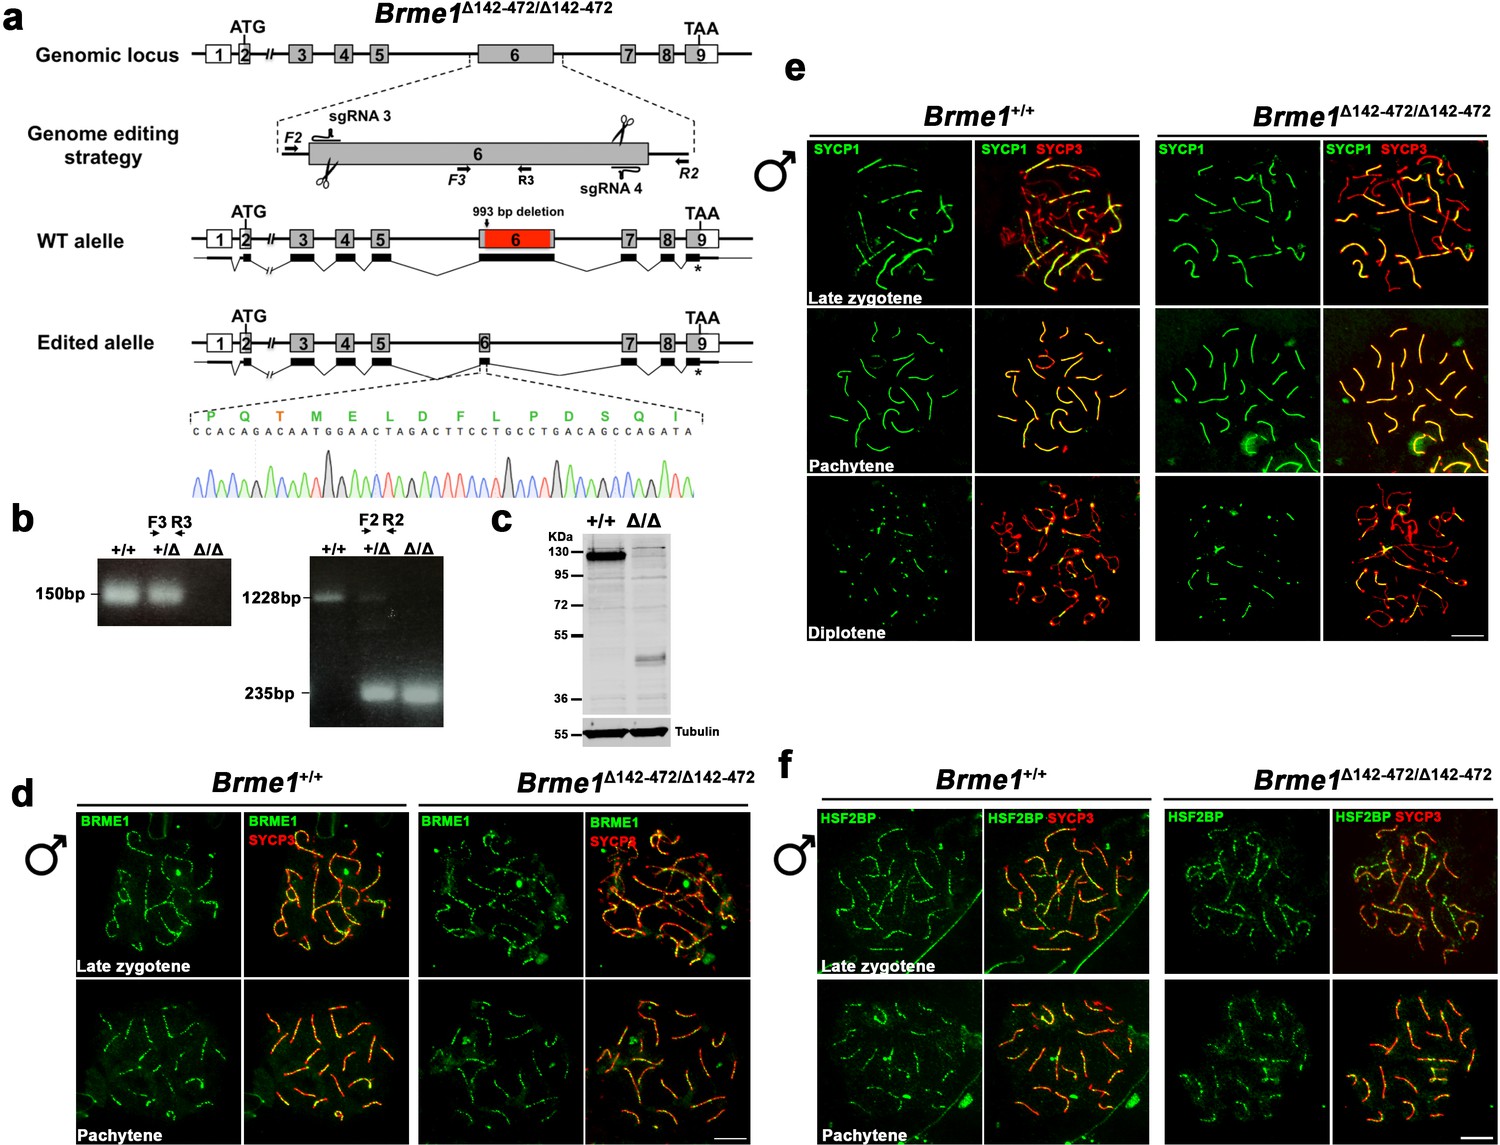
Brme1 Δ142–472 mutants do not show meiotic defects.
(a) Diagrammatic representation of the mouse Brme1 locus (WT) and the genome editing strategy showing the sgRNAs located on exon 6 (see Materials and methods) and the corresponding coding (light grey) non-coding exons (open boxes). Thin (non-coding) and thick (coding sequences) lines under exons represent the expected transcript derived from WT and Brme1 edited allele. ATG, initiation codon; TAA and *, stop codon. The nucleotide sequence of the edited allele derived from PCR amplification of DNA from the Brme1Δ142-472/Δ142-472 is indicated. Primers (F2, R2, F3 and R3) are represented by arrows. (b) PCR analysis of genomic DNA from three littermate progeny of Brme1+/Δ142-472 crosses. The PCR amplification with primers F2 and R2 revealed 1228 and 235 bp fragments for WT and delta alleles respectively. WT (+/+), heterozygous (+/Δ), and homozygous delta (Δ/Δ) animals. The PCR amplification with the primers F3 and R3 revealed a 150 bp fragment for WT and no PCR product for the delta allele. (c) Western blot analysis of protein extracts from Brme1+/+ and Brme1 Δ142-472/Δ142-472 mouse testis with an antibody against BRME1. Note that the corresponding BRME1 (full-length) protein band migrates at 130 KDa (expected 65 KDa) due very likely to its high acidic content. The expected Δ142–472 band would be about 30 KDa but migrates higher for the same reason. Tubulin was used as loading control. (d) Double immunofluorescence of spermatocytes at late zygotene and pachytene stage obtained from Brme1+/+ and Brme1Δ142-472/Δ142-472 mice using SYCP3 (red) and a rabbit polyclonal antibody against BRME1 (green). The BRME1 Δ142–472 localizes at recombination sites in the same manner than the full length BRME1 in vivo. (e) Double immunolabeling of SYCP1 (green) and SYCP3 (red) in Brme1+/+and Brme1Δ142-472/Δ142-472 spermatocyte spreads showing no synapsis defects in presence of a BRME1 protein that lacks half of its total length. (f) Double immunolabeling of HSF2BP (green) and SYCP3 (red) in Brme1+/+and Brme1Δ142-472/Δ142-472 spermatocyte spreads showing a normal localization of HSF2BP in absence of the central region of BRME1. Bar in panels, 10 μm.
Figure 7—figure supplement 2
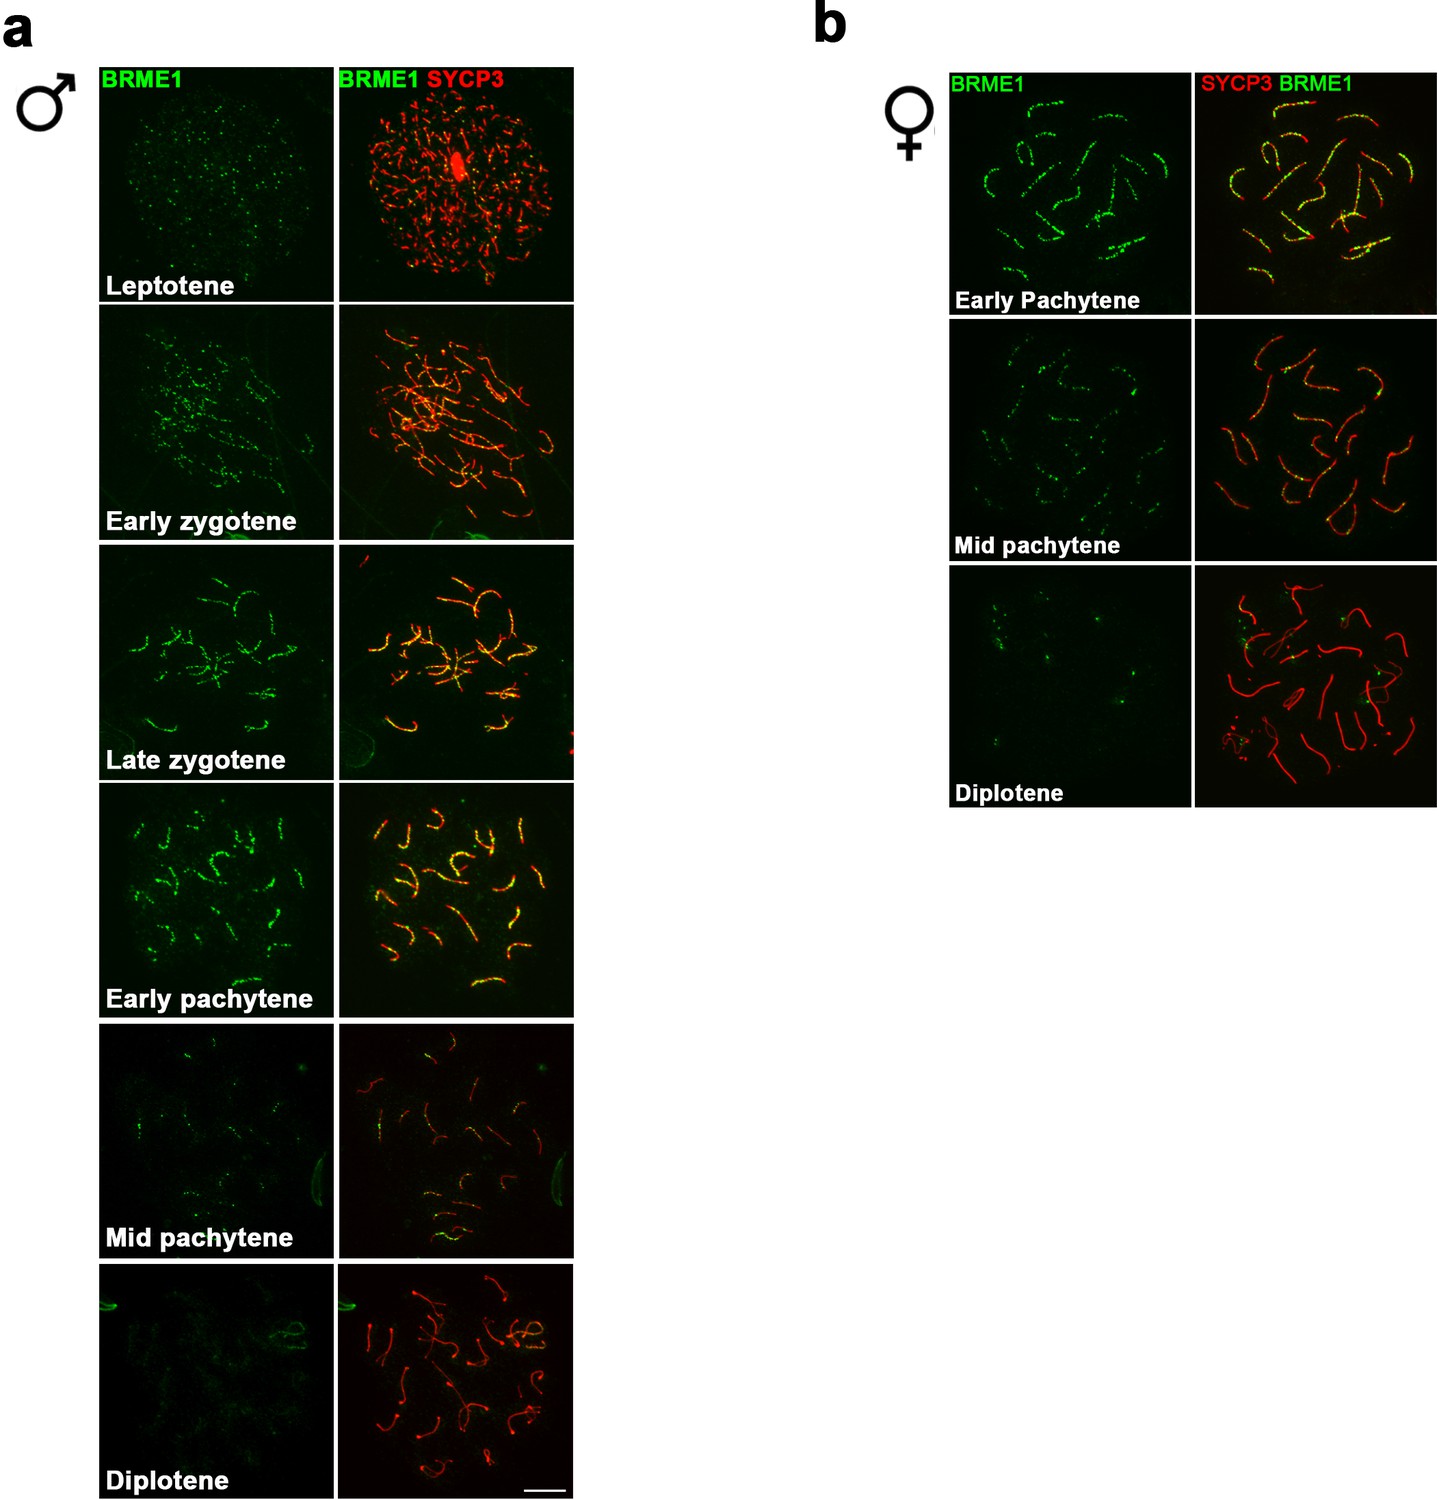
C19ORF57/BRME1 localizes at meiotic RNs.
(a–b) Double immunolabeling of spermatocyte (a) and oocyte (b) spread preparations with a polyclonal antibody raised against a full-length recombinant BRME1 protein (green) and SYCP3 (red), showing that BRME1 localizes to meiotic RNs from leptotene to mid pachytene peaking at late zygotene. Bar in panels, 10 μm.
Figure 7—figure supplement 3

Colocalization analysis of BRME1 and HSF2BP with RPA and DMC1.
(a–b) Triple immunofluorescence of (a) HSF2BP or (b) BRME1 (green) with RPA (upper panels, red. RPA1 in (a), RPA2 in (b)) and DMC1 (lower panels, red) together with SYCP3 (blue). BRME1 and HSF2BP show a localization more similar to RPA than DMC1 through meiosis. See quantification data at Supplementary files 1d and 1e.
Figure 7—figure supplement 4
BRME1 localization depends on HSF2BP and none of them has DNA-binding abilities.
(a) Extended from Figure 7f. Double immunofluorescence of BRME1 (green) and SYCP3 (red) in spermatocytes from Hsf2bp+/+, Hsf2bpS167L/S167L and Hsf2bp-/- mice showing a strong reduction of BRME1 staining in the S167L mutant and a total absence in the Hsf2bp knock-out. Plots under the panel represent the quantification of the number of BRME1 foci and intensity on each genotype and stage. The late zygonema/zygonema-like cells as well as the quantification of foci are also presented in Figure 7f. Nuclei: Foci, Hsf2bp+/+/Hsf2bp S167L/S167L/Hsf2bp-/-: n = 16/16/20 early and 15/15/16 late zygonemas, 16/16 /- pachynemas from two adult mice. Intensity, n = 15 cells for each stage and genotype from two adult mice. Two-tailed Welch's t-test analysis: *p<0.05, ****p<0.0001. Bar in panels, 10 μm. (b–c) Flag-tagged BRME1 (b), HSF2BP (WT and S167L) (c), and RPA1 (positive control as a DNA-binding protein) were produced in the cell-free system TNT and were incubated with magnetic beads (biotin-coated, ssDNA biotin-coated or dsDNA biotin-coated). The eluted DNA binding proteins were analysed by western blot. RPA1 was used as a positive control with ssDNA-binding abilities. BRME1 and HSF2BP do not bind DNA in vitro.
Figure 7—figure supplement 5
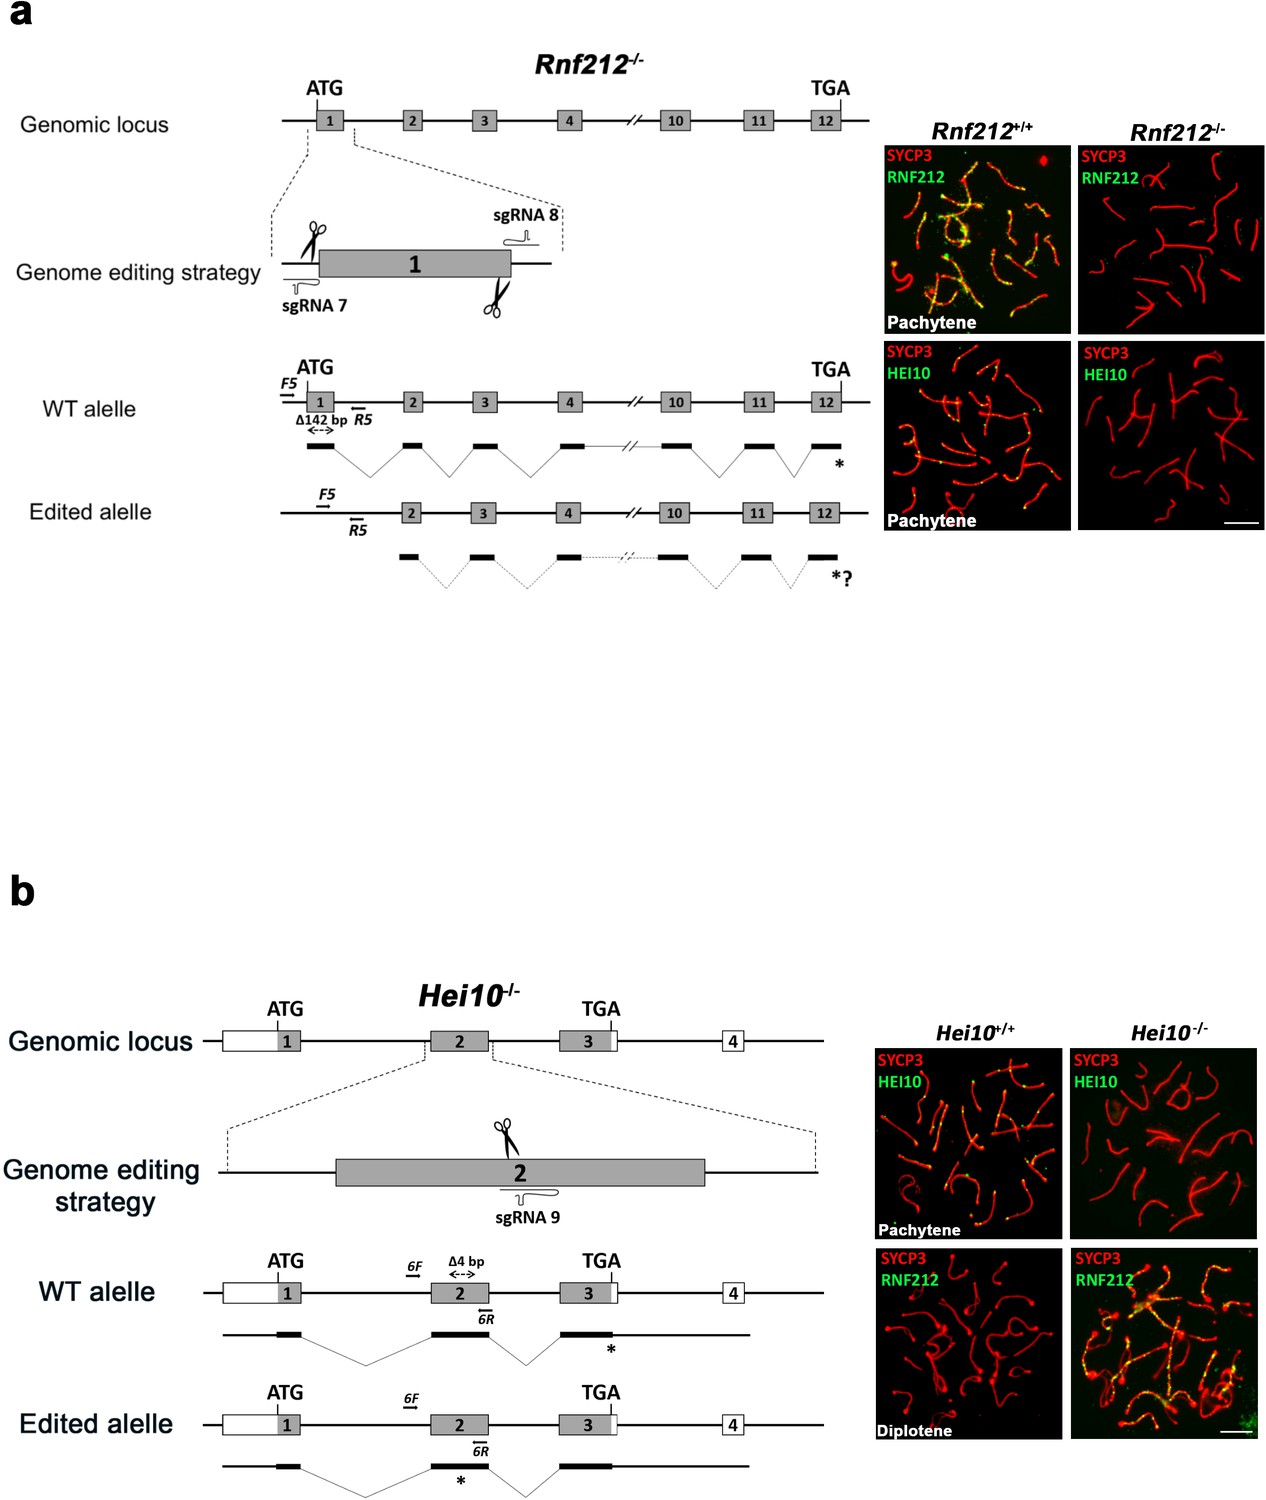
Generation and genetic characterization of Rnf212-/- and Hei10-/- mice.
(a) Schematic representation of the mouse Rnf212 locus (WT) and the genome editing strategy (see Materials and methods) showing the sgRNAs located upstream of the beginning of the ORF and in the exon 1. The corresponding coding exons (light grey) and non-coding exons (open boxes) are represented. Thin (non-coding) and thick (coding sequences) lines under exons represent the expected transcript derived from WT and Rnf212 edited alleles. ATG, initiation codon; TGA and *, stop codon. Arrows represent genotyping primers (F5 and R5). Panels on the right are double inmunolabelings of SYCP3 (red) with RNF212 or HEI10 (both in green). RNF212 is absent in Rnf212-/- spermatocytes demonstrating that is a null mutant and HEI10 staining is defective as it has been previously described in the null-mutants for Rnf212 (Qiao et al., 2014). (b) Schematic representation of the mouse Hei10 locus (WT) and the genome editing strategy (see Materials and methods) showing the sgRNA located on the exon 2. The corresponding coding exons (light grey) and non-coding exons (open boxes) are represented. Thin (non-coding) and thick (coding sequences) lines under exons represent the expected transcript derived from WT and Hei10 edited allele. ATG, initiation codon; TGA and *, stop codon. Arrows represent genotyping primers (F6 and R6). Panels on the right are double inmunolabelings of SYCP3 (red) with HEI10 or RNF212 (both in green). HEI10 is absent in Hei10-/- spermatocytes demonstrating that is a null mutant and RNF212 accumulates at diplotene in Hei10-/- spermatocytes, whilst it is absent in the WT. This phenotype mimics the previously described for null mutants of Hei10 (Qiao et al., 2014).
Figure 7—figure supplement 6
BRME1 loading depends on DSBs generation but not on synapsis.
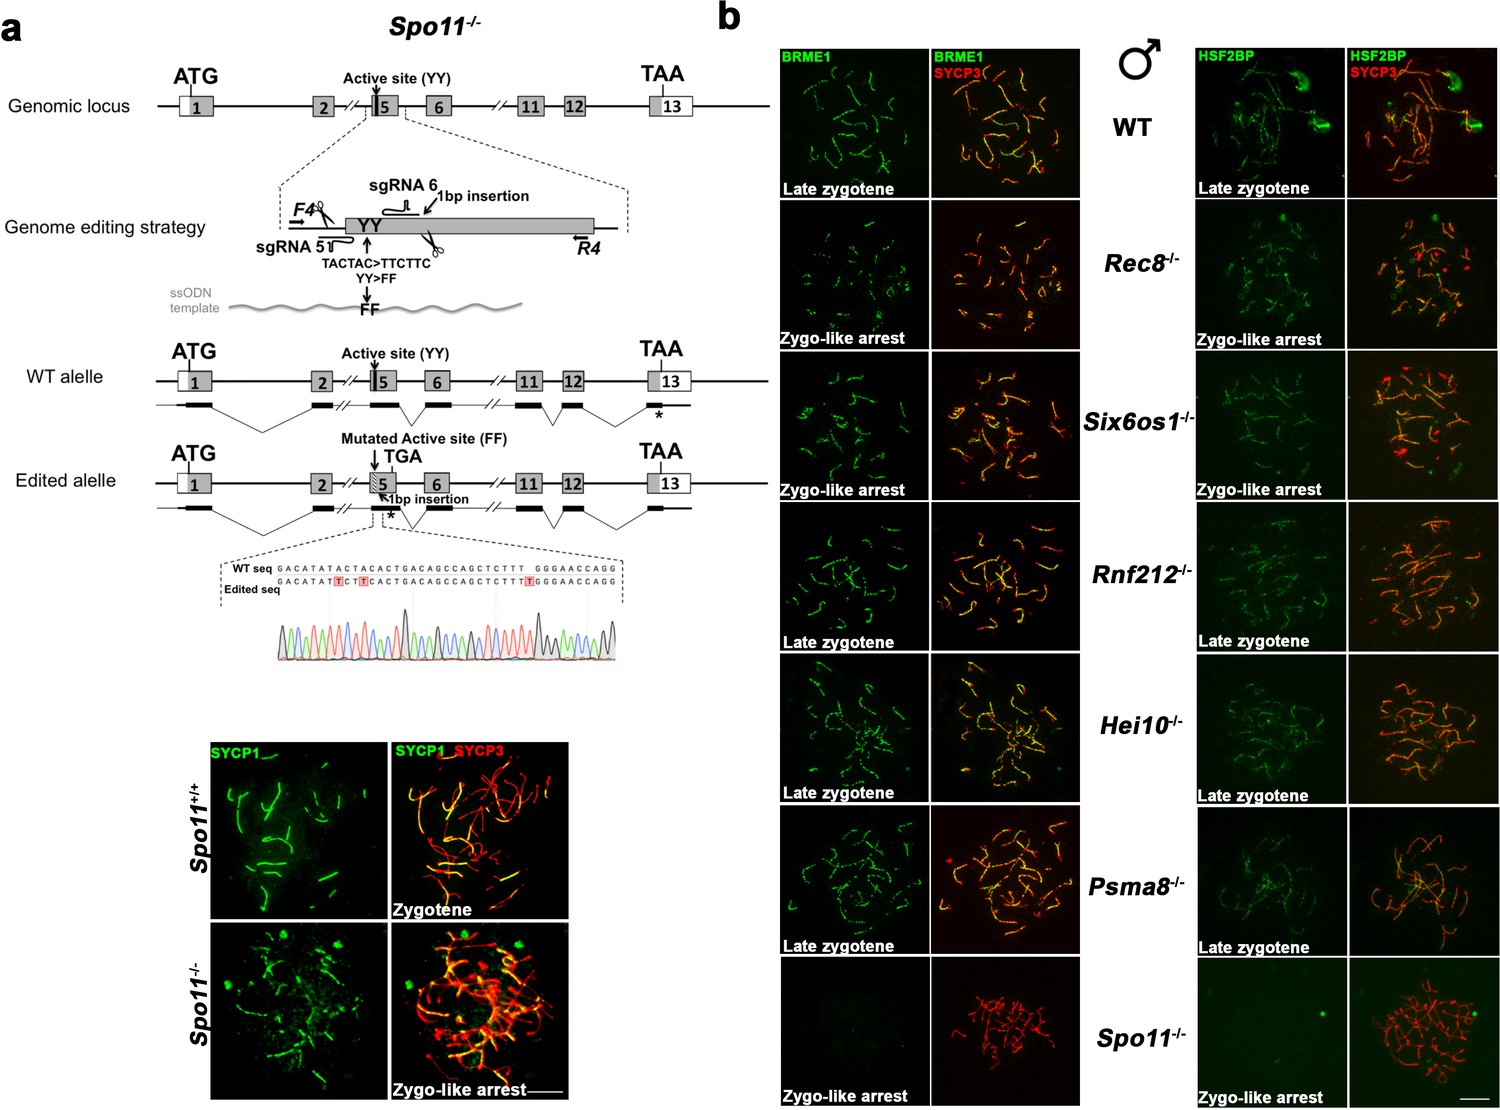
(a) Diagrammatic representation of the mouse Spo11 locus (WT) and the genome editing strategy (see Materials and methods) showing the sgRNAs located on exon five and the ssODN carrying the desired mutation (TACTAC >TTCTTC p.YY137-138FF). The corresponding coding exons (light grey) and non-coding exons (open boxes) are represented. Thin (non-coding) and thick (coding sequences) lines under exons represent the expected transcript derived from WT and Spo11 edited allele. ATG, initiation codon; TAA/TGA and *, stop codon. The nucleotide sequence of the WT and edited allele derived from PCR amplification of DNA from Spo11+/+ and Spo11-/- mice is indicated. Arrows represent genotyping primers (F4 and R4). Panel under the scheme shows inmunolabeling of SYCP3 (red) and SYCP1 (green) in WT and Spo11-/- spermatocytes. Spo11-/- mutant exhibits a zygotene-like arrest with a partner switch phenotype as described previously for Spo11 null-mutants (Baudat et al., 2000). (b) Double labeling of BRME1 (left)/HSF2BP (right) (green) and SYCP3 (red) in Rec8−/−, Six6os1−/−, Rnf212−/−, Hei10−/−, Psma8−/− and Spo11−/− mice showing a correct loading of BRME1 and HSF2BP in synapsis and recombination-defective mutants (from more to less severe: Rec8−/−, Six6os1−/−, Rnf212−/−, Hei10−/− and Psma8−/−) but is absent in the Spo11−/− spermatocytes indicating a total dependence on DSBs formation. These results indicate that both BRME1 and HSF2BP can be genetically positioned at the early events after DSB generation. Bar in panels, 10 μm.
Figure 8 with 1 supplement
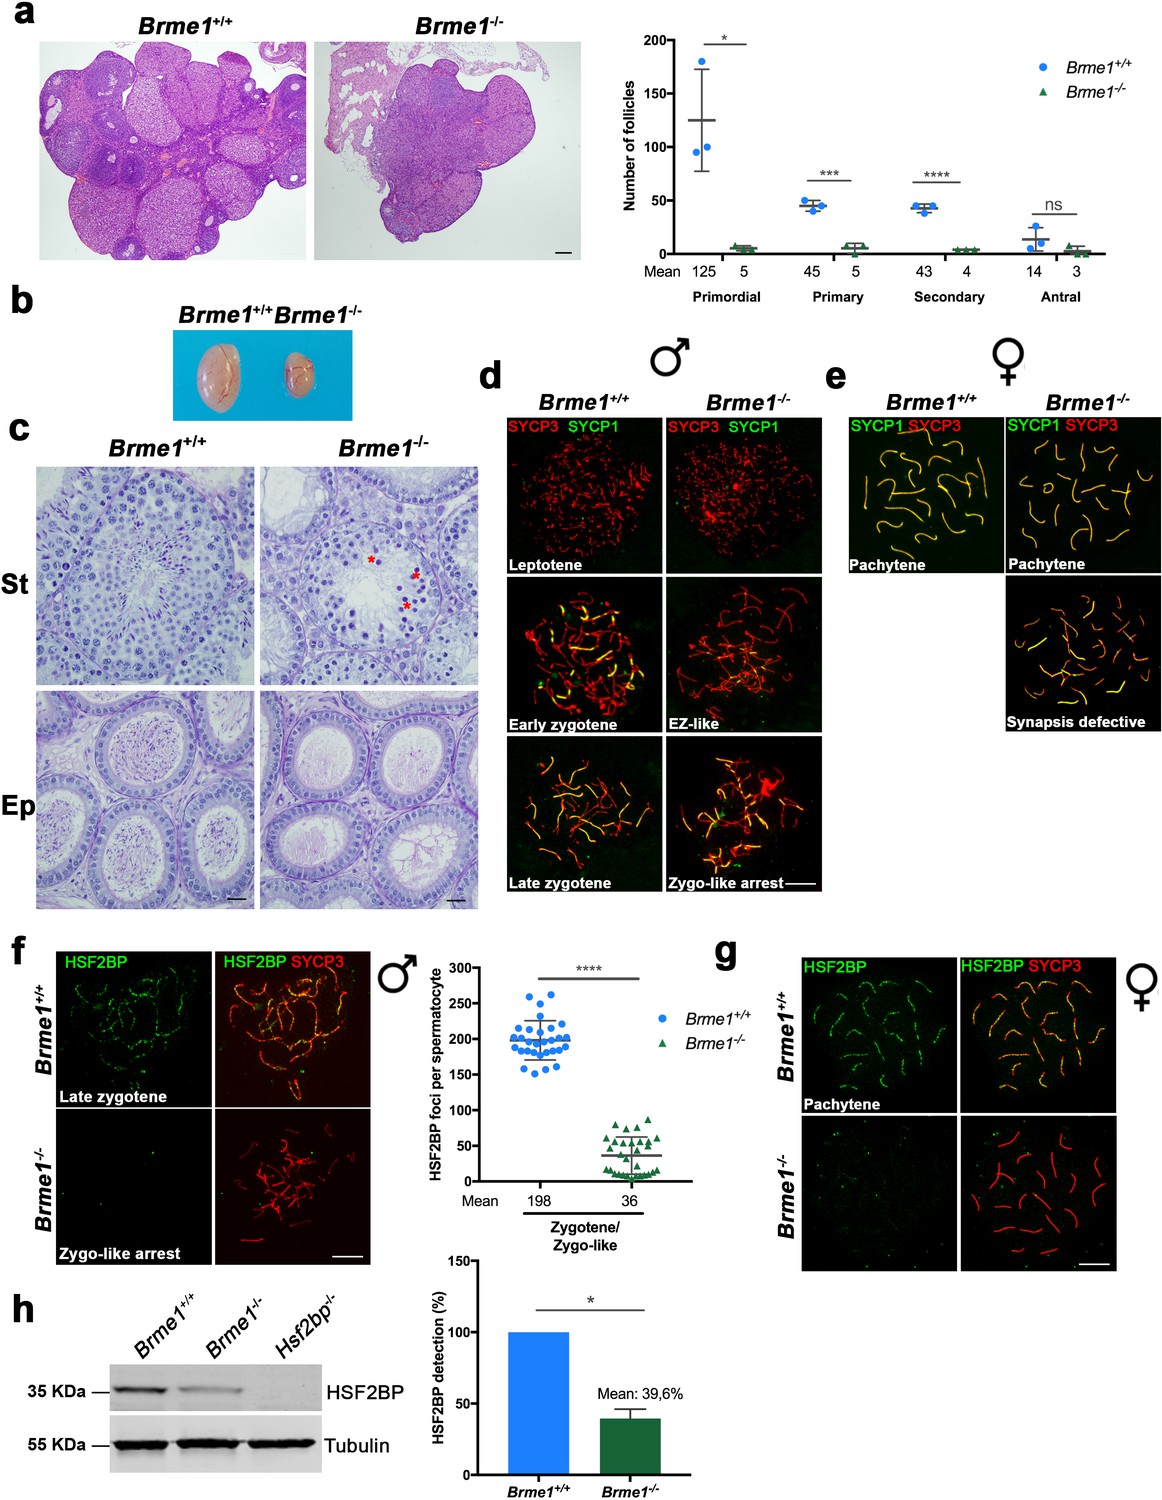
Brme1-/-mice show severe fertility defects.
(a) Hematoxylin+eosin stained sections of ovaries from adult Brme1-/- females showing a strong depletion of follicles. Plot on the right represents the quantification in 3 months-old females. Ovaries: n = 3 ovaries for each genotype. Two-tailed Welch’s t-test analysis: *p<0.05, ***p<0.001, ****p<0.0001. Bar in panels, 50 μm. (b) Testes from adult Brme1-/- males show a strong reduction of the testis size. See quantification of testis weight/body weight at Figure 2—figure supplement 2b. (c) Spermatogenesis is arrested at epithelial stage IV in Brme1-/- as shown in PAS+hematoxylin stained testis sections. Massive apoptosis of spermatocytes is indicated (red asterisks). The spermatogenic arrest leads to empty epididymides and non-obstructive azoospermia. (St) Seminiferous tubules. (Ep) Epididymides. Bar in panels, 10 μm. (d–e) Double labeling of (d) spermatocyte and (e) oocyte spreads from WT and Brme1-/- mice with SYCP3 (red) and SYCP1 (green). Brme1-/- spermatocytes arrest in a zygotene-like stage and show synapsis between non-homologous chromosomes. (e) Brme1-/- females showed a subset of fully-synapsed pachynemas (18.5 dpc) but increased numbers of synapsis-defective cells. See extended panel for females at Figure 8—figure supplement 1e. Bar in panels, 10 μm. (f–g) Double labeling with HSF2BP (green) and SYCP3 (red) of (f) spermatocyte and (g) oocyte spreads from Brme1-/- mice showing faint HSF2BP labeling in spermatocytes and total absence of labeling in oocytes. Plot on the right of (f) panel represents de quantification of HSF2BP foci in Brme1-/- spermatocytes. Nuclei: n = 30 zygonemas/zygonemas-like from two adult mice of each genotype (Brme1+/+ values from Figure 3a) Two-tailed Welch’s t-test analysis: ****p<0.0001. Bar in panels, 10 μm. (h) Western blot analysis of protein extracts from 13 dpp WT, Brme1-/- and Hsf2bp-/- testes with a specific antibody against HSF2BP. Tubulin was used as loading control. Graph on the right represents the relative quantification of the immunoblotting. Mice: n = 2 Brme1+/+, Brme1-/- and Hsf2bp-/-. Two-tailed Welch’s t-test analysis: *p<0.05.
Figure 8—figure supplement 1
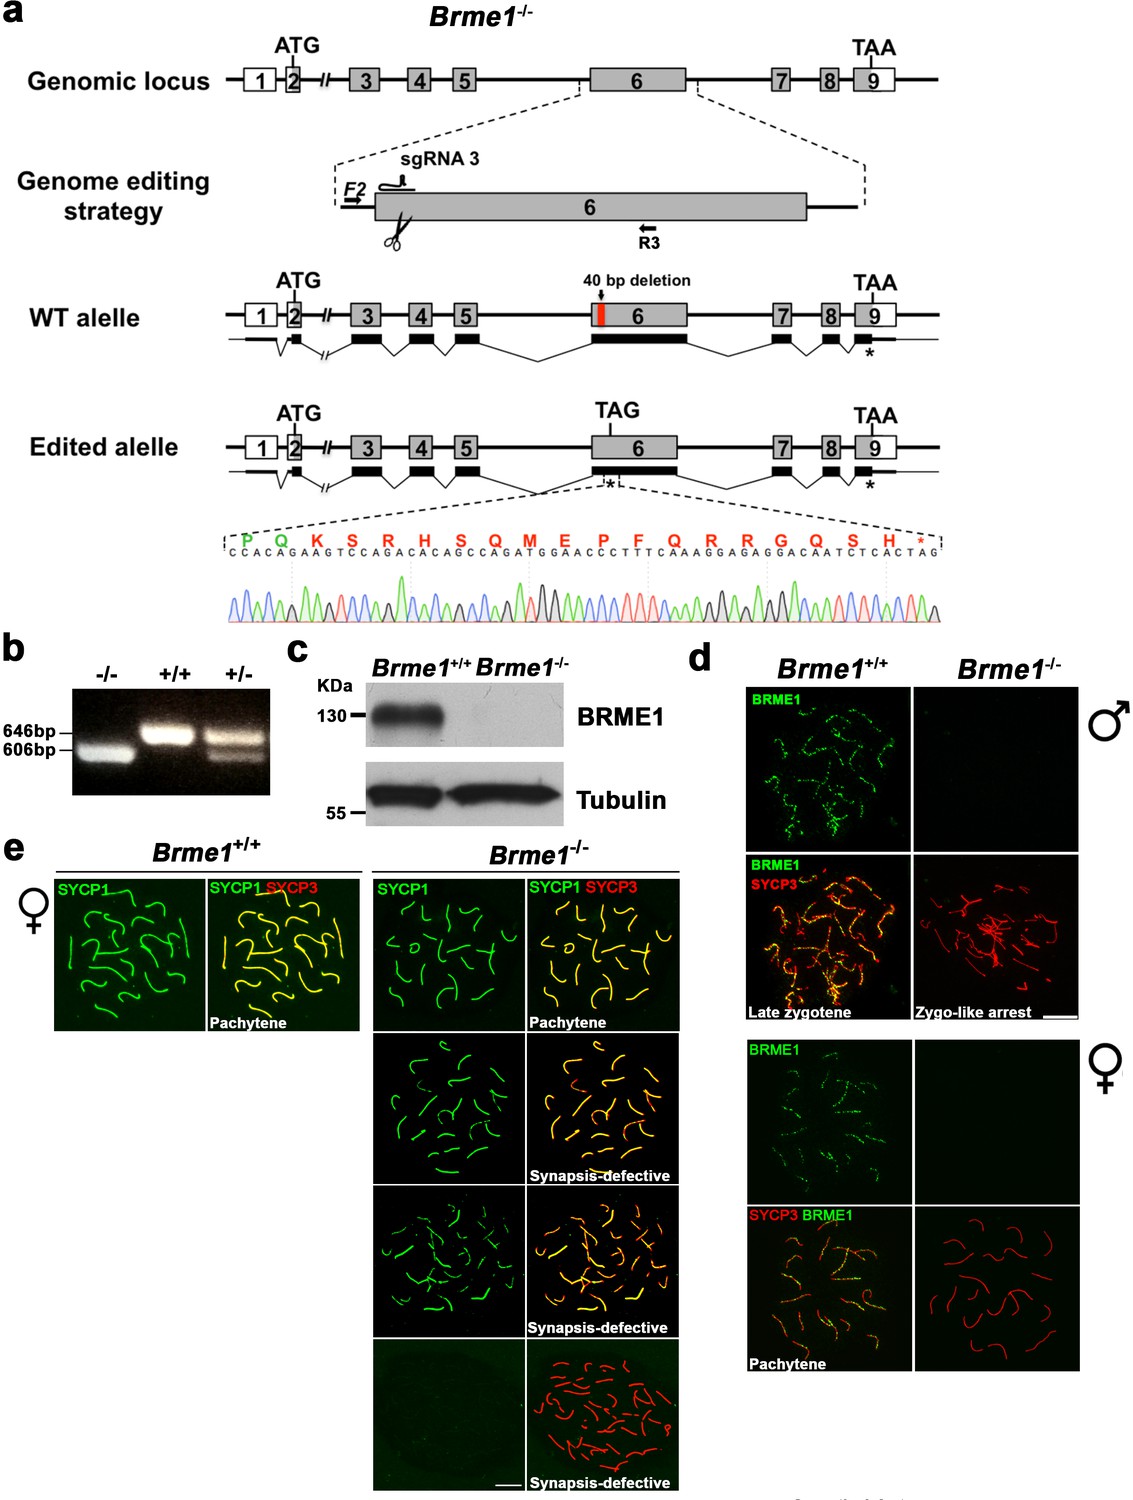
Generation and genetic characterization of Brme1 knock-out mice.
(a) Diagrammatic representation of the mouse Brme1 locus (WT) and the genome editing strategy showing the sgRNA located on exon 6 (see Materials and methods), the corresponding coding exons (light grey) and non-coding exons (open boxes). Thin (non-coding) and thick (coding sequences) lines under exons represent the expected transcript derived from WT and Brme1 edited allele. ATG, initiation codon; TAA/TAG and *, stop codon. The nucleotide sequence of the edited allele derived from PCR amplification of DNA from the Brme1-/- is indicated. Primers (F2 and R3) are represented by arrows. (b) PCR analysis of genomic DNA from three littermate progeny of Brme1+/- heterozygote crosses. The PCR amplification with primers F2 and R3 revealed 646 and 606 bp fragments for WT and disrupted alleles respectively. WT (+/+), heterozygous (+/-), and homozygous knock-out (-/-) animals. (c) Western blot analysis of protein extracts from WT and Brme1-/- testis with a specific antibody against whole recombinant BRME1 protein. Tubulin was used as loading control. (d) Double immunofluorescence of spermatocytes at late zygotene-like arrested stage (upper panel) and pachytene oocytes (lower panel) obtained from Brme1+/+ and Brme1-/- mice using SYCP3 (red) and a rabbit polyclonal antibody against BRME1 (green). No signal is detected in the Brme1-/- demonstrating that is a null allele and the specificity of the antibodies raised against BRME1. Bar in panels, 10 μm. (e) Extended from Figure 8e. Double labeling of oocyte spreads from WT and Brme1-/- embryos with SYCP3 (red) and SYCP1 (green). Brme1-/- females showed a subset of fully synapsed pachynemas (18.5 dpc) but increased numbers of synapsis-defective cells. The pachynema is also presented in Figure 8e. Bar in panels, 10 μm.
Figure 9 with 2 supplements
BRME1 is essential for meiotic recombination.
(a–b) Double immunofluorescence of DMC1(green) and SYCP3 (red) in Brme1+/+ and Brme1-/- (a) spermatocytes and (b) oocytes showing a reduction in the number of DMC1 foci. Plots under each panel represent the quantification. See also extended panels on Figure 9—figure supplement 2a–b. Male nuclei for DMC1: Brme1+/+/Brme1-/- n = 43/50 early and 41/52 late zygonemas/zygonemas like from two adult mice of each genotype (Brme1+/+ values from Figure 5a). Female nuclei for DMC1: Brme1+/+/Brme1-/- n = 18/30 zygonemas and 21/31 pachynemas from two embryos (17.5 dpc) of each genotype (Brme1+/+ values from Figure 5c). Two-tailed Welch’s t-test analysis: ***p<0.001, ****p<0.0001. Bar in panels, 10 μm. (c–d) Double immunofluorescence of RAD51 (green) and SYCP3 (red) in Brme1+/+ and Brme1-/- (c) spermatocytes and (d) oocytes showing a reduction in the number of RAD51 foci in the Brme1-/- in comparison to the WT. Plots under each panel represent the quantification. See also extended panels on Figure 9—figure supplement 2c–d. Male nuclei for RAD51: Brme1+/+/Brme1-/- n = 39/39 early and 37/45 late zygonemas/zygonemas like from two adult mice of each genotype (Brme1+/+ values from Figure 5b). Female nuclei for RAD51: Brme1+/+/Brme1-/- n = 35/31 zygonemas and 42/40 pachynemas from two embryos (17.5 dpc) of each genotype (Brme1+/+ values from Figure 5d). Two-tailed Welch’s t-test analysis: ****p<0.0001. (e–f) Quantification of SPATA22 intensity in (e) spermatocytes and (f) oocyte spreads from Brme1+/+ and Brme1-/-. See immunofluorescences in Figure 9—figure supplement 2e–f. Nuclei: Males, n = 20 cells from two adult mice of each genotype (Brme1+/+ from Figure 6a). Females, Brme1+/+/Brme1-/- n = 41/40 zygonemas and 40/40 pachynemas from two embryos of each genotype (17.5 dpc) (Brme1+/+ from Figure 6a). Two-tailed Welch’s t-test analysis: ****p<0.0001. (g) Double immunofluorescence of MLH1 (green) and SYCP3 (red) in Brme1+/+ and Brme1-/- spermatocytes showing the absence of MLH1 labeling in the knock-out. (h) Double labeling of CDK2 (green) and SYCP3 (red) in oocyte spreads from 17.5 dpc Brme1+/+ and Brme1-/- embryos. During meiotic prophase I, CDK2 localizes to the telomeres of chromosomes from leptotene to diplotene. However, around mid-pachytene additional interstitial CDK2 signals appear at CO sites, colocalizing with MLH1. As a measure of COs, just interstitial CDK2 foci (non-telomeric) have been counted. Brme1-/- females show a strong reduction in the number of COs. Plot under the panel show the quantification. Nuclei: Brme1+/+/Brme1-/- n = 79/49 from three embryos (17.5 dpc) in WT and two embryos in Brme1-/- (Brme1+/+ from Figure 6c). Two-tailed Welch’s t-test analysis: ***p<0.0001. Bar in all panels, 10 μm.
Figure 9—figure supplement 1
DSBs are formed but not properly repaired in Brme1-deficient mice and mimic the phenotype of Hsf2bp-deficient mice.
(a, c) Double labeling of γH2AX (green) and SYCP3 (red) in (a) spermatocyte and (c) oocyte spreads from WT and Brme1-deficient mice. (a) In males γH2AX labeling appears in leptotene in both WT and Brme1 KO spermatocytes and increases during zygotene. However, whereas in the WT the signal decreases at pachytene, Brme1-deficient mice show an accumulation of γH2AX in the zygotene-like arrest. The plot on the right represents the quantification of γH2AX intensity in both WT and KO spermatocytes. Nuclei: Brme1+/+/Brme1-/- n = 20/20 leptotenes, 29/30 early zygonemas and 27/30 late zygonemas/zygonemas like from two adult mice. Two-tailed Welch's t-test analysis: ns, no significant differences; **p<0.01. (c) In females, γH2AX labeling accumulates at pachytene. Nuclei: Brme1+/+/Brme1-/- n = 21/20 pachynemas from two embryos (17.5 dpc) of each genotype (Brme1+/+ from Figure 3c). Two-tailed Welch's t-test analysis: ns, no significant differences; *p<0.05 (b, d) Double immunolabeling of RPA1 (green) and SYCP3 (red) in (b) spermatocyte and (d) oocyte spreads from Brme1+/+ and Brme1-/- mice. (b) In males, RPA1 accumulates at the late zygotene-like arrest of the Brme1-/- mouse indicating a defective DNA repair in these mutants. Plot on the right of the panel represents the quantification of RPA1 foci on each genotype and stage. Nuclei: Brme1+/+/Brme1-/- n = 31/26 leptonemas and 29/34 late zygonemas/zygonemas-like from three adult WT mice (Brme1+/+ from Figure 3b) and 2 Brme1-/- adult mice. Two-tailed Welch's t-test analysis: ns, no significant differences; ****p<0.0001. (d) In females, RPA1 foci are similar in Brme1+/+ and Brme1-/- oocytes at zygotene and pachytene. Nuclei: Brme1+/+/Brme1-/- n = 42/22 zygonemas from two embryos (16.5 dpc) and 25/23 pachynemas from two embryos (17.5 dpc) of each genotype (Brme1+/+ from Figure 3d). Two-tailed Welch'´s t-test analysis: ns, no significant differences. Bar in all panels, 10 μm.
Figure 9—figure supplement 2
Altered dynamic of recombinational proteins in the absence of BRME1.
(a–b) Extended panels from Figure 9a–b. Double immunofluorescence of DMC1(green) and SYCP3 (red) in Brme1+/+ and Brme1-/- (a) spermatocytes and (b) oocytes showing a reduction in the number of DMC1 foci in the Brme1-/- in comparison to the WT. Bar in panels, 10 μm. The early zygonemas (males) and zygonemas (females) are also presented in Figure 9a–b, respectively. (c–d) Extended panels from Figure 9c–d. Double immunofluorescence of RAD51 (green) and SYCP3 (red) in Brme1+/+ and Brme1-/- (c) spermatocytes and (d) oocytes showing a reduction in the number of DMC1 foci in the Brme1-/- in comparison to the WT. The early zygonemas (males) and zygonemas (females) are also presented in Figure 9c–d, respectively. Bar in panels, 10 μm. (e–f) Double immunofluorescence of SPATA22 (green) and SYCP3 (red) in (e) spermatocyte and (f) oocyte spreads from Brme1+/+ and Brme1-/-. See quantifications on Figure 9e–f. Bar in panels, 10 μm.
Figure 10 with 1 supplement
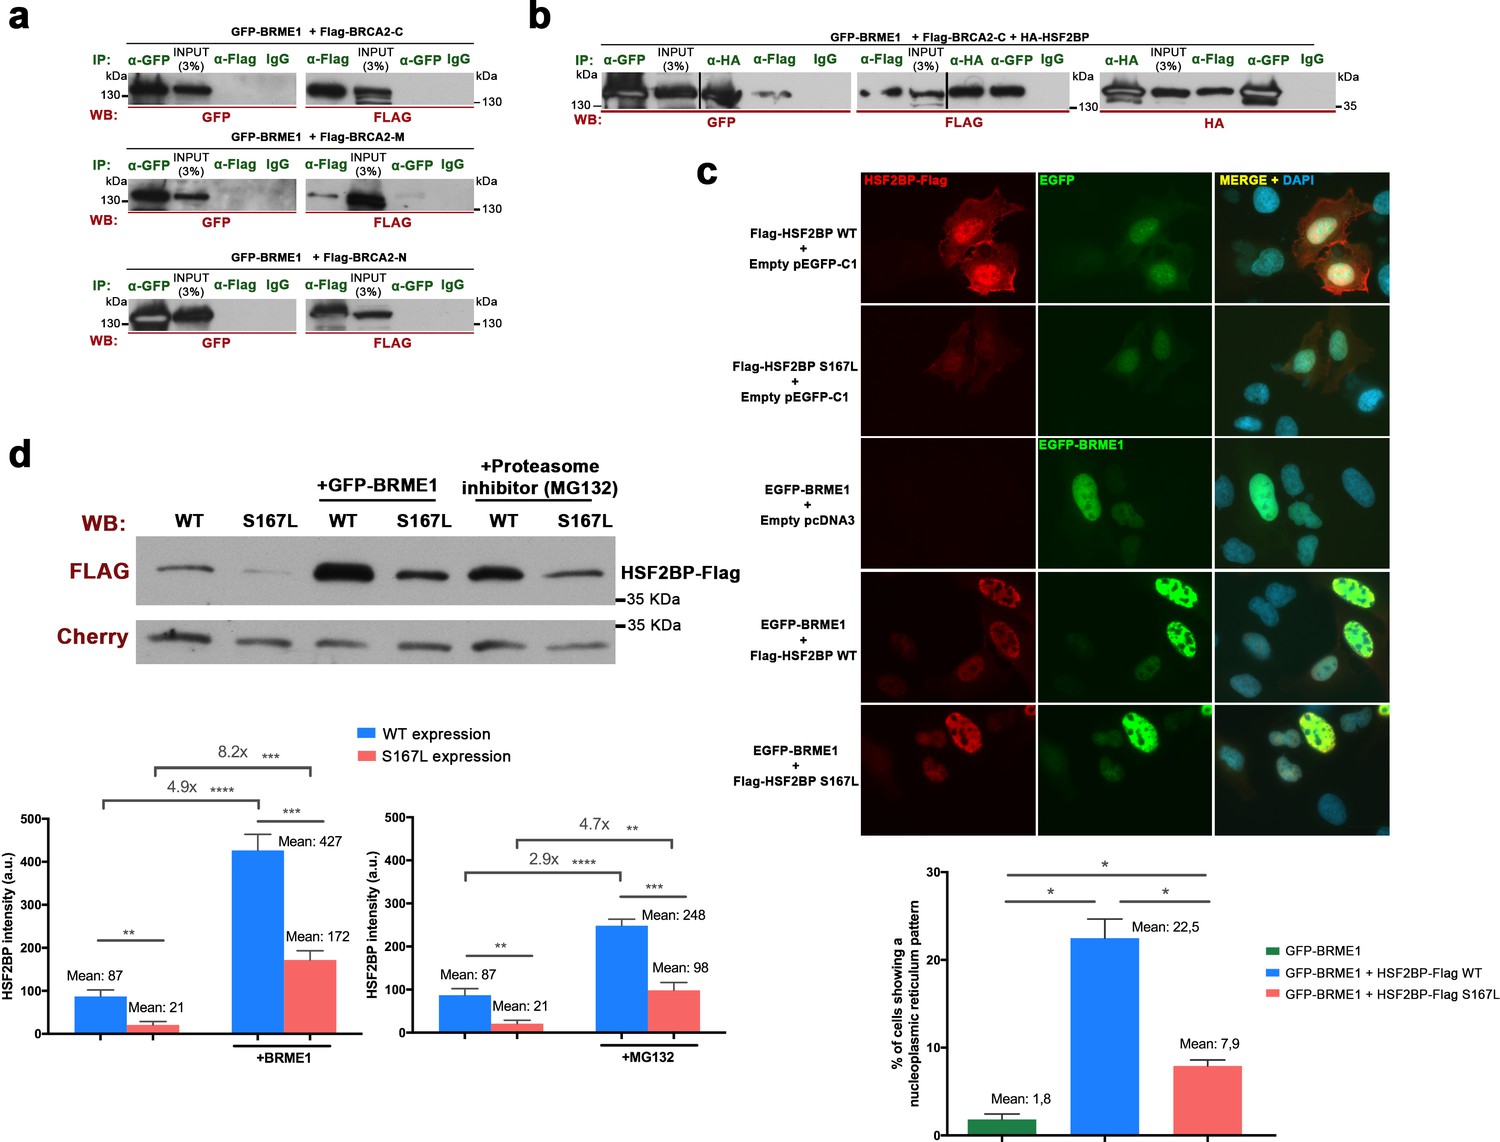
BRME1 forms a complex with BRCA2 and HSF2BP and stabilizes HSF2BP.
(a–b) HEK293T cells were co-transfected with GFP-BRME1, Flag-BRCA2-C and HA-HSF2BP. Protein complexes were immunoprecipitated (IP: green text) with either an anti-Flag, anti-EGFP, anti-HA or IgGs, and analyzed by western blot with the indicated antibody (WB: red text). (a) BRME1 does not co-immunoprecipitate with BRCA2-N, BRCA2-M or BRCA2-C. (b) In the presence of HA-HSF2BP (triple co-transfection) BRCA2-C and BRME1 coimmunoprecipitate (co-IPs between HSF2BP and BRCA2-C are shown in Figure 6—figure supplement 2a). (c) Transfected U2OS cells with plasmids encoding Flag-HSF2BP (WT or S167L) and EGFP-BRME1 alone or together were immuno-detected with antibodies against Flag (red) and EGFP (green). Transfected HSF2BP (WT and S167L) labels the whole cell (S167L less intense) whereas BRME1 shows nuclear localization. When co-expressed, BRME1 and HSF2BP change their patterns and form nuclear invaginations that resemble nucleoplasmic reticulum. This phenotype is milder in the presence of HSF2BP-S167L than with the WT (graph under the panel: quantification of the number of cells showing a nucleoplasmic reticulum pattern). n > 400 cells from two independent transfections of each condition. Two-tailed Welch’s t-test analysis: *p<0.05. Bar in panel, 20 μm. (d) HEK293T cells were transfected with Flag-HSF2BP (WT and S167L) alone or with GFP-BRME1. Additionally, cells transfected with Flag-HSF2BP were treated with the proteasome inhibitor (MG132, 10 μM) and analyzed by western blot. Cherry was used as transfection efficiency control. HSF2BP-WT was expressed at higher levels than HSF2BP-S167L and their detection (both the WT and the S167L variant) was increased when co-transfected with BRME1. The increase was greater for the HSF2BP-S167L variant in comparison with the WT. Incubation with MG132 increased the detection levels of transfected HSF2BP mimicking the effect of co-transfecting BRME1. n = 3 independent transfections for each condition. Two-tailed Welch’s t-test analysis: **p<0.01, ***p<0.001, ****p<0.0001.
Figure 10—figure supplement 1
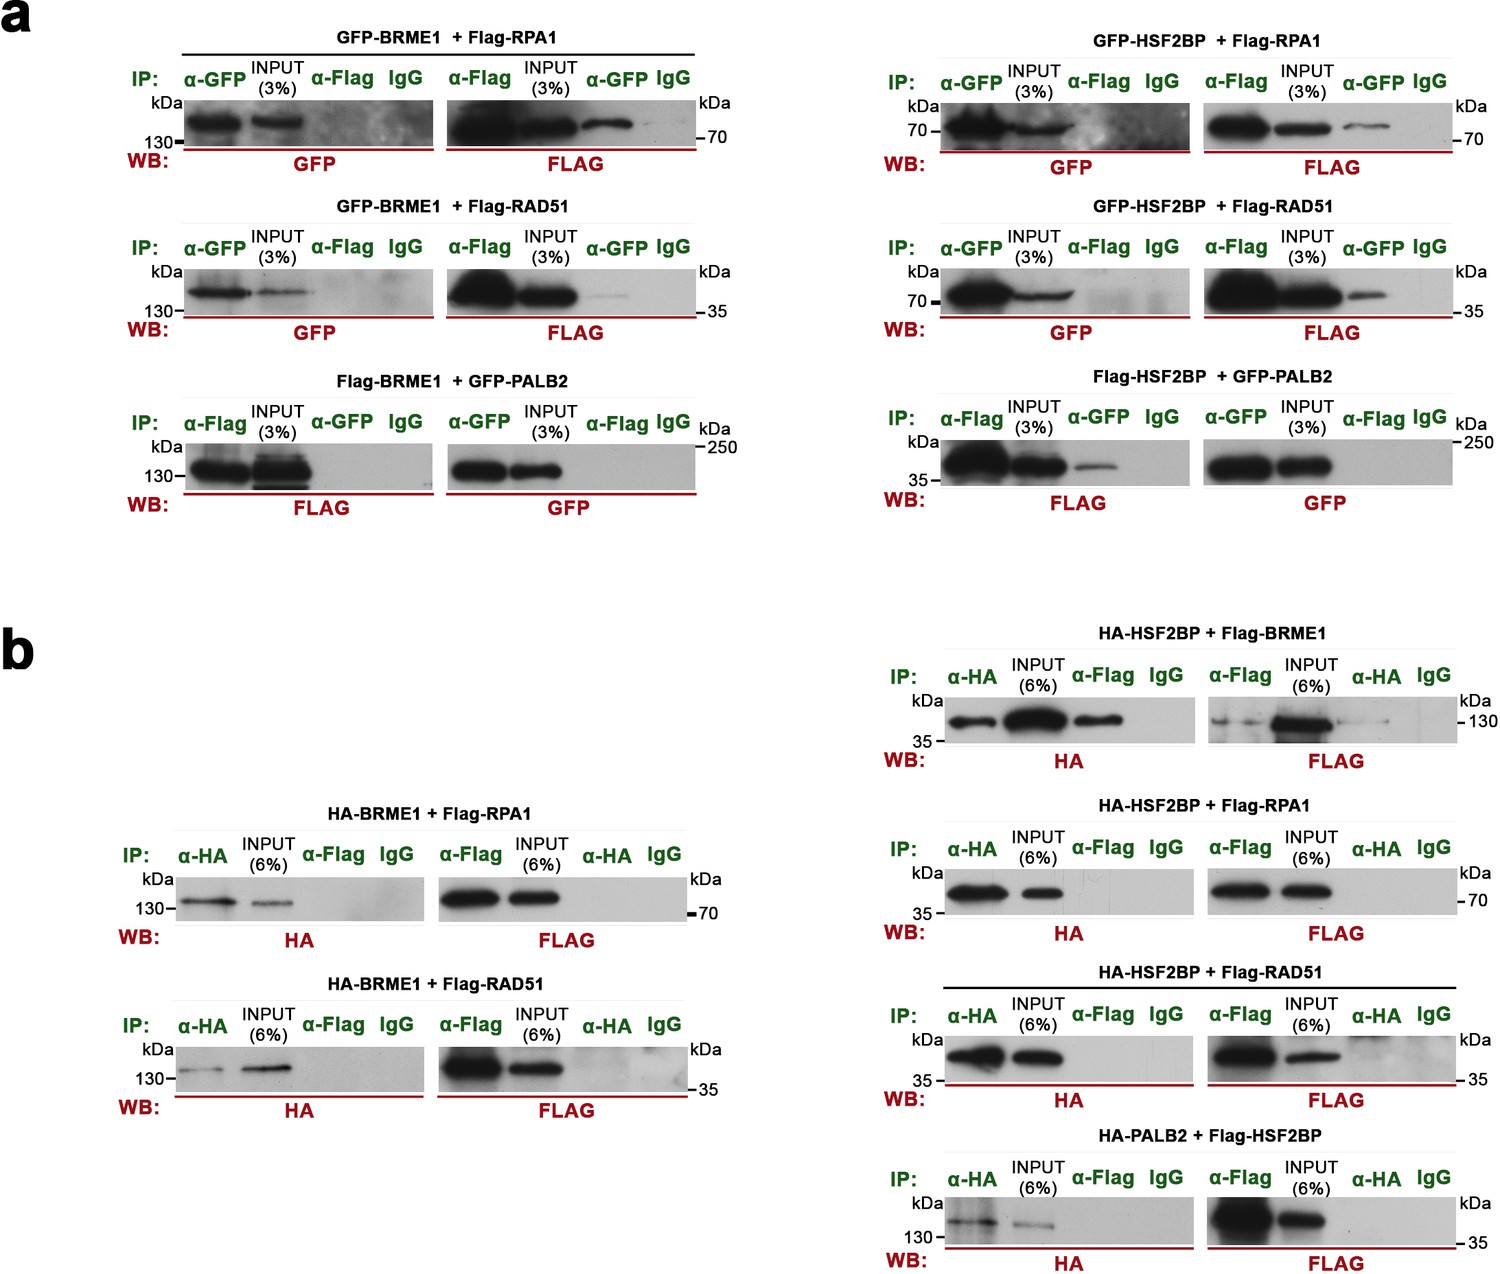
Co-immunoprecipitations of BRME1, HSF2BP, RPA, RAD51 and PALB2 expressed from transfected HEK293 cells and from TNT assays.
(a) HEK293T cells were transfected with GFP- or Flag-tagged BRME1/HSF2BP and different potential interactors (tagged-ORFs). Protein complexes were immunoprecipitated (IP, green text) overnight with an anti-Flag, anti-HA or anti-EGFP or IgGs (negative control) and were analyzed by immunoblotting with the indicated antibody (WB, red text). BRME1 (left panels) does not co-immunoprecipitates with PALB2 but co-immunoprecipitates with RPA1 and RAD51 (mildly). HSF2BP (right panels) co-immunoprecipitates with RPA1, RAD51 and PALB2 (mildly). (b) Flag or HA-tagged HSF2BP and BRME1 and their potential interactors (RPA1, RAD51 and PALB2) were expressed in a cell-free TNT system. Proteins were complexed during 30 min at RT an immunoprecipitated overnight with either an anti-Flag, anti-HA or IgGs (negative control), and analysed by immunoblotting with the indicated antibody. The unique positive co-immunoprecipitation was between HSF2BP with BRME1 suggesting that this is the only direct interaction.
Author response image 1
Tables
Appendix 1—key resources table
| Reagent type (species) or resource | Designation | Source or reference | Identifiers | Additional information |
|---|---|---|---|---|
| Genetic reagent (M. musculus) | Hsf2bp-/- | This paper | Materials and methods section Figure 2—figure supplement 1 Available from the authors upon request Dr. Alberto M. Pendás (amp@usal.es) | |
| Genetic reagent (M. musculus) | Hsf2bpS167L/S167L | This paper | Materials and methods section Figure 2—figure supplement 1 Available from the authors upon request Dr. Alberto M. Pendás (amp@usal.es) | |
| Genetic reagent (M. musculus) | Brme1-/- | This paper | Materials and methods section Figure 8—figure supplement 1 Available from the authors upon request Dr. Alberto M. Pendás (amp@usal.es) | |
| Genetic reagent (M. musculus) | Brme1Δ142-472/Δ142-472 | This paper | Materials and methods section Figure 7—figure supplement 1 Available from the authors upon request Dr. Alberto M. Pendás (amp@usal.es) | |
| Genetic reagent (M. musculus) | Rnf212-/- | This paper | Materials and methods section Figure 7—figure supplement 5 Available from the authors upon request Dr. Alberto M. Pendás (amp@usal.es) | |
| Genetic reagent (M. musculus) | Hei10-/- | This paper | Materials and methods section Figure 7—figure supplement 5 Available from the authors upon request Dr. Alberto M. Pendás (amp@usal.es) | |
| Genetic reagent (M. musculus) | Spo11-/- | This paper | Materials and methods section Figure 7—figure supplement 6 Available from the authors upon request Dr. Alberto M. Pendás (amp@usal.es) | |
| Genetic reagent (M. musculus) | Psma8-/- | PMID:31437213 | ||
| Genetic reagent (M. musculus) | Six6os1-/- | PMID:27796301 | ||
| Genetic reagent (M. musculus) | Rec8-/- | PMID:15515002 | Dr. John C. Schimenti (Cornell university) | |
| Cell line (H. sapiens) | U2OS | ATCC | HTB-96 | |
| Cell line (H. sapiens) | HEK293T | ATCC | CRL-11268 | |
| Recombinant DNA reagent | pEGFP-C1 | Clontech | Catalog: 6084–1 | |
| Recombinant DNA reagent | pcDNA3 | Invitrogen | A-150228 | |
| Recombinant DNA reagent | pcDNA3-2xFlag | This paper Generated from pcDNA3 | Materials and methods section Figure 6—figure supplement 2 Available from the authors upon request Dr. Alberto M. Pendás (amp@usal.es) | |
| Recombinant DNA reagent | pEGFP-C1 HSF2BP | This paper | Materials and methods section Figure 7 Available from the authors upon request Dr. Alberto M. Pendás (amp@usal.es) | |
| Recombinant DNA reagent | pcDNA3 2xFlag HSF2BP | This paper | Materials and methods section Figure 7 Available from the authors upon request Dr. Alberto M. Pendás (amp@usal.es) | |
| Recombinant DNA reagent | pcDNA3 2xFlag HSF2BP-S167L | This paper | Materials and methods section Figure 7 Available from the authors upon request Dr. Alberto M. Pendás (amp@usal.es) | |
| Recombinant DNA reagent | pcDNA3 2xHA HSF2BP | This paper | Materials and methods section Figure 10—figure supplement 1 Available from the authors upon request Dr. Alberto M. Pendás (amp@usal.es) | |
| Recombinant DNA reagent | pEGFP-C1 BRME1 | This paper | Materials and methods section Figure 10—figure supplement 1 Available from the authors upon request Dr. Alberto M. Pendás (amp@usal.es) | |
| Recombinant DNA reagent | pcDNA3 2xFlag BRME1 | This paper | Materials and methods section Figure 10—figure supplement 1 Available from the authors upon request Dr. Alberto M. Pendás (amp@usal.es) | |
| Recombinant DNA reagent | pcDNA3 2xFlag BRME1Δ142–472 | This paper | Materials and methods section Figure 7 Available from the authors upon request Dr. Alberto M. Pendás (amp@usal.es) | |
| Recombinant DNA reagent | pEGFP-C1 HSF2BP | This paper | Materials and methods section Figure 10 Available from the authors upon request Dr. Alberto M. Pendás (amp@usal.es) | |
| Recombinant DNA reagent | pEGFP-C1 HSF2BP-S167L | This paper | Materials and methods section Figure 10 Available from the authors upon request Dr. Alberto M. Pendás (amp@usal.es) | |
| Recombinant DNA reagent | pEGFP-C1 BRCA2-C | This paper | Materials and methods section Figure 6—figure supplement 2 Available from the authors upon request Dr. Alberto M. Pendás (amp@usal.es) | |
| Recombinant DNA reagent | pcDNA3 2xFlag BRCA2-C | This paper | Materials and methods section Figure 10 Available from the authors upon request Dr. Alberto M. Pendás (amp@usal.es) | |
| Recombinant DNA reagent | pcDNA3 2xFlag BRCA2-M | This paper | Materials and methods section Available from the authors upon request Dr. Alberto M. Pendás (amp@usal.es) | |
| Recombinant DNA reagent | pcDNA3 2xFlag BRCA2-N | This paper | Materials and methods section Available from the authors upon request Dr. Alberto M. Pendás (amp@usal.es) | |
| Recombinant DNA reagent | pcDNA3 2xFlag RPA1 | This paper | Materials and methods section Figure 10—figure supplement 1 Available from the authors upon request Dr. Alberto M. Pendás (amp@usal.es) | |
| Recombinant DNA reagent | pcDNA3 2xFlag RAD51 | This paper | Materials and methods section Figure 10—figure supplement 1 Available from the authors upon request Dr. Alberto M. Pendás (amp@usal.es) | |
| Recombinant DNA reagent | pEGFP-C1 PALB2 | This paper | Materials and methods section Figure 10—figure supplement 1 Available from the authors upon request Dr. Alberto M. Pendás (amp@usal.es) | |
| Recombinant DNA reagent | pcDNA 2xHA PALB2 | This paper | Materials and methods section Figure 10—figure supplement 1 Available from the authors upon request Dr. Alberto M. Pendás (amp@usal.es) | |
| Antibody | Anti-HSF2BP-R2 (rabbit polyclonal) | This paper (ProteintechTM) | Materials and methods section IF (1:30) WB (1:2000) Available from the authors upon request Dr. Alberto M. Pendás (amp@usal.es) | |
| Antibody | Anti-BRME1-R1 (rabbit polyclonal) | This paper (ProteintechTM) | Materials and methods section WB (1:3000) Available from the authors upon request Dr. Alberto M. Pendás (amp@usal.es) | |
| Antibody | Anti-BRME1-R2 (rabbit polyclonal) | This paper (ProteintechTM) | Materials and methods section IF (1:100) Available from the authors upon request Dr. Alberto M. Pendás (amp@usal.es) | |
| Antibody | Anti-DMC1 (rabbit polyclonal) | This paper (ProteintechTM) | Materials and methods section IF (1:500) Available from the authors upon request Dr. Alberto M. Pendás (amp@usal.es) | |
| Antibody | Anti-SYCP3 (mouse monoclonal) | Santa cruz | sc-74569 | IF (1:100) |
| Antibody | Anti-SYCP3 (rabbit polyclonal) | PMID:27796301 | K921 | Dr. José Luis Barbero (Centro de Investigaciones Biologicas) IF (1:60) |
| Antibody | Anti-SYCP1 (rabbit polyclonal) | Abcam | ab15090 | IF (1:200) |
| Antibody | anti-γH2AX (ser139) (rabbit polyclonal) | Millipore | #07–164 | IF (1:500) |
| Antibody | Anti-MLH1 (mouse monoclonal) | BD Biosciences | 51-1327GR | IF (1:20) |
| Antibody | Anti-CDK2 (mouse monoclonal) | Santa Cruz | sc-6248 | IF (1:20) |
| Antibody | αRAD51 (rabbit polyclonal) | Calbiochem | PC130 | IF (1:50) |
| Antibody | αRPA1 serum (rabbit polyclonal) | ¨Molly¨ | Dr. Edyta Marcon (Medical Research University of Toronto) IF (1:30) | |
| Antibody | αRPA2 (rat monoclonal) | Cell Signalling | 2208S | IF (1:100) WB (1:1000) |
| Antibody | Anti-SPATA22 (rabbit polyclonal) | Proteintech Europe | 16989–1-AP | IF (1:60) |
| Antibody | Anti-Flag (mouse monoclonal) | Sigma-Aldrich | F1804 | IF (1:100) IP (5 µg) |
| Antibody | Anti-GFP (mouse monoclonal) | Cusabio | CSB-MA000051M0m | IP (5 µg) |
| Antibody | Anti-HA (mouse monoclonal) | BioLegend | MMS-101P | IP (5 µg) |
| Antibody | Mouse IgGs (mouse polyclonal) | Jackson Immunoresearch | 015-000-003 | IP (5 µg) |
| Antibody | Anti-Flag (rabbit polyclonal) | Sigma-Aldrich | F7425 | WB (1:2000) |
| Antibody | Anti-GFP (goat polyclonal) | Santa Cruz | sc-5385 | WB (1:3000) |
| Antibody | Anti-GFP (rabbit polyclonal) | Life technologies | A-11122 | WB (1:3000) |
| Antibody | Anti-HA (rabbit polyclonal) | Sigma-Aldrich | H6908 | WB (1:3000) |
| Antibody | Goat α-mouse Alexa555 (goat polyclonal) | ThermoFisher | A-32727 | IF (1:200) |
| Antibody | Goat α-mouse Alexa488 (goat polyclonal) | ThermoFisher | A-11001 | IF (1:200) |
| Antibody | Donkey α-rabbit Alexa555 (donkey polyclonal) | ThermoFisher | A-31572 | IF (1:200) |
| Antibody | Goat α-rabbit Alexa488 (goat polyclonal) | ThermoFisher | A-32731 | IF (1:200) |
| Antibody | Goat α-rabbit Alexa488 Fab (goat polyclonal) | Jackson Immunoresearch | 111-547-003 | IF (1:100) |
| Antibody | Goat α-mouse AMCA (goat polyclonal) | Jackson Immunoresearch | 115-155-146 | IF (1:100) |
| Antibody | Donkey α-rabbit AMCA (donkey polyclonal) | Jackson Immunoresearch | 711-155-152 | IF (1:100) |
| Antibody | Goat α-rat Alexa488 (goat polyclonal) | ThermoFisher | A-11006 | IF (1:200) |
| Antibody | Secondary horseradish peroxidase-conjugated α-mouse (donkey polyclonal) | Jackson Immunoresearch | 715-035-150 | WB (1:5000) |
| Antibody | Secondary horseradish peroxidase-conjugated α-rabbit (donkey polyclonal) | Jackson Immunoresearch | 711-035-152 | WB (1:5000) |
| Antibody | Secondary horseradish peroxidase-conjugated α-goat (donkey polyclonal) | Jackson Immunoresearch | 705-035-147 | WB (1:5000) |
| Antibody | Secondary horseradish peroxidase-conjugated α-rat (donkey polyclonal) | Jackson Immunoresearch | 712-035-150 | WB (1:5000) |
| Antibody | Secondary DyLightTM 680 conjugated α-mouse (goat polyclonal) | Thermo Scientific | 35518 | WB (1:10000) |
| Antibody | Secondary DyLightTM 800 conjugated α-rabbit (goat polyclonal) | Thermo Scientific | 35571 | WB (1:10000) |
| Sequence-based reagent | sgRNA1 Hsf2bp | This paper (IDT) | CRISPR-Cas9 crRNA | Materials and methods section Supplementary file 1i Figure 2—figure supplement 1 5’-TCACAAAACTCTCCATCGTC-3’ |
| Sequence-based reagent | sgRNA2 Hsf2bp | This paper (IDT) | CRISPR-Cas9 crRNA | Materials and methods section Supplementary file 1i Figure 2—figure supplement 1 5’-ATTGGATGGGGATGTCAAGG-3’ |
| Sequence-based reagent | sgRNA3 Brme1 | This paper (IDT) | CRISPR-Cas9 crRNA | Materials and methods section Supplementary file 1i Figure 7—figure supplement 1 5’-AACCTCAGGGACTCTCTCTG-3’ |
| Sequence-based reagent | sgRNA4 Brme1 | This paper (IDT) | CRISPR-Cas9 crRNA | Materials and methods section Supplementary file 1i Figure 7—figure supplement 1 5’-GAAGTCTAGTTCCATTGCTG-3’ |
| Sequence-based reagent | sgRNA5 Spo11 | This paper (IDT) | CRISPR-Cas9 crRNA | Materials and methods section Supplementary file 1i Figure 7—figure supplement 6 5’-TATGTCTCTATGCAGATGCA-3’ |
| Sequence-based reagent | sgRNA6 Spo11 | This paper (IDT) | CRISPR-Cas9 crRNA | Materials and methods section Supplementary file 1i Figure 7—figure supplement 6 5’- ACACTGACAGCCAGCTCTTT-3’ |
| Sequence-based reagent | sgRNA7 Rnf212 | This paper (IDT) | CRISPR-Cas9 crRNA | Materials and methods section Supplementary file 1i Figure 7—figure supplement 5 5’- ACCCACGTGAGACTCGCGCG-3’ |
| Sequence-based reagent | sgRNA8 Rnf212 | This paper (IDT) | CRISPR-Cas9 crRNA | Materials and methods section Supplementary file 1i Figure 7—figure supplement 5 5’- CCTCAAAGGTCCGCGTATTC-3’ |
| Sequence-based reagent | sgRNA9 Hei10 | This paper (IDT) | CRISPR-Cas9 crRNA | Materials and methods section Supplementary file 1i Figure 7—figure supplement 5 5’- GAAAGGGTACTGTTGCAAGC-3’ |
| Sequence-based reagent | ssODN Hsf2bpS167L/S167L | This paper (IDT) | Materials and methods section Supplementary file 1j Figure 2—figure supplement 1 5’CTTTGGAAAGATGTGACAGTTCTATCTTTTTTATCTTTCAGGACAAAGCATTGAAGTTTTTCAACATAACTGGACAGACGATGGAGAGTTTTGTGAAGTTATTGGATGGGGATGTCAAGGAAGTTGATTCTGATGAAAATCAATTTGTCTTTGCACTGGCTGGAATTGTAACAAGTAGGTAACTTTTCAGATACAGCGCT3’ | |
| Sequence-based reagent | ssODN Brme1Δ142-472 /Δ142-472 | This paper (IDT) | Materials and methods section Supplementary file 1j Figure 7—figure supplement 1 5’CTTCAGAGTGCTTGCTTATTGAAGGCCAGGACTGAATCTTCTTTTTCCACAGGAAACAAGGCCAGAGCTGGGAGCCCTCAAAGCAGCCAGCCAGCCACAGGCAATGGAACTAGACTTCCTGCCTGACAGCCAGATACAGGATGCCCTGGATGCCACTAACATGGAGCAGGTAAGAGCTTTCTGTACTCAAATGTACACCC3’ | |
| Sequence-based reagent | ssODN Spo11-/- | This paper (IDT) | Materials and methods section Supplementary file 1j Figure 7—figure supplement 6 5’GTTTCCTGCGGTATGTGTTCTCTGCCGTGGTCTGTGTTTGTCACCGTCCAGGAGCAATGCTCATTCTGTGTTGAGCTTGCATCTGCATAGAGACATATTCTTCACTGACAGCCAGCTCTTTGGCAACCAGGCTGCGGTGGACAGCGCCATCGATGACATTTCCTGTATGCTGAAAGTGCCCAGGAGGAGTCTGCACGTGG-3’ | |
| Sequence-based reagent | HSF2BP-F1 | This paper | PCR primer | Materials and methods section Supplementary file 1j Figure 2—figure supplement 1 5’-TTCTTTGGAAAGATGTGACAGTTC-3’ |
| Sequence-based reagent | HSF2BP-R1 | This paper | PCR primer | Materials and methods section Supplementary file 1j Figure 2—figure supplement 1 5’-ACCTGGGTTTCCTTTAGATCAGTTA-3’ |
| Sequence-based reagent | BRME1- F2 | This paper | PCR primer | Materials and methods section Supplementary file 1j Figure 7—figure supplement 1 5’-GAAAGTTCTTCAGAGTGCTTGCT-3’ |
| Sequence-based reagent | BRME1- R2 | This paper | PCR primer | Materials and methods section Supplementary file 1j Figure 7—figure supplement 1 5’-AGCCCTATCTTGTCACCTAAAG-3’ |
| Sequence-based reagent | BRME1- F3 | This paper | PCR primer | Materials and methods section Supplementary file 1j Figure 7—figure supplement 1 5’-CCCAGCAGATGCCTCTCTTAT-3’ |
| Sequence-based reagent | BRME1- R3 | This paper | PCR primer | Materials and methods section Supplementary file 1j Figure 7—figure supplement 1 5’-CTCAGCAGAGTTCCAATGCAG-3’ |
| Sequence-based reagent | SPO11-F4 | This paper | PCR primer | Materials and methods section Supplementary file 1j Figure 7—figure supplement 6 5’- AGAGCCCCCAGTGCTCTTAAC-3’ |
| Sequence-based reagent | SPO11-R4 | This paper | PCR primer | Materials and methods section Supplementary file 1j Figure 7—figure supplement 6 5’- GGCAGACCCCTCTACCTCTGT-3’ |
| Sequence-based reagent | RNF212-F5 | This paper | PCR primer | Materials and methods section Supplementary file 1j Figure 7—figure supplement 5 5’- TTTCTTTGCCTCCGTACTTTTGG-3’ |
| Sequence-based reagent | RNF212-R5 | This paper | PCR primer | Materials and methods section Supplementary file 1j Figure 7—figure supplement 5 5’- CCCAGGCTTTACTTCAACAACAA −3’ |
| Sequence-based reagent | HEI10-F6 | This paper | PCR primer | Materials and methods section Supplementary file 1j Figure 7—figure supplement 5 5’- CTGCCTGTTCTCACATCTTC-3’ |
| Sequence-based reagent | HEI10-R6 | This paper | PCR primer | Materials and methods section Supplementary file 1j Figure 7—figure supplement 5 5’- AGCTTTCCAGAAAGGGTACTG −3’ |
| Sequence-based reagent | ss60-mer F | PMID:24068956 | DNA Binding assay primer | Materials and methods section Figure 7—figure supplement 4 5′-GAT CTG CACGACGCACACCGGACGTATCTGCTATCGCTCATGTCAACCGCTCAAGCTGC/3’BiotinTEG/ |
| Sequence-based reagent | ss60-mer R | PMID:24068956 | DNA Binding assay primer | Materials and methods section Figure 7—figure supplement 4 5′- GCAGCTTGAGCGGTTGACATGAGCGATAGCAGATACGTCCGGTGTGCGTCGTGCAGATC-3’ |
| Sequence-based reagent | HSF2BP-EX6F | This Paper | Sanger sequencing primer | Material and methods section Figure 1—figure supplement 1 5’-CTAGAATCTTCTGTATCCTGCA-3’ |
| Sequence-based reagent | HSF2BP-EX6R2 | This Paper | Sanger sequencing primer | Material and methods section Figure 1—figure supplement 1 5’-GGTCTGGAAGCAAACAGGCAA-3’ |
| Commercial assay or kit | TNT T7 Coupled Reticulocyte Lysate Systems | Promega | L4610 | Figure 7—figure supplement 4 |
| Commercial assay or kit | In Situ Cell Death Detection Kit | Roche | 11684795910 | Figure 2 |
| Commercial assay or kit | Matchmaker Gold Yeast Two-Hybrid System | Clontech | 630489 | Materials and methods section |
| Commercial assay or kit | Mouse testis Mate and Plate cDNA library | Clontech | 638852 | Materials and methods section |
| Commercial assay or kit | Jetpei | PolyPlus | 101–40N | Materials and methods section |
| Commercial assay or kit | GammaBind G Sepharose | GE Healthcare | 17-0885-02 | Materials and methods section |
| Commercial assay or kit | Dynabeads M-280 Streptavidin | Thermo Fisher | 11205D | Materials and methods section Figure 7—figure supplement 4 |
| Chemical compound, drug | MG132 | Sigma-Aldrich PMDI:28059716 | M8699 | Figure 10 |
| Other | DAPI stain | Invitrogen | D1306 | Materials and methods section |
| Other | Vectashield Mounting Medium | Vector Laboratories | H1000 | Materials and methods section |
| Other | ProLong Gold antifade reagent | Invitrogen | P10144 | Materials and methods section |
Additional files
-
Source data 1
Raw data for all figures and figure supplements.
- https://cdn.elifesciences.org/articles/56996/elife-56996-data1-v2.xlsx
-
Supplementary file 1
Supplementary data and tables including quantification data.
Supplementary file 1a. shows the whole exome sequencing and mapping metrics for the three genomic samples. Supplementary file 1b. shows the numbers of variants from the WES analysis and passing the various filters. Supplementary file 1c. shows the predictions of pathogenicity and conservations by 18 computational predictors. Supplementary files 1d and 1e. show the quantification of the colocalization between HSF2BP, BRME1, RPA1 and DMC1. Supplementary file 1f. shows the comparative alterations between all the mutants. Associated to Figures 4, 5, 6 and 9. Supplementary files 1g and 1h. show the putative BRME1 interactors identified by mass spectrometry. Supplementary files 1i and 1j. show respectively the crRNAs and the ssODN employed in the generation of the different mouse models. Supplementary file 1k. shows the primers and expected product sizes for genotyping mouse models. Supplementary file 1l. shows a summary of all the main and supplementary figures and their relationship.
- https://cdn.elifesciences.org/articles/56996/elife-56996-supp1-v2.docx
-
Transparent reporting form
- https://cdn.elifesciences.org/articles/56996/elife-56996-transrepform-v2.docx
Download links
A two-part list of links to download the article, or parts of the article, in various formats.
Downloads (link to download the article as PDF)
Open citations (links to open the citations from this article in various online reference manager services)
Cite this article (links to download the citations from this article in formats compatible with various reference manager tools)
A missense in HSF2BP causing primary ovarian insufficiency affects meiotic recombination by its novel interactor C19ORF57/BRME1
eLife 9:e56996.
https://doi.org/10.7554/eLife.56996


