Subcellular sorting of neuregulins controls the assembly of excitatory-inhibitory cortical circuits
- Centre for Developmental Neurobiology, Institute of Psychiatry, Psychology and Neuroscience, King’s College London, United Kingdom
- MRC Centre for Neurodevelopmental Disorders, King’s College London, United Kingdom
Figures
Figure 1 with 7 supplements
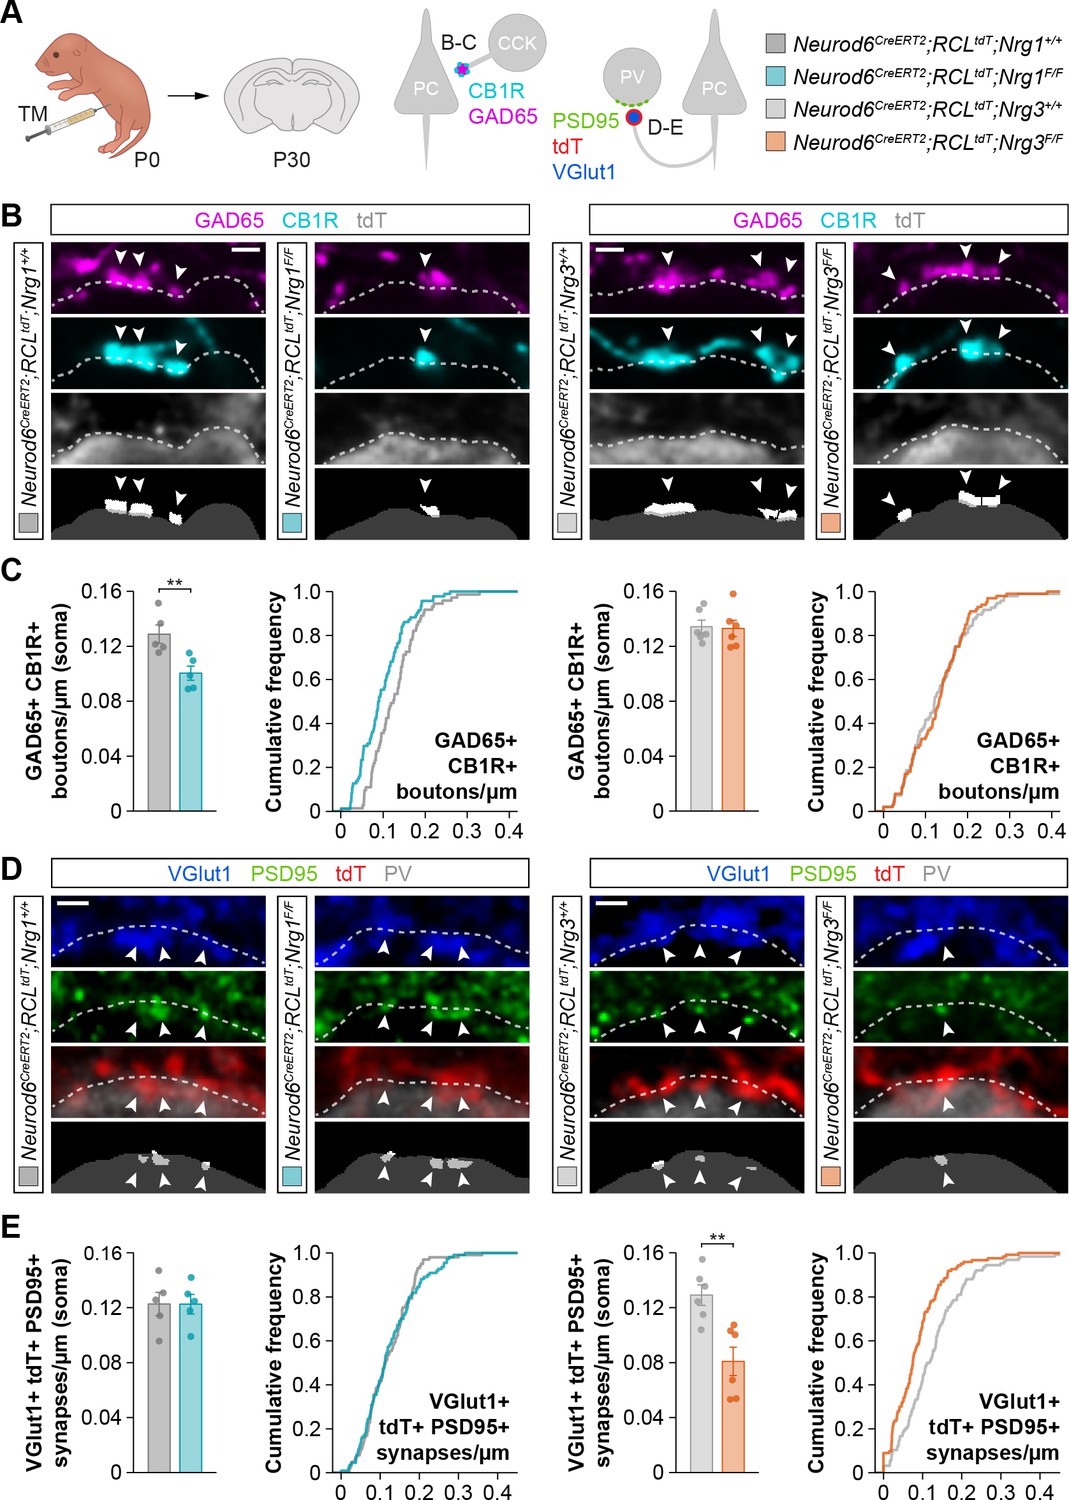
Specific synaptic deficits in cortical pyramidal cells lacking Nrg1 or Nrg3.
(A) Schematic of experimental design. Conditional deletion of Nrg1 or Nrg3 in pyramidal cells was achieved by tamoxifen (TM) injection in newly born pups at P0. Two synapses were analyzed in conditional neuregulin mutants: inhibitory synapses formed by CCK+ basket cells onto the soma of pyramidal cells (GAD65, CB1R) and excitatory synapses made by pyramidal cells onto PV+ interneurons (VGlut1, PSD95). (B) Confocal images (top three panels) and binary images (bottom panel) illustrating presynaptic GABAergic boutons co-labeled with GAD65 (magenta) and CB1R (cyan) contacting the soma of tdTomato+ pyramidal cells (gray) in controls, Nrg1 and Nrg3 conditional mutant mice. (C) Quantification of the density of GAD65+/CB1R+ boutons formed onto pyramidal cell somas in Nrg1 and Nrg3 conditional mutant mice. Two-tailed Student’s t-tests. For Neurod6CreERT2;RCLtdt;Nrg1, **p<0.01; n = 5 mice (73 cells) for controls and 5 mice (94 cells) for mutants. For Neurod6CreERT2;RCLtdt;Nrg3, p=0.867; n = 6 mice (96 cells) for controls and 6 mice (100 cells) for mutants. (D) Confocal images (top three panels) and binary images (bottom panel) illustrating presynaptic VGlut1+ puncta (blue) in tdTomato+ axons (red) of pyramidal cells located in close apposition to PSD95+ clusters (green) in PV+ interneurons (gray) in controls, Nrg1 and Nrg3 conditional mutant mice. (E) Quantification of the density of VGlut1+/PSD95+/tdTomato+ synapses contacting PV+ interneurons in Nrg1 and Nrg3 conditional mutant mice. Two-tailed Student’s t-tests. For Neurod6CreERT2;RCLtdt;Nrg1, p=0.993; n = 5 mice (101 cells) for controls and 5 mice (110 cells) for mutants. For Neurod6CreERT2;RCLtdt;Nrg3, **p<0.01; n = 6 mice (126 cells) for controls and 6 mice (123 cells) for mutants. Scale bars, 1 µm. Data represent mean ± s.e.m. The averages per animal and genotype are represented in bar graphs, and the distributions of values per cell are shown in cumulative frequency plots. Data used for quantitative analyses are available in Figure 1—source data 1 and Figure 1—source data 2.
-
Figure 1—source data 1
Numerical data of inhibitory and excitatory synapses in conditional mutant mice for Nrg1 and Nrg3.
- https://cdn.elifesciences.org/articles/57000/elife-57000-fig1-data1-v2.xlsx
-
Figure 1—source data 2
Summary of data and statistics that are represented in graphs.
- https://cdn.elifesciences.org/articles/57000/elife-57000-fig1-data2-v2.xlsx
Figure 1—figure supplement 1
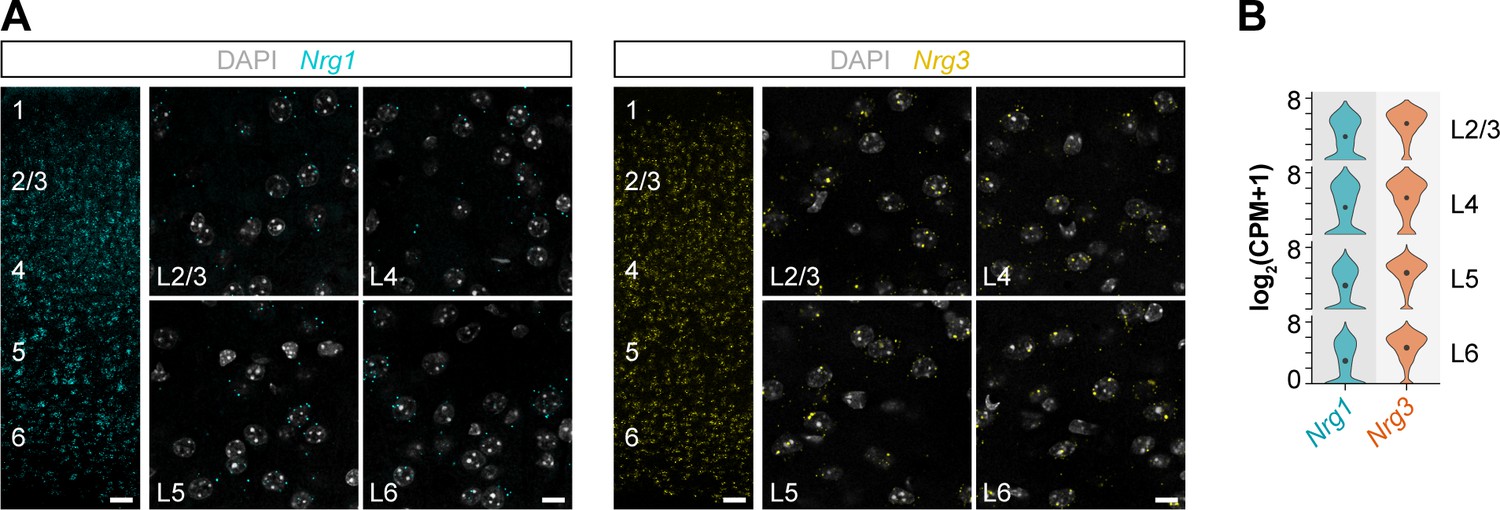
Cellular expression of Nrg1 and Nrg3 mRNA in the mouse cerebral cortex, related to Figure 1.
(A) Single-molecule fluorescent in situ hybridization with Nrg1 and Nrg3 RNAscope probes in coronal sections through somatosensory cortex at P30. Nrg1 and Nrg3 mRNA expression is abundantly detected across layers 2–6 in the mouse cerebral cortex. (B) mRNA expression of Nrg1 and Nrg3 in pyramidal cells across cortical layers at P56. The violin plots depict single-cell RNA-sequencing data from the RNA-Seq Data Navigator at the Allen Brain Atlas (http://celltypes.brain-map.org/rnaseq/mouse). Scale bars, 50 µm (A) and 10 µm (high magnifications).
Figure 1—figure supplement 2
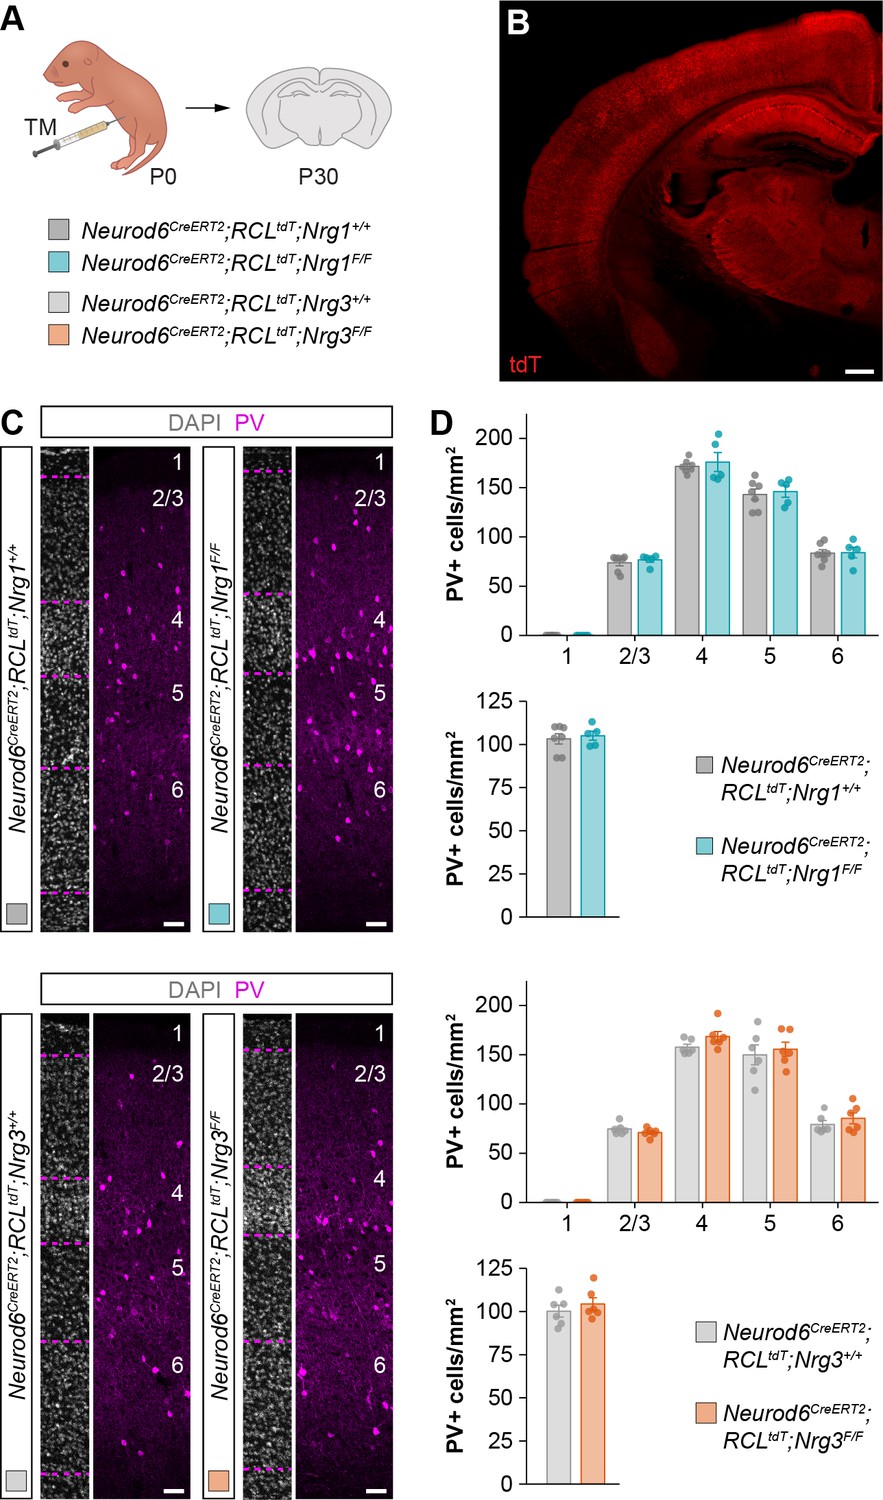
Postnatal deletion of Nrg1 or Nrg3 from cortical pyramidal cells does not affect the density and distribution of PV+ interneurons, related to Figure 1.
(A) Schematic of experimental design. Conditional deletion of Nrg1 or Nrg3 in pyramidal cells was achieved by tamoxifen injection in newly born pups at P0. (B) Expression of tdTomato in the cerebral cortex of Neurod6CreERT2;RCLtdT mice at P30 following tamoxifen injection at P0 illustrates the extent of genetic recombination. (C) Coronal sections through the somatosensory cortex processed for immunohistochemistry against parvalbumin (PV) (magenta) and counterstained with DAPI (gray) in control and conditional neuregulin mutant mice. (D) Quantification of the distribution and density of PV+ cells in pyramidal cell-specific Nrg1 and Nrg3 mutant mice and control littermates at P30. Distribution in Nrg1 mutants: Kruskal-Wallis rank sum test, F = 0.018, p=0.894; n = 7 mice (63 regions of interest, ROIs) for controls and 5 mice (45 ROIs) for mutants. Density in Nrg1 mutants: Mann-Whitney U-test, p=0.876; n = 7 mice (63 ROIs) for controls and 5 mice (45 ROIs) for mutants. Distribution in Nrg3 mutants: Kruskal-Wallis rank sum test, F = 0.059, p=0.824; n = 6 mice (50 ROIs) for controls and 6 mice (51 ROIs) for mutants. Density in Nrg3 mutants: Two-tailed Student’s t-test, p=0.425; n = 6 mice (50 ROIs) for controls and 6 mice (51 ROIs) for mutants. Scale bars, 400 µm (B) and 50 µm (C). Data are shown as mean ± s.e.m. Data used for quantitative analyses are available in Figure 1—figure supplement 2—source data 1.
-
Figure 1—figure supplement 2—source data 1
Numerical data of PV+ cell densities in conditional mutant mice for Nrg1 and Nrg3.
- https://cdn.elifesciences.org/articles/57000/elife-57000-fig1-figsupp2-data1-v2.xlsx
Figure 1—figure supplement 3
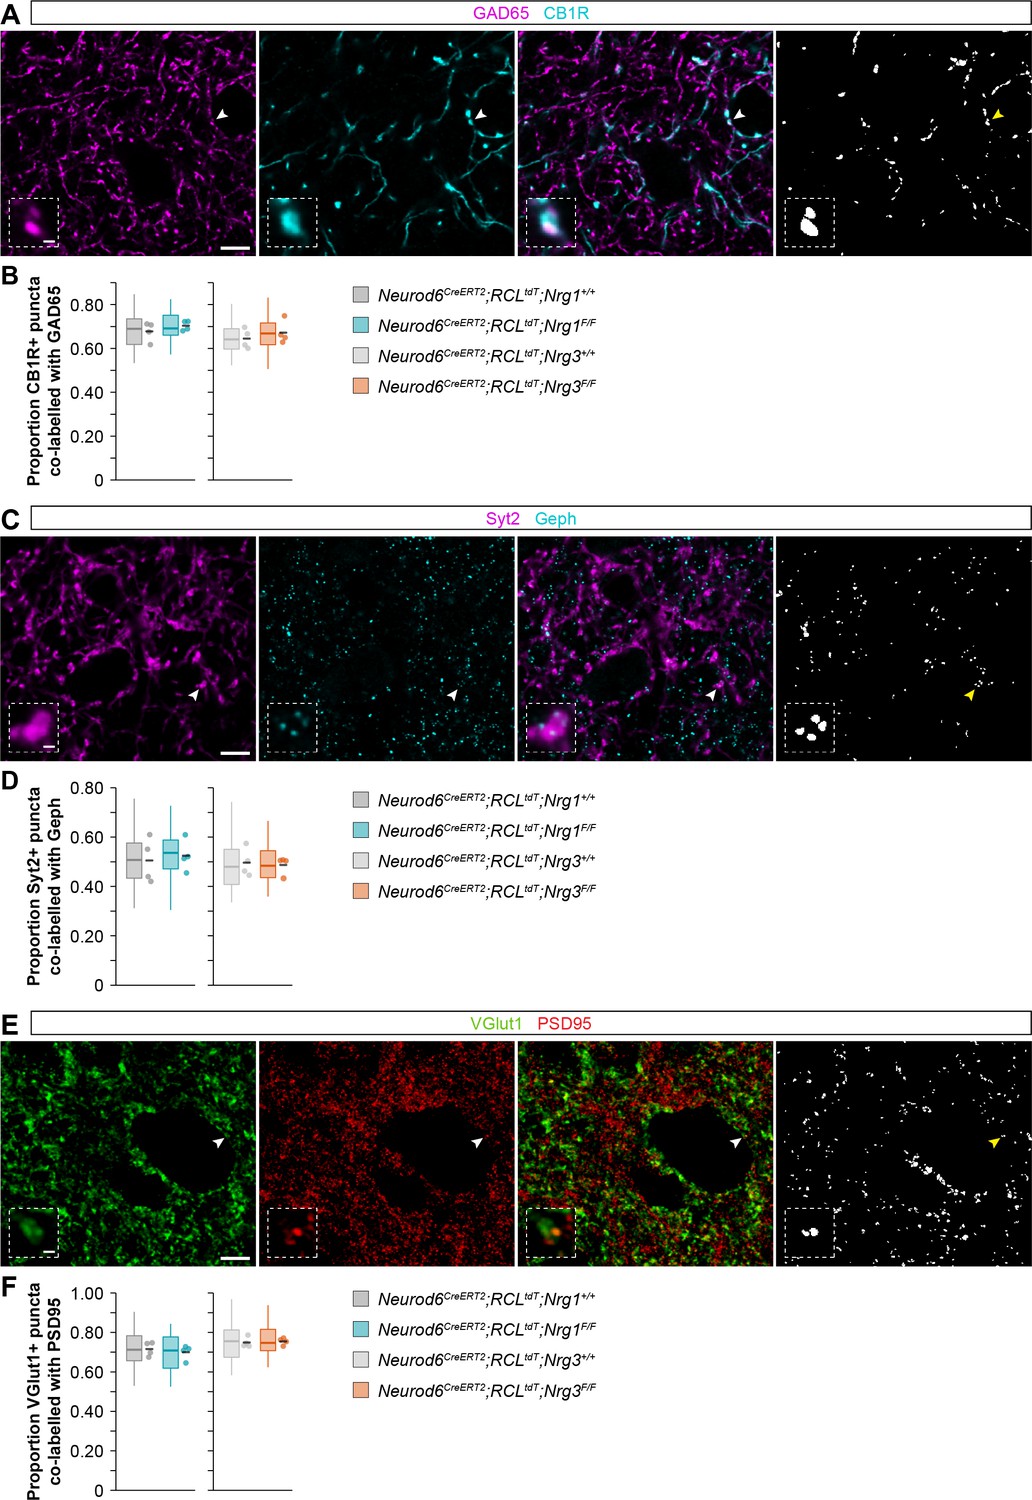
Extended view of synaptic labeling and analysis in brain slices from wild-type and conditional mutant mice.
(A) Coronal sections through the somatosensory cortex processed for immunohistochemistry against GAD65 (magenta) and CB1R (cyan) in control and conditional neuregulin mutant mice. The arrowhead indicates the localization of the synaptic puncta shown in the high-magnification image. (B) Quantification of the proportion of CB1R+ puncta that are co-labeled with GAD65. Two-tailed Student’s t-tests. For Neurod6CreERT2;RCLtdt;Nrg1, p=0.329; n = 4 mice (40 ROIs) for controls and four mice (40 ROIs) for mutants. For Neurod6CreERT2;RCLtdt;Nrg3, p=0.461; n = 4 mice (40 ROIs) for controls and 4 mice (40 ROIs) for mutants. (C) Coronal sections through the somatosensory cortex processed for immunohistochemistry against Synaptotagmin-2 (magenta) and gephyrin (cyan) in control and conditional neuregulin mutant mice. The arrowhead indicates the localization of the synaptic puncta shown in the high-magnification image. (D) Quantification of the proportion of Syt2+ puncta that are co-labeled with gephyrin. Two-tailed Student’s t-tests. For Neurod6CreERT2;RCLtdt;Nrg1, p=0.739; n = 4 mice (40 ROIs) for controls and 4 mice (40 ROIs) for mutants. For Neurod6CreERT2;RCLtdt;Nrg3, p=0.799; n = 4 mice (40 ROIs) for controls and 4 mice (40 ROIs) for mutants. (E) Coronal sections through the somatosensory cortex processed for immunohistochemistry against VGlut1 (green) and PSD95 (red) in control and conditional neuregulin mutant mice. The arrowhead indicates the localization of the synaptic puncta shown in the high-magnification image. (F) Quantification of the proportion of VGlut1+ puncta that are co-labeled with PSD95. Two-tailed Student’s t-tests. For Neurod6CreERT2;RCLtdt;Nrg1, p=0.552; n = 4 mice (40 ROIs) for controls and 4 mice (40 ROIs) for mutants. For Neurod6CreERT2;RCLtdt;Nrg3, p=0.741; n = 4 mice (40 ROIs) for controls and 4 mice (40 ROIs) for mutants. Scale bars, 5 µm (A, C, E) and 0.5 µm (high magnifications). Data from distributions of ROIs are shown as box plots, and the adjacent data points and lines represent the averages per animal and averaged mean per group, respectively. Data used for quantitative analyses are available in Figure 1—figure supplement 3—source data 1.
-
Figure 1—figure supplement 3—source data 1
Numerical data of synaptic colocalizations in conditional mutant mice for Nrg1 and Nrg3.
- https://cdn.elifesciences.org/articles/57000/elife-57000-fig1-figsupp3-data1-v2.xlsx
Figure 1—figure supplement 4
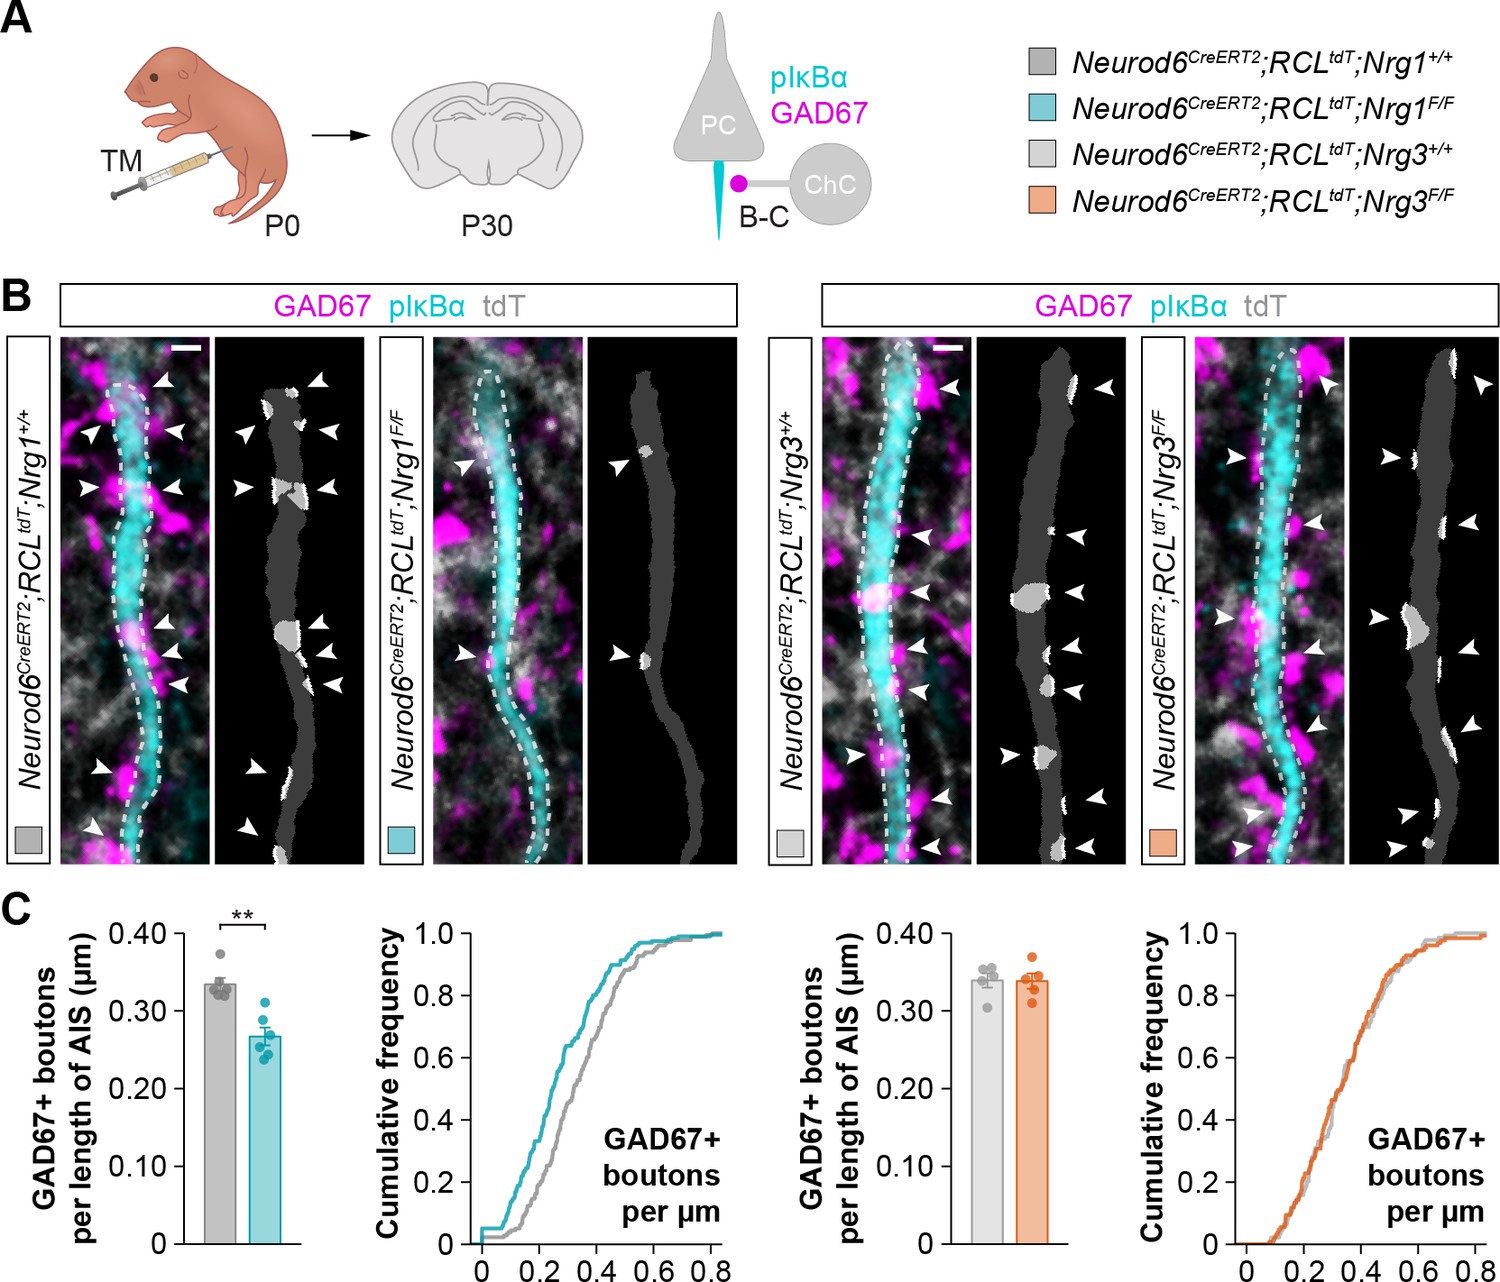
Loss of axo-axonic boutons in cortical pyramidal cells lacking Nrg1 but not Nrg3, related to Figure 1.
(A) Schematic of experimental design. Conditional deletion of Nrg1 or Nrg3 in pyramidal cells (PC) was achieved by tamoxifen (TM) injection in newly born pups at P0. Inhibitory synapses made by chandelier cells (ChC) onto the axon initial segment (AIS) of pyramidal cells (GAD67, pIκBα) were analyzed in these experiments. (B) Confocal images (left) and binary images used for quantification (right), showing GAD67+ boutons (magenta, arrowheads) contacting the AIS (cyan) of pyramidal cells in controls, Nrg1 and Nrg3 conditional mutant mice. (C) Quantification of the density of axo-axonic inhibitory boutons contacting pyramidal cells in controls, Nrg1 and Nrg3 conditional mutant mice. Mann-Whitney U-test: for Neurod6CreERT2;RCLtdt;Nrg1, **p<0.01; n = 6 mice (178 cells) for controls and six mice (196 cells) for mutants. Two-tailed Student’s t-test: for Neurod6CreERT2;RCLtdt;Nrg3, p=0.959; n = 5 mice (139 cells) for controls and 5 mice (127 cells) for mutants. ChC, chandelier cell; PC, pyramidal cell. Scale bars, 1 µm. Data are shown as mean ± s.e.m. The averages per animal and genotype are represented in bar graphs, and the distributions of values per cell are shown in cumulative frequency plots. Data used for quantitative analyses are available in Figure 1—figure supplement 4—source data 1.
-
Figure 1—figure supplement 4—source data 1
Numerical data of axo-axonic synapses in conditional mutant mice for Nrg1 and Nrg3.
- https://cdn.elifesciences.org/articles/57000/elife-57000-fig1-figsupp4-data1-v2.xlsx
Figure 1—figure supplement 5
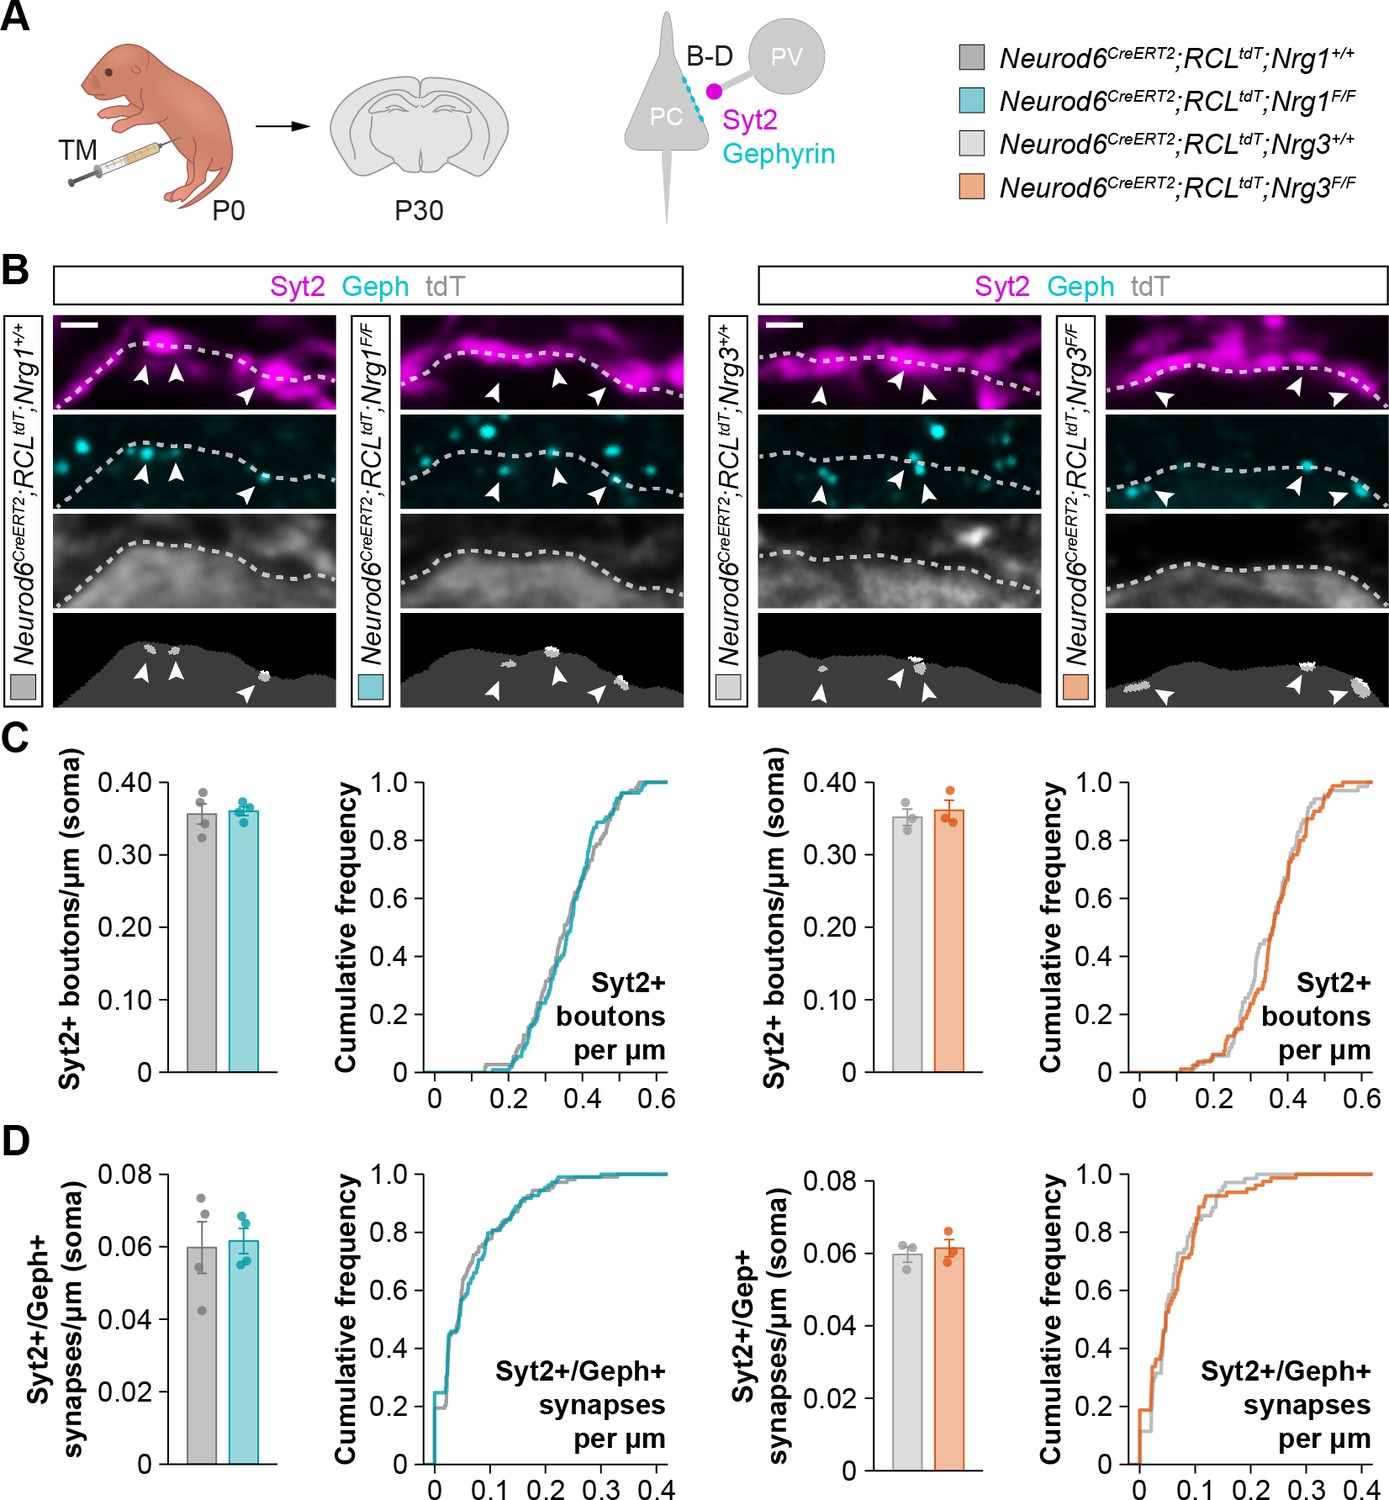
Density of inhibitory somatic synapses formed by PV+ basket cells onto pyramidal cells in conditional mutant mice for Nrg1 or Nrg3, related to Figure 1.
(A) Schematic of experimental design. Conditional deletion of Nrg1 or Nrg3 in pyramidal cells (PC) was achieved by tamoxifen (TM) injection in newly born pups at P0. Inhibitory synapses made by parvalbumin (PV)+ basket cells onto the soma of pyramidal cells (Syt2, Gephyrin) were analyzed in these experiments. (B) Confocal images (top three panels) and binary images (bottom panels) illustrating presynaptic GABAergic boutons labeled with synaptotagmin 2 (Syt2) (magenta) in close apposition to Gephyrin+ clusters (cyan) on the surface of tdTomato+ pyramidal cell somas (gray) in controls and Nrg1 and Nrg3 conditional mutant mice. (C) Quantification of the density of Syt2+ boutons contacting pyramidal cells in controls and Nrg1 and Nrg3 conditional mutant mice. Two-tailed Student’s t-tests. For Neurod6CreERT2;RCLtdt;Nrg1, p=0.803; n = 4 mice (108 cells) for controls and four mice (109 cells) for mutants. For Neurod6CreERT2;RCLtdt;Nrg3, p=0.618; n = 3 mice (70 cells) for controls and three mice (80 cells) for mutants. (D) Quantification of the density of Syt2+/Gephyrin+ synapses formed onto pyramidal cells in controls and Nrg1 and Nrg3 conditional mutant mice. Two-tailed Student’s t-tests. For Neurod6CreERT2;RCLtdt;Nrg1, p=0. 828; n = 4 mice (108 cells) for controls and 4 mice (109 cells) for mutants. For Neurod6CreERT2;RCLtdt;Nrg3, p=0. 609; n = 3 mice (70 cells) for controls and 3 mice (80 cells) for mutants. PC, pyramidal cell; PV, parvalbumin+ basket cell. Scale bars, 1 µm. Data are shown as mean ± s.e.m. The averages per animal and genotype are represented in bar graphs, and the distributions of values per cell are shown in cumulative frequency plots. Data used for quantitative analyses are available in Figure 1—figure supplement 5—source data 1.
-
Figure 1—figure supplement 5—source data 1
Numerical data of PV+ basket cell synapses in conditional mutant mice for Nrg1 and Nrg3.
- https://cdn.elifesciences.org/articles/57000/elife-57000-fig1-figsupp5-data1-v2.xlsx
Figure 1—figure supplement 6
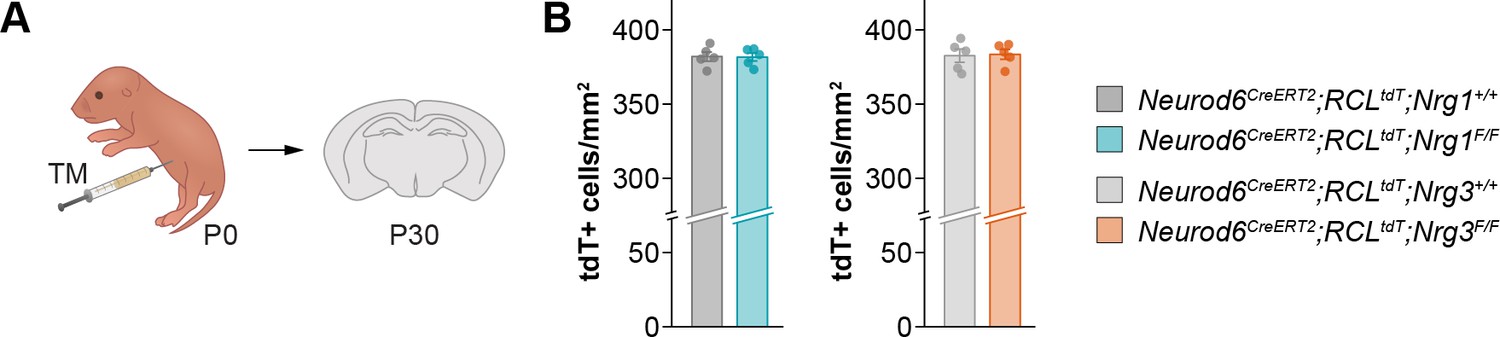
Density of tamoxifen-induced recombined pyramidal cells, related to Figure 1.
(A) Schematic of experimental design. Conditional deletion of Nrg1 or Nrg3 in pyramidal cells (PC) was achieved by tamoxifen (TM) injection in newly born pups at P0. (B) Quantification of the density of tdTomato+ pyramidal cells at P30. Two-tailed Student’s t-tests. For Neurod6CreERT2;RCLtdt;Nrg1, p=0.929; n = 5 mice (18 regions of interest, ROIs) for controls and 5 mice (18 ROIs) for mutants. For Neurod6CreERT2;RCLtdt;Nrg3, p=0.869; n = 5 mice (18 ROIs) for controls and 5 mice (18 ROIs) for mutants. Data are shown as mean ± s.e.m. Data used for quantitative analyses are available in Figure 1—figure supplement 6—source data 1.
-
Figure 1—figure supplement 6—source data 1
Numerical data of tdT+ cell densities in conditional mutant mice for Nrg1 and Nrg3.
- https://cdn.elifesciences.org/articles/57000/elife-57000-fig1-figsupp6-data1-v2.xlsx
Figure 1—figure supplement 7
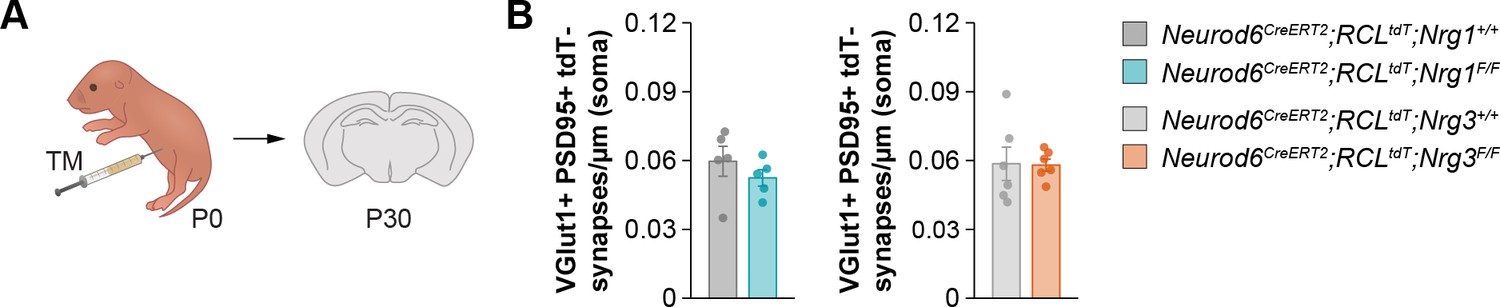
Cell-autonomous requirement of Nrg3 in excitatory synapse formation, related to Figure 1.
(A) Schematic of experimental design. Conditional deletion of Nrg1 or Nrg3 in pyramidal cells (PC) was achieved by tamoxifen (TM) injection in newly born pups at P0. (B) Quantification of the density of VGlut1+/PSD95+ synapses that do not arise from tdTomato+ pyramidal cell axons (tdTomato-) at P30. Two-tailed Student’s t-tests. For Neurod6CreERT2;RCLtdt;Nrg1, p=0.360; n = 5 mice (101 cells) for controls and 5 mice (110 cells) for mutants. For Neurod6CreERT2;RCLtdt;Nrg3, p=0.940; n = 6 mice (126 cells) for controls and 6 mice (123 cells) for mutants. Data are shown as mean ± s.e.m. Data used for quantitative analyses are available in Figure 1—figure supplement 7—source data 1.
-
Figure 1—figure supplement 7—source data 1
Numerical data of tdT-negative excitatory synapses in conditional mutant mice for Nrg1 and Nrg3.
- https://cdn.elifesciences.org/articles/57000/elife-57000-fig1-figsupp7-data1-v2.xlsx
Figure 2 with 2 supplements
Gain-of-function experiments show the specificity of Nrg1 and Nrg3 in inhibitory and excitatory synapse formation.
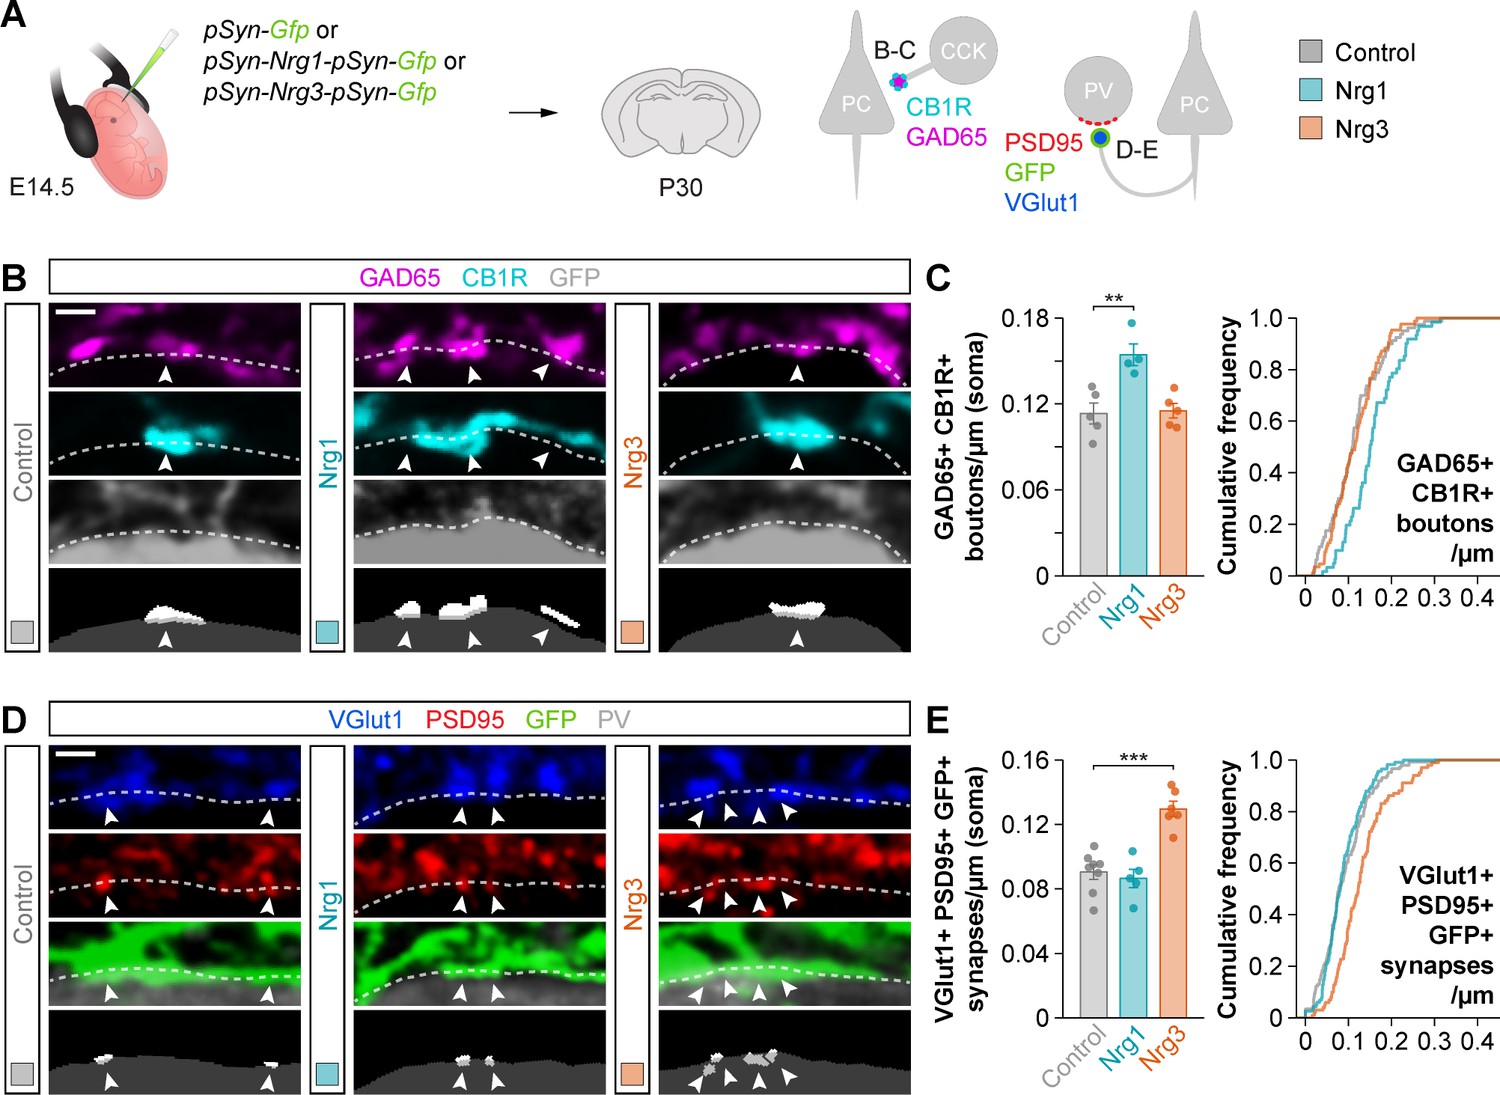
(A) Schematic of experimental design. In utero electroporation of pSyn-Gfp (control), pSyn-Nrg1-pSyn-Gfp, or pSyn-Nrg3-pSyn-Gfp plasmids into pyramidal cell progenitors was performed at E14.5 mouse embryos, and the density of synapses was analyzed in cortical superficial layers at P30: inhibitory synapses formed by CCK+ basket cells onto the soma of pyramidal cells (GAD65, CB1R), and excitatory synapses made by pyramidal cells onto PV+ interneurons (VGlut1, PSD95). (B) Confocal images (top three panels) and binary images (bottom panel) illustrating presynaptic GABAergic boutons co-labeled with GAD65 (magenta) and CB1R (cyan) contacting the soma of GFP+ pyramidal cells (gray) in electroporated mice. (C) Quantification of the density of GAD65+/CB1R+ boutons formed onto GFP+ pyramidal cell somas in gain-of-function experiments. One-way ANOVA: F = 11.100, p<0.01. Tukey’s range test for post hoc comparison between control and experimental groups: for pSyn-Nrg1-pSyn-Gfp, **p<0.01; for pSyn-Nrg3-pSyn-Gfp, p=0.976; n = 5 mice (80 cells) for pSyn-Gfp (control), 4 mice (61 cells) for pSyn-Nrg1-pSyn-Gfp, and 5 mice (87 cells) for pSyn-Nrg3-pSyn-Gfp. (D) Confocal images (top three panels) and binary images (bottom panel) illustrating presynaptic VGlut1+ puncta (blue) in GFP+ axons (green) of pyramidal cells located in close apposition to PSD95+ clusters (red) in PV+ interneurons (gray) in electroporated mice. (E) Quantification of the density of VGlut1+/PSD95+/GFP+ synapses contacting PV+ interneurons in gain-of-function experiments. One-way ANOVA: F = 22.120, p<0.001. Tukey’s range test for post hoc comparison between control and experimental groups: for pSyn-Nrg1-pSyn-Gfp, p=0.999; for pSyn-Nrg3-pSyn-Gfp, ***p<0.001; n = 8 mice (147 cells) for pSyn-Gfp, 5 mice (116 cells) for pSyn-Nrg1-pSyn-Gfp, and 6 mice (101 cells) for pSyn-Nrg3-pSyn-Gfp. Scale bars, 1 µm (B, D). Data represent mean ± s.e.m. The averages per animal and genotype are represented in bar graphs, and the distributions of values per cell are shown in cumulative frequency plots. Data used for quantitative analyses are available in Figure 2—source data 1.
-
Figure 2—source data 1
Numerical data of inhibitory and excitatory synapses in gain-of-function experiments.
- https://cdn.elifesciences.org/articles/57000/elife-57000-fig2-data1-v2.xlsx
Figure 2—figure supplement 1
Density of electroporated cortical pyramidal cells in gain-of-function experiments, related to Figure 2.
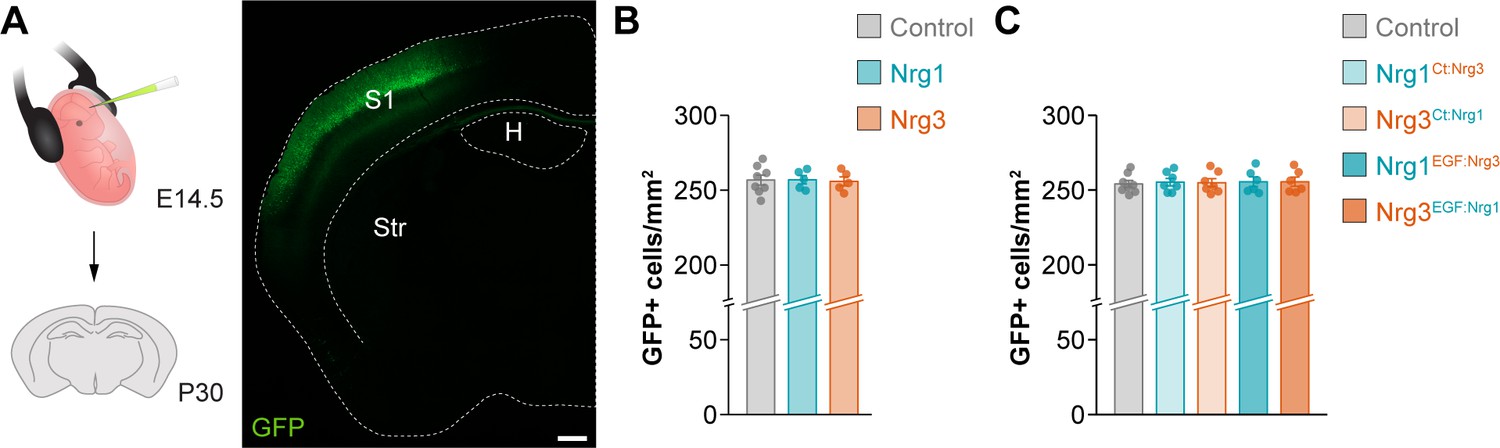
(A) Schematic of experimental design. Gain-of-function experiments were performed by in utero electroporation of the somatosensory cortex at E14.5 and analysis at P30. The coronal section illustrates the expression of GFP in a typical experiment. (B) Quantification of the density of GFP+ cells in the somatosensory cortex of mice following electroporation of control and wild-type neuregulin-expressing plasmids. One-way ANOVA, F = 0.026, p=0.975; n = 8 mice (24 regions of interest, ROIs) for pSyn-Gfp (control), 5 mice (16 ROIs) for pSyn-Nrg1-pSyn-Gfp, and 5 mice (16 ROIs) for pSyn-Nrg3-pSyn-Gfp. (C) Quantification of the density of GFP+ cells in the somatosensory cortex of mice following electroporation of control and chimeric neuregulin-expressing plasmids. One-way ANOVA, F = 0.054, p=0.994; n = 8 mice (30 ROIs) for pSyn-Gfp (control), 7 mice (24 ROIs) for pSyn-Nrg1Ct:Nrg3-pSyn-Gfp, 7 mice (24 ROIs) for pSyn-Nrg3Ct:Nrg1-pSyn-Gfp, 6 mice (22 ROIs) for pSyn-Nrg1EGF:Nrg3-pSyn-Gfp, and 6 mice (22 ROIs) for pSyn-Nrg3EGF:Nrg1-pSyn-Gfp. Scale bar, 400 µm. Data are shown as mean ± s.e.m. Data used for quantitative analyses are available in Figure 2—figure supplement 1—source data 1.
-
Figure 2—figure supplement 1—source data 1
Numerical data of GFP+ cell densities in gain-of-function experiments.
- https://cdn.elifesciences.org/articles/57000/elife-57000-fig2-figsupp1-data1-v2.xlsx
Figure 2—figure supplement 2
Extended view of synaptic labelling and analysis in brain slices from wild-type and electroporated mice.
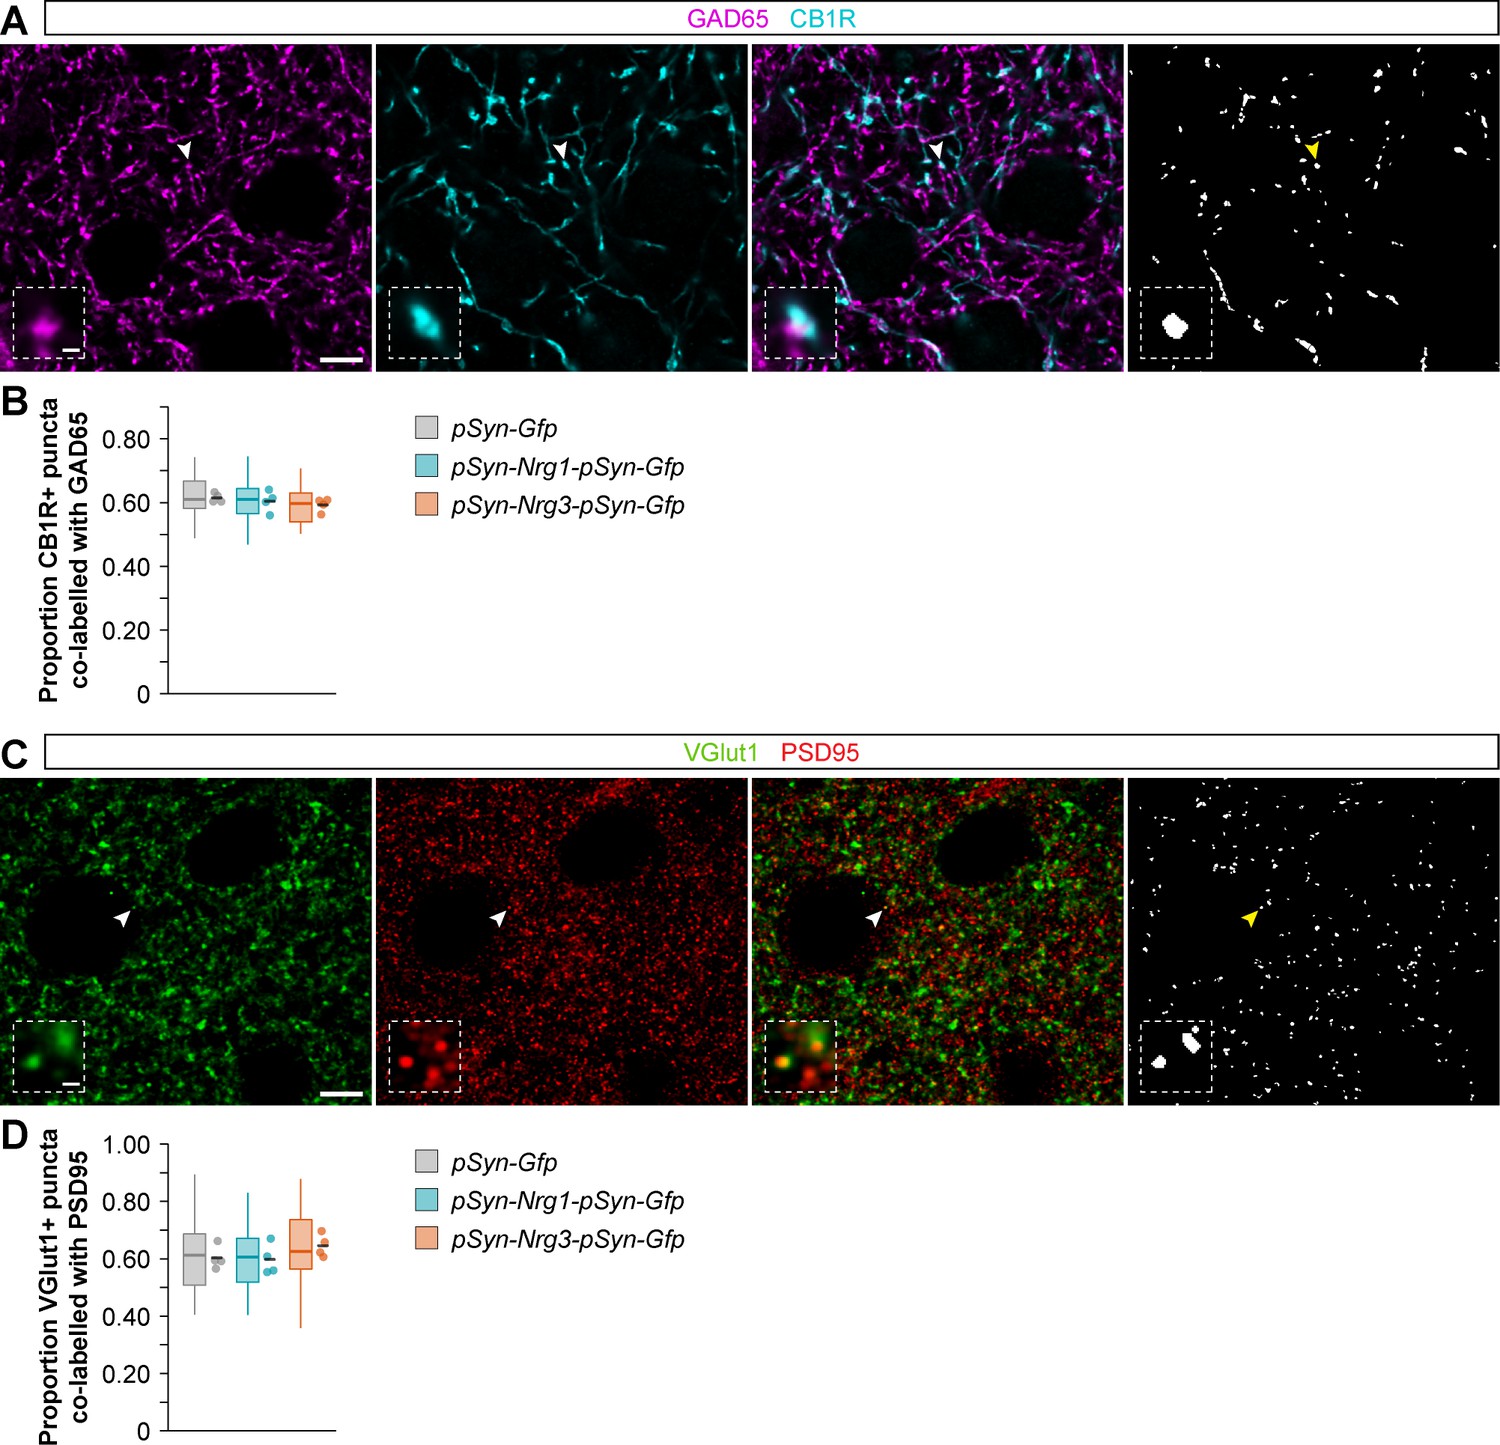
(A) Coronal sections through the somatosensory cortex processed for immunohistochemistry against GAD65 (magenta) and CB1R (cyan) in control and conditional neuregulin mutant mice. The arrowhead indicates the localization of the synaptic puncta shown in the high magnification image. (B) Quantification of the proportion of CB1R+ puncta that are co-labeled with GAD65. One-way ANOVA: F = 0.860, p=0.455. For pSyn-Gfp (control), n = 4 mice (40 ROIs); for pSyn-Nrg1-pSyn-Gfp, four4 mice (40 ROIs); for pSyn-Nrg3EGF:Nrg1-pSyn-Gfp, 4 mice (40 ROIs). (C) Coronal sections through the somatosensory cortex processed for immunohistochemistry against VGlut1 (green) and PSD95 (red) in control and conditional neuregulin mutant mice. The arrowhead indicates the localization of the synaptic puncta shown in the high=magnification image. (D) Quantification of the proportion of VGlut1+ puncta that are co-labeled with PSD95. One-way ANOVA: F = 1.324, p=0.313. For pSyn-Gfp (control), n = 4 mice (40 ROIs); for pSyn-Nrg1-pSyn-Gfp, 4 mice (40 ROIs); for pSyn-Nrg3EGF:Nrg1-pSyn-Gfp, 4 mice (40 ROIs). Scale bars, 5 µm (A, C) and 0.5 µm (high magnifications). Data from distributions of ROIs are shown as box plots, and the adjacent data points and lines represent the averages per animal and averaged mean per group, respectively. Data used for quantitative analyses are available in Figure 2—figure supplement 2—source data 1.
-
Figure 2—figure supplement 2—source data 1
Numerical data of synaptic colocalizations in gain-of-function experiments.
- https://cdn.elifesciences.org/articles/57000/elife-57000-fig2-figsupp2-data1-v2.xlsx
Figure 3 with 6 supplements
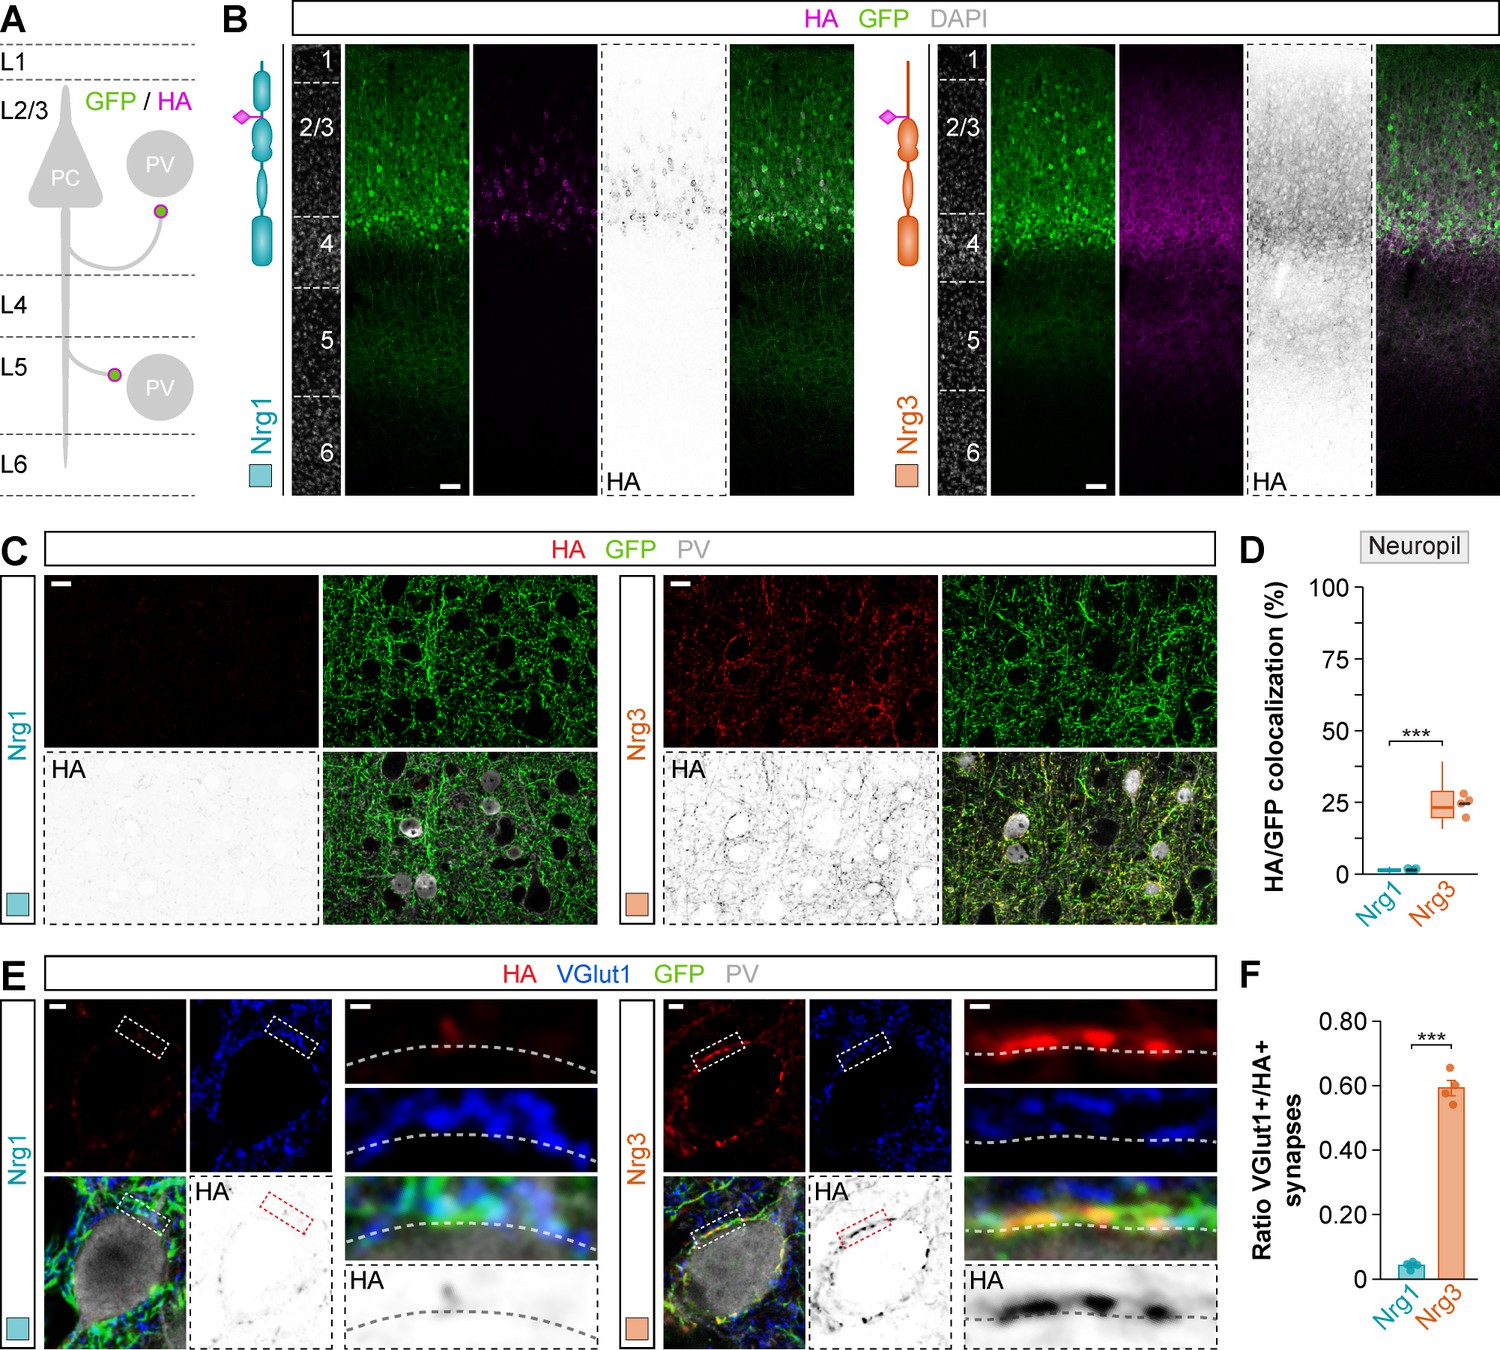
Nrg1 and Nrg3 have distinct subcellular distribution in pyramidal cells.
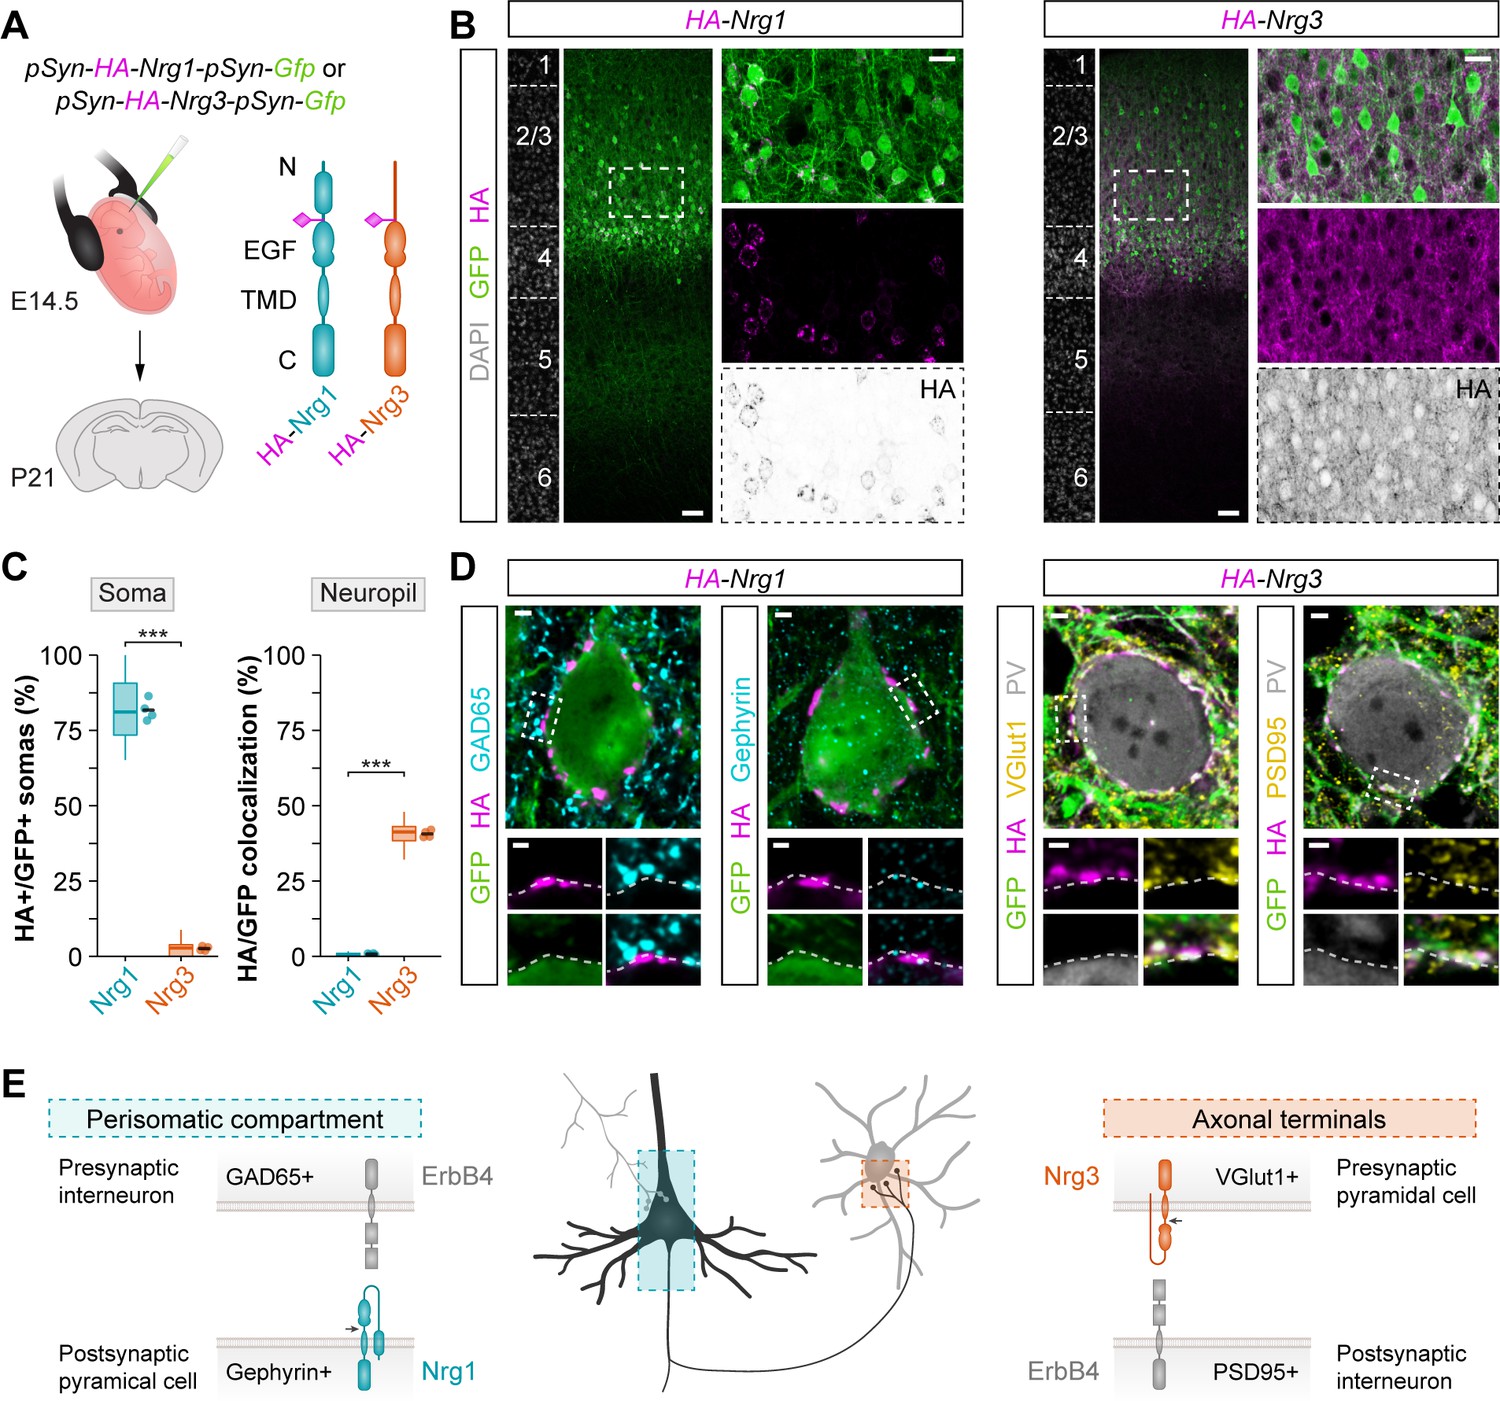
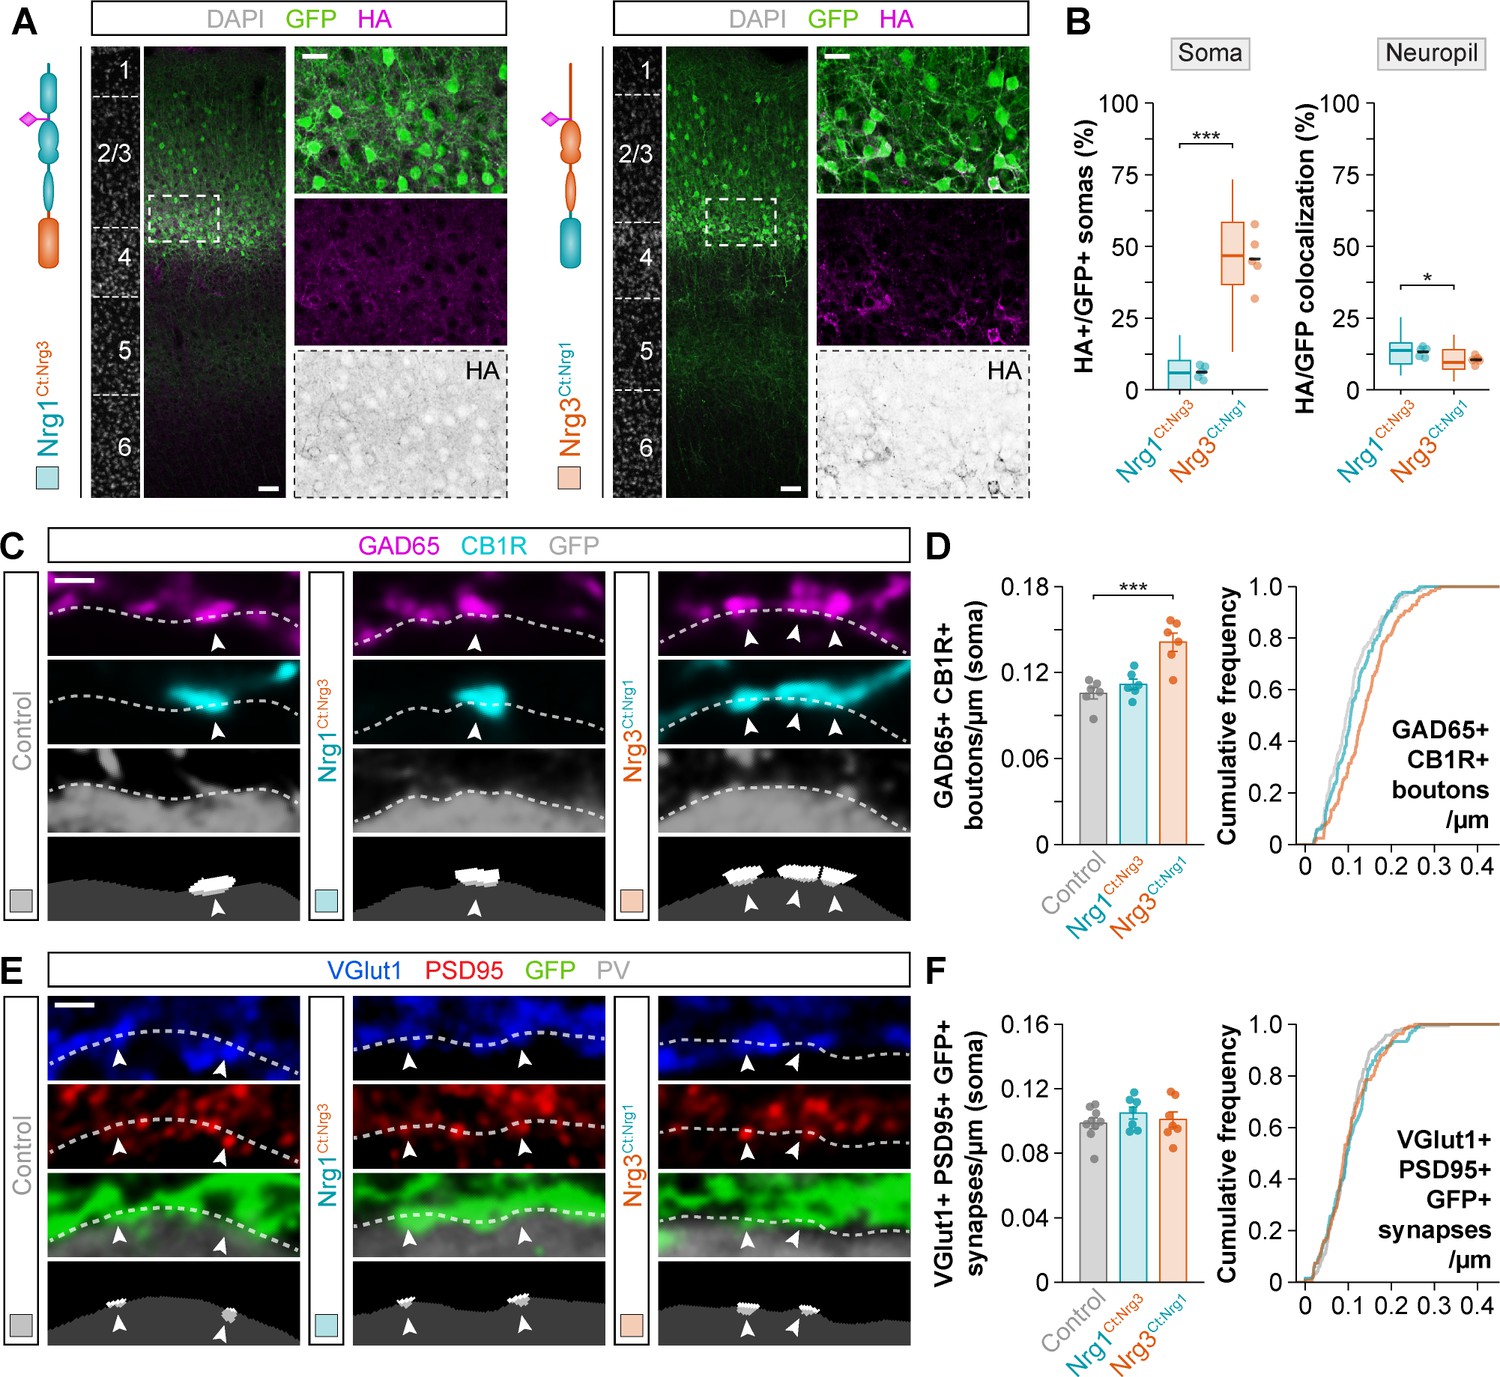
(A) Schematic of experimental design. Plasmids encoding HA-tagged neuregulins and GFP were electroporated in pyramidal cell progenitors at E14.5, and the subcellular localization of neuregulins was analyzed at P21. The schematics depict the protein structure of neuregulins indicating the insertion of the HA tag in the extracellular. N, N-terminal domain; EGF, EGF-like domain; TMD, transmembrane domain; C, C-terminal domain. (B) Coronal sections through somatosensory cortex of P21 mice following in utero electroporation of pSyn-Nrg1-pSyn-Gfp or pSyn-Nrg3-pSyn-Gfp plasmids at E14.5. Sections were processed for immunohistochemistry against GFP (green) and HA (magenta) and counterstained with DAPI (gray). The high magnification images illustrate the localization of HA-tagged neuregulins in GFP+ pyramidal cells. The bottom panel depicts HA staining in a color-inverted image. Dotted squares indicate the localization of the cells shown in the high magnification images. (C) Quantification of the localization of HA+ neuregulin in the soma and neuropil of GFP+ pyramidal cells. Soma: Two-tailed Student’s t-test, ***p<0.001; n = 4 mice (32 regions of interest, ROIs) for pSyn-Nrg1-pSyn-Gfp, n = 4 mice (32 ROIs) for pSyn-Nrg3-pSyn-Gfp. Neuropil: Two-tailed Student’s t-test, ***p<0.001; n = 4 mice (32 ROIs) for pSyn-Nrg1-pSyn-Gfp, n = 4 mice (32 ROIs) for pSyn-Nrg3-pSyn-Gfp. (D) Localization of neuregulins with synaptic markers. Somatic Nrg1+ clusters (magenta) co-localize with Gephyrin (cyan) in the soma of pyramidal cells (green) in close proximity to presynaptic GABAergic boutons co-labeled by GAD65 (cyan). Nrg3+ clusters (magenta) co-localize with VGlut1+ (yellow) in presynaptic GFP+ axon terminals of pyramidal cells in close proximity to postsynaptic PSD95 clusters (yellow) in PV+ interneurons (gray). Dotted squares indicate the localization of the synaptic puncta shown in the high-magnification images. (E) Schematic illustrating the subcellular localization of Nrg1, Nrg3, and ErbB4 in cortical circuits. Scale bars, 50 µm (B) and 20 µm (high magnifications), and 2 µm (D) and 1 µm (high magnifications). Data from the distributions of ROIs are shown as box plots, and the adjacent data points and lines represent the averages per animal and averaged mean per group, respectively. Data used for quantitative analyses are available in Figure 3—source data 1.
-
Figure 3—source data 1
Numerical data of subcellular localization of HA-tagged neuregulin constructs in electroporated pyramidal cells.
- https://cdn.elifesciences.org/articles/57000/elife-57000-fig3-data1-v2.xlsx
Figure 3—figure supplement 1
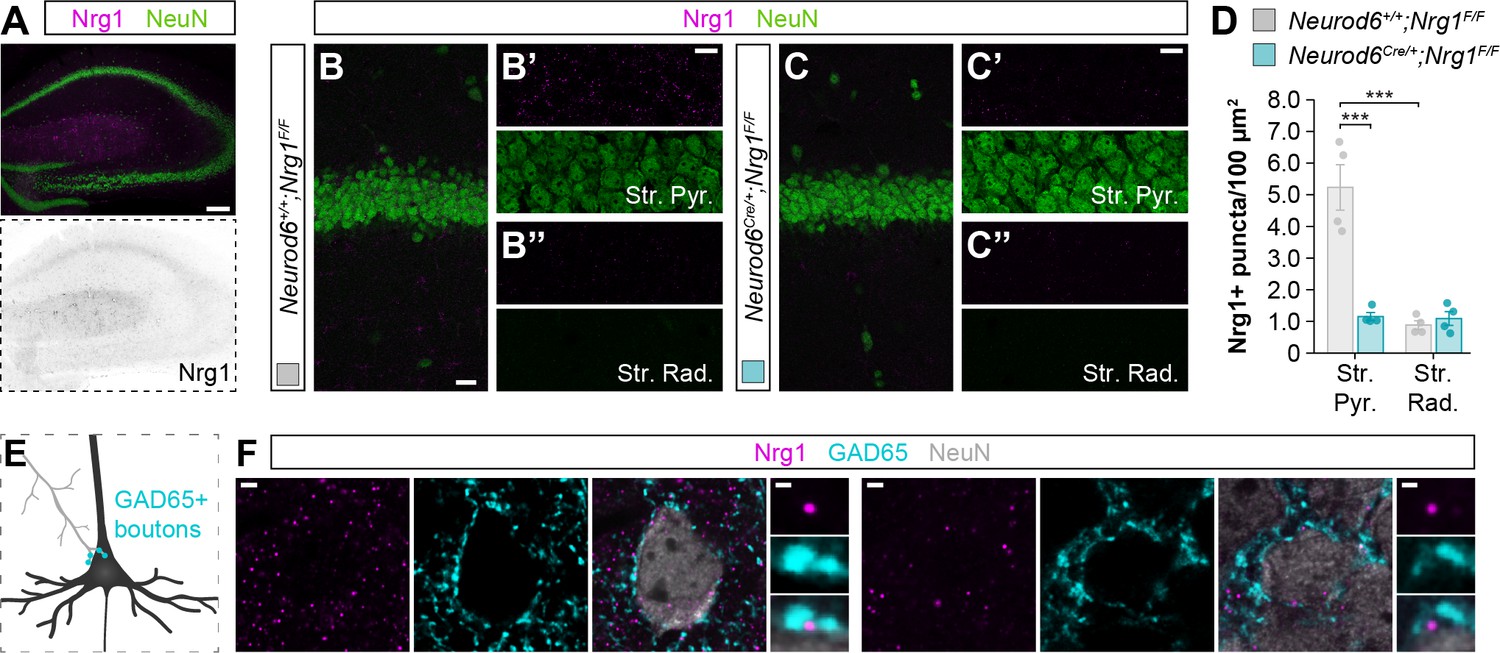
Localization of endogenous Nrg1 in somas of cortical neurons, and specific targeting to inhibitory GABAergic clusters.
(A) Expression of endogenous Nrg1 protein (magenta) in the hippocampus of wild-type mice at P30, co-stained with NeuN marker (green) to label the cell bodies of neurons. The bottom panel depicts Nrg1 staining in a color-inverted image. Note the intense expression of Nrg1 along the Stratum Pyramidale in CA1 region, where the somas of pyramidal cells reside. (B–C) Coronal sections through CA1 region of Neurod6+/+;Nrg1F/F (B) and Neurod6Cre/+;Nrg1F/F (C) mice at P30. Sections were processed for immunohistochemistry against Nrg1 (magenta) and NeuN (green). The high-magnification images illustrate Nrg1+ puncta expression within the Stratum Pyramidale and Stratum Radiatum. Note that endogenous Nrg1 protein is abundantly expressed in the Stratum Pyramidale, where the somas of pyramidal cells are located. (D) Quantification of the density of Nrg1+ clusters in regions of interest (ROIs) in both the Stratum Pyramidale and Stratum Radiatum of conditional mutant mice and wild-type littermates. Stratum Pyramidale: Two-tailed Student’s t-test, ***p<0.001, n = 4 mice (40 ROIs) for Neurod6+/+;Nrg1F/F, n = 4 mice (40 ROIs) for Neurod6Cre/+;Nrg1F/F. Stratum Radiatum: Two-tailed Student’s t-test, p=0.980, n = 4 mice (40 ROIs) for Neurod6+/+;Nrg1F/F, n = 4 mice (40 ROIs) for Neurod6Cre/+;Nrg1F/F. Two-tailed Student’s t-test between Stratum Pyramidale and Stratum Radiatum in wild-type mice, ***p<0.001. (E) Schematic illustrating the synaptic innervation of GABAergic boutons (labeled with the presynaptic marker GAD65) onto the somatic compartment of cortical pyramidal cells. (F) Co-localization of endogenous Nrg1 (magenta) with GAD65 (cyan) in the soma of NeuN+ cells in both the cerebral cortex (left) and the hippocampus (right). Scale bar, 100 µm (A), 20 µm (B–C) and 10 µm (high magnifications), and 2 µm (F) and 0.5 µm (high magnifications). Data are shown as mean ± s.e.m. Data used for quantitative analyses are available in Figure 3—figure supplement 1—source data 1.
-
Figure 3—figure supplement 1—source data 1
Numerical data of puncta density of endogenous Nrg1 protein in the cerebral cortex.
- https://cdn.elifesciences.org/articles/57000/elife-57000-fig3-figsupp1-data1-v2.xlsx
Figure 3—figure supplement 2
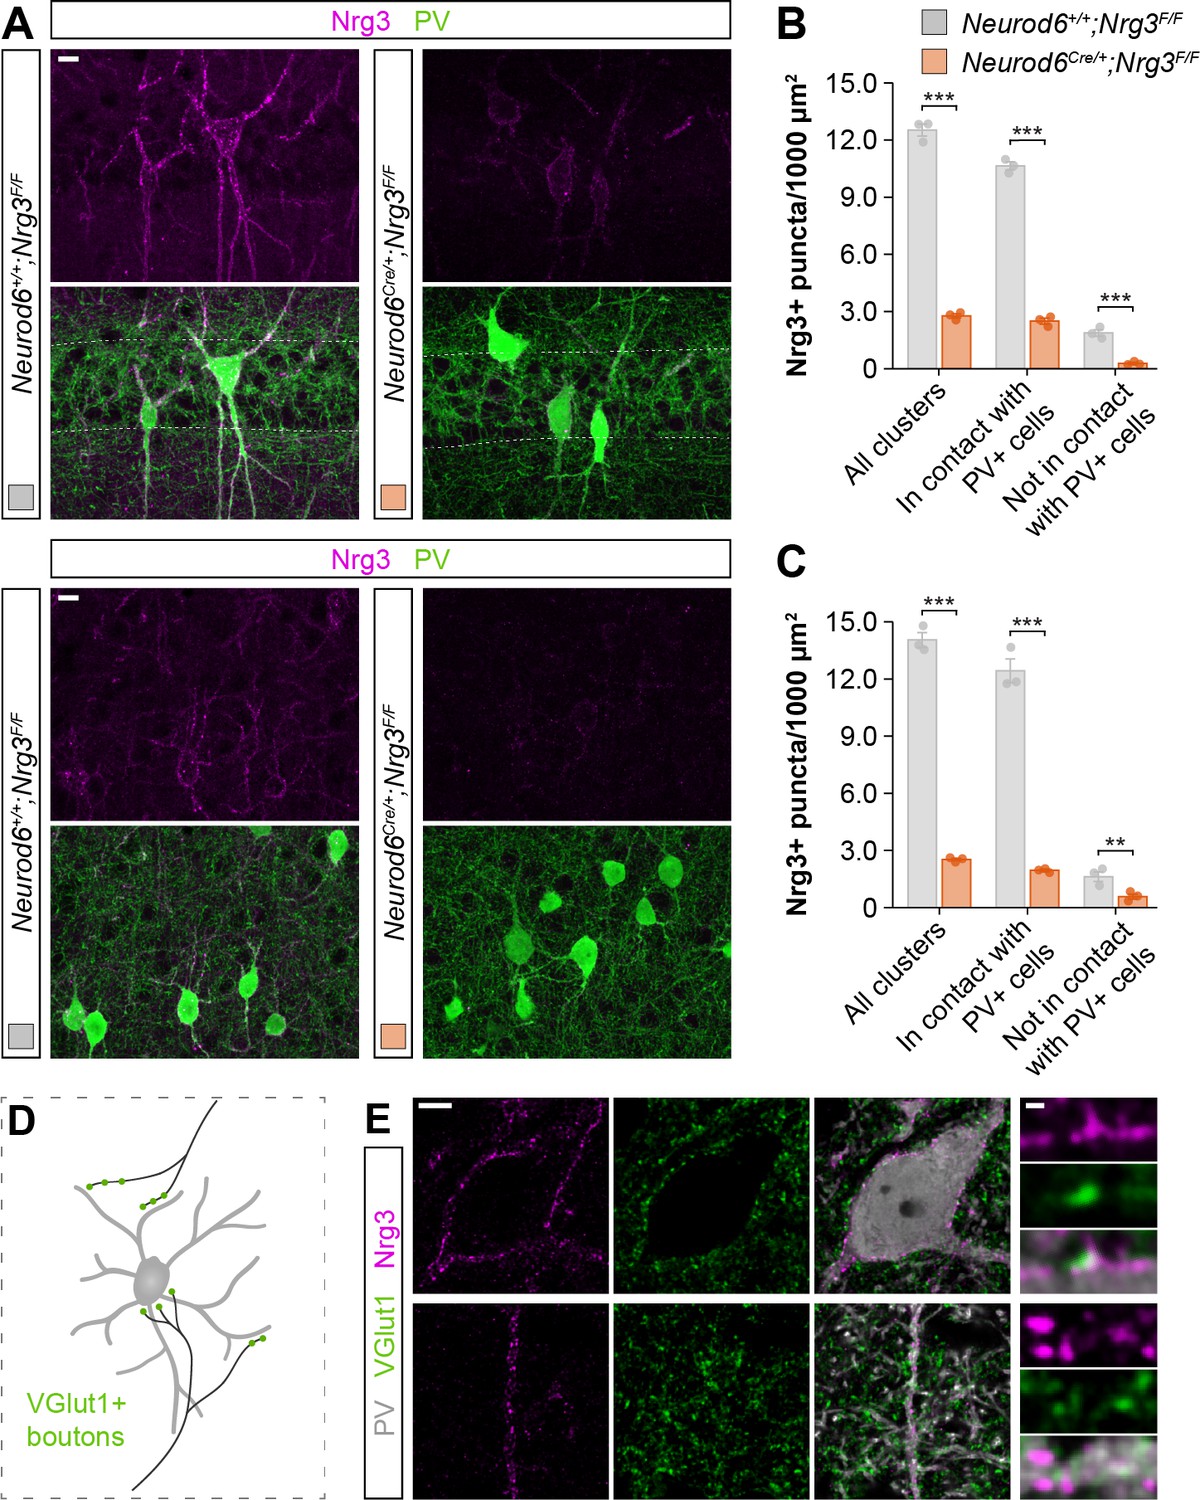
Localization of endogenous Nrg3 in the neuropil of the neocortex, and specific targeting to excitatory presynaptic boutons innervating PV+ interneurons.
(A) Coronal sections through CA1 region (top) and cerebral cortex (bottom) of Neurod6+/+;Nrg3F/F and Neurod6Cre/+;Nrg3F/F mice at P30. Sections were processed for immunohistochemistry against Nrg3 (magenta) and PV (green). Endogenous Nrg3 protein is primarily found as a punctate pattern in close apposition to PV+ cell bodies. Note that the conditional deletion of Nrg3 is driven by the transgenic line Neurod6Cre, which only recombines the LoxP site-flanked Nrg3 allele in pyramidal cells. Therefore, Nrg3 expression by PV+ cells can still be appreciated in the neocortex of this conditional KO model. (B) Quantification of the total density of Nrg3+ clusters in regions of interest (ROIs) in the CA1 region of conditional mutant mice and wild-type littermates, and quantification of the density of Nrg3+ clusters in apposition to, or not in contact with, PV+ cell bodies. All clusters: Two-tailed Student’s t-test, ***p<0.001, n = 3 mice (36 ROIs) for Neurod6+/+;Nrg3F/F, n = 3 mice (36 ROIs) for Neurod6Cre/+;Nrg3F/F. In contact with PV+ cells: Two-tailed Student’s t-test, ***p<0.001, n = 3 mice (44 ROIs) for Neurod6+/+;Nrg1F/F, n = 3 mice (36 ROIs) for Neurod6Cre/+;Nrg1F/F. Not in contact with PV+ cells: Two-tailed Student’s t-test, **p<0.01, n = 3 mice (36 ROIs) for Neurod6+/+;Nrg3F/F, n = 3 mice (36 ROIs) for Neurod6Cre/+;Nrg3F/F. (C) Quantification of the total density of Nrg3+ clusters in regions of interest (ROIs) in the cerebral cortex of conditional mutant mice and wild-type littermates, and quantification of the density of Nrg3+ clusters in apposition to, or not in contact with, PV+ cell bodies. All clusters: Two-tailed Student’s t-test, ***p<0.001, n = 3 mice (36 ROIs) for Neurod6+/+;Nrg3F/F, n = 3 mice (36 ROIs) for Neurod6Cre/+;Nrg3F/F. In contact with PV+ cells: Two-tailed Student’s t-test, ***p<0.001, n = 3 mice (36 ROIs) for Neurod6+/+;Nrg1F/F, n = 3 mice (36 ROIs) for Neurod6Cre/+;Nrg1F/F. Not in contact with PV+ cells: Two-tailed Student’s t-test, p=0.269, n = 3 mice (36 ROIs) for Neurod6+/+;Nrg3F/F, n = 3 mice (36 ROIs) for Neurod6Cre/+;Nrg3F/F. (D) Schematic illustrating the synaptic innervation of glutamatergic boutons (labeled with the presynaptic marker VGlut1) onto cortical PV+ interneurons. (E) Co-localization of endogenous Nrg3 (magenta) with VGlut1 (green) within excitatory inputs innervating PV+ interneurons in the neocortex. Scale bar, 10 µm (A), 5 µm (E) and 0.5 µm (high magnifications). Data are shown as mean ± s.e.m. Data used for quantitative analyses are available in Figure 3—figure supplement 2—source data 1.
-
Figure 3—figure supplement 2—source data 1
Numerical data of puncta density of endogenous Nrg3 protein in the cerebral cortex.
- https://cdn.elifesciences.org/articles/57000/elife-57000-fig3-figsupp2-data1-v2.xlsx
Figure 3—figure supplement 3
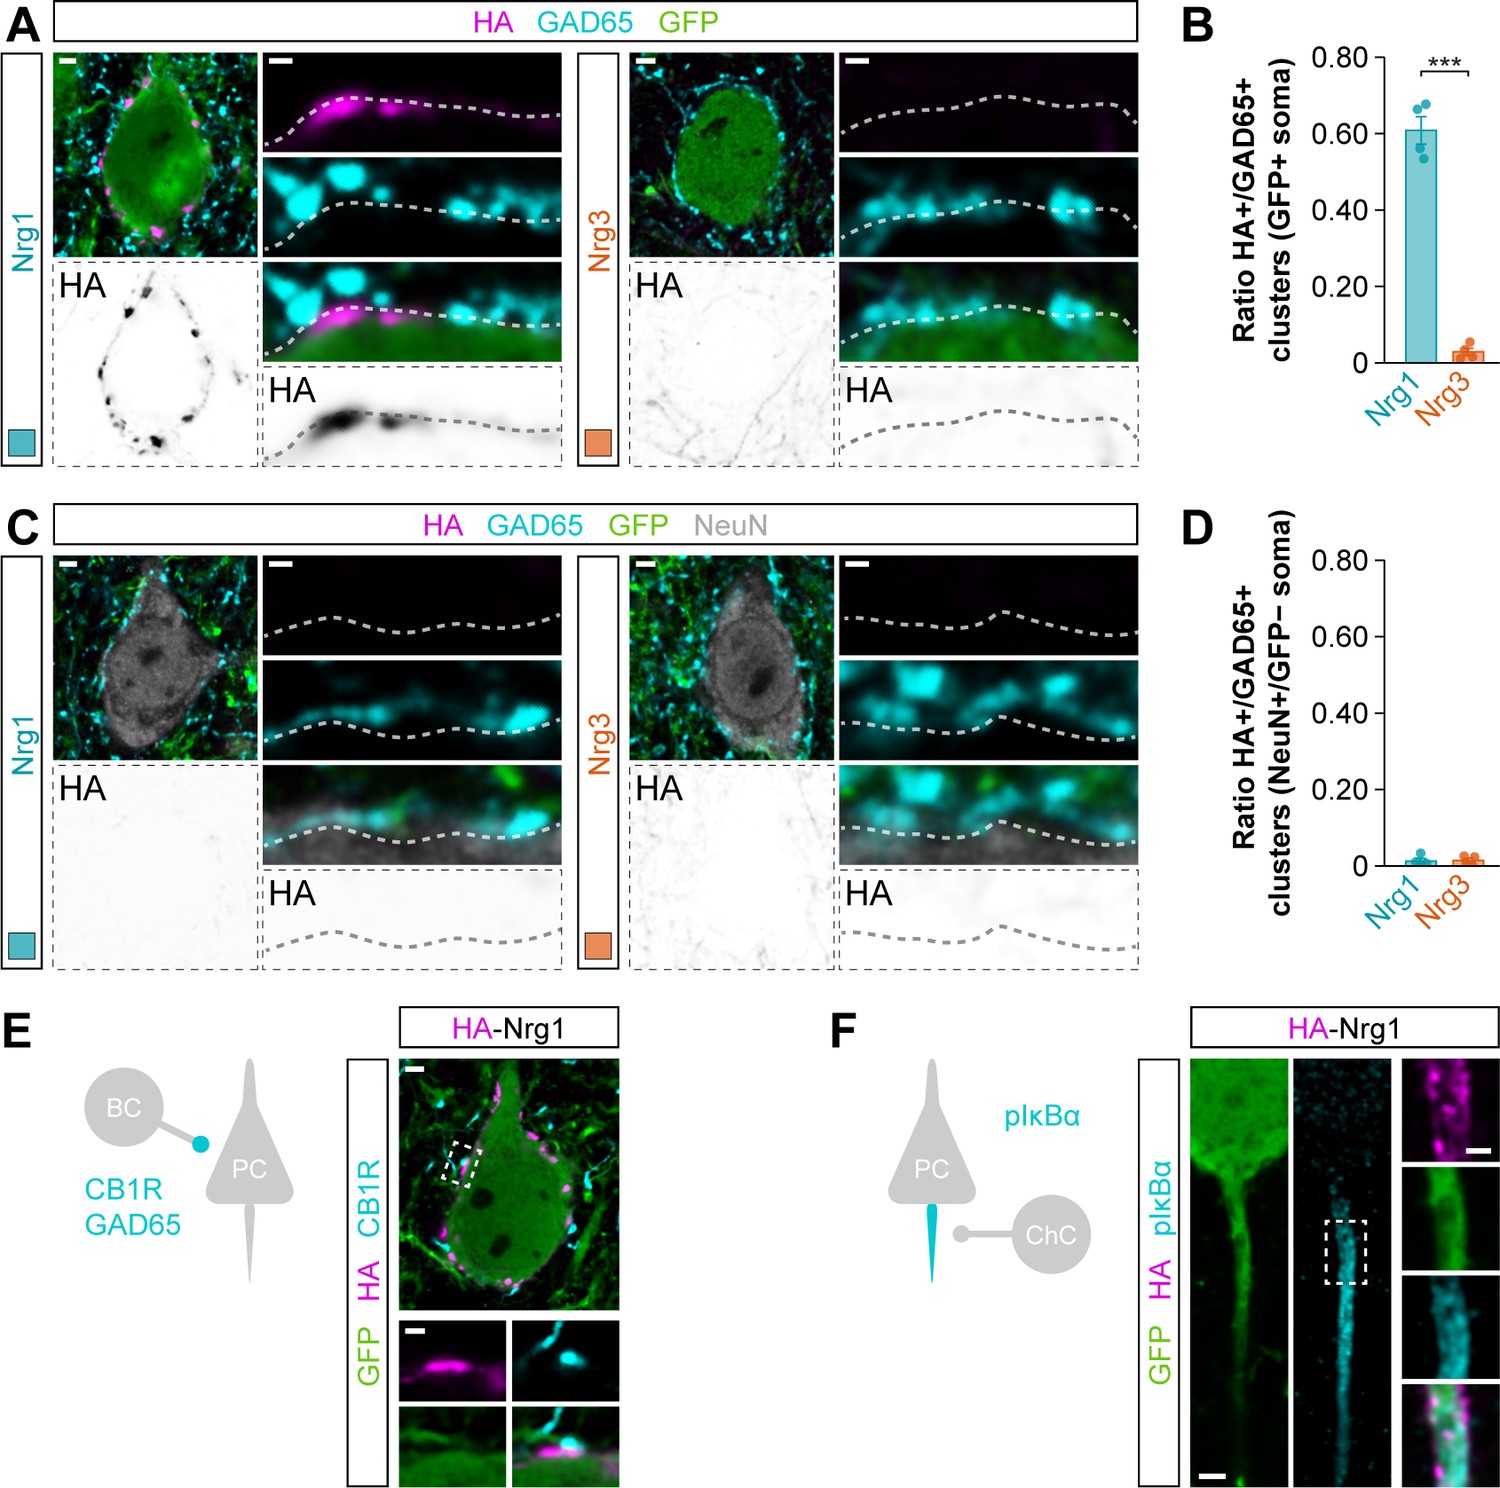
Subcellular localization and targeting of HA-tagged Nrg1 to inhibitory perisomatic inputs of cortical pyramidal cells.
(A) Co-localization of HA-tagged Nrg1 (left) and HA-tagged Nrg3 (right) (magenta) with soma-targeting GAD65+ boutons (cyan) in electroporated GFP+ pyramidal cells (green). The bottom panel depicts HA staining in a color-inverted image. The high magnification images illustrate the localization of HA-tagged neuregulins contacted by presynaptic GAD65+ boutons. (B) Quantification of the proportion of GAD65+ boutons that co-localize with HA-tagged Nrg clusters in the soma of electroporated GFP+ pyramidal cells. Two-tailed Student’s t-test: ***p<0.001; n = 4 mice (34 cells) for pSyn-Nrg1-pSyn-Gfp, n = 4 mice (32 cells) for pSyn-Nrg3-pSyn-Gfp. (C) Co-localization of HA-tagged Nrg1 (left) and HA-tagged Nrg3 (right) (magenta) with soma-targeting GAD65+ boutons (cyan) in electroporated GFP+ pyramidal cells (green). The bottom panel depicts HA staining in a color-inverted image. The high-magnification images illustrate the localization of HA-tagged neuregulins contacted by presynaptic GAD65+ boutons. (D) Quantification of the proportion of GAD65+ boutons that co-localize with HA-tagged Nrg clusters in the soma of non-electroporated NeuN+/GFP– pyramidal cells. Two-tailed Student’s t-test: p=0.861; n = 4 mice (32 cells) for pSyn-Nrg1-pSyn-Gfp, n = 4 mice (32 cells) for pSyn-Nrg3-pSyn-Gfp. (E) Nrg1+ clusters (magenta) are found in the soma of pyramidal cells (green) opposed to CB1R+ terminals (cyan) from basket cells. The schematic depicts the corresponding synapse. (F) Nrg1+ clusters (magenta) are found in the axon initial segment of pyramidal cells (green), identified by expression of pIκBα (cyan). The schematic depicts the corresponding synapse. BC, basket cell; ChC, chandelier cell; PC, pyramidal cells. Scale bars, 2 µm (A, C, E, F) and 0.5 µm (high magnifications). Data in synaptic quantifications represent mean ± s.e.m. The averages per animal and electroporation condition are shown in bar graphs. Data used for quantitative analyses are available in Figure 3—figure supplement 3—source data 1.
-
Figure 3—figure supplement 3—source data 1
Numerical data of synaptic targeting of HA-tagged neuregulin constructs in electroporated (GFP+) and non-electroporated (GFP–) pyramidal cells.
- https://cdn.elifesciences.org/articles/57000/elife-57000-fig3-figsupp3-data1-v2.xlsx
Figure 3—figure supplement 4
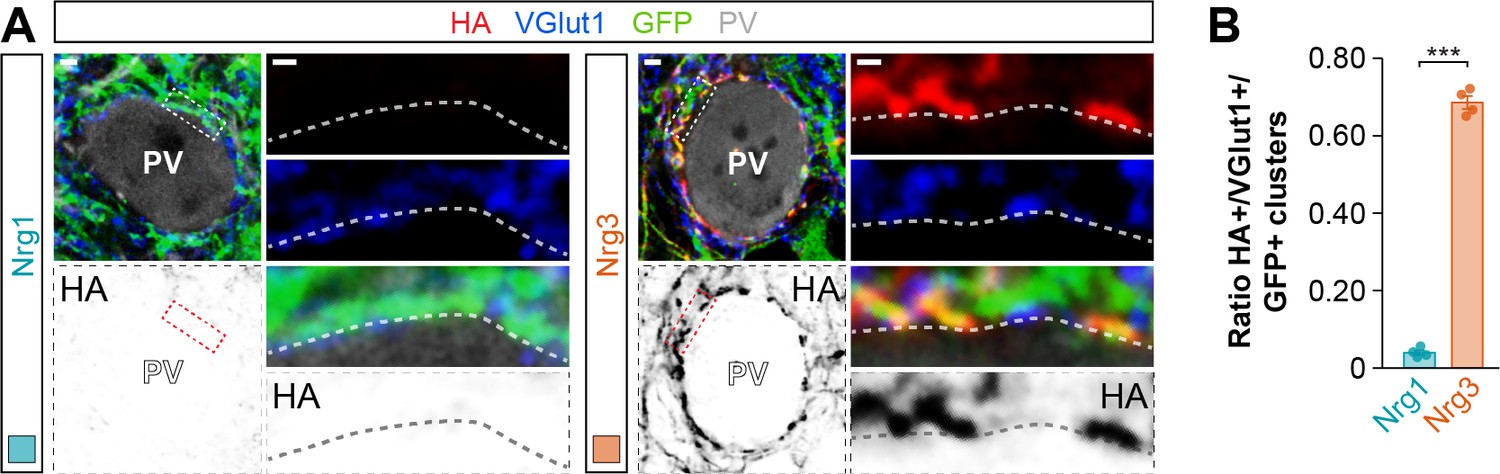
Synaptic targeting of wild-type neuregulin constructs to excitatory presynaptic boutons innervating PV+ interneurons.
(A) Co-localization of HA-tagged Nrg1 (left) and HA-tagged Nrg3 (right) (red) with presynaptic VGlut1+ boutons (blue) in GFP+ pyramidal cell axons (green) contacting PV+ interneurons. The bottom panel depicts HA staining in a color-inverted image. The high-magnification images illustrate the co-localization of HA-tagged neuregulins with excitatory VGlut1+ boutons. (B) Quantification of the proportion of VGlut1+ boutons that co-localize with HA-tagged Nrg clusters in axon terminals of electroporated GFP+ pyramidal cells. Two-tailed Student’s t-test: ***p<0.001; n = 4 mice (40 cells) for pSyn-Nrg1-pSyn-Gfp, n = 4 mice (50 cells) for pSyn-Nrg3-pSyn-Gfp. Scale bars, 2 μm (A) and 0.5 μm (high magnifications). Data in synaptic quantifications represent mean ± s.e.m. The averages per animal and electroporation condition are shown in bar graphs. Data used for quantitative analyses are available in Figure 3—figure supplement 4—source data 1.
-
Figure 3—figure supplement 4—source data 1
Numerical data of synaptic targeting of HA-tagged neuregulin constructs in axon terminals innervating PV+ interneurons.
- https://cdn.elifesciences.org/articles/57000/elife-57000-fig3-figsupp4-data1-v2.xlsx
Figure 3—figure supplement 5
Targeting of HA-tagged Nrg3 to axon terminals innervating PV+ interneurons in layer 5 of the cerebral cortex.
(A) Schematic illustrating the axonal targeting of superficial pyramidal cells onto PV+ interneurons in cortical layer 5 (L5). (B) Coronal sections through somatosensory cortex of P21 following in utero electroporation of pSyn-Nrg1-pSyn-Gfp or pSyn-Nrg3-pSyn-Gfp at E14.5. Sections were processed for immunohistochemistry against GFP (green) and HA (magenta) and counterstained with DAPI (gray). (C) Confocal images showing co-localization of GFP+ axon terminals (green) from electroporated pyramidal cells with HA-tagged Nrg1 or HA-tagged Nrg3 (red) in L5. (D) Quantification of the localization of HA-tagged neuregulin clusters in axon terminals of GFP+ pyramidal cells. Two-tailed Student’s t-test: ***p<0.001; n = 4 mice (36 ROIs) for pSyn-Nrg1-pSyn-Gfp, n = 4 mice (36 ROIs) for pSyn-Nrg3-pSyn-Gfp. (E) Co-localization of HA-tagged Nrg1 (left) and HA-tagged Nrg3 (right) (red) with presynaptic VGlut1+ boutons (blue) in GFP+ pyramidal cell axons (green) contacting PV+ interneurons (gray). The color-inverted image corresponds to HA staining and illustrates the localization of HA-tagged Nrg clusters opposed to PV+ cell bodies in L5. The high-magnification images illustrate the co-localization of HA-tagged neuregulins with excitatory VGlut1+ boutons. (F) Quantification of the proportion of VGlut1+ boutons that co-localize with HA-tagged neuregulin clusters in axon terminals of electroporated GFP+ pyramidal cells contacting L5 PV+ interneurons. Two-tailed Student’s t-test: ***p<0.001; n = 4 mice (42 cells) for pSyn-Nrg1-pSyn-Gfp, n = 4 mice (34 cells) for pSyn-Nrg3-pSyn-Gfp. Scale bars, 50 μm (B), 10 μm (C), and 2 μm (E) and 0.5 μm (high magnifications). Data from distributions of ROIs are shown as box plots, and the adjacent data points and lines represent the averages per animal and averaged mean per group, respectively. Data in synaptic quantifications represent mean ± s.e.m. The averages per animal and electroporation condition are shown in bar graphs. Data used for quantitative analyses are available in Figure 3—figure supplement 5—source data 1 and Figure 3—figure supplement 5—source data 2.
-
Figure 3—figure supplement 5—source data 1
Numerical data of neuropil colocalization of HA-tagged neuregulin constructs in layer 5.
- https://cdn.elifesciences.org/articles/57000/elife-57000-fig3-figsupp5-data1-v2.xlsx
-
Figure 3—figure supplement 5—source data 2
Numerical data of synaptic targeting of HA-tagged neuregulin constructs in axon terminals innervating PV+ interneurons in layer 5.
- https://cdn.elifesciences.org/articles/57000/elife-57000-fig3-figsupp5-data2-v2.xlsx
Figure 3—figure supplement 6
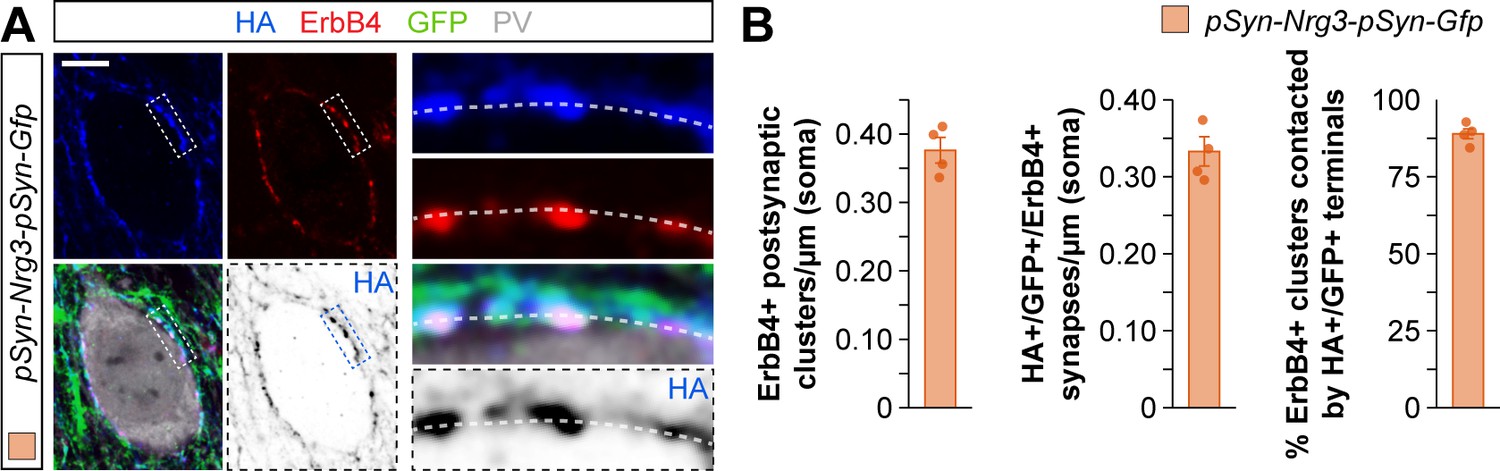
Synaptic targeting of HA-tagged Nrg3 construct to presynaptic terminals that contact ErbB4 postsynaptic clusters in PV+ interneurons.
(A) Localization of HA-tagged Nrg3 (blue) within GFP+ axon terminals (green) from pyramidal cells in close apposition to postsynaptic ErbB4+ clusters (red) of PV+ interneurons (gray). The bottom panel depicts HA staining in a color-inverted image. The high-magnification images illustrate the co-localization of HA-tagged Nrg3 with ErbB4+ clusters. (B) Quantifications of the density of ErbB4+ clusters (left) within the cell body of PV+ interneurons, the density of HA+/GFP+/ErbB4+ contacts (middle), and the proportion of ErbB4+ clusters that are contacted by HA+/GFP+ terminals (right), in superficial layers of the somatosensory cortex in electroporation experiments of a plasmid encoding for the HA-tagged Nrg3 construct. N = 4 mice (40 cells). Scale bars, 2 μm (A) and 0.5 μm (high magnifications). Data represent mean ± s.e.m. The averages per animal and electroporation condition are shown in bar graphs. Data used for quantitative analyses are available in Figure 3—figure supplement 6—source data 1.
-
Figure 3—figure supplement 6—source data 1
Numerical data of co-localization of HA-tagged Nrg3 construct and ErbB4+ clusters in PV+ interneurons.
- https://cdn.elifesciences.org/articles/57000/elife-57000-fig3-figsupp6-data1-v2.xlsx
Figure 4 with 2 supplements

Neuregulin-dependent synapse formation and localization is not specified by the EGF-like domain.
(A) Coronal sections through somatosensory cortex of P30 mice following in utero electroporation of pSyn-Nrg1EGF:Nrg3-pSyn-Gfp or pSyn-Nrg3EGF:Nrg1-pSyn-Gfp plasmids at E14.5. Sections were processed for immunohistochemistry against GFP (green) and HA (magenta) and counterstained with DAPI (gray). The high-magnification images illustrate the localization of HA-tagged neuregulins in GFP+ pyramidal cells. The bottom panel depicts HA staining in a color-inverted image. Dotted squares indicate the localization of the cells shown in the high-magnification images. The schematics illustrate the structure of chimeric neuregulins in which the EGF-like domain was swapped between Nrg1 and Nrg3. (B) Quantification of the localization of HA+ neuregulin in the soma and neuropil of GFP+ pyramidal cells. Soma: Two-tailed Student’s t-test, ***p<0.001; n = 5 mice (40 regions of interest, ROIs) for pSyn-Nrg1EGF:Nrg3-pSyn-Gfp, n = 5 mice (40 ROIs) for pSyn-Nrg3EGF:Nrg1-pSyn-Gfp. Neuropil: Two-tailed Student’s t-test, ***p<0.001; n = 5 mice (40 ROIs) for pSyn-Nrg1EGF:Nrg3-pSyn-Gfp, n = 5 mice (40 ROIs) for pSyn-Nrg3EGF:Nrg1-pSyn-Gfp. (C) Confocal images (top three panels) and binary images (bottom panel) illustrating presynaptic boutons co-labeled with GAD65 (magenta) and CB1R (cyan) innervating the soma of GFP+ pyramidal cells (gray) in EGF-like domain swapping experiments. (D) Quantification of the density of GAD65+/CB1R+ boutons contacting GFP+ pyramidal cells in gain-of-function chimera experiments. One-way ANOVA: F = 26.790, p<0.001. Tukey’s range test for post hoc comparison between control and experimental groups: for pSyn-Nrg1EGF:Nrg3-pSyn-Gfp, ***p<0.001; for pSyn-Nrg3EGF:Nrg1-pSyn-Gfp, p=0.968; n = 6 mice (120 cells) for pSyn-Gfp (control), 6 mice (110 cells) for pSyn-Nrg1EGF:Nrg3-pSyn-Gfp, 5 mice (88 cells) for pSyn-Nrg3EGF:Nrg1-pSyn-Gfp. (E) Confocal images (top three panels) and binary images (bottom panel) illustrating presynaptic VGlut1+ puncta (blue) in GFP+ axons (green) of pyramidal cells located in close apposition to PSD95+ clusters (red) in PV+ interneurons (gray) in EGF-like domain swapping experiments. (F) Quantification of the density of VGlut1+/PSD95+/GFP+ synapses contacting PV+ interneurons in gain-of-function chimera experiments. One-way ANOVA: F = 21.820, p<0.001. Tukey’s range test for post hoc comparison between control and experimental groups: for pSyn-Nrg1EGF:Nrg3-pSyn-Gfp, p=0.982, for pSyn-Nrg3EGF:Nrg1-pSyn-Gfp, ***p<0.001; n = 9 mice (167 cells) for pSyn-Gfp (control), 6 mice (94 cells) for pSyn-Nrg1EGF:Nrg3-pSyn-Gfp, 6 mice (96 cells) for pSyn-Nrg3EGF:Nrg1-pSyn-Gfp. Data from the distributions of ROIs are shown as box plots, and the adjacent data points and lines represent the averages per animal and averaged mean per group, respectively. Scale bars, 50 μm (A) and 20 μm (high magnification), and 1 μm (C, E). Data in synaptic quantifications represent mean ± s.e.m. The averages per animal and electroporation condition are represented in bar graphs, and the distributions of values per cell are shown in cumulative frequency plots. Data used for quantitative analyses are available in Figure 4—source data 1, and Figure 4—source data 2.
-
Figure 4—source data 1
Numerical data of subcellular localization in gain-of-function experiments with EGF-like domain chimeric neuregulin constructs.
- https://cdn.elifesciences.org/articles/57000/elife-57000-fig4-data1-v2.xlsx
-
Figure 4—source data 2
Numerical data of inhibitory and excitatory synapses in gain-of-function experiments with EGF-like domain chimeric neuregulin constructs.
- https://cdn.elifesciences.org/articles/57000/elife-57000-fig4-data2-v2.xlsx
Figure 4—figure supplement 1
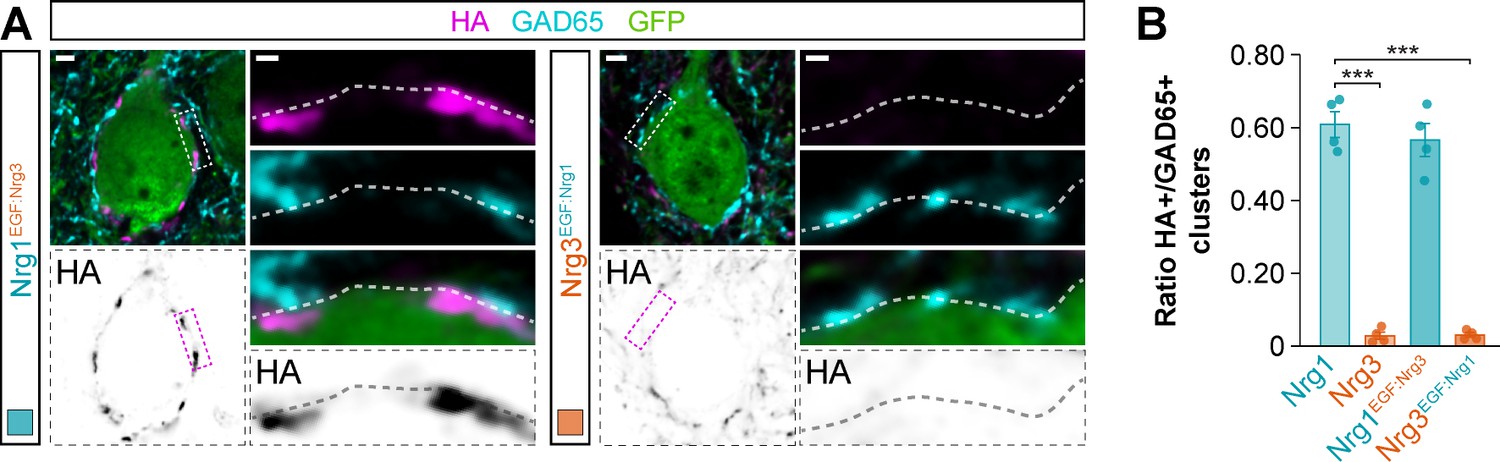
Synaptic targeting of EGF-like domain-swapping neuregulin constructs to inhibitory postsynaptic clusters in the somatic compartment of cortical pyramidal cells.
(A) Co-localization of HA-tagged chimeric Nrg1EGF:Nrg3 (left) and HA-tagged chimeric Nrg3EGF:Nrg1 (right) (magenta) with soma-targeting GAD65+ boutons (cyan) in electroporated GFP+ pyramidal cells (green). The bottom panel depicts HA staining in a color-inverted image. The high-magnification images illustrate the localization of HA-tagged neuregulins contacted by presynaptic GAD65+ boutons. (B) Quantification of the proportion of GAD65+ boutons that co-localize with HA-tagged Nrg clusters in the soma of electroporated GFP+ pyramidal cells. Tukey’s range test for post hoc comparison between wild-type Nrg1 construct and chimeric Nrg constructs: p=0.745, n = 4 mice (32 cells) for pSyn-Nrg1EGF:Nrg3-pSyn-Gfp; ***p<0.001, n = 4 mice (32 cells) for pSyn-Nrg3EGF:Nrg1-pSyn-Gfp; ***p<0.001, for comparison between chimeric Nrg constructs. Note that data for Nrg1 and Nrg3 wild-type constructs is the same data shown in Figure 3—figure supplement 3B. Scale bars, 2 μm (A) and 0.5 μm (high magnifications). Data in synaptic quantifications represent mean ± s.e.m. The averages per animal and electroporation condition are shown in bar graphs. Data used for quantitative analyses are available in Figure 4—figure supplement 1—source data 1.
-
Figure 4—figure supplement 1—source data 1
Numerical data of synaptic targeting of EGF-like domain chimeric neuregulin constructs in GFP+ electroporated pyramidal cells.
- https://cdn.elifesciences.org/articles/57000/elife-57000-fig4-figsupp1-data1-v2.xlsx
Figure 4—figure supplement 2
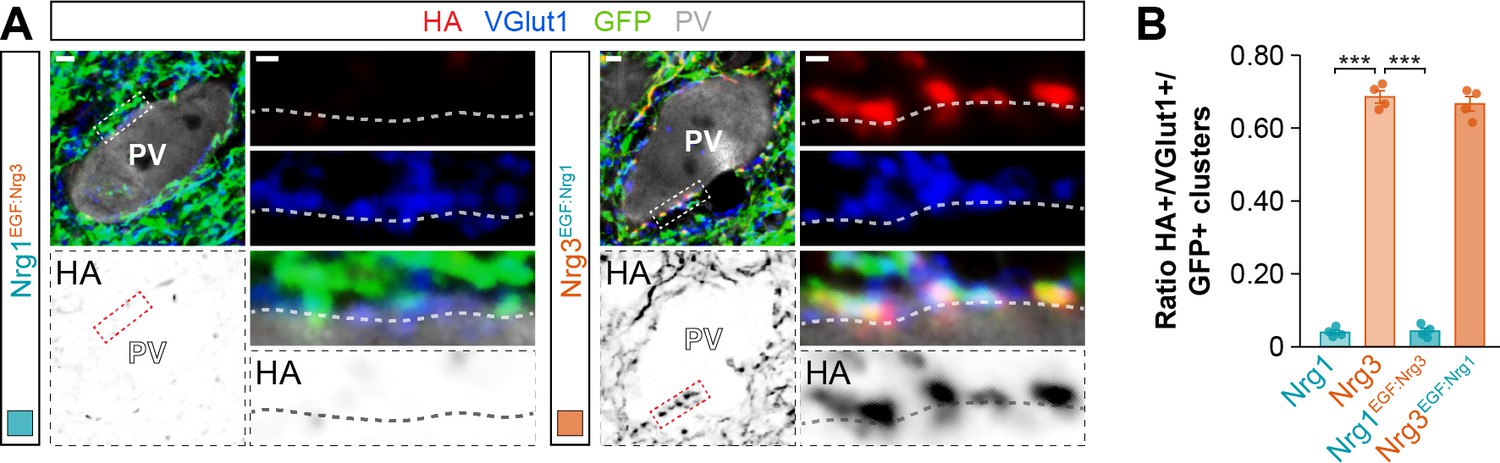
Targeting of EGF-like domain-swapping neuregulin constructs to excitatory presynaptic boutons innervating PV+ interneurons.
(A) Co-localization of HA-tagged chimeric Nrg1EGF:Nrg3 (left) and HA-tagged chimeric Nrg3EGF:Nrg1 (red) with presynaptic VGlut1+ boutons (blue) in GFP+ pyramidal cell axons (green) contacting PV+ interneurons (gray). The bottom panel depicts HA staining in a color-inverted image. The high-magnification images illustrate the co-localization of HA-tagged neuregulins with excitatory VGlut1+ boutons. (B) Quantification of the proportion of VGlut1+ boutons that co-localize with HA-tagged Nrg clusters in axon terminals of electroporated GFP+ pyramidal cells. Tukey’s range test for post hoc comparison between wild-type Nrg3 construct and chimeric Nrg constructs: ***p<0.001, n = 4 mice (42 cells) for pSyn-Nrg1EGF:Nrg3-pSyn-Gfp; p=0.775, n = 4 mice (39 cells) for pSyn-Nrg3EGF:Nrg1-pSyn-Gfp; ***p<0.001, for comparison between chimeric Nrg constructs. Note that data for Nrg1 and Nrg3 wild-type constructs is the same data shown in Figure 3—figure supplement 4B. Scale bars, 2 μm (A) and 0.5 μm (high magnifications). Data in synaptic quantifications represent mean ± s.e.m. The averages per animal and electroporation condition are shown in bar graphs. Data used for quantitative analyses are available in Figure 4—figure supplement 2—source data 1.
-
Figure 4—figure supplement 2—source data 1
Numerical data of synaptic targeting of EGF-like domain chimeric neuregulin constructs in axon terminals innervating PV+ interneurons.
- https://cdn.elifesciences.org/articles/57000/elife-57000-fig4-figsupp2-data1-v2.xlsx
Figure 5 with 3 supplements
The C-terminal domain of Nrg1 and Nrg3 determines subcellular sorting to input and output synapses in pyramidal cells.
(A) Coronal sections through somatosensory cortex of P30 mice following in utero electroporation of pSyn-Nrg1Ct:Nrg3-pSyn-Gfp or pSyn-Nrg3Ct:Nrg1-pSyn-Gfp plasmids at E14.5. Sections were processed for immunohistochemistry against GFP (green) and HA (magenta) and counterstained with DAPI (gray). The high-magnification images illustrate the localization of HA-tagged neuregulins in GFP+ pyramidal cells. The bottom panel depicts HA staining in a color-inverted image. Dotted squares indicate the localization of the cells shown in the high-magnification images. The schematics illustrate the structure of chimeric neuregulins in which the intracellular, C-terminal domain was swapped between Nrg1 and Nrg3. (B) Quantification of the localization of HA+ neuregulin in the soma and neuropil of GFP+ pyramidal cells. Soma: Two-tailed Student’s t-test, ***p<0.001; n = 5 mice (40 regions of interest, ROIs) for pSyn-Nrg1Ct:Nrg3-pSyn-Gfp, n = 5 mice (40 ROIs) for pSyn-Nrg3Ct:Nrg1-pSyn-Gfp. Neuropil: Two-tailed Student’s t-test, *p<0.05; n = 5 mice (40 ROIs) for pSyn-Nrg1Ct:Nrg3-pSyn-Gfp, n = 5 mice (40 ROIs) for pSyn-Nrg3Ct:Nrg1-pSyn-Gfp. (C) Confocal images (top three panels) and binary images (bottom panel) illustrating presynaptic boutons co-labeled with GAD65 (magenta) and CB1R (cyan) innervating the soma of GFP+ pyramidal cells (gray) in C-terminal domain swapping experiments. (D) Quantification of the density of GAD65+/CB1R+ boutons contacting GFP+ pyramidal cells in gain-of-function chimera experiments. One-way ANOVA: F = 15.640, p<0.001. Tukey’s range test for post hoc comparison between control and experimental groups: for pSyn-Nrg1Ct:Nrg3-pSyn-Gfp, p=0.632; for pSyn-Nrg3Ct:Nrg1-pSyn-Gfp, ***p<0.001; n = 6 mice (120 cells) for pSyn-Gfp (control), 6 mice (136 cells) for pSyn-Nrg1Ct:Nrg3-pSyn-Gfp, 6 mice (127 cells) for pSyn-Nrg3Ct:Nrg1-pSyn-Gfp. (E) Confocal images (top three panels) and binary images (bottom panel) illustrating presynaptic VGlut1+ puncta (blue) in GFP+ axons (green) of pyramidal cells located in close apposition to PSD95+ clusters (red) in PV+ interneurons (gray) in C-terminal domain swapping experiments. (F) Quantification of the density of VGlut1+/PSD95+/GFP+ synapses contacting PV+ interneurons in gain-of-function chimera experiments. One-way ANOVA: F = 0.679, p=0.519. Tukey’s range test for post hoc comparison between control and experimental groups: for pSyn-Nrg1Ct:Nrg3-pSyn-Gfp, p=0.489, for pSyn-Nrg3Ct:Nrg1-pSyn-Gfp, p=0.909; n = 9 mice (167 cells) for pSyn-Gfp (control), 7 mice (121 cells) for pSyn-Nrg1Ct:Nrg3-pSyn-Gfp, 7 mice (135 cells) for pSyn-Nrg3Ct:Nrg1-pSyn-Gfp. Scale bars, 50 μm (A) and 20 μm (high magnification), and 1 μm (C, E). Data from the distributions of ROIs are shown as box plots, and the adjacent data points and lines represent the averages per animal and averaged mean per group, respectively. Data in synaptic quantifications represent mean ± s.e.m. The averages per animal and electroporation condition are represented in bar graphs, and the distributions of values per cell are shown in cumulative frequency plots. Data used for quantitative analyses are available in Figure 5—source data 1, and Figure 5—source data 2.
-
Figure 5—source data 1
Numerical data of subcellular localization in gain-of-function experiments with C-terminal domain chimeric neuregulin constructs.
- https://cdn.elifesciences.org/articles/57000/elife-57000-fig5-data1-v2.xlsx
-
Figure 5—source data 2
Numerical data of inhibitory and excitatory synapses in gain-of-function experiments with C-terminal domain chimeric neuregulin constructs.
- https://cdn.elifesciences.org/articles/57000/elife-57000-fig5-data2-v2.xlsx
Figure 5—figure supplement 1
Comparison of amino acid sequences of the EGF-like domain and the C-terminal domains of Nrg1 and Nrg3.
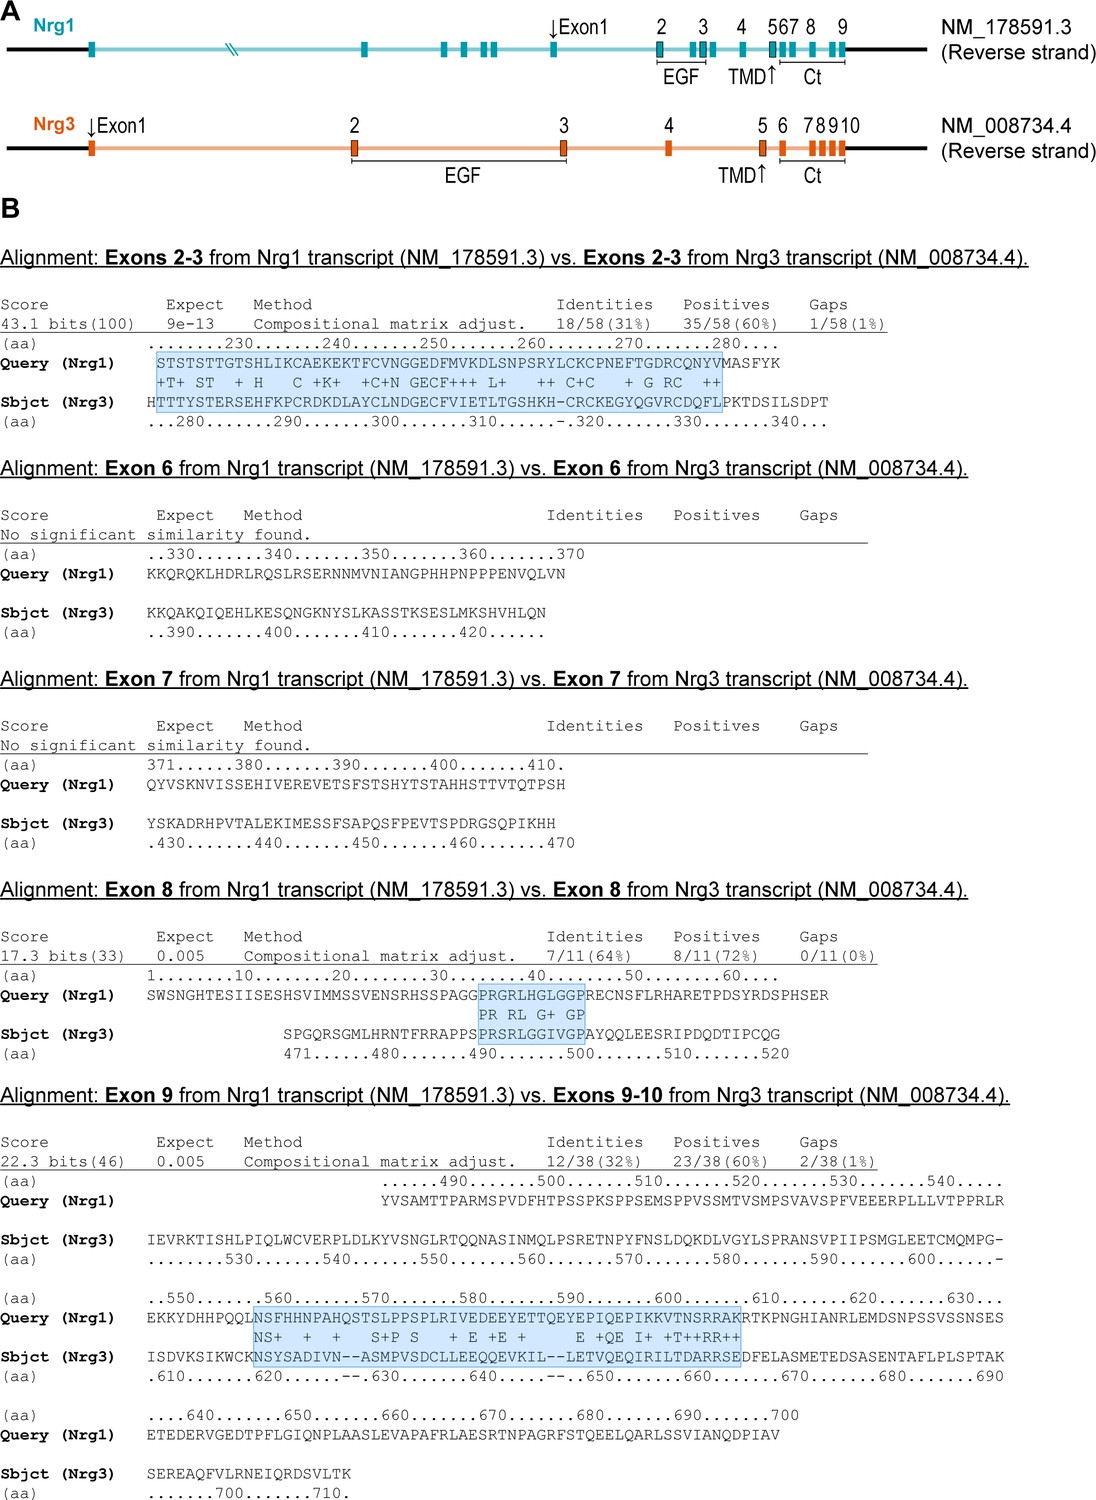
(A) Schematic representation of genomic sequences for Nrg1 and Nrg3 loci. Numbers correspond to exons. The specific gene isoform for Nrg1 and Nrg3 are indicated (right). (B) Sequence alignments of Nrg1 and Nrg3 for exons 2–3, which correspond to the EGF-like domain, and exons 6–10, which correspond to the C-terminal domain. Ct: C-terminal domain; EGF: EGF-like domain; TMD: transmembrane domain.
Figure 5—figure supplement 2
Targeting of C-terminal domain-swapping neuregulin constructs to excitatory presynaptic boutons innervating PV+ interneurons.
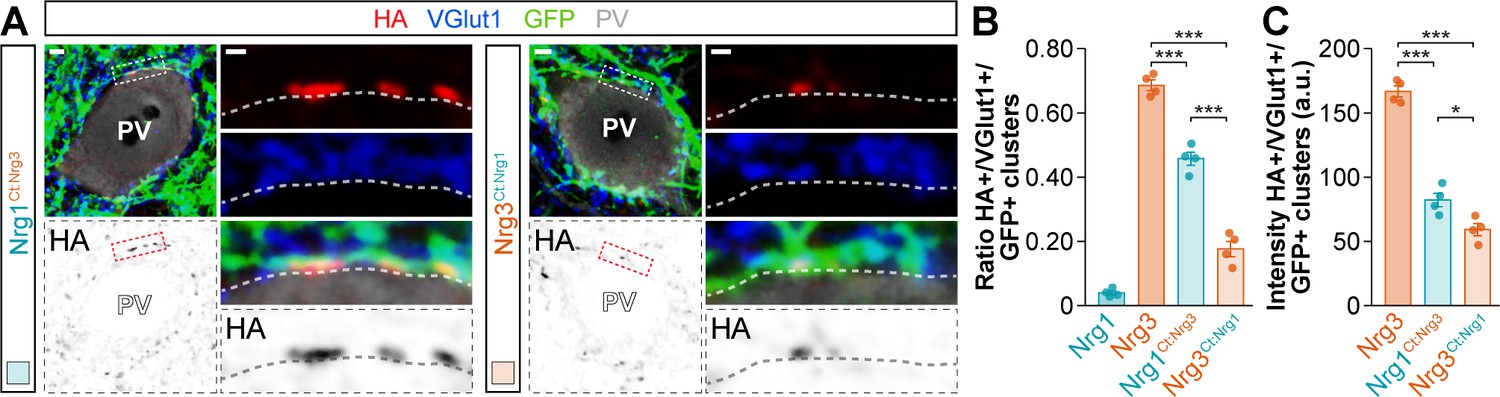
(A) Co-localization of HA-tagged chimeric Nrg1EGF:Nrg3 (left) and HA-tagged chimeric Nrg3EGF:Nrg1 (right) (red) with presynaptic VGlut1+ boutons (blue) in GFP+ pyramidal cell axons (green) contacting PV+ interneurons (gray). The bottom panel depicts HA staining in a color-inverted image. The high-magnification images illustrate the co-localization of HA-tagged neuregulins with excitatory VGlut1+ boutons. (B) Quantification of the proportion of VGlut1+ boutons that co-localize with HA-tagged Nrg clusters in axon terminals of electroporated GFP+ pyramidal cells. Tukey’s range test for post hoc comparison between wild-type Nrg3 construct and chimeric Nrg constructs: ***p<0.001, n = 4 mice (50 cells) for pSyn-Nrg1Ct:Nrg3-pSyn-Gfp; ***p<0.001, n = 4 mice (42 cells) for pSyn-Nrg3Ct:Nrg1-pSyn-Gfp; ***p<0.001, for comparison between chimeric Nrg constructs. Note that data for Nrg1 and Nrg3 wild-type constructs is the same data shown in Figure 3—figure supplement 4B. (C) Quantification of the intensity of HA+ clusters within VGlut1+/GFP+ terminals innervating cortical PV+ interneurons. Tukey’s range test for post hoc comparison between wild-type Nrg3 construct and chimeric Nrg constructs: ***p<0.001, n = 4 mice (50 cells) for pSyn-Nrg1Ct:Nrg3-pSyn-Gfp; ***p<0.001, n = 4 mice (42 cells) for pSyn-Nrg3Ct:Nrg1-pSyn-Gfp; *p<0.05, for comparison between chimeric Nrg constructs. Scale bars, 2 μm (A) and 0.5 μm (high magnifications). Data in synaptic quantifications represent mean ± s.e.m. The averages per animal and electroporation condition are shown in bar graphs. Data used for quantitative analyses are available in Figure 5—figure supplement 2—source data 1.
-
Figure 5—figure supplement 2—source data 1
Numerical data of synaptic targeting of C-terminal domain chimeric neuregulin constructs in axon terminals innervating PV+ interneurons.
- https://cdn.elifesciences.org/articles/57000/elife-57000-fig5-figsupp2-data1-v2.xlsx
Figure 5—figure supplement 3
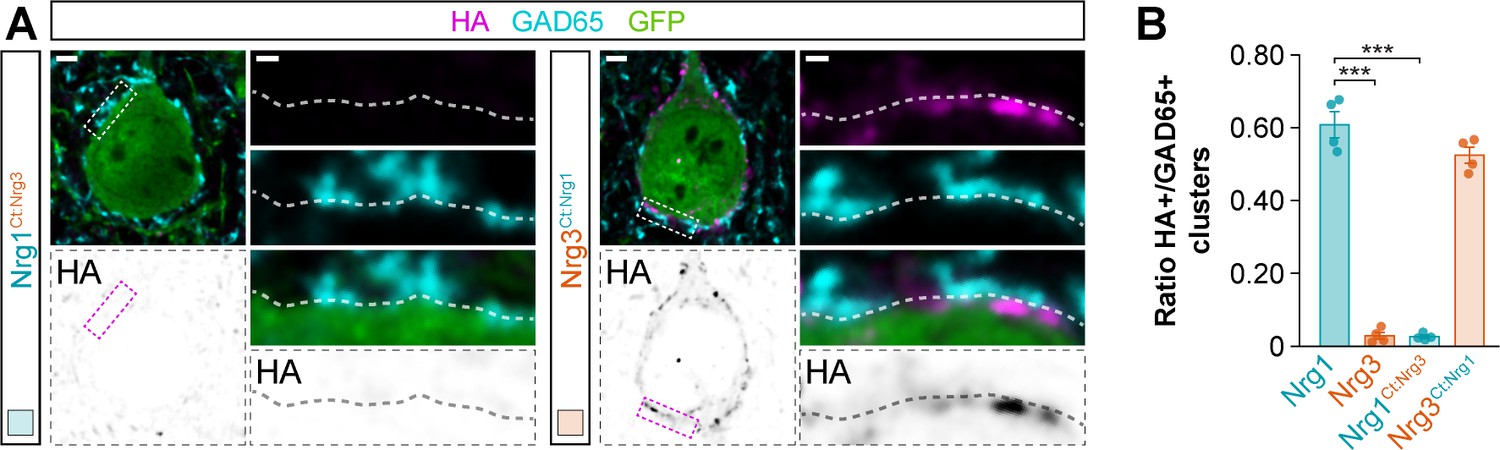
Synaptic targeting of C-terminal domain-swapping neuregulin constructs to inhibitory postsynaptic clusters in the somatic compartment of cortical pyramidal cells.
(A) Co-localization of HA-tagged chimeric Nrg1Ct:Nrg3 (left) and HA-tagged chimeric Nrg3Ct:Nrg1 (right) (magenta) with soma-targeting GAD65+ boutons (cyan) in electroporated GFP+ pyramidal cells (green). The bottom panel depicts HA staining in a color-inverted image. The high-magnification images illustrate the localization of HA-tagged neuregulins contacted by presynaptic GAD65+ boutons. (B) Quantification of the proportion of GAD65+ boutons that co-localize with HA-tagged Nrg clusters in the soma of electroporated GFP+ pyramidal cells. Tukey’s range test for post hoc comparison between wild-type Nrg1 construct and chimeric Nrg constructs: ***p<0.001, n = 4 mice (32 cells) for pSyn-Nrg1Ct:Nrg3-pSyn-Gfp; p=0.077, n = 4 mice (34 cells) for pSyn-Nrg3Ct:Nrg1-pSyn-Gfp; ***p<0.001, for comparison between chimeric Nrg constructs. Note that data for Nrg1 and Nrg3 wild-type constructs is the same data shown in Figure 3—figure supplement 3B. Scale bars, 2 μm (A) and 0.5 μm (high magnifications). Data in synaptic quantifications represent mean ± s.e.m. The averages per animal and electroporation condition are shown in bar graphs. Data used for quantitative analyses are available in Figure 5—figure supplement 3—source data 1.
-
Figure 5—figure supplement 3—source data 1
Numerical data of synaptic targeting of C-terminal domain chimeric neuregulin constructs in GFP+ electroporated pyramidal cells.
- https://cdn.elifesciences.org/articles/57000/elife-57000-fig5-figsupp3-data1-v2.xlsx
Figure 6 with 2 supplements
Subcellular segregation of neuregulins is encoded in the C-terminal domain.
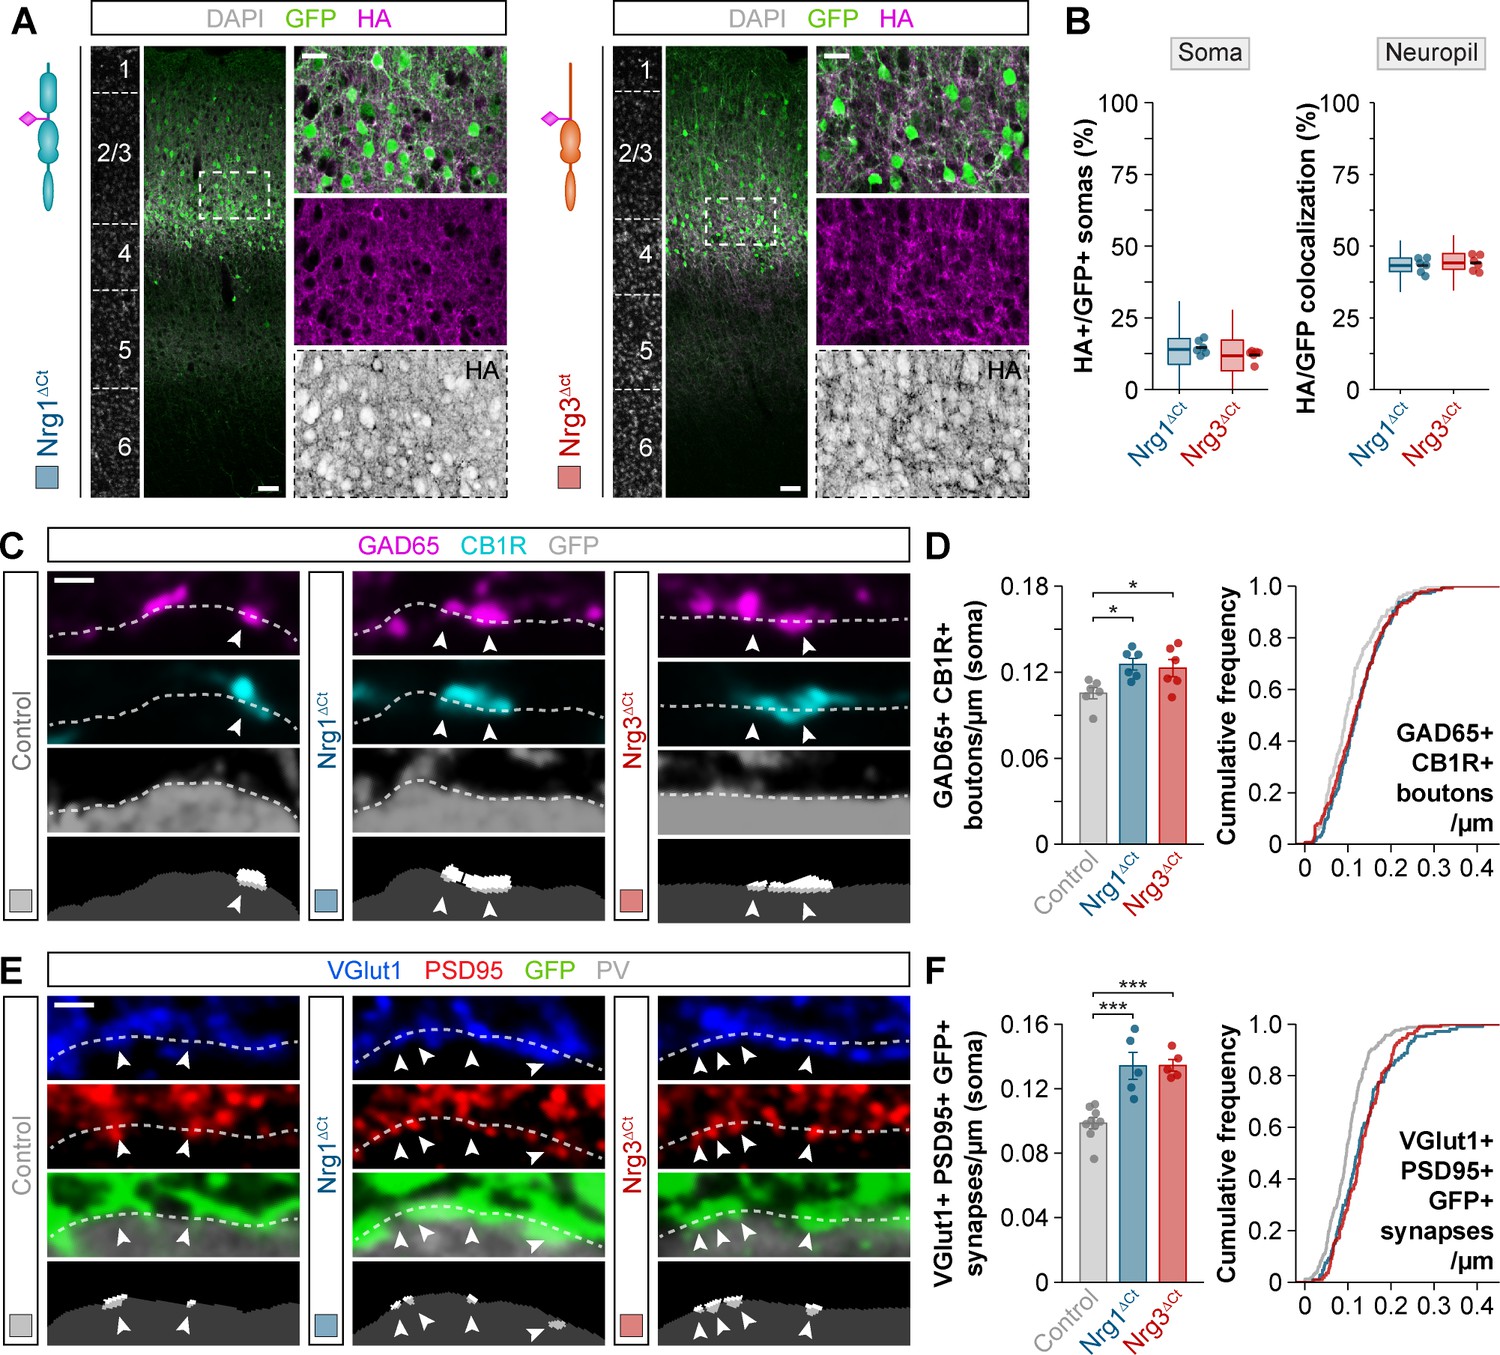
(A) Coronal sections through somatosensory cortex of P30 mice following in utero electroporation of pSyn-Nrg1ΔCt-pSyn-Gfp or pSyn-Nrg3ΔCt-pSyn-Gfp plasmids at E14.5. Sections were processed for immunohistochemistry against GFP (green) and HA (magenta) and counterstained with DAPI (gray). The high-magnification images illustrate the localization of HA-tagged neuregulins in GFP+ pyramidal cells. The bottom panel depicts HA staining in a color-inverted image. Dotted squares indicate the localization of the cells shown in the high-magnification images. The schematics illustrate the structure of truncated neuregulins in which the C-terminal domain was removed. (B) Quantification of the localization of HA+ neuregulin in the soma and neuropil of GFP+ pyramidal cells. Soma: Mann-Whitney U-test, p=0.093; n = 6 mice (66 regions of interest, ROIs) for pSyn-Nrg1ΔCt-pSyn-Gfp, n = 6 mice (66 ROIs) for pSyn-Nrg3ΔCt-pSyn-Gfp. Neuropil: Two-tailed Student’s t-test, p=0.589; n = 6 mice (58 ROIs) for pSyn-Nrg1ΔCt-pSyn-Gfp, n = 6 mice (58 ROIs) for pSyn-Nrg1ΔCt-pSyn-Gfp. (C) Confocal images (top three panels) and binary images (bottom panel) illustrating presynaptic boutons co-labeled with GAD65 (magenta) and CB1R (cyan) innervating the soma of GFP+ pyramidal cells (gray) in C-terminal domain deletion experiments. (D) Quantification of the density of GAD65+/CB1R+ boutons contacting GFP+ pyramidal cells in gain-of-function truncation experiments. One-way ANOVA: F = 5.325, p<0.05. Tukey’s range test for post hoc comparison between control and experimental groups: for pSyn-Nrg1ΔCt-pSyn-Gfp, *p<0.05; for pSyn-Nrg3ΔCt-pSyn-Gfp, *p<0.05; n = 6 mice (120 cells) for pSyn-Gfp (control), six mice (145 cells) for pSyn-Nrg1ΔCt-pSyn-Gfp, six mice (138 cells) for pSyn-Nrg3ΔCt-pSyn-Gfp. (E) Confocal images (top three panels) and binary images (bottom panel) illustrating presynaptic VGlut1+ puncta (blue) in GFP+ axons (green) of pyramidal cells located in close apposition to PSD95+ clusters (red) in PV+ interneurons (gray) in C-terminal domain deletion experiments. (F) Quantification of the density of VGlut1+/PSD95+/GFP+ synapses contacting PV+ interneurons in gain-of-function truncation experiments. One-way ANOVA: F = 19.500, p<0.001. Tukey’s range test for post hoc comparison between control and experimental groups: for pSyn-Nrg1ΔCt-pSyn-Gfp, ***p<0.001, for pSyn-Nrg3ΔCt-pSyn-Gfp, ***p<0.001; n = 9 mice (167 cells) for pSyn-Gfp (control), 5 mice (107 cells) for pSyn-Nrg1ΔCt-pSyn-Gfp, 5 mice (111 cells) for pSyn-Nrg3ΔCt-pSyn-Gfp. Scale bars, 50 μm (A) and 20 μm (high magnification), and 1 μm (C, E). Data from the distributions of ROIs are shown as box plots, and the adjacent data points and lines represent the averages per animal and averaged mean per group, respectively. Data in synaptic quantifications represent mean ± s.e.m. The averages per animal and electroporation condition are represented in bar graphs, and the distributions of values per cell are shown in cumulative frequency plots. Data used for quantitative analyses are available in Figure 6—source data 1, and Figure 6—source data 2.
-
Figure 6—source data 1
Numerical data of subcellular localization in gain-of-function experiments with C-terminal domain truncated neuregulin constructs.
- https://cdn.elifesciences.org/articles/57000/elife-57000-fig6-data1-v2.xlsx
-
Figure 6—source data 2
Numerical data of inhibitory and excitatory synapses in gain-of-function experiments with C-terminal domain truncated neuregulin constructs.
- https://cdn.elifesciences.org/articles/57000/elife-57000-fig6-data2-v2.xlsx
Figure 6—figure supplement 1
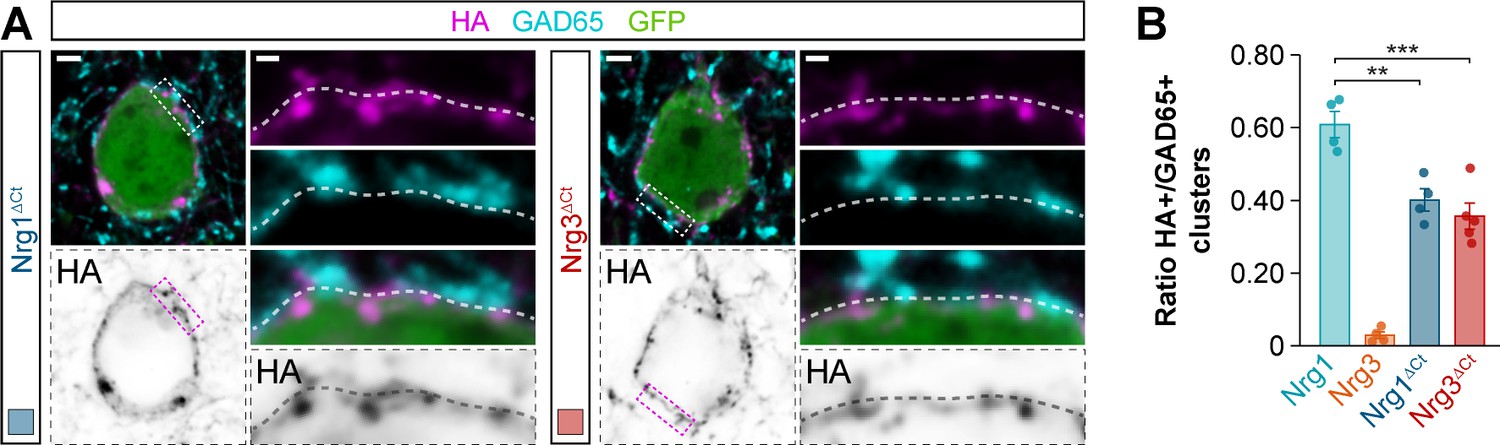
Synaptic targeting of C-terminal domain-lacking neuregulin constructs to inhibitory postsynaptic clusters in the somatic compartment of cortical pyramidal cells.
(A) Co-localization of HA-tagged truncated Nrg1ΔCt (left) and HA-tagged truncated Nrg3ΔCt (right) (magenta) with soma-targeting GAD65+ boutons (cyan) in electroporated GFP+ pyramidal cells (green). The bottom panel depicts HA staining in a color-inverted image. The high-magnification images illustrate the localization of HA-tagged neuregulins contacted by presynaptic GAD65+ boutons. (B) Quantification of the proportion of GAD65+ boutons that co-localize with HA-tagged Nrg clusters in the soma of electroporated GFP+ pyramidal cells. Tukey’s range test for post hoc comparison between wild-type Nrg1 construct and chimeric Nrg constructs: **p<0.01, n = 4 mice (34 cells) for pSyn-Nrg1ΔCt-pSyn-Gfp; ***p<0.001, n = 5 mice (43 cells) for pSyn-Nrg3ΔCt-pSyn-Gfp; p=0.739, for comparison between chimeric Nrg constructs. Note that data for Nrg1 and Nrg3 wild-type constructs is the same data shown in Figure 3—figure supplement 3B. Scale bars, 2 μm (A) and 0.5 μm (high magnifications). Data in synaptic quantifications represent mean ± s.e.m. The averages per animal and electroporation condition are shown in bar graphs. Data used for quantitative analyses are available in Figure 6—figure supplement 1—source data 1.
-
Figure 6—figure supplement 1—source data 1
Numerical data of synaptic targeting of C-terminal domain truncated neuregulin constructs in GFP+ electroporated pyramidal cells.
- https://cdn.elifesciences.org/articles/57000/elife-57000-fig6-figsupp1-data1-v2.xlsx
Figure 6—figure supplement 2
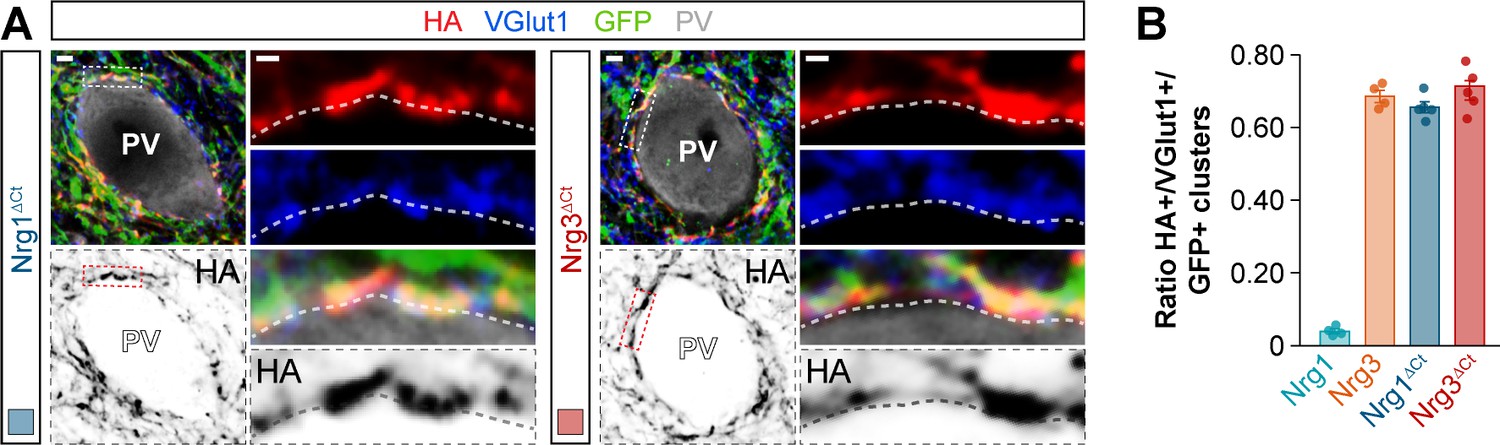
Targeting of C-terminal domain-lacking neuregulin constructs to excitatory presynaptic boutons innervating PV+ interneurons.
(A) Co-localization of HA-tagged truncated Nrg1ΔCt (left) and HA-tagged truncated Nrg3ΔCt (right) (red) with presynaptic VGlut1+ boutons (blue) in GFP+ pyramidal cell axons (green) contacting PV+ interneurons (gray). The bottom panel depicts HA staining in a color-inverted image. The high-magnification images illustrate the co-localization of HA-tagged neuregulins with excitatory VGlut1+ boutons. (B) Quantification of the proportion of VGlut1+ boutons that co-localize with HA-tagged Nrg clusters in axon terminals of electroporated GFP+ pyramidal cells. Tukey’s range test for post hoc comparison between wild-type Nrg3 construct and chimeric Nrg constructs: p=0.689, n = 5 mice (38 cells) for pSyn-Nrg1ΔCt-pSyn-Gfp; p=0.928, n = 5 mice (36 cells) for pSyn-Nrg3ΔCt-pSyn-Gfp; p=0.304, for comparison between chimeric Nrg constructs. Note that data for Nrg1 and Nrg3 wild-type constructs is the same data shown in Figure 3—figure supplement 4B. Scale bars, 2 μm (A) and 0.5 μm (high magnifications). Data in synaptic quantifications represent mean ± s.e.m. The averages per animal and electroporation condition are shown in bar graphs. Data used for quantitative analyses are available in Figure 6—figure supplement 2—source data 1.
-
Figure 6—figure supplement 2—source data 1
Numerical data of synaptic targeting of C-terminal domain truncated neuregulin constructs in axon terminals innervating PV+ interneurons.
- https://cdn.elifesciences.org/articles/57000/elife-57000-fig6-figsupp2-data1-v2.xlsx
Tables
Key resources table
| Reagent type (species) or resource | Designation | Source or reference | Identifiers | Additional information |
|---|---|---|---|---|
| Antibody | Anti-Parvalbumin (polyclonal chicken) | Synaptic Systems | Cat# 195 006, RRID:AB_2619887 | IHC(1:500) |
| Antibody | Anti-CB1 (polyclonal goat) | Frontier Institute | Cat# CB1-Go-Af450, RRID:AB_2571592 | IHC(1:400) |
| Antibody | Anti-Nrg3 (polyclonal goat) | Neuromics | Cat# GT15220 | IHC(1:500) |
| Antibody | Anti-VGlut1 (polyclonal guinea pig) | Merck Millipore | Cat# AB5905, RRID:AB_2301751 | IHC(1:2000) |
| Antibody | Anti-GAD65 (monoclonal mouse, IgG2a) | Merck Millipore | Cat# MAB351R, RRID:AB_94905 | IHC(1:500) |
| Antibody | Anti-GAD67 (monoclonal mouse, IgG2a) | Merck Millipore | Cat# MAB5406, RRID:AB_2278725 | IHC(1:500) |
| Antibody | Anti-Gephyrin (monoclonal mouse, IgG1) | Synaptic Systems | Cat# 147 011, RRID:AB_887717 | IHC(1:500) |
| Antibody | Anti-HA (monoclonal mouse, IgG1) | BioLegend | Cat# 901502, RRID:AB_2565007 | IHC(1:500) |
| Antibody | Anti-PSD95 (monoclonal mouse, IgG2a) | NeuroMab | Cat# 70–028, RRID:AB_2307331 | IHC(1:500) |
| Antibody | Anti-Synaptotagmin-2 (monoclonal mouse, IgG2a) | ZFIN | Cat# ZDB-ATB-081002–25, RRID:AB_10013783 | IHC(1:250) |
| Antibody | Anti-DsRed (polyclonal rabbit) | Clontech, Takara Bio | Cat# 632496, RRID:AB_10013483 | IHC(1:500) |
| Antibody | Anti-HA (polyclonal rabbit) | Cell Signaling Technology | Cat# 3724, RRID:AB_1549585 | IHC(1:500) |
| Antibody | Anti-Nrg1 (polyclonal rabbit) | Abcam | Cat# ab23248, RRID:AB_2154667 | IHC(1:500) |
| Antibody | Anti-Parvalbumin (polyclonal rabbit) | Swant | Cat# PV27, RRID:AB_2631173 | IHC(1:2000) |
| Antibody | Anti-pIκBα (polyclonal rabbit) | Cell Signaling Technology | Cat# 2859, RRID:AB_561111 | IHC(1:200) |
| Antibody | Anti-chicken-DyLight 405 (donkey) | Jackson Immuno Research Europe Ltd. | Cat# 703-475-155, RRID:AB_2340373 | IHC(1:200) |
| Antibody | Anti-guinea pig-647 (donkey) | Jackson Immuno Research Europe Ltd. | Cat# 706-605-148, RRID:AB_2340476 | IHC(1:250) |
| Antibody | Anti-goat-Alexa 647 (donkey) | Molecular Probes | Cat# A-21447, RRID:AB_2535864 | IHC(1:400) |
| Antibody | Anti-mouse-Alexa 488 (donkey) | Molecular Probes | Cat# A-21202, RRID:AB_141607 | IHC(1:200) |
| Antibody | Anti-rabbit-Alexa 647 (donkey) | Molecular Probes | Cat# A-31573, RRID:AB_2536183 | IHC(1:500) |
| Antibody | Anti-rabbit-Cy3 (donkey) | Jackson Immuno Research Europe Ltd. | Cat# 711-165-152, RRID:AB_2307443 | IHC(1:500) |
| Antibody | Anti-chicken-Alexa 488 (goat) | Molecular Probes | Cat# A-11039, RRID:AB_2534096 | IHC(1:600) |
| Antibody | Anti-mouse IgG1-Alexa 488 (goat) | Molecular Probes | Cat# A-21121, RRID:AB_2535764 | IHC(1:500) |
| Antibody | Anti-mouse IgG1-Alexa 555 (goat) | Molecular Probes | Cat# A-21127, RRID:AB_2535769 | IHC(1:500) |
| Antibody | Anti-mouse IgG1-Alexa 647 (goat) | Molecular Probes | Cat# A-21240, RRID:AB_2535809 | IHC(1:500) |
| Antibody | Anti-mouse IgG2a-Alexa 647 (goat) | Molecular Probes | Cat# A-21241, RRID:AB_2535810 | IHC(1:500) |
| Antibody | Biotinylated anti-rabbit (goat) | Vector Laboratories | Cat# BA-1000, RRID:AB_2313606 | IHC(1:200) |
| Antibody | Biotinylated anti-rat (goat) | Vector Laboratories | Cat# BA-9400, RRID:AB_2336202 | IHC(1:200) |
| Antibody | Biotinylated anti-mouse (horse) | Vector Laboratories | Cat# BA-2000, RRID:AB_2313581 | IHC(1:200) |
| Antibody | Biotinylated anti-mouse IgG1 (rat) | BioLegend | Cat# 406603, RRID:AB_315062 | IHC(1:200) |
| Antibody | Streptavidin-Alexa 488 | Thermo Fisher Scientific | Cat# S11223, RRID:AB_2336881 | IHC(1:400) |
| Antibody | Streptavidin-Alexa 555 | Thermo Fisher Scientific | Cat# S32355, RRID:AB_2571525 | IHC(1:400) |
| Antibody | Streptavidin-Alexa 647 | Jackson Immuno Research Europe Ltd. | Cat# 016-600-084, RRID:AB_2341101 | IHC(1:200) |
| Antibody | Streptavidin-DyLight 405 | Jackson Immuno Research Europe Ltd. | Cat# 016-470-084, RRID:AB_2337248 | IHC(1:400) |
| Chemical compound, drug | DAPI stain | Invitrogen | Cat# D9542 | |
| Chemical compound, drug | Fast green | Roche | Cat# 06402712001 | |
| Chemical compound, drug | Paraformaldehye | Sigma-Aldrich | Cat# 441244 | |
| Chemical compound, drug | Ritrodrine hydrochloride | Sigma-Aldrich | Cat# R0758-1G | |
| Chemical compound, drug | Tamoxifen | Invitrogen | Cat# D9542 | |
| Chemical compound, drug | Triton X-100 | Sigma-Aldrich | Cat# T8787-100ML | |
| Sequence-based reagent | RNAscope Probe - Mm-Nrg1 | ACDBio | Cat# 418181 | |
| Sequence-based reagent | RNAscope Probe - Mm-Nrg3 | ACDBio | Cat# 441831 | |
| Commercial assay or kit | RNAscope Multiplex Fluorescent Assay | ACDBio | Cat# 323110 | |
| Genetic reagent (Mus musculus) | Neurod6Cre (Neurod6tm1(cre)Kan) | Goebbels et al., 2006, PMID:17146780 | Dr Klaus Nave (MPI-EM) | |
| Genetic reagent (M. musculus) | Neurod6CreERT2 (Neurod6tm2.1(cre/ERT2)Kan) | Agarwal et al., 2012, PMID:21880656 | Dr Klaus Nave (MPI-EM) | |
| Genetic reagent (M. musculus) | Nrg1floxed (Nrg1tm3Cbm) | Yang et al., 2001, PMID:11395002 | Dr Carmen Birchmeier (MDC) | |
| Genetic reagent (M. musculus) | Nrg3floxed (Nrg3tm1a(KOMP)Mbp) | Bartolini et al., 2017, PMID:28147272 | ||
| Genetic regent (M. musculus) | RCLtdT or Ai9 (Gt(ROSA)26Sortm9(CAGtdTomato)Hze/J) | Madisen et al., 2010, PMID:20023653 Jackson Laboratory | Stock: 007905, RRID:IMSR_JAX:007905 | |
| Strain, strain background (M. musculus) | C57BL/6J | Jackson Laboratory | Stock: 000664, RRID:IMSR_JAX:000664 | |
| Strain, strain background (M. musculus) | Crl:CD1(ICR) | Charles River Laboratories | Stock: 022, RRID:IMSR_CRL:022 | |
| Sequence-based reagent | Nex-4 | Goebbels et al., 2006, PMID:17146780 | PCR primers | GAGTCCTGGAATCAGTCTTTTTC |
| Sequence-based reagent | Nex-5 | Goebbels et al., 2006, PMID:17146780 | PCR primers | AGAATGTGGAGTAGGGTGAC |
| Sequence-based reagent | Nex-6 | Goebbels et al., 2006, PMID:17146780 | PCR primers | CCGCATAACCAGTGAAACAG |
| Sequence-based reagent | Exon1-S | Agarwal et al., 2012, PMID:21880656 | PCR primers | GAGTCCTGGAATCAGTGTTTTTC |
| Sequence-based reagent | Nex-ORF-as | Agarwal et al., 2012, PMID:21880656 | PCR primers | AGAATGTGGAGTAGGGTGAC |
| Sequence-based reagent | Cre-as | Agarwal et al., 2012, PMID:21880656 | PCR primers | CCGCATAACCAGTGAAACAG |
| Sequence-based reagent | Nco-1 | Yang et al., 2001, PMID:11395002 | PCR primers | TCCTTTTGTGTGTGTTCAGCACCGG |
| Sequence-based reagent | M7-As | Yang et al., 2001, PMID:11395002 | PCR primers | GCACCAAGTGGTTGCGATTGTTGCT |
| Sequence-based reagent | wt-F | Bartolini et al., 2017, PMID:28147272 | PCR primers | AGAGGGAGAATGGAAAACAATGAGC |
| Sequence-based reagent | wt-R | Bartolini et al., 2017, PMID:28147272 | PCR primers | AGATGCCAGTGTCTCTTGTTTAGGG |
| Sequence-based reagent | 131 | Madisen et al., 2010, PMID:20023653 | PCR primers | AAGGGAGCTGCAGTGGAGTA |
| Sequence-based reagent | 132 | Madisen et al., 2010, PMID:20023653 | PCR primers | CCGAAAATCTGTGGGAAGTC |
| Sequence-based reagent | 133 | Madisen et al., 2010, PMID:20023653 | PCR primers | GGCATTAAAGCAGCGTATCC |
| Sequence-based reagent | 134 | Madisen et al., 2010, PMID:20023653 | PCR primers | CTGTTCCTGTACGGCATGG |
| Recombinant DNA reagent | pSyn-Gfp (plasmid) | this paper | See Materials and methods, Section 2. | |
| Recombinant DNA reagent | pSyn-HANrg1-pSyn-Gfp (plasmid) | this paper | See Materials and methods, Section 2. | |
| Recombinant DNA reagent | pSyn-HANrg3-pSyn-Gfp (plasmid) | this paper | See Materials and methods, Section 2. | |
| Recombinant DNA reagent | pSyn-HANrg1Ct:Nrg3-pSyn-Gfp (plasmid) | this paper | See Materials and methods, Section 2. | |
| Recombinant DNA reagent | pSyn-HANrg3Ct:Nrg1-pSyn-Gfp (plasmid) | this paper | See Materials and methods, Section 2. | |
| Recombinant DNA reagent | pSyn-HANrg1EGF:Nrg3-pSyn-Gfp (plasmid) | this paper | See Materials and methods, Section 2. | |
| Recombinant DNA reagent | pSyn-HANrg3EGF:Nrg1-pSyn-Gfp (plasmid) | this paper | See Materials and methods, Section 2. | |
| Recombinant DNA reagent | pSyn-HANrg1ΔCt-pSyn-Gfp (plasmid) | this paper | See Materials and methods, Section 2. | |
| Recombinant DNA reagent | pSyn-HANrg3ΔCt-pSyn-Gfp (plasmid) | this paper | See Materials and methods, Section 2. | |
| Software, algorithm | FIJI (ImageJ) | National Institute of Health | RRID:SCR_002285 | |
| Software, algorithm | MATLAB | MathWorks | RRID:SCR_001622 | |
| Software, algorithm | LAS AF | Leica Microsystems | RRID:SCR_013673 | |
| Software, algorithm | Bioconductor | open source | RRID:SCR_006442 | |
| Software, algorithm | R Project for Statistical Computing | open source | RRID:SCR_001905 | |
| Software, algorithm | RStudio | open source | RRID:SCR_000432 |
Additional files
Download links
A two-part list of links to download the article, or parts of the article, in various formats.
Downloads (link to download the article as PDF)
Open citations (links to open the citations from this article in various online reference manager services)
Cite this article (links to download the citations from this article in formats compatible with various reference manager tools)
Subcellular sorting of neuregulins controls the assembly of excitatory-inhibitory cortical circuits
eLife 9:e57000.
https://doi.org/10.7554/eLife.57000


