M2 cortex-dorsolateral striatum stimulation reverses motor symptoms and synaptic deficits in Huntington’s disease
- Departament de Biomedicina, Institut de Neurociències, Facultat de Medicina i Ciències de la Salut, Universitat de Barcelona, Spain
- Institut d’Investigacions Biomèdiques August Pi i Sunyer (IDIBAPS), Spain
- Centro de Investigación Biomédica en Red sobre Enfermedades Neurodegenerativas (CIBERNED), Spain
- Departament de Estadística, Facultat de Biologia, Universitat de Barcelona, Spain
- Institut d’Investigacions biomèdiques de Barcelona (IIBB), Consejo Superior de Investigaciones Científicas (CSIC), Spain
- Centro de Investigación Biomédica en Red sobre Enfermedades Mentales (CIBERSAM), Spain
- Production and Validation Center of Advanced Therapies (Creatio), Faculty of Medicine and Health Science, University of Barcelona, Spain
Figures
Figure 1

Striatal functional connectivity is reduced in symptomatic HD mice.
(a) We measured the functional connectivity between selected cortical and basal ganglia-related nuclei in the regions of interest obtained by atlas-based automatic parcellation. (b) Average seed-based BOLD correlation maps from striatum in WT and the R6/1 mouse model of HD. The images show the area with an average correlation greater than 0.15. Color maps represent the average correlation value (c) Average functional connectivity of the striatum with selected cortices and basal ganglia related structures from the left hemisphere are represented. For each region, functional connectivity with striatum is computed as the average of the seed-based correlation map in the specific area. Each gray point represents data from an individual mouse. Two-way ANOVA with Bonferroni post hoc comparisons test was performed. Data are represented as mean ± SEM (WT n = 11 and HD n = 13 mice). *p < 0.05, **p < 0.01, ***p < 0.001 HD versus WT.
Figure 2 with 1 supplement
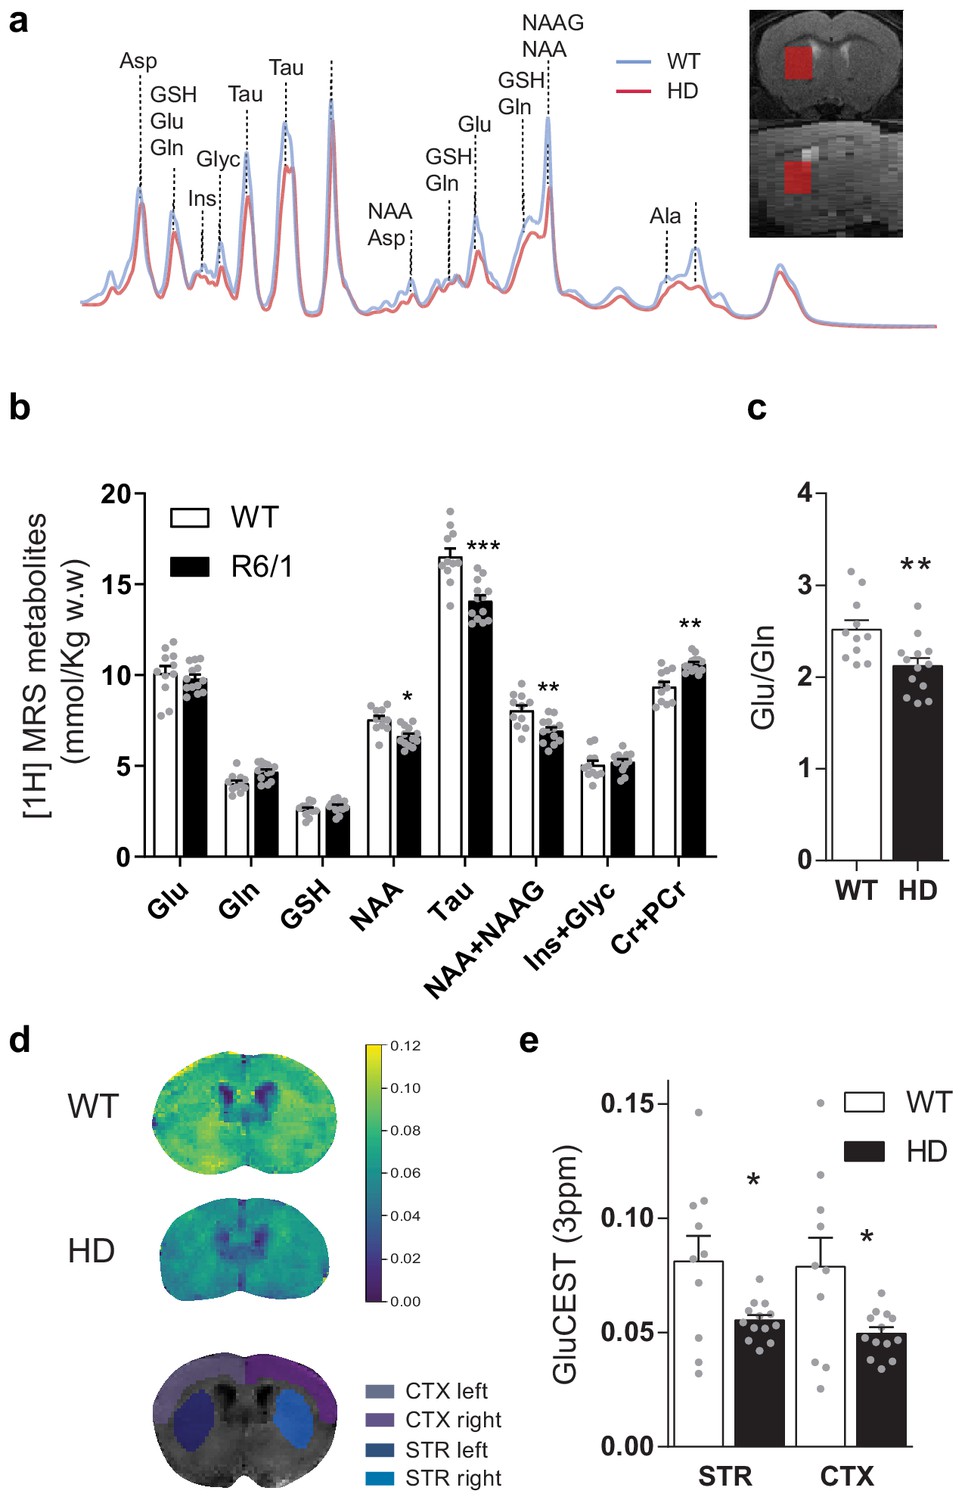
Brain metabolites in the striatum are altered in symptomatic HD mice.
(a) Representative 1H MRS signal from abundant metabolites in the striatum of WT (blue line) and HD (red line) mice. Voxel location in the striatum is illustrated in coronal (top panel) and sagittal brain view (bottom panel). (b) Metabolites concentration quantification (mmol/kg w.w). (c) The glutamate/glutamine ratio was calculated as an indicator of glutamate neurotransmission (d) Representative coronal images of GluCEST in WT (top) and HD mice (middle) and manually drawn ROIs used for quantification (bottom). (e) GluCEST quantification of striatum and cortex. Values were calculated as the GluCEST value (percentage of asymmetry at 3 ppm) versus minimum GluCEST value in the ventricles and left and right hemisphere values were averaged. Data are represented as mean ± SEM (WT n = 10 and HD n = 13 mice). Each gray point represents data from an individual mouse. *p < 0.05, **p < 0.01, ***p < 0.001 HD versus WT. Abbreviations: Glu: glutamate; Gln: glutamine; GSH: glutathione; NAA: N-Acetyl-aspartate; Tau: taurine; NAAG: N-Acetyl-aspartyl-glutamate; Ins+Glyc: inositol + glycine.
Figure 2—figure supplement 1
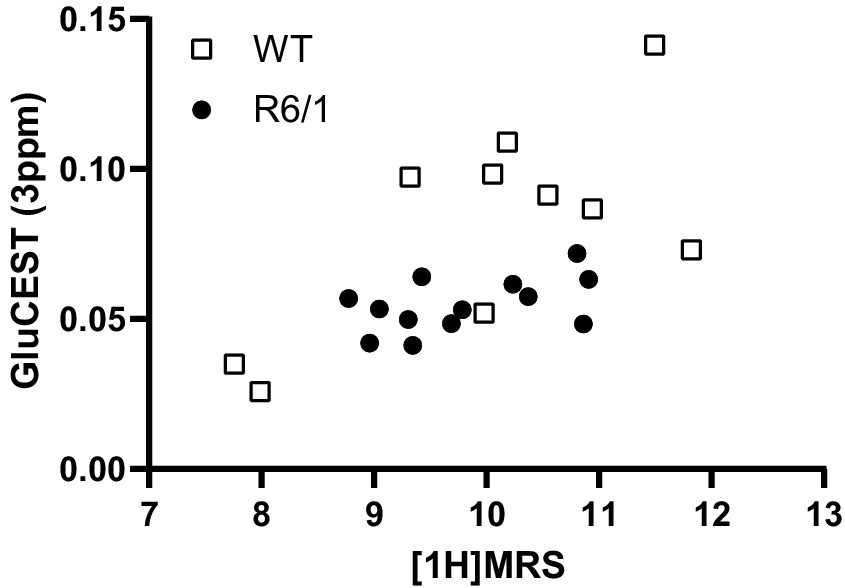
Correlation of glutamate levels obtained from GluCEST and 1H MRS in the striatum.
Data are represented as mean ± SEM (WT n = 10 and HD n = 13 mice). Each point represents data from an individual mouse. Pearson correlation shows r = 0.5979 with p = 0.0026.
Figure 3
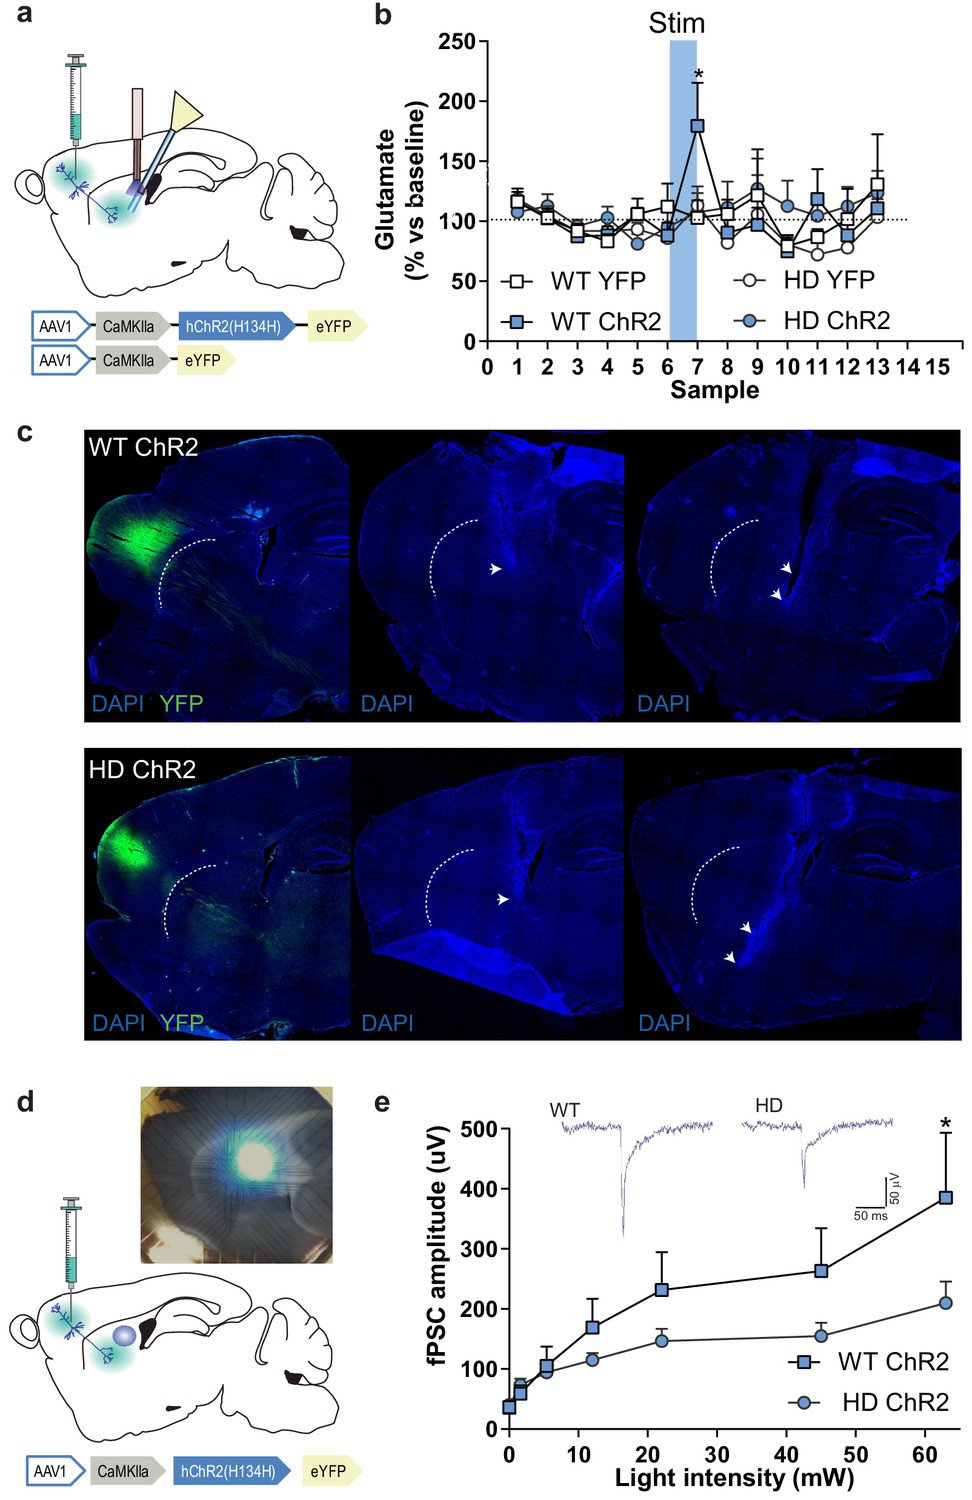
M2 cortex-dorsolateral striatum function is impaired in HD mice.
(a) Schematic representation showing AAV-ChR2 and control AVV-YFP constructs and injection location at M2 cortex and fiber-optic cannula and microdialysis probe implants. (b) Dialysate samples were collected every 6 min and glutamate was subsequently analyzed by HPLC. A 473 nm light stimulation was delivered at 10 Hz bilaterally for 5 min in freely moving mice during sample 7 (blue box). Glutamate level of each dialysate sample in the striatum is represented as a percentage of the mean glutamate baseline levels (samples 1–6; WT-YFP n = 3, WT-ChR2 n = 4, HD-YFP n = 4, HD-ChR2 n = 5 mice/group). (c) Histological images from one representative WT-ChR2 (top) and one HD-ChR2 (bottom) showing AAV expressed in M2-cortex (left), fiber-optic cannula in the DLS (center), and microdialysis probe just below the fiber-optic cannula (right). Arrows indicate the tip of the fiber-optic cannula and location of the microdialysis probe membrane, respectively. (d) Schematic representation of multi-electrode array recordings in slices and a representative image showing the electrodes and the location of light stimulation. AAV-ChR2 was injected at the M2 cortex. Sagittal slices were obtained for light-induced recording. A fiber-optic cannula was used to locate the light on top of the dorsolateral striatum. (e) The amplitude of light intensity-induced striatal field postsynaptic currents (fPSC) in WT and HD mice. Inset: Representative traces of the light-induced electrical response. Two-way ANOVA with Bonferroni post hoc comparisons test was performed. Values are expressed as mean ± SEM (WT-ChR2 n = 4, HD-ChR2 n = 3 mice). *p < 0.05.
Figure 4 with 3 supplements

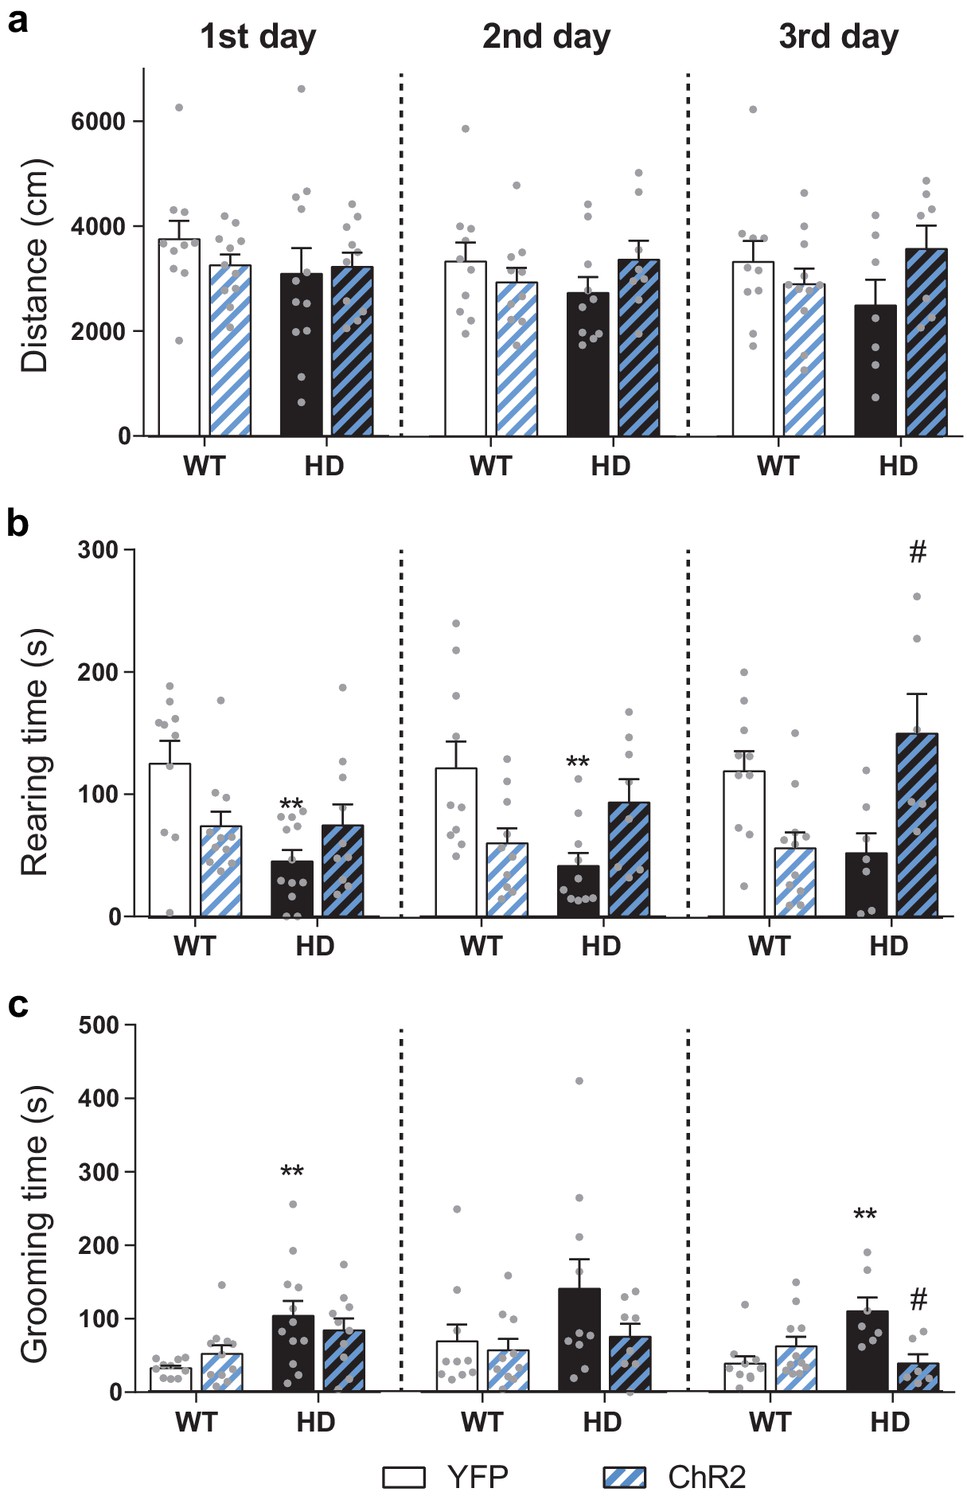
Repeated optogenetic stimulation of the cortico-striatal pathway recovers exploratory and stereotypic behavioral deficits in symptomatic HD mice.
(a) Schematic diagram showing AAV-ChR2 and control AAV-YFP constructs injections at the M2 cortex and fiber-optic cannula implant in the DLS allowing light stimulation of cortically infected neuronal axons. (b) Locomotion (distance traveled), exploration time (rearing time), and stereotypic grooming (grooming time) were evaluated during 11 min open field session. Optogenetic stimulation consisted of 10 Hz light stimulation for 1 min during open field (OF) task. (c) Representative fluorescence image showing the precision of the AAV injection by YFP expression at M2 cortex and the presence of YFP fibers in the striatal region. (d) Surgery, behavior, and optogenetic experimental timeline. The OF procedure was performed at 20 (1st day OF), 21 (2nd day OF), and 22 (3rd day OF) weeks old mice. After 2nd stimulation day, motor learning and coordination tests were performed. (e) Distance traveled, (f) rearing time, and (g) stereotypic grooming were measured during the 5 min before (PRE-stimulation) and the 5 min after (POST-stimulation) over the three OF sessions, left and right panels, respectively. Values are expressed as mean ± SEM (WT-YFP n = 10, WT-ChR2 n = 11, HD-YFP n = 13, and HD-ChR2 n = 11). Each point represents data from an individual mouse. Data were analyzed by two-way ANOVA with genotype and light stimulation as factors, and Bonferroni test as a post hoc. *p < 0.05, **p < 0.01, and ***p < 0.001.
Figure 4—figure supplement 1
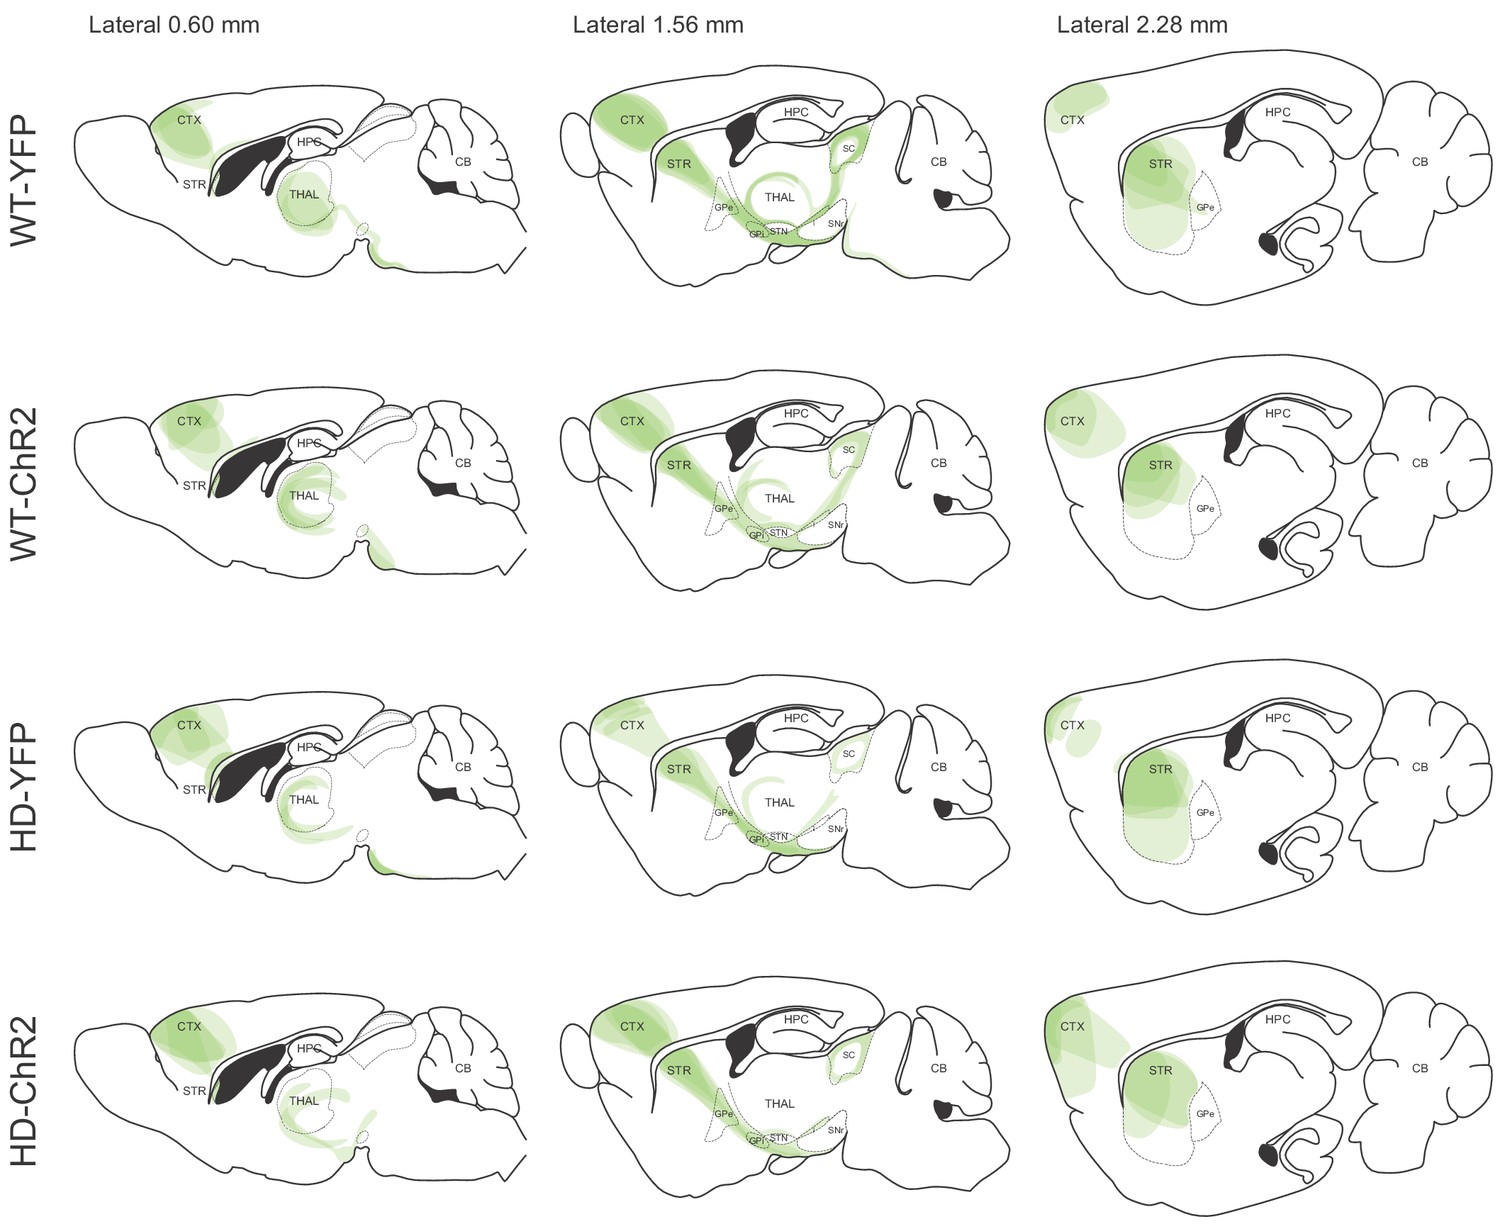
Validation of the AAV expression from the M2 cortex and its projections by YFP fluorescence.
Overlay of the YFP expression from different mice was drawn over three representative sagittal sections: mediolateral coordinates 0.6, 1.56, and 2.28 mm obtained from the brain atlas (Franklin and Paxinos, 1997). For each of the animals studied, brain slices were analyzed, and the visualized virus-infected-pathways were plotted manually in the corresponding sagittal section. Each of the represented brain images contains different layers from four mice, each animal represented with a color opacity of 20%.
Figure 4—figure supplement 2
Average locomotion, exploration and stereotypies over the 11 min OF sessions.
(a) Distance traveled (cm), (b) rearing time (s), and (c) stereotypic grooming time (s) were evaluated during the whole 11 min open field sessions. Values are expressed as mean ± SEM (WT-YFP n = 10, WT-ChR2 n = 11, HD-YFP n = 13, and HD-ChR2 n = 11). Distance traveled was similar between all groups in the different OF sessions. Two-way ANOVA test with genotype and stimulation as factors was performed and no significant effects were found. Rearing time was reduced in HD-YFP mice and optogenetic stimulation increased exploratory behavior over the sessions. Two-way ANOVA showed significant differences between groups (1st day: genotype F(1, 39)=7.540; p = 0.0091 and interaction effect F(1, 39)=7.889; p = 0.0077; 2nd day: Interaction effect F(1, 34)=11.56; p = 0.0017; 3rd day: Interaction effect F(1, 30)=17.90; p < 0.0004). Bonferroni post hoc analyses were performed and revealed significant differences between WT-YFP and HD-YFP during 1st and 2nd OF sessions and between HD-YFP and HD-ChR2 during the 3rd OF session. Stereotypic grooming was increased in HD-YFP mice and repeated optogenetic stimulation reduced stereotypic behavior in HD-CHR2 mice. Two-way ANOVA revealed significant differences between groups (1st day: genotype effect F(1, 39)=11.36; p = 0.0017; 3rd day: Interaction effect F(1, 30) = 11.42; p = 0.020). Bonferroni post hoc analyses revealed significant differences between WT-YFP and HD-YFP during the 1st and 3rd OF sessions and between HD-YFP and HD-ChR2 during the last OF session. **p < 0.01 versus WT-YFP and #p < 0.05 versus HD-YFP.
Figure 4—figure supplement 3
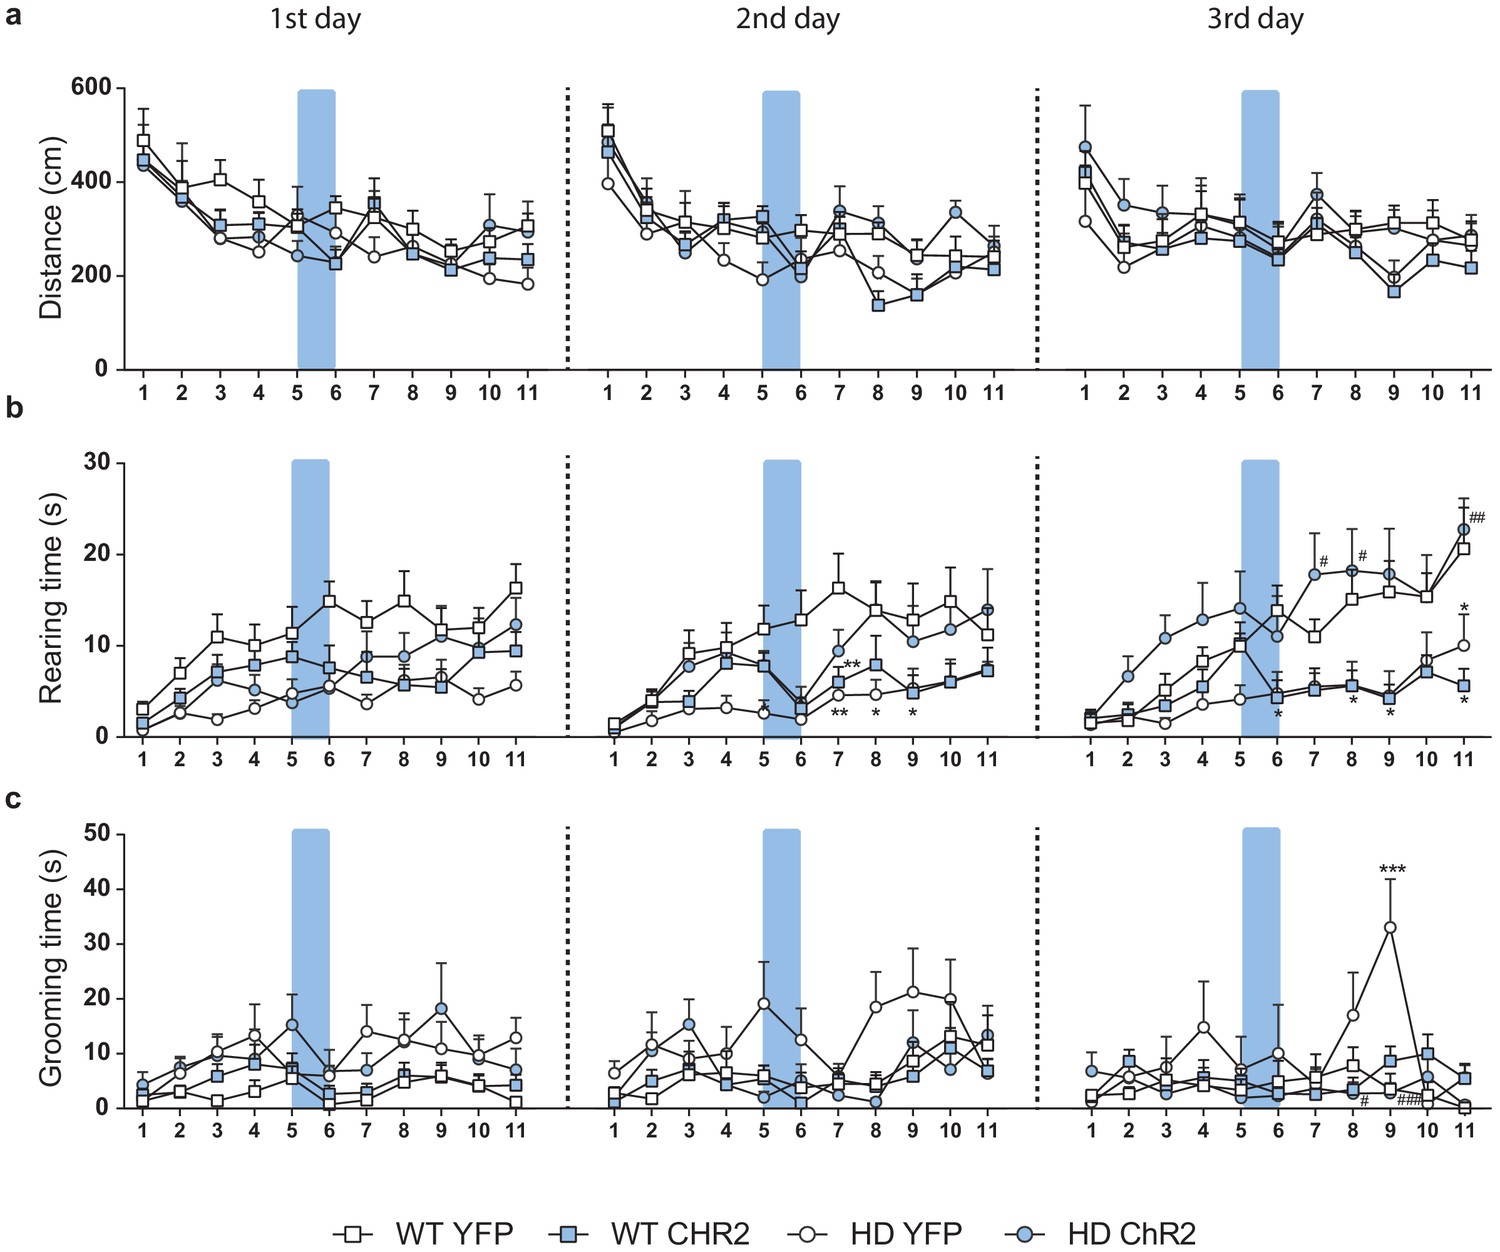
Representation of the changes in locomotion, exploration and stereotypies per minute during the whole 11 min OF sessions.
(a) Distance traveled (cm), (b) rearing time (s), and (c) grooming time (s) per minute in 20-week-old WT-YFP, WT-ChR2, HD-YFP, and HD-ChR2 mice during the 1st (left), 2nd (middle), and 3rd (right) open field sessions. The blue box represents the duration of blue light stimulation (1 min). Repeated measures ANOVA with group and time as factors followed by Bonferroni’s post hoc comparisons test was performed. Bonferroni post hoc comparisons are shown when the interaction effect was found. Values are expressed as mean ± SEM (WT-YFP n = 10, WT-ChR2 n = 11, HD-YFP n = 13, and HD-ChR2 n = 11).
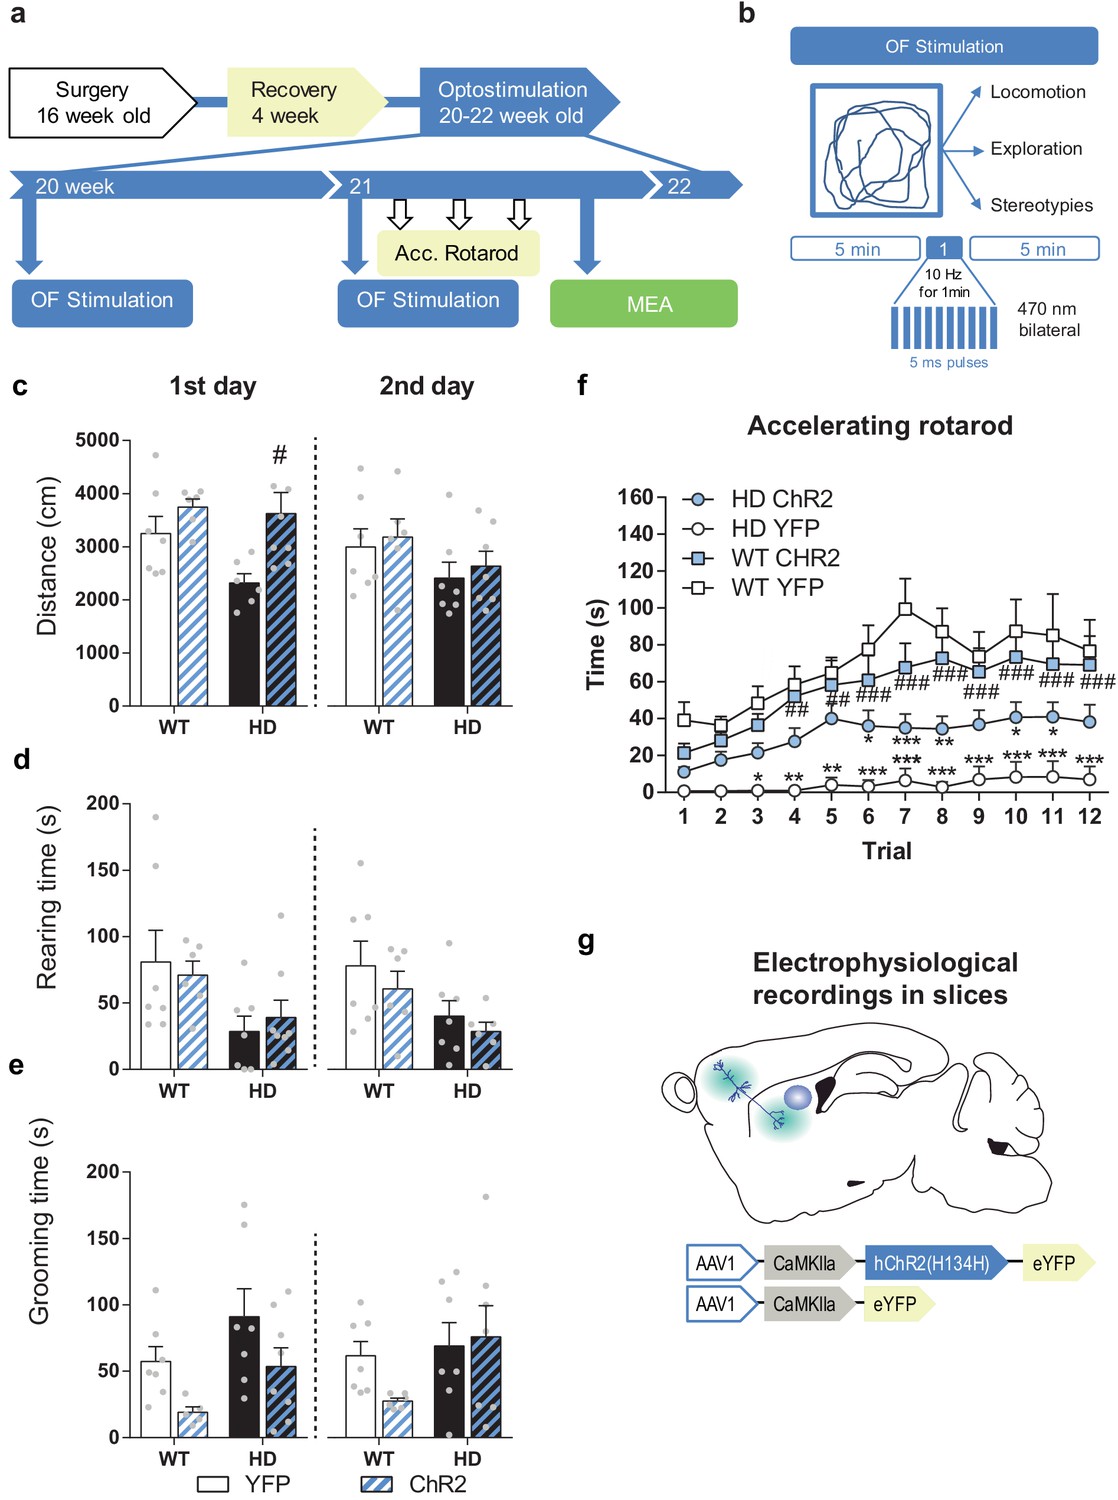
Figure 5
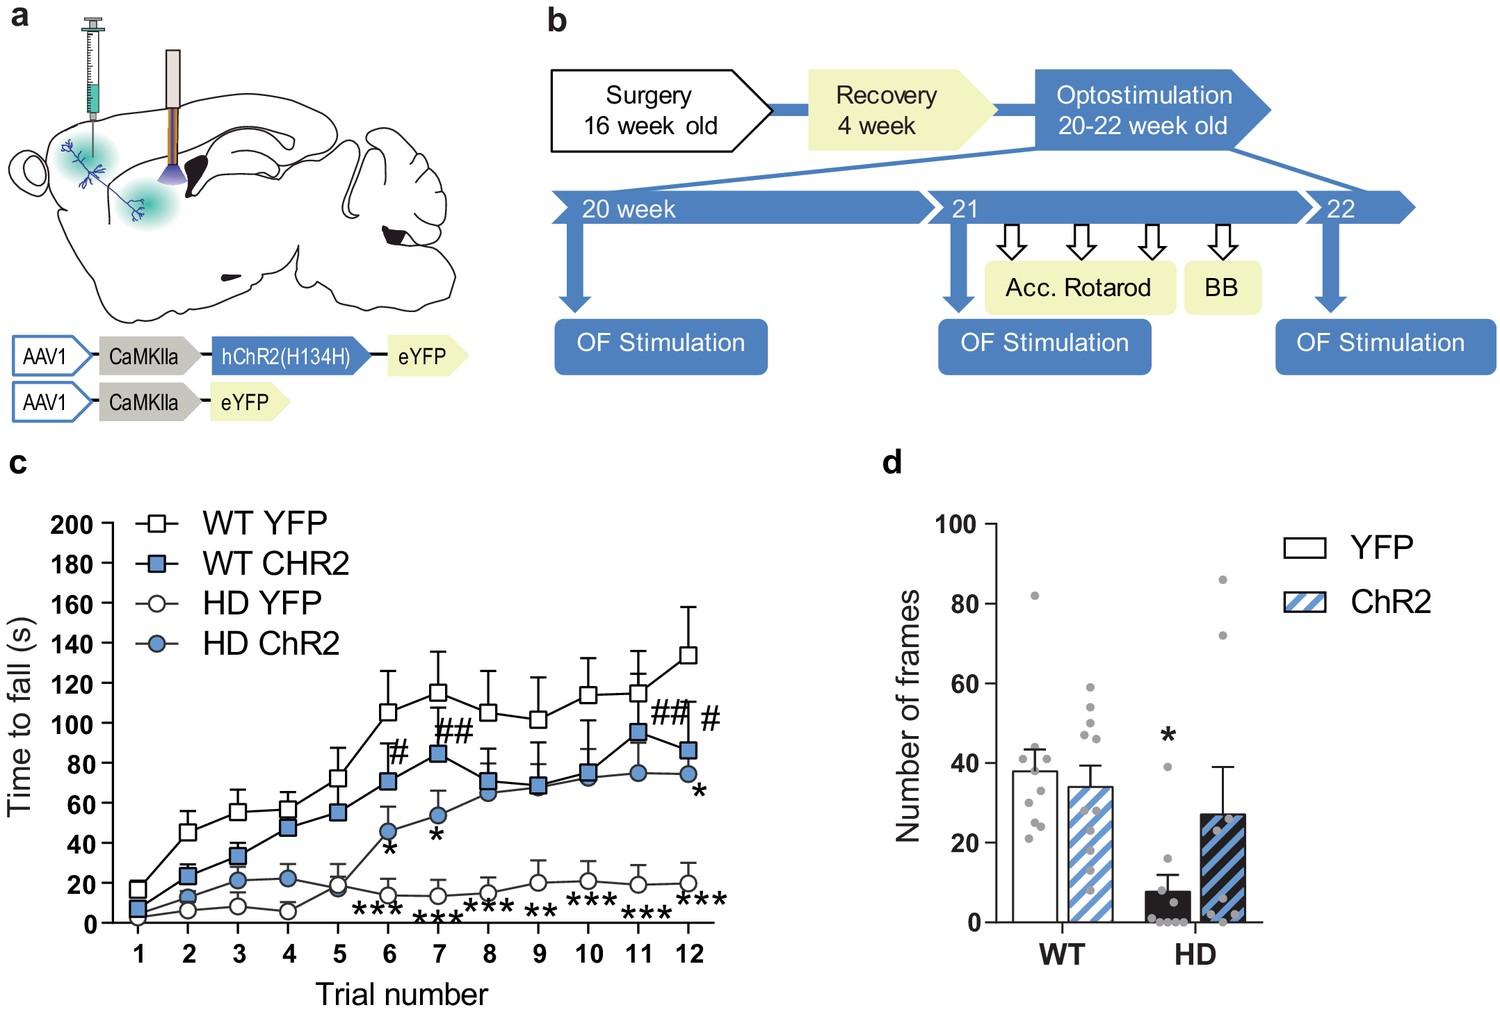
Optogenetic stimulation of the M2 cortex-DLS pathway recovers motor learning and coordination deficits in HD mice.
(a) Schematic representation showing AAV-ChR2 and control AVV-YFP constructs injections at the M2 cortex, fiber-optic cannula implant in the DLS. (b) Surgery, behavior, and optogenetic experimental timeline. After 2nd stimulation day in the OF, motor learning (accelerating rotarod) and coordination (balance beam, BB) tests were performed. (c) Latency to fall in the accelerating rotarod task. (d) The number of frames crossed in the BB test. Each point represents data from an individual mouse. Data were analyzed by repeated-measures ANOVA with group and time as factors for accelerating rotarod and by two-way ANOVA with genotype and stimulation as factors for the BB test. Bonferroni’s multiple comparison test was performed as a post hoc test *p < 0.05, **p < 0.01, ***p < 0.001 versus WT-YFP, and #p < 0.05 versus HD-YFP. Values are expressed as mean ± SEM (WT-YFP n = 10, WT-ChR2 n = 11, HD-YFP n = 10, and HD-ChR2 n = 9).
Figure 6 with 1 supplement
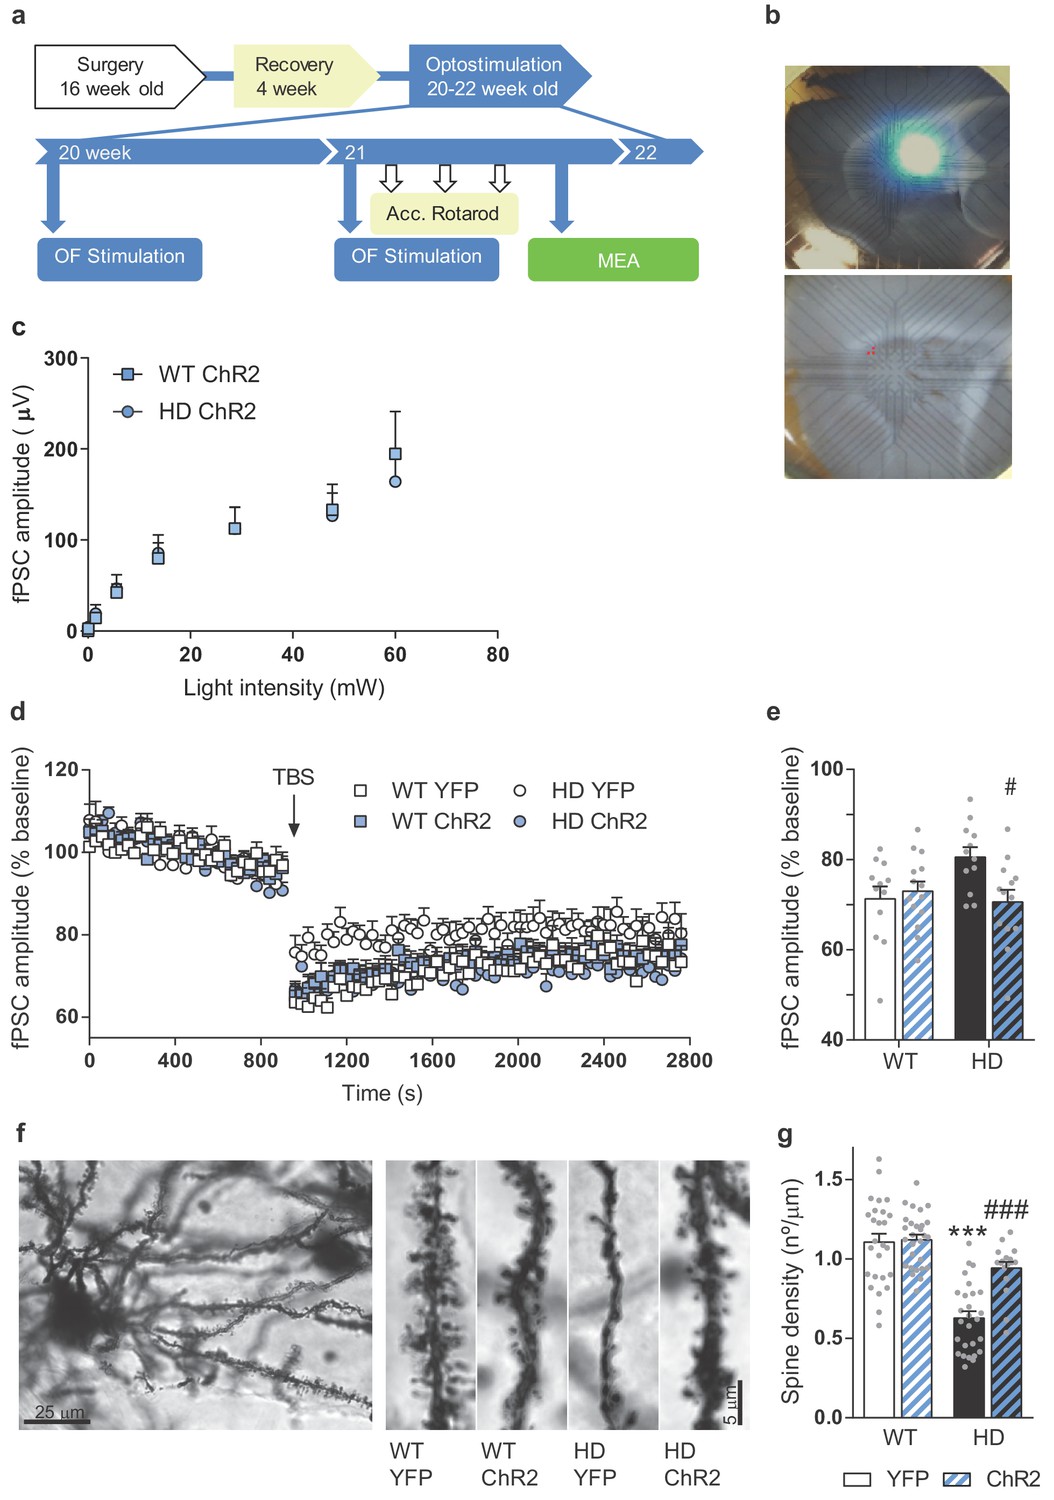
Repeated optogenetic cortico-striatal stimulation restores synaptic plasticity and dendritic spine density in HD mice.
(a) Surgery, behavior, and optogenetic experimental timeline. The electrophysiological evaluation was performed on the 3rd week in sagittal cortico-striatal slices. (b) A representative image showing the location of the light stimulation (top image) and stimulating electrodes (bottom image, highlighted in red). (c) Light intensity-induced striatal field postsynaptic currents in WT and HD mice with AAV-ChR2 expressed in M2 cortex. (d) The graph shows the time course of LTD evoked at cortico-striatal synapses following a TBS. The TBS, indicated by the arrow, was presented after 15 min of baseline recordings. Field postsynaptic currents (fPSC) are represented as a percentage of baseline. (e) The histogram shows the averaged amplitude of fPSC evoked during 30 min after TBS. Data were analyzed by repeated-measures ANOVA with genotype and stimulation as factors and Bonferroni’s multiple comparison as post hoc test. Values are expressed as mean ± SEM (WT-YFP n = 12, WT-ChR2 n = 13, HD-YFP n = 12, and HD-ChR2 n = 14 mice). (f) Golgi-impregnated representative neuron and segments of secondary dendrites from MSNs from WT and HD mice infected with AAV-YFP and AAV-ChR2, respectively. Scale bar, 3 μm. Dendritic spines were counted in a segment of known length (~20 μm) to obtain the spine density. (g) Quantitative analysis of spine densities per μm of the dendritic length of 3–13 neurons per mice. HD-YFP mice exhibit a significant reduction in dendritic spines that was significantly increased in stimulated HD-ChR2. Two-way ANOVA with Bonferroni’s post hoc comparisons test was performed. All data are shown as the mean ± SEM. ***p < 0.001 versus WT-YFP and #p < 0.05 and ###p < 0.001 versus HD-YFP.
Figure 6—figure supplement 1
Behavioral data generated in mice used for Figure 6a–e.
(a) Surgery, behavior, and optogenetic experimental timeline. The OF procedure was performed at 20 (1st day OF) and 21 (2nd day OF) weeks old mice. After 2nd stimulation day, motor learning tests were performed, and mice were sacrificed for electrophysiological analyses in brain slices. (b) Optogenetic stimulation consisted of 10 Hz light stimulation for 1 min during open field (OF) task and spontaneous activity was scored. (c) Locomotion (distance traveled), (d) exploration time (rearing time), and (e) stereotypic grooming (grooming time) were evaluated during the first (left) and second (right) open field sessions. (f) Latency to fall in the accelerating rotarod task. (g) Schematic diagram showing AAV-ChR2 and control AAV-YFP constructs injections at the M2 cortex and electrophysiological evaluation in sagittal cortico-striatal slices. Values are expressed as mean ± SEM (WT-YFP n = 7, WT-ChR2 n = 9, HD-YFP n = 7, and HD-ChR2 n = 8 mice). Each point represents data from an individual mouse. Data were analyzed by two-way ANOVA with genotype and light stimulation as factors, and Bonferroni test as a post hoc. *p < 0.05, **p < 0.01, and ***p < 0.001 versus WT-YFP and #p < 0.05 ##p < 0.01 and ###p < 0.001 versus HD-YFP.
Tables
Key resources table
| Reagent type (species) or resource | Designation | Source or reference | Identifiers | Additional information |
|---|---|---|---|---|
| Genetic reagent Mus musculus | B6CBA-Tg(HDexon1)61Gpb/1J (R6/1) | The Jackson Laboratory | RRID:IMSR_JAX:002809 | R6/1 HD model |
| Recombinant DNA reagent | AAV1-CamKIIa-hChR2(H134H)-eYFP-WPRE.hGH | University of Pennsylvania-Penn Vector Core | Catalog number: AV-1–26969P | titres: 8,97 × 10¹² genomic particles/mL (we used 1:10 dilution) |
| Recombinant DNA reagent | AAV1-CamKIIa(1,3)-eYFP.WPRE.hGH; | University of Pennsylvania-Penn Vector Core | Catalog number: AV-1-PV2975 | titres: 1.18 × 10¹³ genomic particles/mL (we used 1:10 dilution) |
| Software, algorithm | GraphPad Prism software | GraphPad Prism (https://graphpad.com) | RRID:SCR_002798 | Version 8.0.0 |
| Software, algorithm | Fiji | https://imagej.net/Fiji | RRID:SCR_002285 | |
| Software, algorithm | ANTs (Advanced Normalization ToolS) | http://stnava.github.io/ANTs/ | RRID:SCR_004757 | |
| Software, algorithm | FSL | http://www.fmrib.ox.ac.uk/fsl/ | RRID:SCR_002823 | |
| Software, algorithm | Python | http://www.python.org/ | RRID:SCR_008394 | |
| Software, algorithm | SPM | http://www.fil.ion.ucl.ac.uk/spm/ | RRID:SCR_007037 | |
| Software, algorithm | Nitime | http://nipy.org/nitime/ | RRID:SCR_002504 | |
| Software, algorithm | LCModel | http://s-provencher.com/pages/lcmodel.shtml | RRID:SCR_014455 | |
| Software, algorithm | ITK-Snap | http://www.nitrc.org/projects/itk-snap/ | RRID:SCR_002010 |
Additional files
-
Supplementary file 1
Average seed-based BOLD correlation maps from WT mouse striatum related to Figure 1b, visualized with ITK-SNAP software (Yushkevich et al., 2006).
- https://cdn.elifesciences.org/articles/57017/elife-57017-supp1-v1.gz.zip
-
Supplementary file 2
Average seed-based BOLD correlation maps from R6/1 HD mouse striatum related to Figure 1b, visualized with ITK-SNAP software (Yushkevich et al., 2006).
- https://cdn.elifesciences.org/articles/57017/elife-57017-supp2-v1.gz.zip
-
Transparent reporting form
- https://cdn.elifesciences.org/articles/57017/elife-57017-transrepform-v1.pdf
Download links
A two-part list of links to download the article, or parts of the article, in various formats.
Downloads (link to download the article as PDF)
Open citations (links to open the citations from this article in various online reference manager services)
Cite this article (links to download the citations from this article in formats compatible with various reference manager tools)
M2 cortex-dorsolateral striatum stimulation reverses motor symptoms and synaptic deficits in Huntington’s disease
eLife 9:e57017.
https://doi.org/10.7554/eLife.57017


