MondoA regulates gene expression in cholesterol biosynthesis-associated pathways required for zebrafish epiboly
- Institute of Biological and Chemical Systems – Biological Information Processing, Karlsruhe Institute of Technology, Germany
- Institute of Metabolism and Systems Research, College of Medical and Dental Sciences, University of Birmingham, United Kingdom
- Institute for Molecular Bioscience, The University of Queensland, Australia
- Nestlé Institute of Health Sciences SA, EPFL Innovation Park, Switzerland
- Institute for Automation and Applied Informatics, Karlsruhe Institute of Technology, Germany
- Institute of Applied Physics, Karlsruhe Institute of Technology, Germany
- Department of Physics, University of Illinois at Urbana-Champaign, United States
- Institute of Nanotechnology, Karlsruhe Institute of Technology, Germany
Figures
Figure 1 with 1 supplement
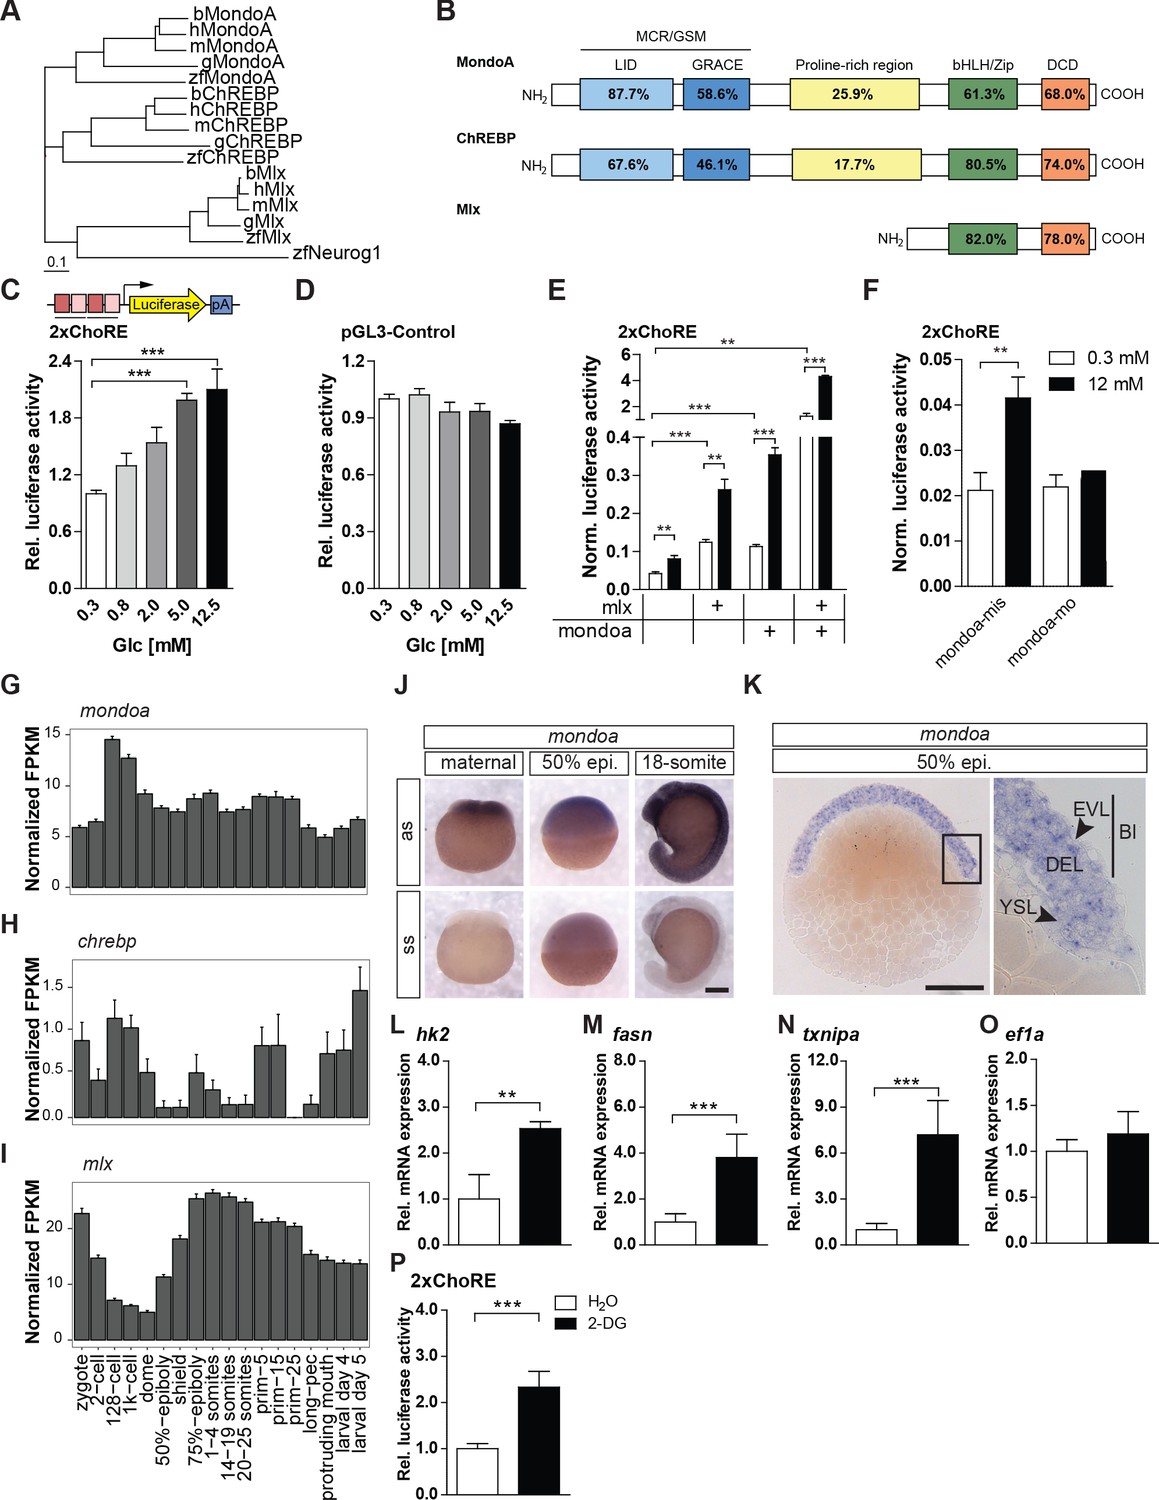
The glucose-sensing Mondo pathway in zebrafish.
(A) Phylogenetic tree of ChREBP, MondoA and Mlx proteins. h, human, m, mouse, b, bovine, g, chicken, zf, zebrafish. Outgroup: zf Neurogenin 1 (Neurog 1). Scale bar: 0.1 estimated amino acid substitutions per site. (B) Amino acid identities in % between zebrafish and human domains of ChREBP, MondoA and Mlx: ‘Mondo conserved regions/glucose-sensing module’ (MCR/GSM); ‘low-glucose inhibitory domain’ (LID; light blue); ‘glucose-response activation conserved element’ (GRACE; dark blue); ‘basic-helix-loop-helix/leucine zipper’ (bHLH/ZIP; green); ‘dimerization and cytoplasmic localization domain’ (DCD; red). (C, D) Bioluminescence levels after 24 hr of glucose treatment of PAC2 cells transiently transfected with the 2xChoRE reporter consisting of a luciferase reporter gene (yellow) regulated by a minimal promoter (TATA; arrow) and two carbohydrate response elements (ChoREs; each with the sequence 5’-CACGCG-N5-CTCGTG-3’; pA for polyadenylation site; n = 4, (C) or with the constitutively expressed pGL3-Control reporter construct (D, n = 4). (E, F) Bioluminescence levels in 2xChoRE reporter expressing PAC2 cells upon 24 hr of treatment with 0.3 mM (white bars) or 12 mM (black bars) glucose after overexpression of MondoA and/or Mlx (E, n = 4) or transfection with mondoa-mo or mondoa-mis (F, n = 8). Data were normalized to Renilla luciferase activity (Norm. bioluminescence). (G–I) mRNA expression profiles of mondoa (G), chrebp (H) and mlx (I) during zebrafish developmental stages from zygote to larval stage five extracted from a published dataset (White et al., 2017). n = 20; FKPM, Fragments Per Kilobase of transcript per Million mapped reads. (J) WISH of mondoa transcripts at zygote (maternal), 50% epiboly (50% epi.) and 18-somite stages. as, antisense probe, ss, sense probe. Scale bar: 0.2 mm. (K) Epon sections of 50% epi. embryos showed mondoa expression in the enveloping layer (EVL), the deep cell layer (DEL) of the blastoderm (Bl) and the yolk syncyctial layer (YSL). Scale bar: 0.2 mm, for higher magnification 50 µm. (L–O) Glucose induction of Mondo pathway target gene expression in early zebrafish embryos. Embryos were injected with the glucose analog 2-deoxy-D-glucose (2-DG; black bars) or with water (white bars) as a control. RNA was extracted at the sphere stage to perform RT-qPCR of genes known to be Mondo pathway targets in mammals: hexokinase 2 (hk2, L), fatty acid synthase (fasn, M), thioredoxin-interacting protein a (txnipa, N), eukaryotic translation elongation factor 1 alpha 1 (ef1a, O) (n = 9). (P) Embryos (n ≥ 72) injected with the 2xChoRE reporter showed increased bioluminescence at sphere stage when co-injected with 2-DG. Error bars represent SEM; *, p≤0.05; **, p≤0.01; ***, p≤0.001.
Figure 1—figure supplement 1

Additional data of Mondo pathway characterization experiments in zebrafish.
(A) RT-qPCR determination of transcript levels of the Mondo pathway factors chrebp, mondoa and mlx in PAC2 cells shows that all three factors are expressed in this zebrafish cell line. The liver-specific gene phosphoenolpyruvate carboxykinase 1 (pck1) was used as a negative control (n = 3). (B) Reporter activity from the 2xChoRE reporter construct showed a significant dose-dependent increase upon glucose treatment in human HepG2 cells (n = 4). (C) Overexpression studies with mondoa and mlx in PAC2 cells with a GRE reporter construct. Cells were treated with either low (0.3 mM; white bars) or high (12 mM; black bars) glucose (Glc) concentrations and bioluminescence was measured after 24 hr of incubation (n = 4). Data were normalized to Renilla luciferase activity to control for transfection efficiency (Norm. bioluminescence). No glucose induction or regulation mediated by Mondo pathway factors was observed for the GRE reporter construct. (D, E) Analysis of spatial distribution of chrebp (D) and mlx (E) transcripts at 4 cell, 50% epiboly (50% epi) and 21-somite stages by WISH. For both genes, expression was detected in the blastodisc and is ubiquitous during later stages. The same staining pattern was observed for two probes directed against different portions of each transcript (probe 1 and probe 2). (F) Epon sections of 50% epiboly (50% epi.) stage embryos show chrebp (upper panels) and mlx (lower panels) expression in the enveloping layer (EVL) and in the deep cell layer (DEL) of the blastoderm (Bl) as well as in the yolk syncyctial layer (YSL, arrowheads). Scale bar: D, E, 0.36 mm; F, 0.13 mm for left panels, 20 µm for right panels. (G) Glucose induction of the MondoA target gene txnipa is MondoA dependent in zebrafish embryos. Embryos were injected with the glucose analog 2-deoxy-D-glucose (2-DG; black bars) or with water (white bars) as a control along with either mondoa-mis or mondoa-mo. RNA was extracted at the sphere stage to perform RT-qPCR of thioredoxin-interacting protein a (txnipa) (n = 3, 20 embryos each). Error bars represent SEM, *, p≤0.05; **, p≤0.01; ***, p≤0.001.
Figure 2 with 1 supplement
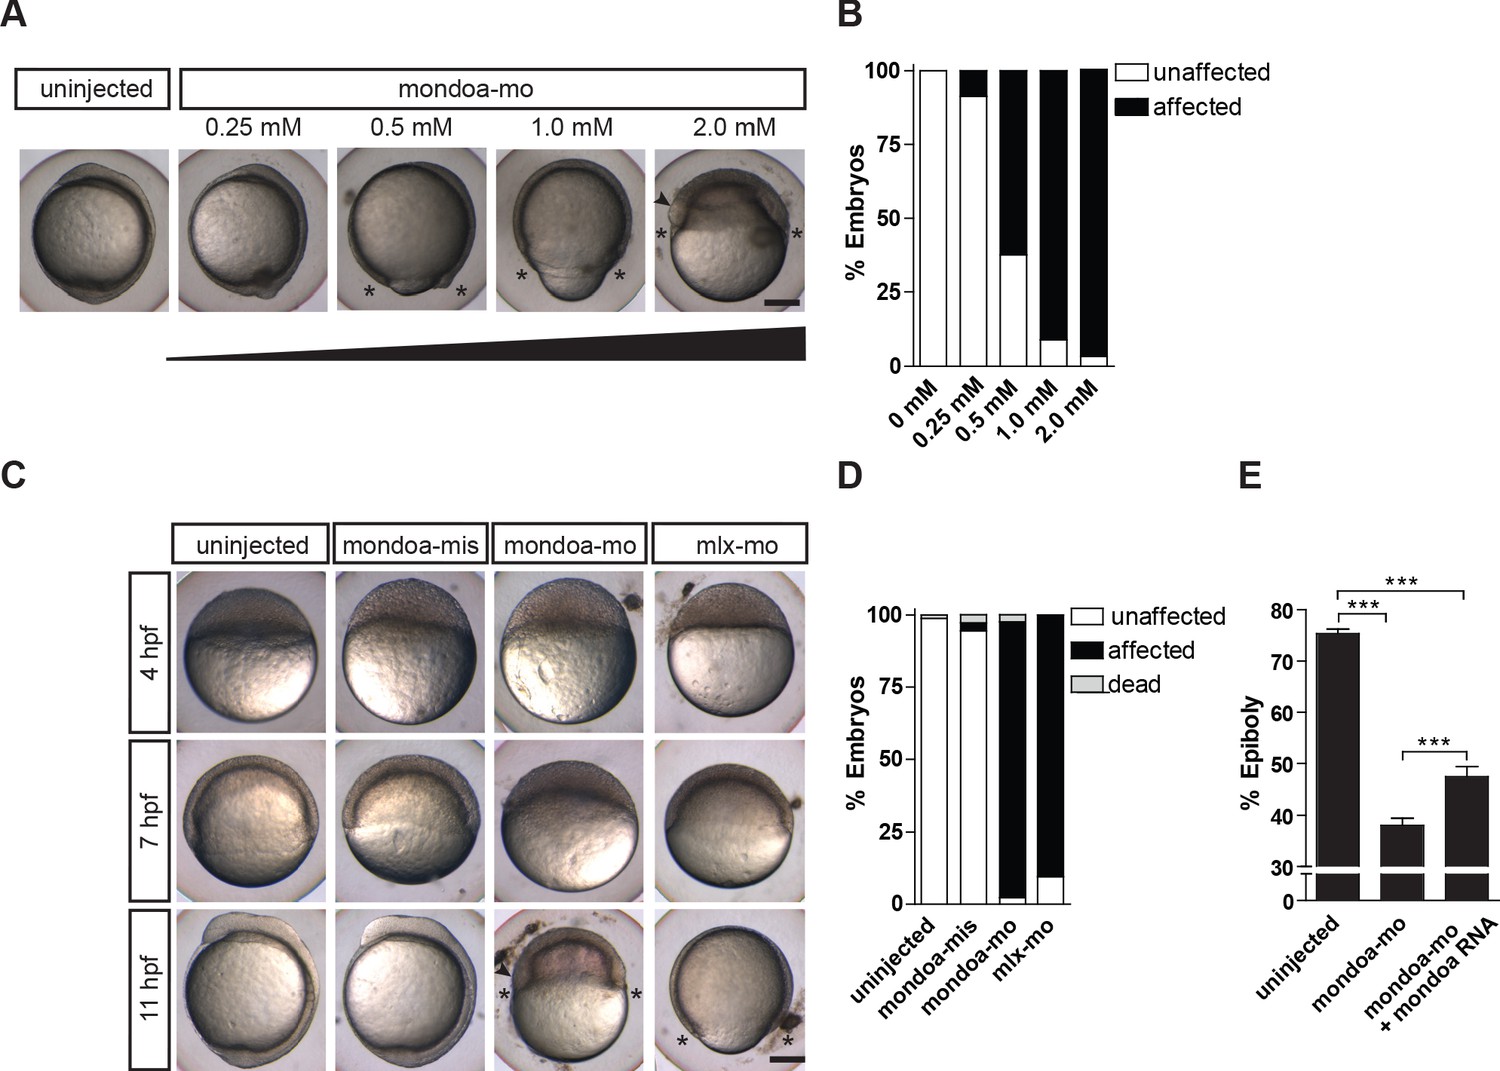
Knockdown of mondoa impacts zebrafish epiboly.
(A, B) Dose-dependent (0.25–2.0 mM) arrest of epiboly movements of mondoa morphants when the uninjected control was around bud stage (~10 hpf). (A) Images of representative embryos. (B) Quantification of phenotypes scored when uninjected embryos had accomplished epiboly: ‘unaffected’, embryos reached bud/3 somite stage in parallel with controls; ‘affected’, developmental arrest at an earlier epiboly stage; ‘dead’, coagulated embryos. Percentages of ‘affected’ embryos were: uninjected (n = 0/26; 0%), 0.25 mM (n = 2/23; 8.7%), 0.5 mM (n = 15/24; 62.5%), 1 mM (n = 17/18; 94.4%), 2 mM (n = 39/41; 95.1%). (C) Developmental time course upon mondoa knockdown compared to uninjected embryos at the sphere stage (~4 hpf), the 60% epiboly (~7 hpf) and the 3-somite stage (~11 hpf). When uninjected control embryos were at the 3-somite stage, the epiboly delay/arrest phenotype was observed with mondoa-mo and with a MO targeting mlx (mlx-mo). No effect on epiboly was observed in embryos injected with mondoa-mis MO. (D) Quantification of the phenotypes in (C), scored when uninjected embryos were at the bud stage. Percentages of ‘affected’ embryos : uninjected, 0% (n = 0/403); mondoa-mis, 2.8% (n = 3/109); mondoa-mo, 95.3% (n = 462/485); mlx-mo, 90.5% (n = 124/137). (E) Partial rescue of mondoa knockdown with mondoa mRNA. Percentage of epiboly progression was determined via no tail (ntl) WISH. Uninjected control embryos (n = 30) were fixed at the 75% epiboly stage along with the morphants. Embryos co-injected with mondoa-mo and mondoa mRNA (250 ng/µl) were partially rescued (n = 20) compared with mondoa-mo alone injected embryos (n = 25). Scale bar: 0.2 mm. Asterisks label the blastoderm margin, arrowhead indicates germ ring/shield-like thickening. Error bars = SEM; *, p≤0.05; **, p≤0.01; ***, p≤0.001. hpf, hours post fertilization.
Figure 2—figure supplement 1

MO-mediated knockdown of chrebp and additional mondoa MO control experiments.
(A) Phenotypes of uninjected and water (CTR) injected embryos are indistinguishable from chrebp-mo injected embryos at bud stage (10 hpf). (B) Determination of the knockdown efficiency of the chrebp-mo. A reporter construct consisting of a part of the chrebp sequence around the transcription start site (+26/–34) cloned in front of a GFP reporter was co-injected with chrebp-mo or water (CTR) as a control. chrebp-mo injection efficiently abolished GFP expression in embryos. (C) Co-injection of an mRNA construct consisting of a part of the mondoa sequence around the transcription start site (−36/+20) cloned in front of a GFP reporter together with either mondoa-mis or mondoa-mo. mondoa-mo injection efficiently abolished GFP expression in embryos (n = 34), in contrast to mondoa-mis injection (n = 18). (D) Co-injection of a MO directed against p53 (p53–mo) and mondoa-mo (each 1 mM) did not alter the epiboly delay/arrest phenotype (n = 10/10, 100%). Abbreviations: BF, brightfield; GFP, GFP channel.
Figure 3 with 1 supplement
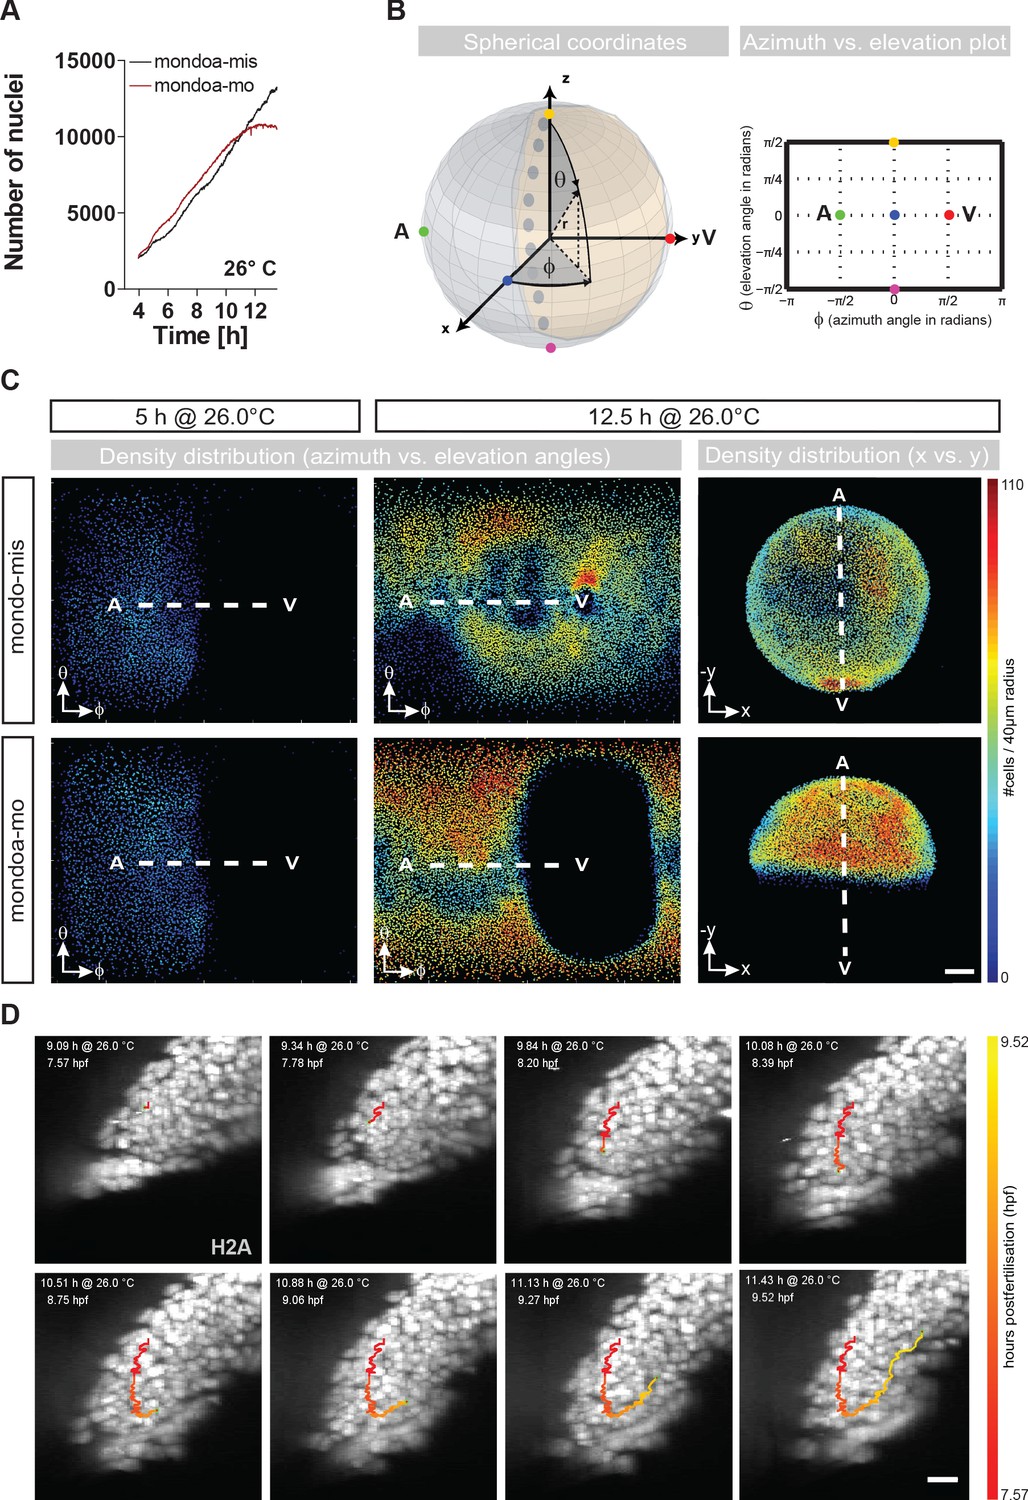
mondoa knockdown does not impair cell division or internalization movements.
(A) Nuclei numbers over time in hours of mondoa-mis (black trace) and mondoa-mo (red trace) injected Tg(h2afva:h2afva-GFP) embryos. (B) Scheme illustrating the transformation of Cartesian coordinates of nuclei positions extracted from the DSLM image data into a two-dimensional plot of azimuth vs. elevation angles. For details, see Materials and methods section. (C) Cell density plots of mondoa-mis and mondoa-mo injected embryos after 5 and 12.5 hr of imaging using an azimuth vs. elevation angle plot to unwrap the embryos. For comparison, a projection of x and y Cartesian coordinates is also shown for the 12.5 hr data. Cell density is color-coded (number of cells/40 µm radius). (D) DSLM time lapse video stills from Video 5 of a morphant embryo. The trace of a single cell determined by automated cell nucleus tracking is highlighted (red to yellow). Scale bar, 20 µm.
Figure 3—figure supplement 1
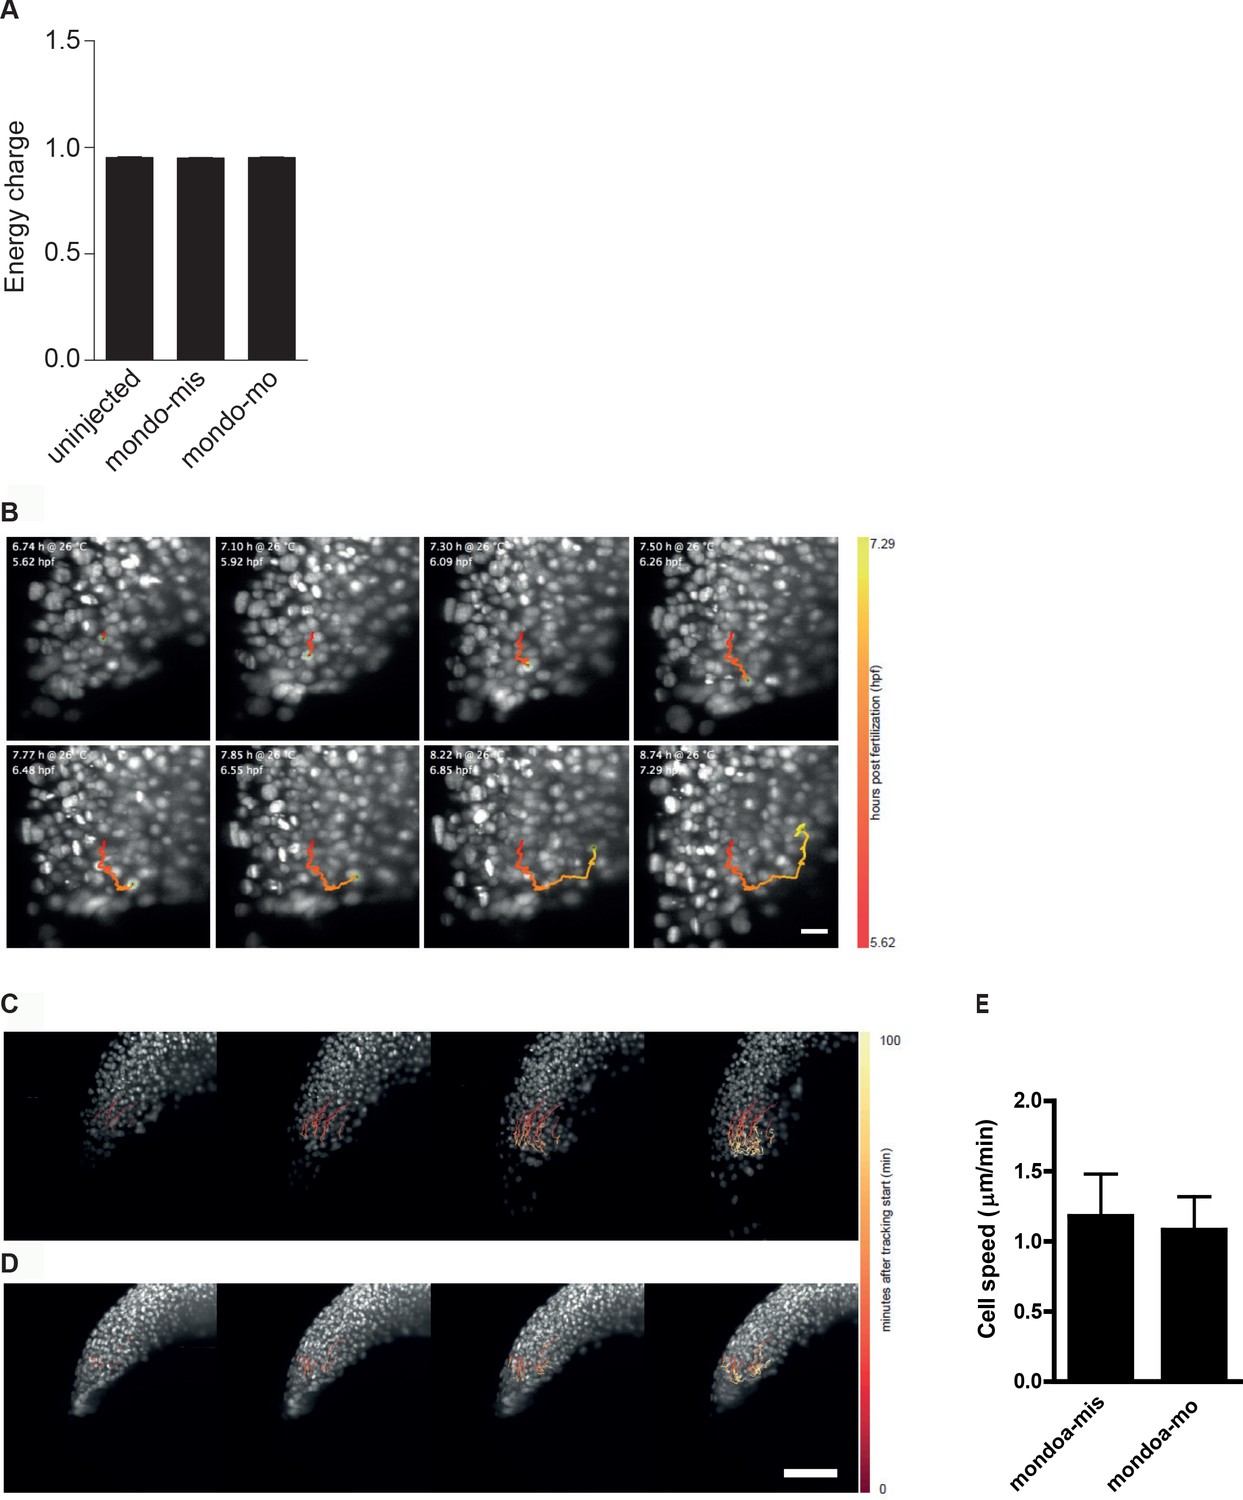
Energy charge in sphere stage embryos as well as internalization and movement speed of deep cells are not affected in mondoa morphants.
(A) Energy charge values [([ATP] + 0.5 [ADP])/([ATP] + [ADP] + [AMP])] at sphere stage as calculated for uninjected embryos, embryos injected with mondoa-mis and embryos injected with mondoa-mo showed no significant differences between the three conditions (One-way-ANOVA, p=0.4287). (B) Still images of internalization of cells in control injected embryo (Video 6). Traces of single cells determined by automated cell nucleus tracking are highlighted (timescale in hpf: red to yellow). (C–E) Movement speed of deep cells is not altered in mondoa-mis (C, E) and mondoa-mo injected embryos (D, E). p=0.6743.
Figure 4 with 1 supplement
MondoA function in the YSL contributes to epiboly.
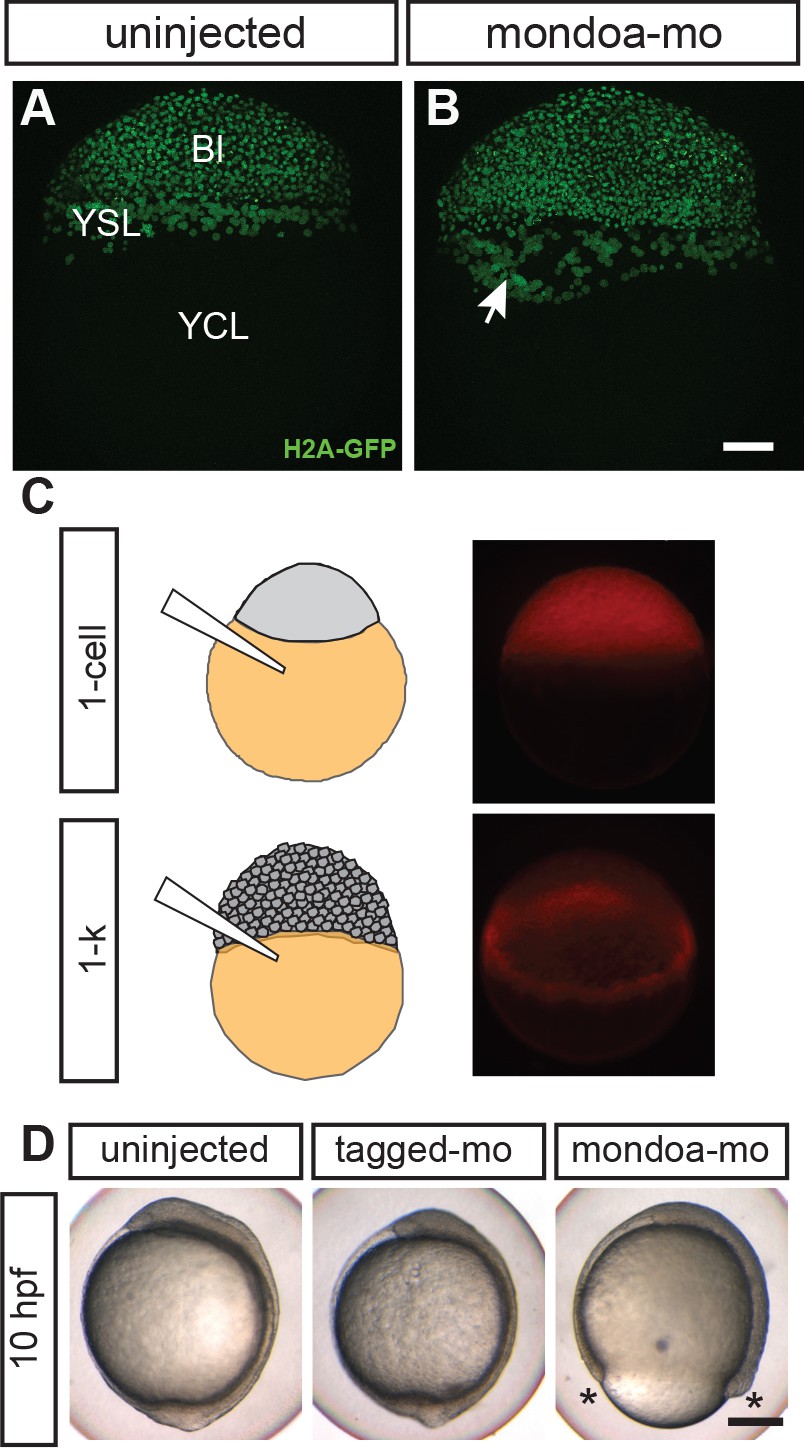
(A, B) Confocal images of Tg(h2afva:h2afva-GFP) embryos injected with mondoa-mo (B, n = 5) and uninjected controls (A, n = 5). Arrow: disordered YSL nuclei. YCL, yolk cytoplasmic layer, Bl, blastoderm. Scale bar: 100 µm. (C) Distribution of MOs upon injection at the zygote or 1 k-cell stages, as indicated in the schematic. Injection of mondoa-mo together with a lissamine-tagged fluorescent MO of unrelated sequence (tagged-mo) into the yolk of 1 cell stage eggs leads to fluorescence in the entire embryo, whereas injection of the MOs into the yolk cell of the 1 k-cell stage embryos limits fluorescence to the YSL. (D) Embryos injected at the 1 k-cell stage with the indicated MOs shown when the uninjected control (n = 29/29, 100%) was at bud stage. All mondoa-mo injected embryos were arrested in epiboly (~75% epiboly stage; n = 9/9, 100%), while embryos injected with tagged-mo alone were unaffected (n = 12/12, 100%). Scale bar: 0.2 mm. Asterisks label the blastoderm margin. hpf, hours post fertilization.
Figure 4—figure supplement 1
EVL epiboly and integrity, endocytic vesicle formation at the marginal rim and overall blastoderm patterning are not severely perturbed in mondoa morphants.
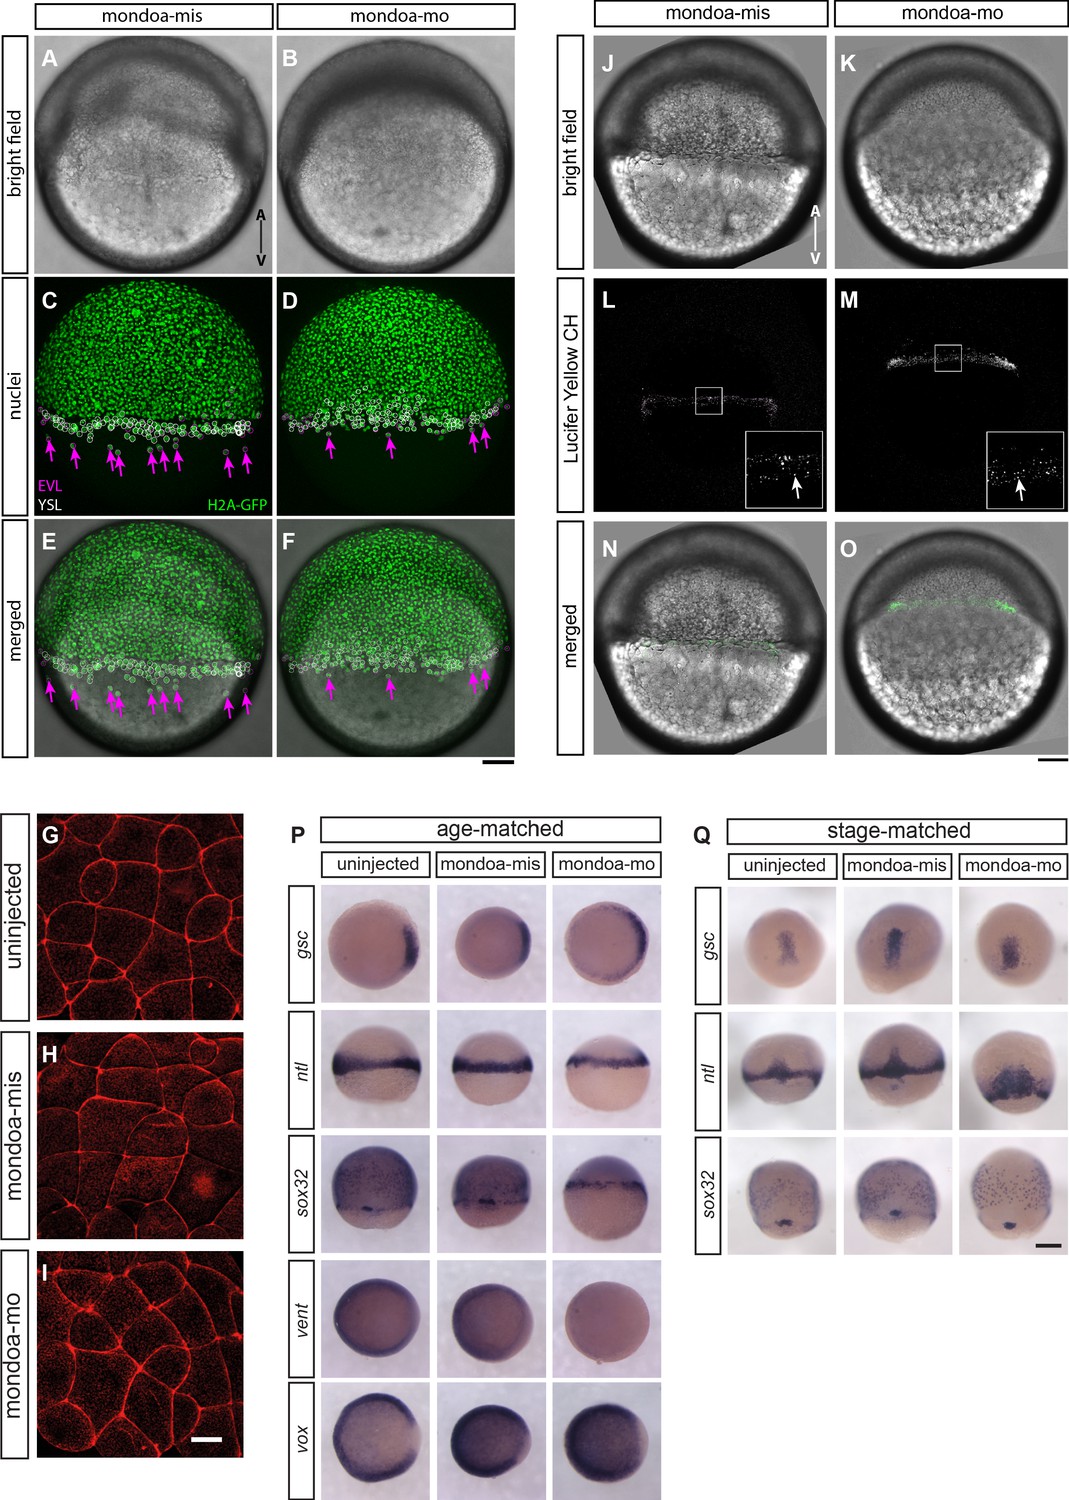
(A–F) Tg(h2afva:h2afva-GFP) (H2A-GFP) transgenic embryos were injected with either mondoa-mis (A, C and E) or mondoa-mo (B, D and F) at the one-cell stage. Phenotypes of representative embryos among those analyzed (n = 2 for mondoa-mis and n = 9 for mondoa-mo) at seven hpf are shown. (A, B) Brightfield images. (C, D) GFP channel. The positions of EVL- and YSL-nuclei as identified by confocal reflection images are shown with magenta and white circles, respectively. The arrows (magenta) indicate EVL nuclei vegetal to the blastoderm margin. (E, F) Bright field images merged with H2A-GFP positive nuclei. Animal pole up. Scale bar: 100 µm. (G–I) Phalloidin stainings of uninjected (G), mondoa-mis injected (H) and mondoa-mo injected (I) embryos, view of the lateral EVL at around sphere stage. No differences in cell shape or staining integrity are apparent between the three conditions. Scale bar: 22 µm. (J–O) Embryos were injected with either mondoa-mis (J, L and N; n = 6) or mondoa-mo (K, M and O; n = 5). (J, K) Brightfield images. (L, M) Lucifer Yellow CH-positive endocytic vesicles were observed at the marginal rim in both mondoa-mis injected embryos (L) and mondoa-mo morphants (M). The inset at the bottom right is a magnified view of the region in the white rectangle. The arrow (white) indicates the endocytic vesicles. (N, O) Bright field images merged with Lucifer Yellow CH-positive vesicles (green). Animal pole up. Scale bar: (J–O) 100 µm; insets in L and M: 33 µm. (P, Q) WISH against different patterning markers in uninjected embryos and in embryos injected with mondoa-mis or mondoa-mo. Markers examined were: no tail (ntl; for mesoderm; Schulte-Merker et al., 1994), goosecoid (gsc; for dorsal mesendoderm/organizer; Stachel et al., 1993), SRY-box containing gene 32 (sox32; for endoderm; Dickmeis et al., 2001; Kikuchi et al., 2001), and the ventral markers ventral homeobox (vox) and ventral expressed homeobox (vent) (Melby et al., 2000). To control for pattern changes caused only by developmental delay, we either fixed the embryos all at the same time since fertilization (i.e., age-matched) or at the same stage regardless of the developmental time elapsed until the stage was reached (i.e., stage-matched; in this case the MO dose had to be lowered to allow for further development of the morphants). (P) gsc expression is slightly expanded in the morphants in age-matched embryos, and vent expression is strongly reduced. Expression of vox, which functions redundantly with vent (Imai et al., 2001), only shows a slightly larger gap in the dorsal area. The patterns of the other germ layer markers appear indistinguishable from the controls. Embryos were fixed when uninjected controls had reached shield stage (gsc, ntl, vox, vent) or 70% epiboly (sox32). (Q) In stage-matched embryos, only ntl expression shows a slightly broadened expression in the morphants, potentially indicating difficulties with convergence/extension movements, with no changes observed for the other markers examined. Thus, sox32 expression shows normal expression domains in endoderm precursors and forerunner cells. Stages were 60% epiboly (gsc, ntl) and 80% epiboly (sox32). Scale bar: 0.2 mm.
Figure 5 with 1 supplement
MondoA function mediates epiboly via the cholesterol synthesis pathway.
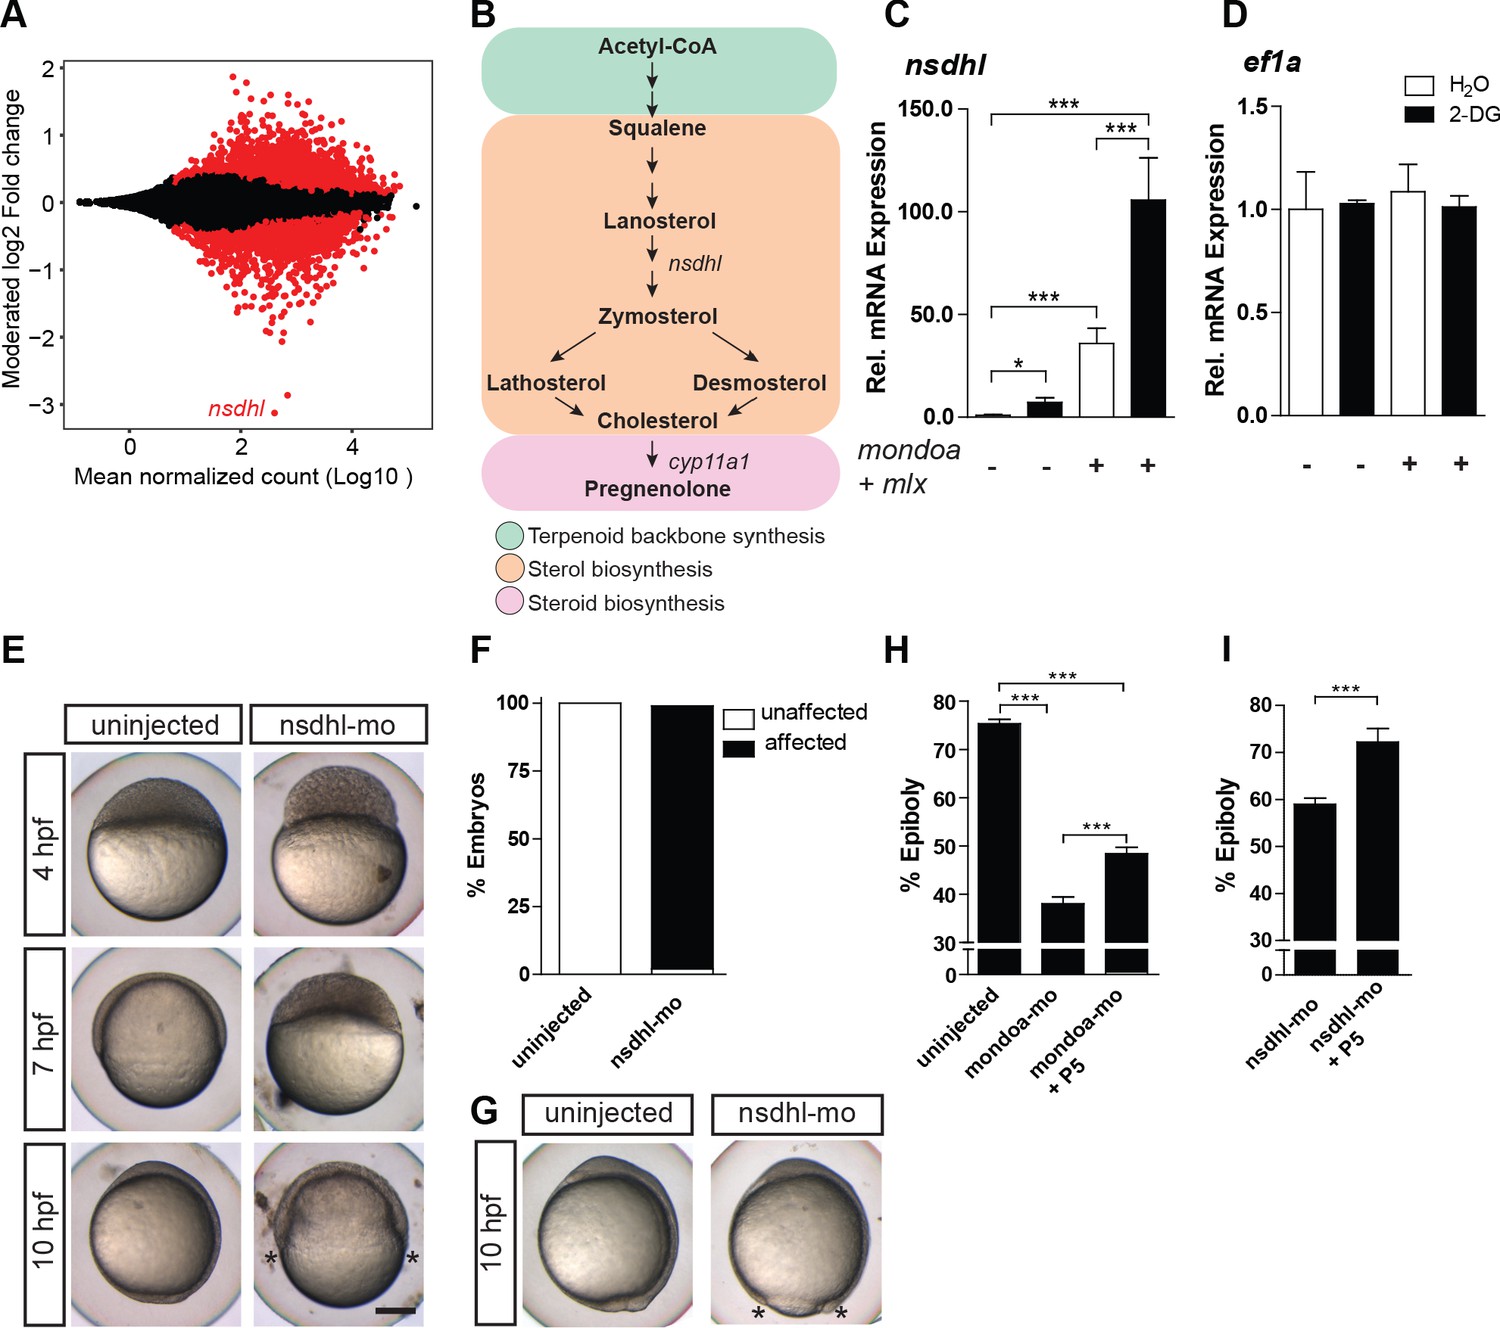
(A) Plot of the moderated log2 fold change (mondoa-mo vs. mondoa-mis injected embryos) over averaged normalized counts. The most downregulated gene nsdhl is indicated. (B) The main steps in the conversion of acetyl coenzyme A (acetyl-CoA) to cholesterol and pregnenolone. (C, D) Transcript levels of nsdhl (C) and ef1a (D) of embryos injected with water (white bars) as a control or with the glucose analog 2-deoxy-D-glucose (2-DG; black bars) in the presence (+) or absence (-) of mondoa and mlx mRNA (n = 9). (E) Embryos injected with a splice-site MO against nsdhl (nsdhl-mo) show a severe developmental delay and arrest at ~50% epiboly, when uninjected controls were at bud stage (~10 hpf). (F) Quantification of the experiments in (E). Percentages of ‘affected’ embryos: uninjected (0/84, 0%), nsdhl-mo injected (n = 136/141, 96.5%). (G) Injection of nsdhl-mo into 1 k cell stage embryos led to arrest at 95% epiboly (n = 11/11, 100%), when uninjected control embryos (n = 15/15, 100%) were at bud stage (10 hpf). (H,I) Percentage of epiboly progression under different treatments determined via no tail (ntl) WISH. (H) Uninjected control embryos (n = 30) were fixed at the 75% epiboly stage along with the treated embryos. Treatment with 20 µM pregnenolone (P5) led to a partial rescue of the mondoa morphants (n = 19), which achieved 48% epiboly (untreated morphants: 38% epiboly; n = 25). Control and mondoa-mo morphant results are reproduced from Figure 2E, as these experiments were carried out in parallel. (I) P5 treatment also led to a partial rescue of the nsdhl morphants (n = 30, 74.6% epiboly compared to 59.0% in untreated morphants, n = 50). Asterisks label the blastoderm margin. Scale bar: 0.2 mm. Error bars represent SEM; *, p≤0.05; **, p≤0.01; ***, p≤0.001.
Figure 5—figure supplement 1
RNA-seq analysis of mondoa-mo vs.mondoa-mis injected embryos identifies nsdhl as a major MondoA target gene.
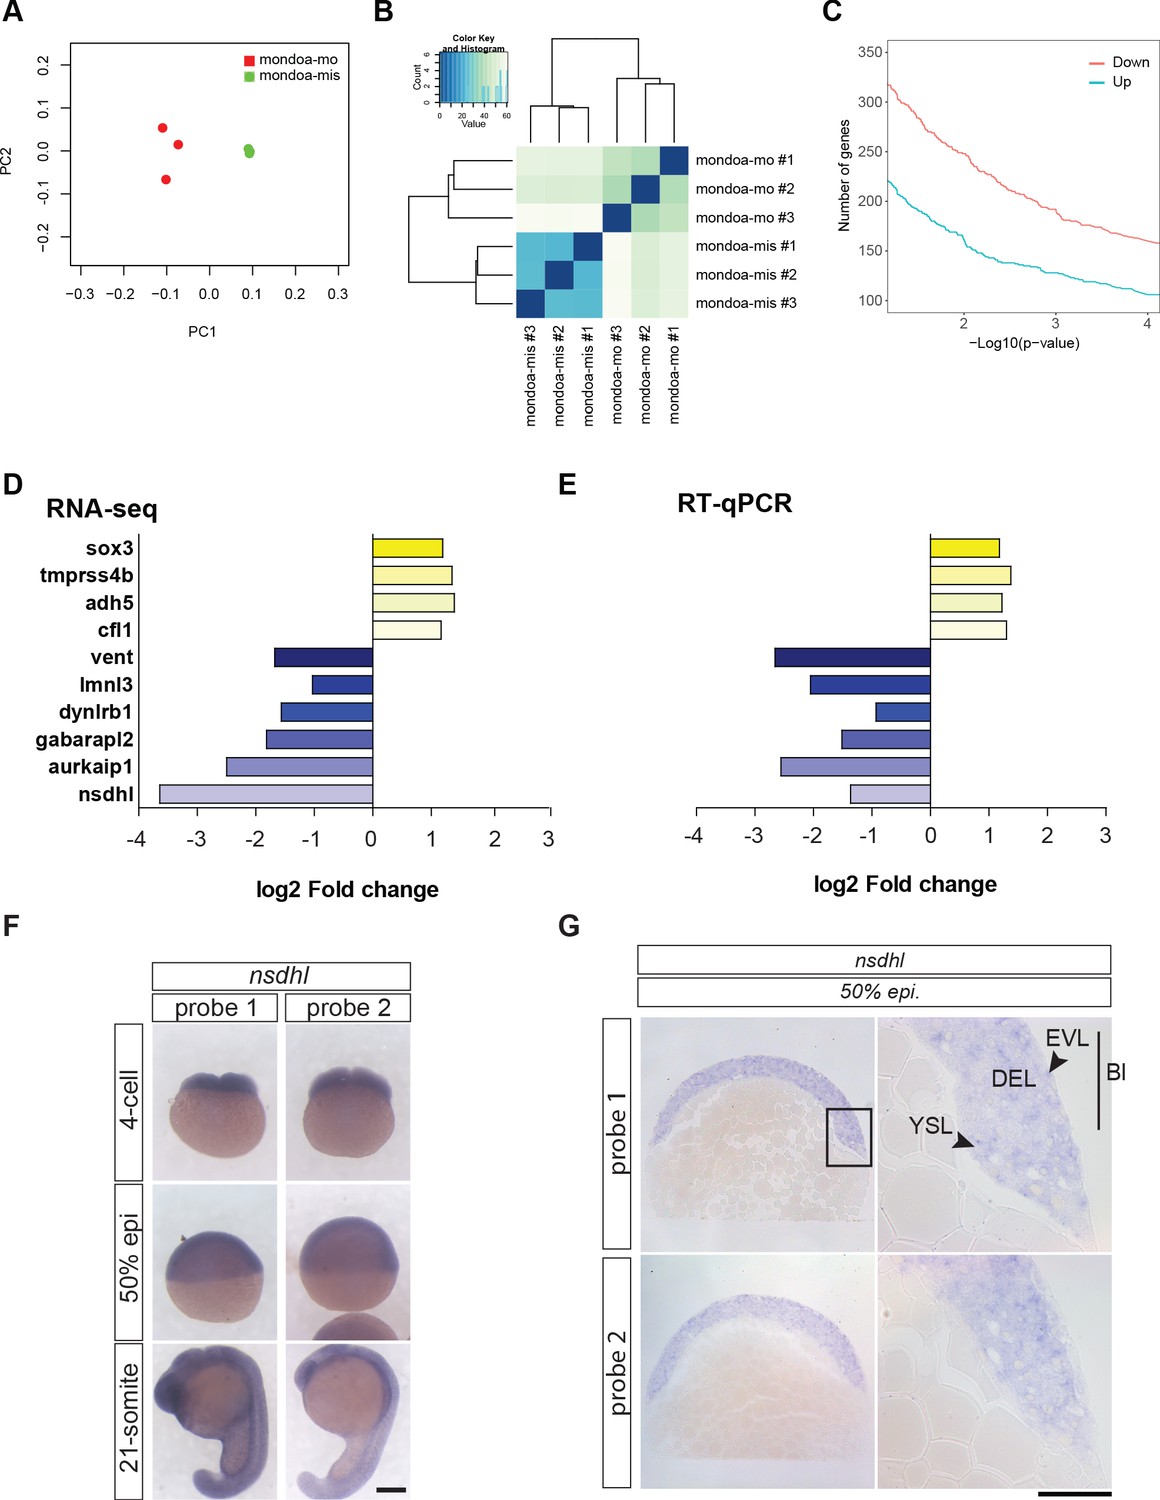
(A) Principal component analysis (PCA) plot of the first two principal components (PC one and PC 2) to visualize the overall structure of the data. It resolves the two treatment groups mondoa-mo injected (red) and mondoa-mis injected (green), thereby revealing a clear alteration of the morphant transcriptome. Biological replicates cluster closely together in this analysis, indicating good reproducibility and absence of batch effects. (B) Heatmap visualizing the Euclidean distance between the sequenced samples. The samples of the treatment groups form separate clusters. (C) Number of upregulated (blue) and downregulated (pink) genes with a log2 fold change of at least 1 and –1, respectively. (D, E) Validation of the RNA-seq data using RT-qPCR. Bar diagrams showing log2 fold change of expression levels between embryos injected with mondoa-mo and mondoa-mis injected controls for ten randomly chosen differentially expressed genes as determined by RNA-seq (D) and RT-qPCR (E, n = 3). Abbreviations: sox3, SRY-box containing gene 3; tmprss4b, transmembrane protease serine 4b; adh5, alcohol dehydrogenase 5; cfl1, cofilin 1; vent, ventral expressed homeobox; lmnl3, lamin L3; dynlrb1, dynein light chain roadblock-type 1; gabarapl2, GABA(A) receptor-associated protein-like 2; aurkaip1, aurora kinase A interacting protein 1; nsdhl, NAD(P) dependent steroid dehydrogenase-like. Note also that reduction of vent expression was independently verified by WISH (Figure 4—figure supplement 1P). (F) Analysis of spatial distribution of nsdhl transcripts at 4 cell, 50% epiboly (50% epi) and 21 somite stages by WISH. Expression was detected in the blastodisc and is ubiquitous during later stages. Scale bar: 0.2 mm. (G) Epon sections of 50% epiboly (50% epi.) stage embryos show nsdhl expression in the enveloping layer (EVL) and in the deep cell layer (DEL) of the blastoderm (Bl) as well as in the yolk syncyctial layer (YSL). Scale bar: 0.2 mm left panels and 50 µm right panels. The same staining pattern was observed for two probes directed against different portions of the transcript (probe 1 and probe 2).
Figure 6
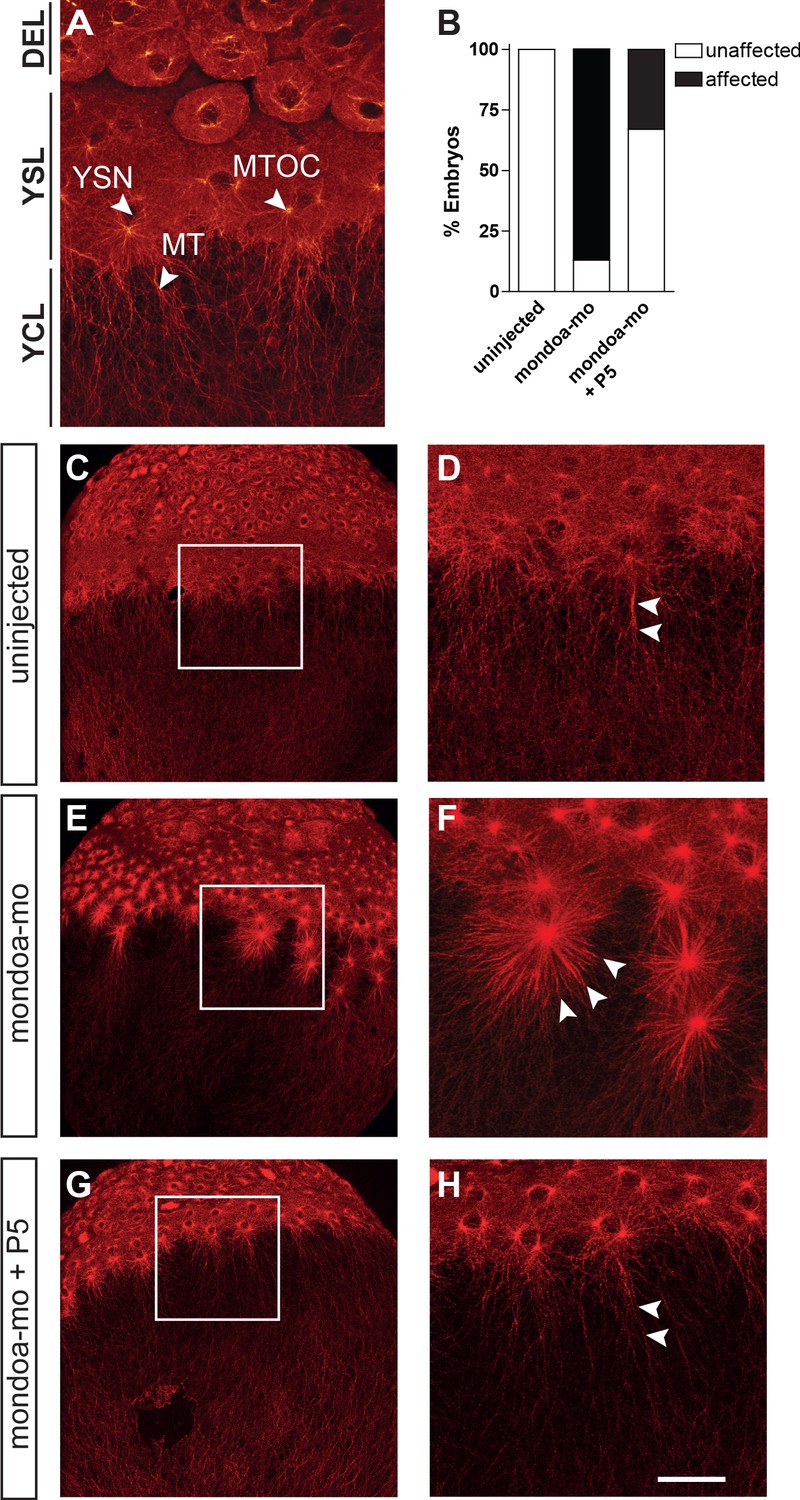
Knockdown of mondoa affects microtubule stability.
(A) Confocal image of the blastoderm margin of an uninjected embryo at sphere stage; microtubules are stained with a mouse α-tubulin antibody followed by an anti-mouse Alexa Fluor 488-coupled antibody. DEL; deep cell layer; MT, microtubules; MTOC, microtubule organization center; YCL, yolk cytoplasmic layer; YSL, yolk syncytial layer; YSN, yolk syncytial layer nuclei. (B) Quantification of effects on YSL microtubule organization in uninjected (n = 9), mondoa-mo injected (n = 16), and mondoa-mo injected + pregnenolone (P5) treated (n = 9) embryos. Presence of stellar structures as shown in (F) = ‘affected’, normal appearance as in (A) = ‘unaffected’. (C–H) Overview (C, E, G) and close-up (D, F, H) images of uninjected embryos (C, D), mondoa-mo morphants (E, F) and P5 treated mondoa-mo morphants (G, H). Arrowheads indicate long parallel MT in uninjected and P5 rescued embryos (D, H) and short MT asters in untreated morphants (F). Scale bar: 90 µm; for higher magnifications, 30 µm.
Figure 7 with 2 supplements
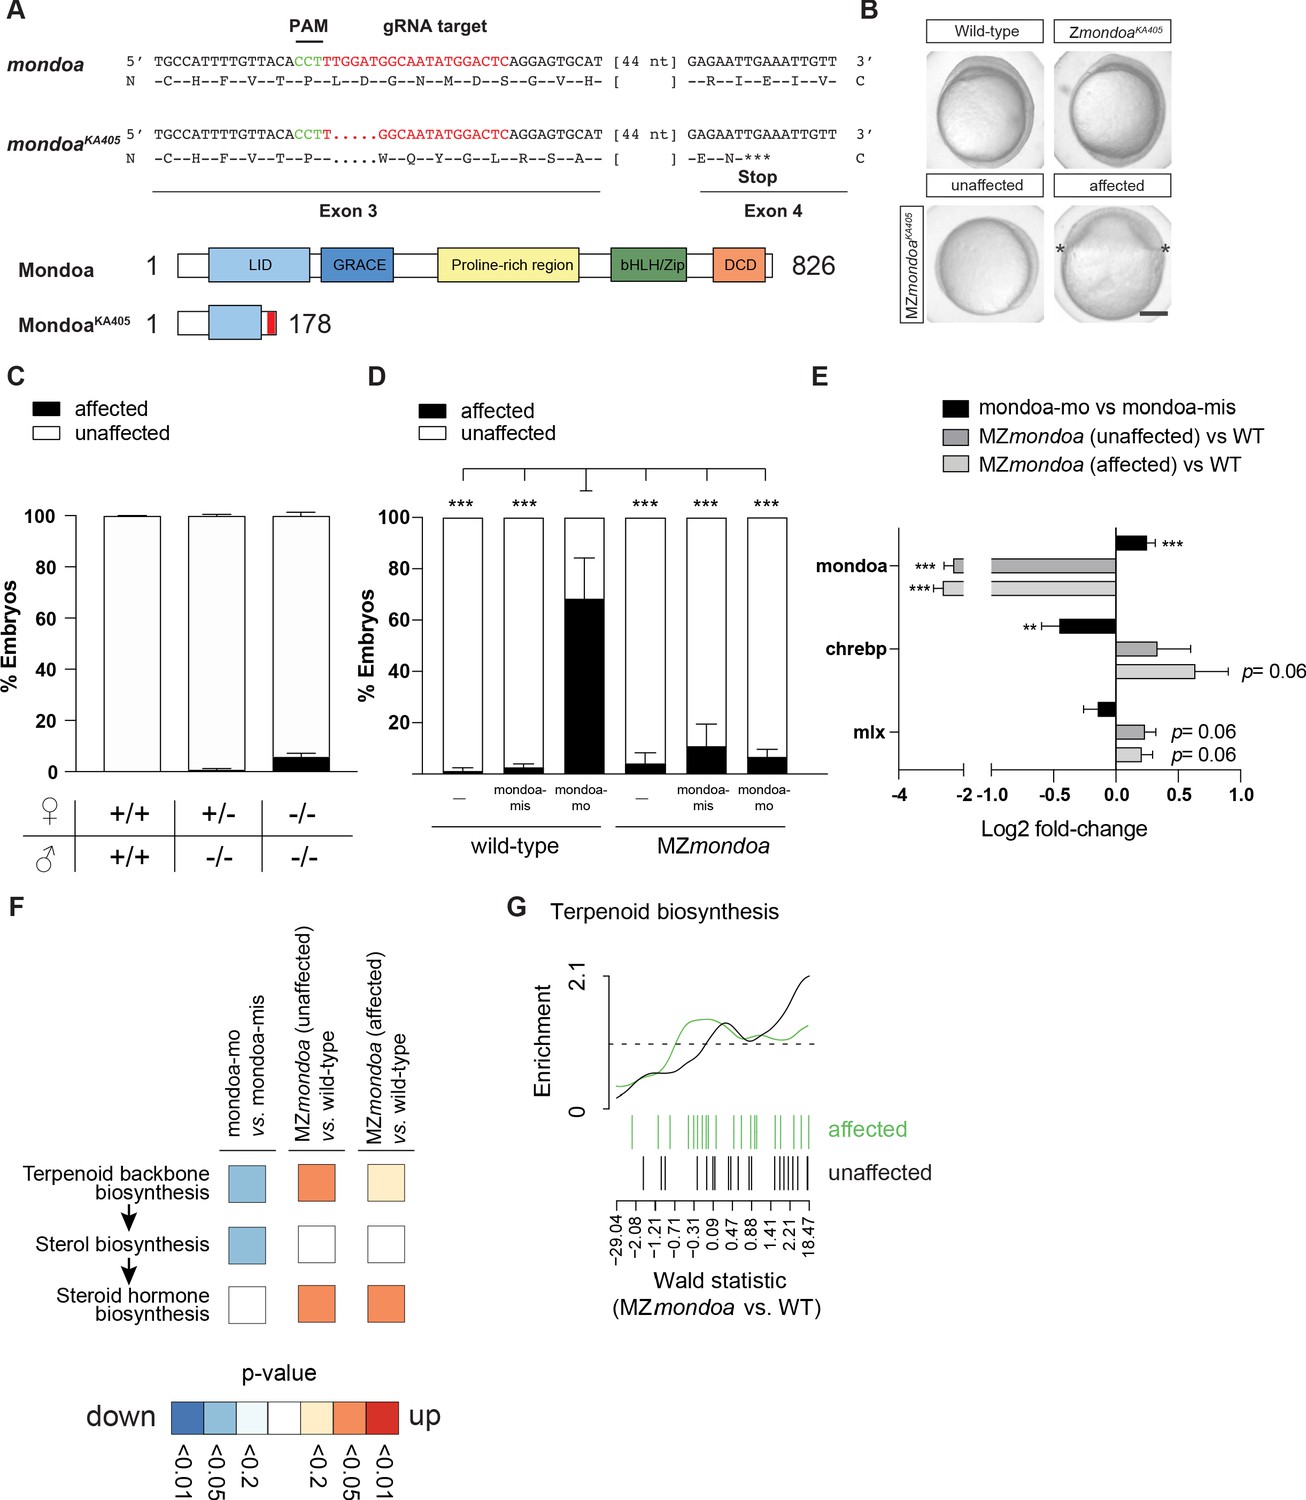
MZmondoa mutants show epiboly defects and compensatory gene expression changes in the terpenoid backbone biosynthesis pathway.
(A) Genetic disruption of the mondoa (mlxip) locus in zebrafish led to a 5 bp deletion in exon three causing a frameshift in the coding sequence and a predicted premature stop. (B) Representative images of zygotic homozygous mutants (ZmondoaKa405) and maternal-zygotic mutants (MZmondoaKa405). (C) Quantification of epiboly phenotypes. On average 5.09 ± 1.25% of MZmondoa mutants (n = 249/5119 embryos) showed an aberrant epiboly phenotype compared to 0.10 ± 0.07% in wild-type (WT; n = 1/1016 embryos) and 0.71 ± 0.39% in Zmondoa mutant embryos (n = 3/549 embryos). (D) MZmondoa mutants exhibited resistance to epiboly perturbance caused by mondoa-mo, confirming specificity of the morphant phenotype (n = 3, ≥18 embryos/replicate and condition, treatment/genotype combinations blinded for analysis). (E–H) RNA-seq gene expression analysis in mondoa-mo vs. mondoa-mis injected embryos (n = 3, ≥20 embryos/replicate) and MZmondoa mutants vs. WT embryos (n = 3, 8–10 embryos/replicate). (E) Differential gene expression of mondoa, chrebp and mlx in morphants and MZmondoa mutants with (affected) and without (unaffected) aberrant epiboly phenotype. (F) Heatmap illustrating the statistical overrepresentation of pathway associations for morphant (mondoa-mo vs. mondoa-mis) or mutant embryos (MZmondoa vs. WT) affected or unaffected in epiboly. (G). Overlaid barcode plots illustrating the enrichment for differential gene expression compared to controls for terpenoid backbone biosynthesis genes. MZ mondoa mutants with unaffected epiboly (black) display a coordinated upregulation of genes associated with terpenoid biosynthesis. MZmondoa mutants that are affected in epiboly (green) lack this coordinated upregulation. Error bars represent SEM; *, p≤0.05; **, p≤0.01; ***, p≤0.001.
Figure 7—figure supplement 1
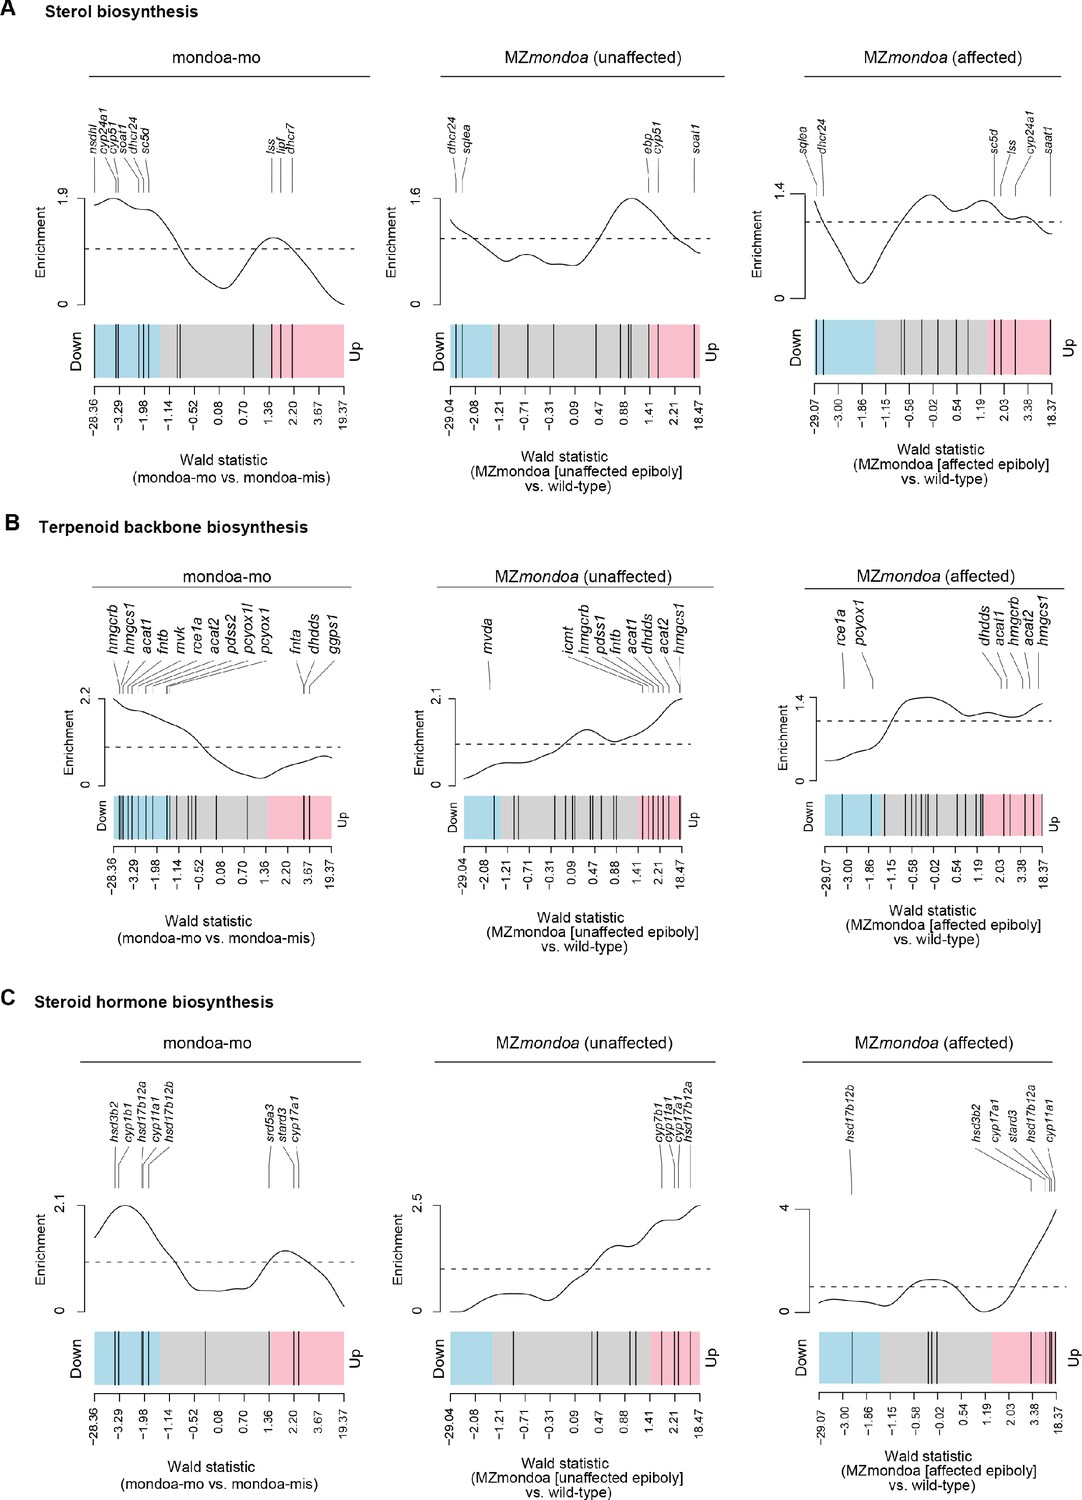
Gene set enrichment analysis of cholesterol related pathways in mondoa morphants and mutants.
Barcode plots illustrating the enrichment for sterol biosynthesis (A), terpenoid backbone biosynthesis (B) or steroid hormone biosynthesis (C) genes for differential gene expression compared to controls in mondoa-mo injected embryos (left) and maternal-zygotic mondoa mutants (MZmondoa) without (‘unaffected’, middle) or with (‘affected’, right) aberrant epiboly phenotype.
Figure 7—figure supplement 2
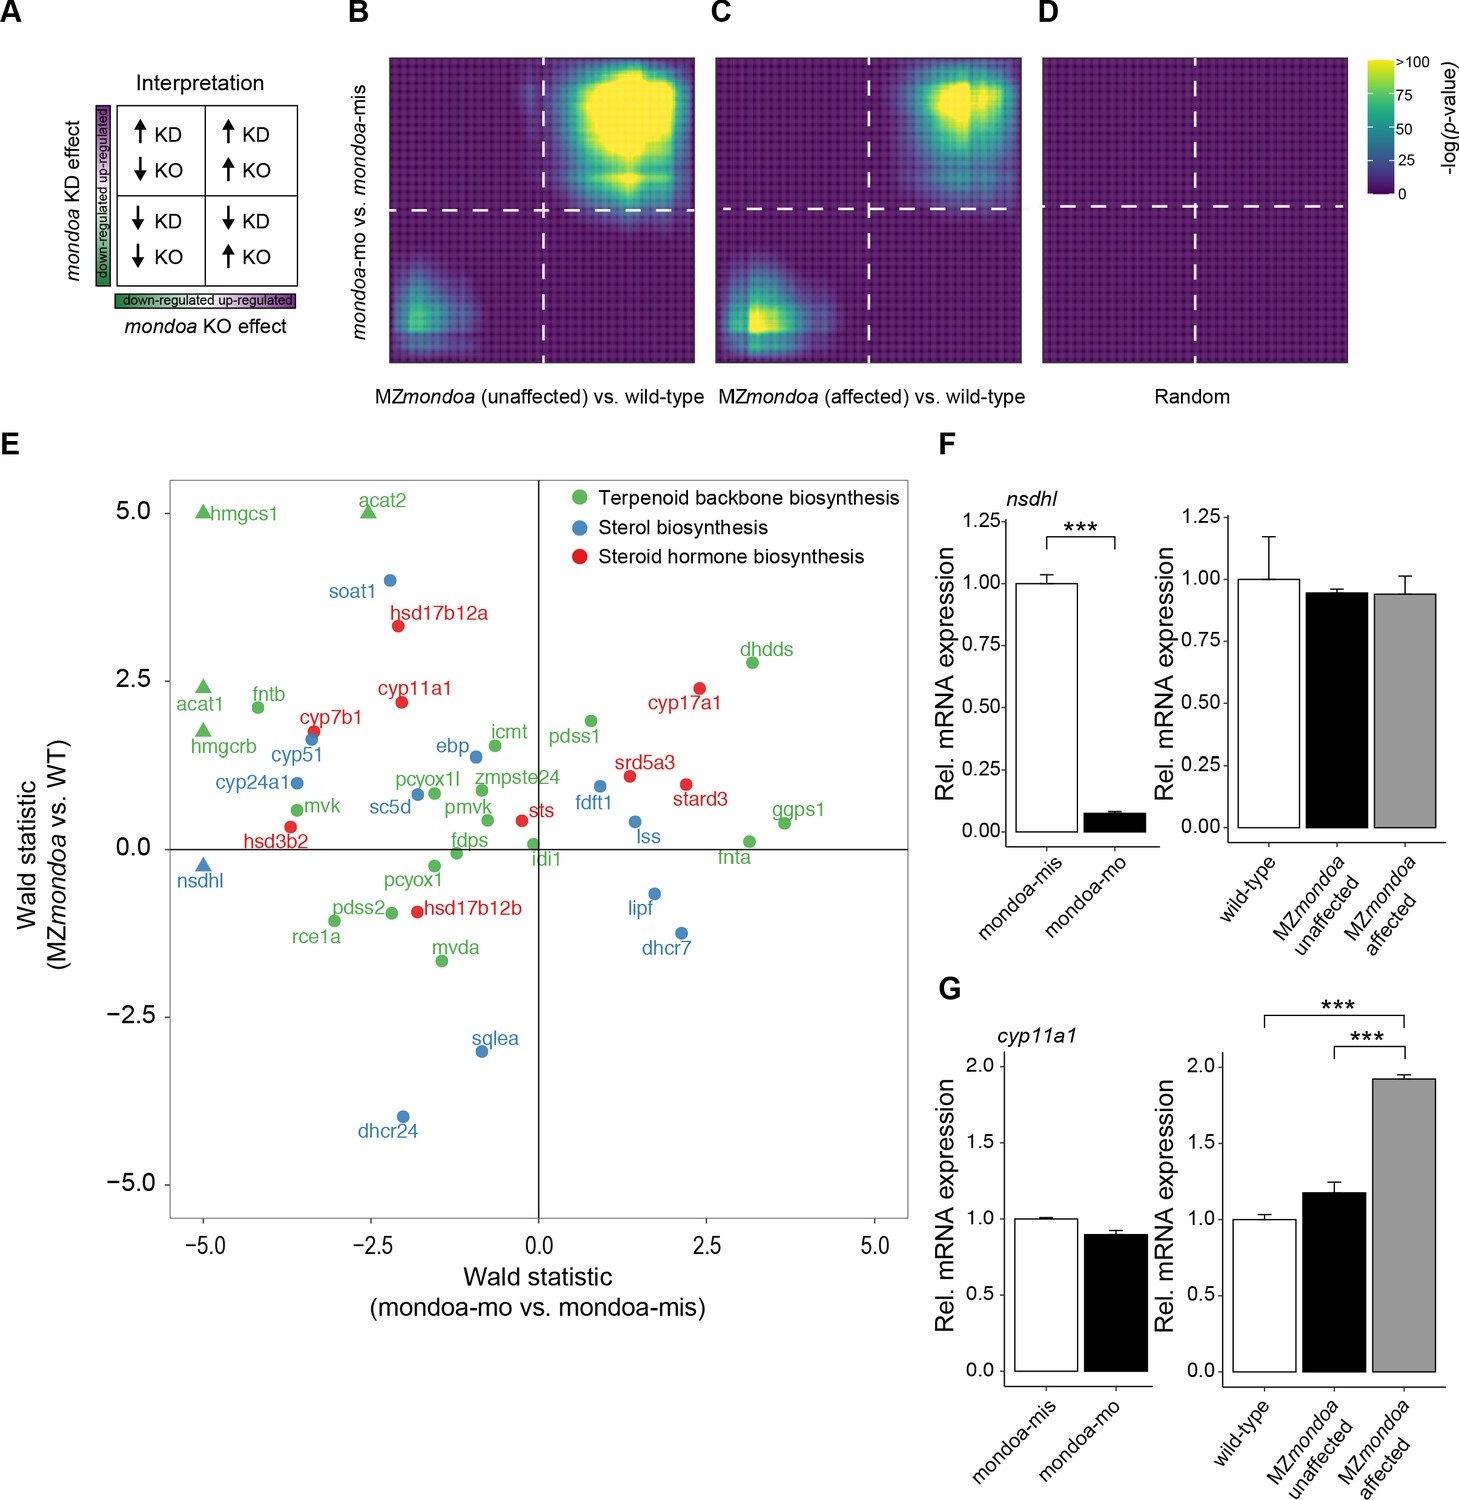
Overlaps and differences between mondoa morphants and mutants in genes differentially expressed compared to controls.
(A) Schematic to ease the interpretation of the adjacent rank-rank hypergeometric overlap (RRHO) plots allowing to compare the overlaps in gene expression changes induced by mondoa knockout (KO, MZmondoa) or mondoa knockdown (KD). (B) RRHO plot comparing differential gene expression of mondoa-mo vs. mondoa-mis injected (y-axis) embryos and MZmondoa mutants with unaffected epiboly vs. wild-type embryos (x-axis). (C) RRHO plot comparing differential gene expression of mondoa-mo vs. mondoa-mis injected (y-axis) embryos and MZmondoa mutants with affected epiboly phenotype vs. wild-type embryos (x-axis). (D) RRHO plot comparing differential gene expression of mondoa-mo vs. mondoa-mis injected embryos with a randomly ordered gene list. (E) Wald statistic of mondoa-mo vs. mondoa-mis injected embryos (x-axis) and unaffected MZmondoa mutants vs. wild-type (WT) embryos (y-axis). Genes with a value >5 are represented by a triangle. (F, G) Expression of nsdhl (F) and cyp11a1 (G) in mondoa-mo and mondoa-mis injected embryos and in MZmondoa mutants affected or unaffected in epiboly and wild-type control embryos. nsdhl expression is compensated in MZmondoa mutants. cyp11a1 expression is upregulated in both mutants, reaching higher levels in mutants with affected epiboly.
Author response image 1
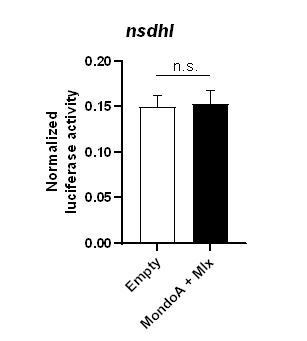
Normalized luciferase expression in PAC2 zebrafish cells (n=4/condition) transiently overexpressing a 1kbp promoter region of the nsdhl gene in the absence (empty) or presence of mondoa and mlx overexpression in cells treated with 12 mM glucose.
Author response image 2
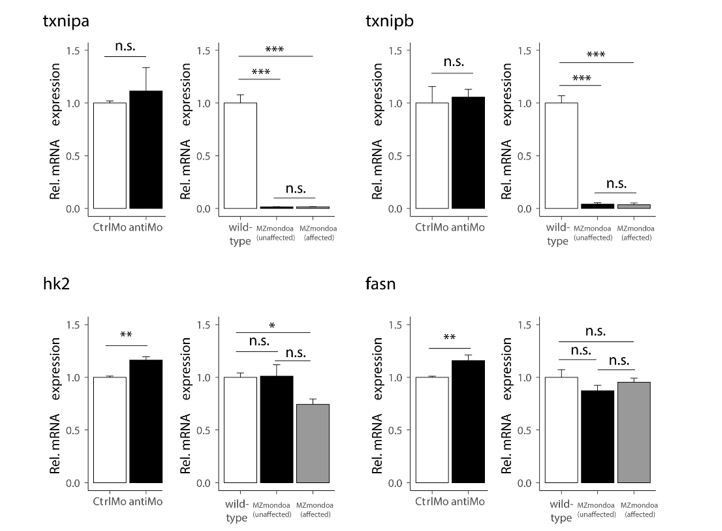
Gene expression of MondoA targets in mondoa morphants and MZmondoa mutants.
Videos
Video 1
Time-lapse video microscopy of a wild-type embryo and a mondoa morphant (brightfield).
Lateral view, animal pole is on top. Wild-type embryo (left), mondoa morphant (right). Imaging was performed at an ambient temperature of 26°C. Time between frames 2.1 min. Scale bar: 65 µm.
Video 2
DSLM time-lapse video microscopy of epiboly of a mondoa-mis and a mondoa-mo injected Tg(h2afva:h2afva-GFP) embryo.
Lateral view, animal pole is on top. mondoa-mis (left), mondoa-mo (right). Imaging was performed at an ambient temperature of 26°C. Time between frames 1.0 min. Scale bar: 100 µm.
Video 3
Cell density plot of a mondoa-mis and a mondoa-mo injected Tg(h2afva:h2afva-GFP) embryo (2D projection of azimuth and elevation angles).
2D projection using spherical coordinates of the origin centered nuclei positions of a mondoa-mis (left) and a mondoa-mo (right) injected embryo. Azimuth and elevation angles are plotted on the x and y axis, respectively, and the cell density is indicated by the color code (transition from blue to red indicates increasing density). Animal pole is on the left.
Video 4
Cell density plot of a mondoa-mis and a mondoa-mo injected Tg(h2afva:h2afva-GFP) embryo (projection of x and y Cartesian coordinates).
Projection using Cartesian x and y coordinates of the origin centered nuclei positions of a mondoa-mis (left) and a mondoa-mo (right) injected embryo. The cell density is indicated by the color code (transition from blue to red indicates increasing density). Animal pole is on the top.
Video 5
DSLM time-lapse video microscopy with cell tracking of the blastoderm edge of a mondoa morphant Tg(h2afva:h2afva-GFP) embryo.
Lateral view, animal pole is on top. Imaging was performed at an ambient temperature of 26°C. Time between frames 1.0 min. The trace of an individual cell determined by automated cell nucleus tracking is highlighted (red to yellow), revealing its internalization and migration towards the animal pole despite epiboly arrest. Scale bar: 20 µm.
Video 6
DSLM time-lapse video microscopy with cell tracking of the blastoderm edge of a mondoa-mis–injected control Tg(h2afva:h2afva-GFP) embryo.
Lateral view, animal pole is on top. Imaging was performed at an ambient temperature of 26°C. Time between frames 1.0 min. The trace of an individual cell determined by automated cell nucleus tracking is highlighted (red to yellow), revealing its internalization and migration towards the animal pole despite epiboly arrest. Scale bar: 20 µm.
Video 7
EVL epiboly is not affected in mondoa morphants.
Tg(h2afva:h2afva-GFP) embryos were injected at the one-cell stage with either mondoa-mis (left) or mondoa-mo (right). The epiboly phenotype was examined by confocal microscopy from 7 to 15 hpf (at 28°C). Time frames were acquired every 13 min with a 2 µm z-step size to cover ~180 µm in depth. EVL nuclei of a mondoa morphant (right), identified by the confocal reflection channel (not shown), were indicated by white circles at 10.08 hpf, the time when a mondoa-mis-injected embryo (left) reached bud stage. Note the presence of EVL nuclei (white circles) located vegetal to the blastoderm margin, indicative of unaffected EVL epiboly in mondoa morphants.
Tables
Key resources table
| Reagent type (species) or resource | Designation | Source or reference | Identifiers | Additional information |
|---|---|---|---|---|
| Gene (Danio rerio) | mlxipl | This paper | KF713494 | Sequence deposited at https://www.ncbi.nlm.nih.gov/nuccore |
| Gene (Danio rerio) | mlxip | This paper | KF713493 | Sequence deposited at https://www.ncbi.nlm.nih.gov/nuccore |
| Genetic reagent (Danio rerio) | Mlxip mutant (allele: ka405) | This paper | ZFIN ID: ZDB-ALT-180628–2 | Detailed info deposited at zfin.org |
| Cell line (Danio rerio) | PAC2 | Lin et al., 1994 | ||
| Cell line (Homo sapiens) | HepG2 | ATCC | Hep G2 [HEPG2] ATCC HB-8065 | |
| Sequence-based reagent | mondoa-mo | This paper | Morpholino | 5’-ggtattgtcgagtagccatgttaaa-3’ |
| Sequence-based reagent | mondoa-mis | This paper | Morpholino | 5’-ggtaatctccagtacccatcttaaa-3’ |
| Sequence-based reagent | nsdhl-mo | This paper | Morpholino | 5’- ctgaaacaattcacacctgtttgtc-3’ |
| Sequence-based reagent | p53-mo | Robu et al., 2007 | Morpholino | 5’-gcgccattgctttgcaagaattg-3’ |
| Sequence-based reagent | mlx-mo | This paper | Morpholino | 5’-cgcgctgttttccgtcattttggaa-3’ |
| Sequence-based reagent | chrebp-mo | This paper | Morpholino | 5’-ttctgaatactctgcttttgccatc-3’ |
| Sequence-based reagent | tagged-mo | This paper | Morpholino | 5’-gtagcttgtactcgcattcctatct-3’ |
| Recombinant DNA reagent | Plasmid constructs | This paper | Plasmid | Plasmid constructs listed in "Materials and methods" and generated for this study are available upon request from the Dickmeis laboratory |
Additional files
-
Supplementary file 1
Differentially expressed genes identified in the RNA-seq analysis.
Differentially expressed genes of mondoa-mo vs. mondoa-mis injected embryos, of MZmondoa mutants with or without epiboly phenotype vs. WT embryos and of MZmondoa mutants with epiboly phenotype vs. MZmondoa mutants without epiboly phenotype.
- https://cdn.elifesciences.org/articles/57068/elife-57068-supp1-v1.xlsx
-
Supplementary file 2
Metabolic pathway and GO term enrichment analysis for differentially expressed genes identified in the RNA-seq analysis.
- https://cdn.elifesciences.org/articles/57068/elife-57068-supp2-v1.xlsx
-
Transparent reporting form
- https://cdn.elifesciences.org/articles/57068/elife-57068-transrepform-v1.docx
Download links
A two-part list of links to download the article, or parts of the article, in various formats.
Downloads (link to download the article as PDF)
Open citations (links to open the citations from this article in various online reference manager services)
Cite this article (links to download the citations from this article in formats compatible with various reference manager tools)
MondoA regulates gene expression in cholesterol biosynthesis-associated pathways required for zebrafish epiboly
eLife 9:e57068.
https://doi.org/10.7554/eLife.57068


