Inter-domain dynamics drive cholesterol transport by NPC1 and NPC1L1 proteins
- Department of Biochemistry, Stanford University School of Medicine, United States
- Department of Chemistry, Technische Universität Berlin, Germany
- Chan Zuckerberg BioHub, United States
- Department of Chemical and Systems Biology, Stanford University School of Medicine, United States
Figures
Figure 1 with 1 supplement

Locked N-terminal domain NPC1 rescues cholesterol export from lysosomes.
(A) Domain structure of NPC1 protein. The N-terminal domain (residues 23–259 including the polyproline linker), middle lumenal domain (MLD, 372–620), and C-terminal domain (CTD, 854–1098) are colored red, blue, and yellow, respectively. (B) NPC1 residues mutated to Cys for disulfide bond formation between the polyproline linker and CTD (see inset). The location of the sterol-sensing domain is shown in orange; P691 faces the back. (C) Confocal immunofluorescence microscopy of mouse NPC1 P251C/L929C and LAMP1 proteins expressed in HeLa cells (bar, 20 μm). (D) Confocal immunofluorescence microscopy of cholesterol accumulation rescue. NPC1−/− HeLa cells were transfected with GFP-mouse NPC1-wild type or P251C/L929C plasmids for 48 h. Thirty-two hours post transfection, cells were incubated with 1 µM U18666a for 16 h; cells were briefly incubated with 10 mM methylamine hydrochloride and chased for cholesterol export for 1 h in 5% LPDS medium, followed by immediate fixation. Intrinsic GFP fluorescence and AF647-PFO* labeling are shown (bar, 20 μm). Images represent maximum intensity projections. (E) Flow cytometry of the experiment shown in (D). GFP-positive cells of similar intensity were analyzed: NPC1-/-, 497 cells; NPC1 wild type, 478 cells; P251/L929C, 1486 cells. Cell numbers were normalized for comparison. (F) Flow cytometry of a rescue experiment using the indicated constructs, carried out as in (E). GFP-positive cells were analyzed: NPC1-/-, 2968 cells; NPC1 wild type, 2358 cells; P251/L929C/P249K/P259K, 3906 cells. Flow cytometry analyzed only GFP-positive cells of similar intensity.
Figure 1—figure supplement 1
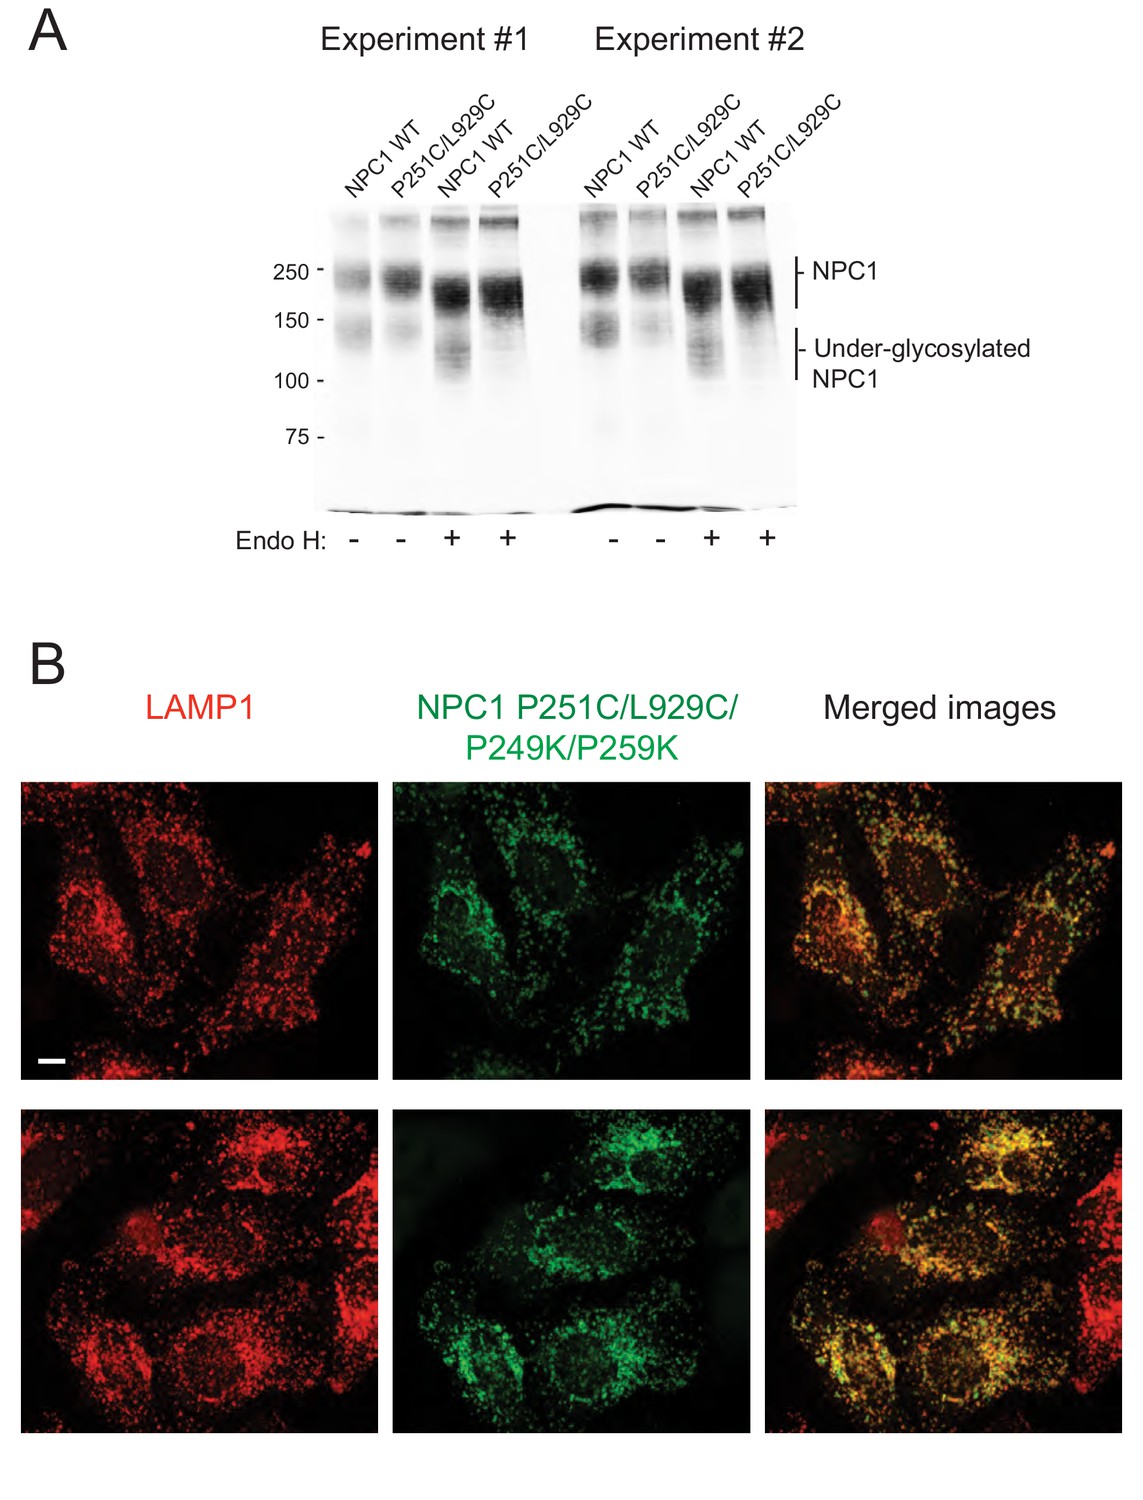
Characterization of selected mutant protein glycosylation status or localization.
(A) Two independent, representative experiments to analyze the glycosylation status of GFP-NPC1 wild type and GFP-NPC1 P251C/L929C, as determined by immunoblot of indicated samples with anti-GFP antibodies after 6% SDS PAGE; samples were incubated at 70°C in SDS PAGE sample buffer for 10 min prior to loading. Molecular weight markers are shown at left in kilodaltons here and in all subsequent gels shown. (B), Localization of NPC1 P251/L929C/P249K/P259K in NPC1−/− HeLa cells as in Figure 1C.
Figure 2 with 1 supplement
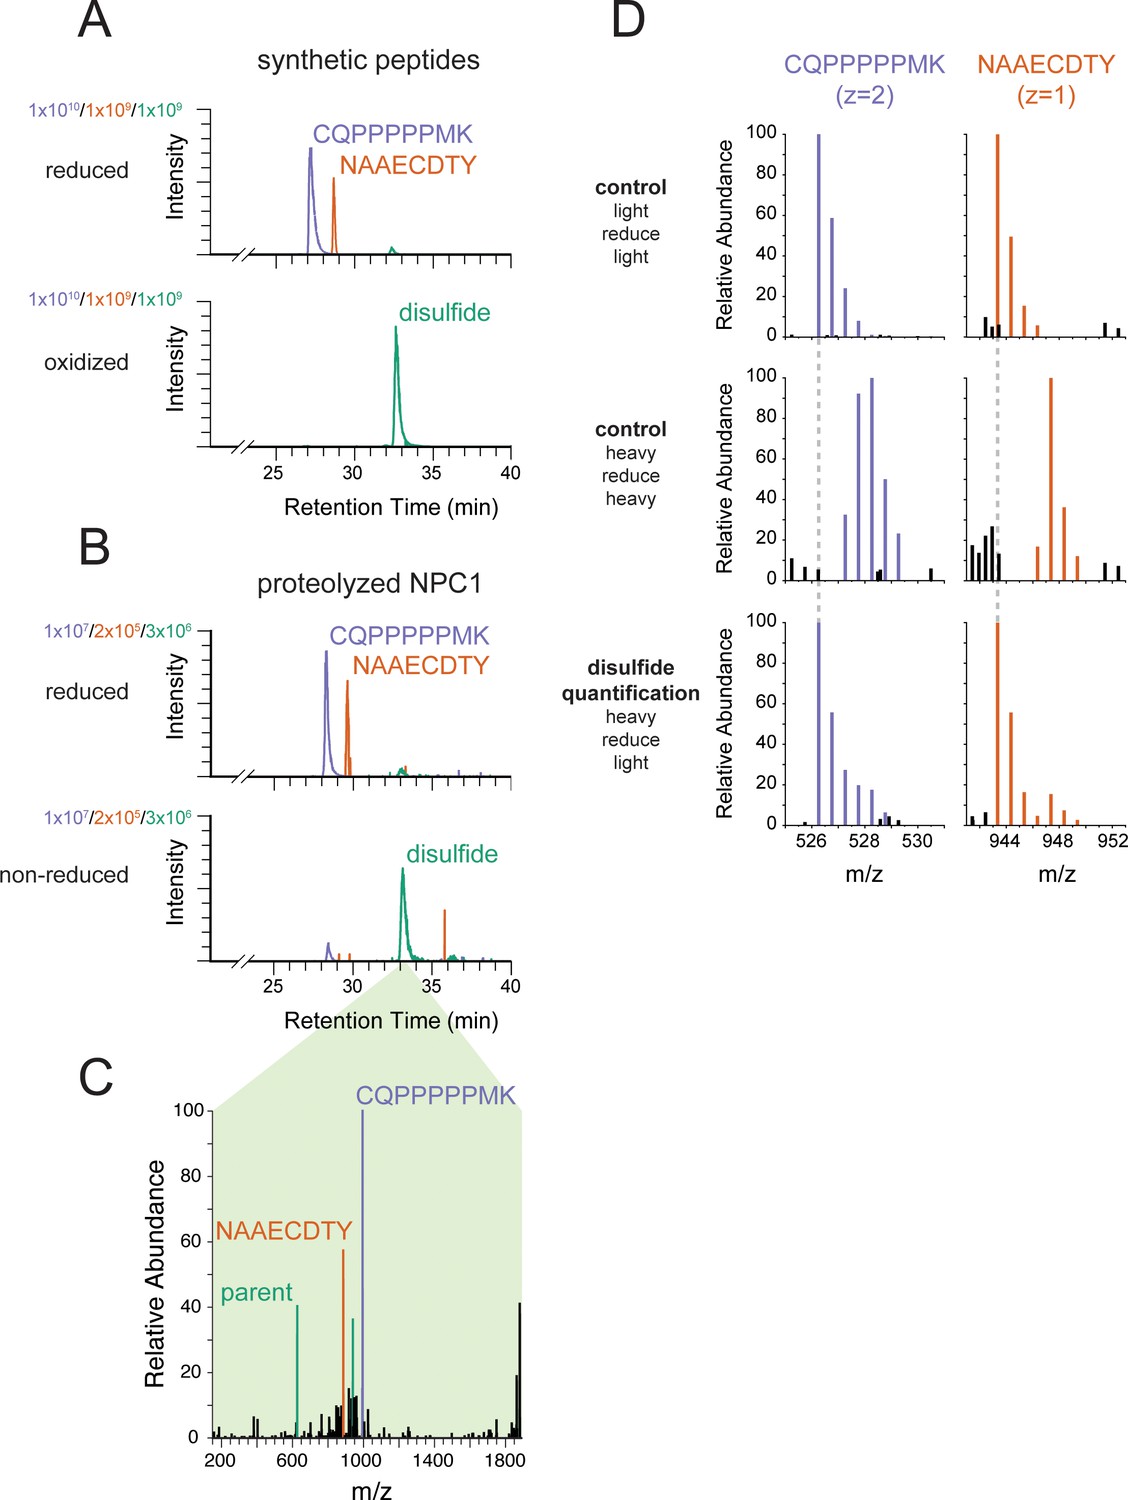
Engineered cysteines C251 and C929 form a disulfide bond in NPC1.
(A) Extracted ion chromatograms from LC-MS analysis of synthetic peptides corresponding to engineered cysteines in NPC1. In both samples, purple traces represent m/z = 526.2569 (corresponding to carbamidomethylated CQPPPPPMK from NPC1 P251C), orange traces represent m/z = 943.3462 (corresponding to carbamidomethylated NAAECDTY from NPC1 L929C), and green traces represent m/z = 626.6005 (corresponding to the disulfide formed between CQPPPPPMK and NAAECDTY). The peptide standards CQPPPPPMK and NAAECDTY were produced by solid phase synthesis and either reduced and carbamidomethylated or oxidized to the disulfide using Ellman’s reagent. (B) Extracted ion chromatograms from LC-MS analysis of proteolyzed NPC1. Colors as in (A). NPC1 protein was carbamidomethylated in the presence or absence of reducing agent prior to proteolysis. (C) EThcD mass spectrum from NPC1 sample in (B), demonstrating the reductive fragmentation of the putative disulfide precursor into ions with masses corresponding to the two constituent peptides. Peaks matching the mass of the peptide CQPPPPPMK (monoisotopic mass of thiol = 994.49 Da) are colored in purple; peaks matching the masses of the peptides NAAECDTY (monoisotopic mass of thiol radical = 885.32 Da) are colored in orange; peaks matching multiple charge states of the spectrum’s parent ions (m/z = 626.60, z = 3, corresponding to the disulfide) are colored in green. (D) MS1 mass spectra of NPC1 peptides whose disulfide content has been quantified using isotope-labeled iodoacetamide. Free thiols in purified NPC1 were labeled with 13C2D2-iodoacetamide (‘heavy’). Then the disulfides were reduced and the resulting reactive cysteines were labeled with iodoacetamide lacking isotope labels (‘light’) followed by proteolysis and LC-MS analysis. Control samples were labeled with the same reagent before and after reduction (‘light/reduce/light’ and ‘heavy/reduce/heavy’) to identify isotope distributions in the limiting cases. Colored peaks fall within 10 ppm of expected masses in the isotope envelope of carbamidomethylated CQPPPPPMK (monoisotopic m/z = 526.2569) or carbamidomethylated NAAECDTY (monoisotopic m/z = 943.3462); black peaks correspond to unrelated ions. Dashed gray lines indicate the expected m/z of the monoisotopic peak of the labeled peptides.
Figure 2—figure supplement 1

HCD mass spectra of disulfide ions (m/z = 626.60) from oxidized disulfide sample in Figure 2A.
Red peaks correspond to the y ions produced from the numbered fragmentation sites in the disulfide; cyan peaks correspond to the corresponding a and b ions. Peaks labeled ‘++’ are doubly rather than singly charged; peaks labeled ‘(2)’ correspond to fragmentation events in NAAECDTY rather than in CQPPPPPMK.
Figure 3
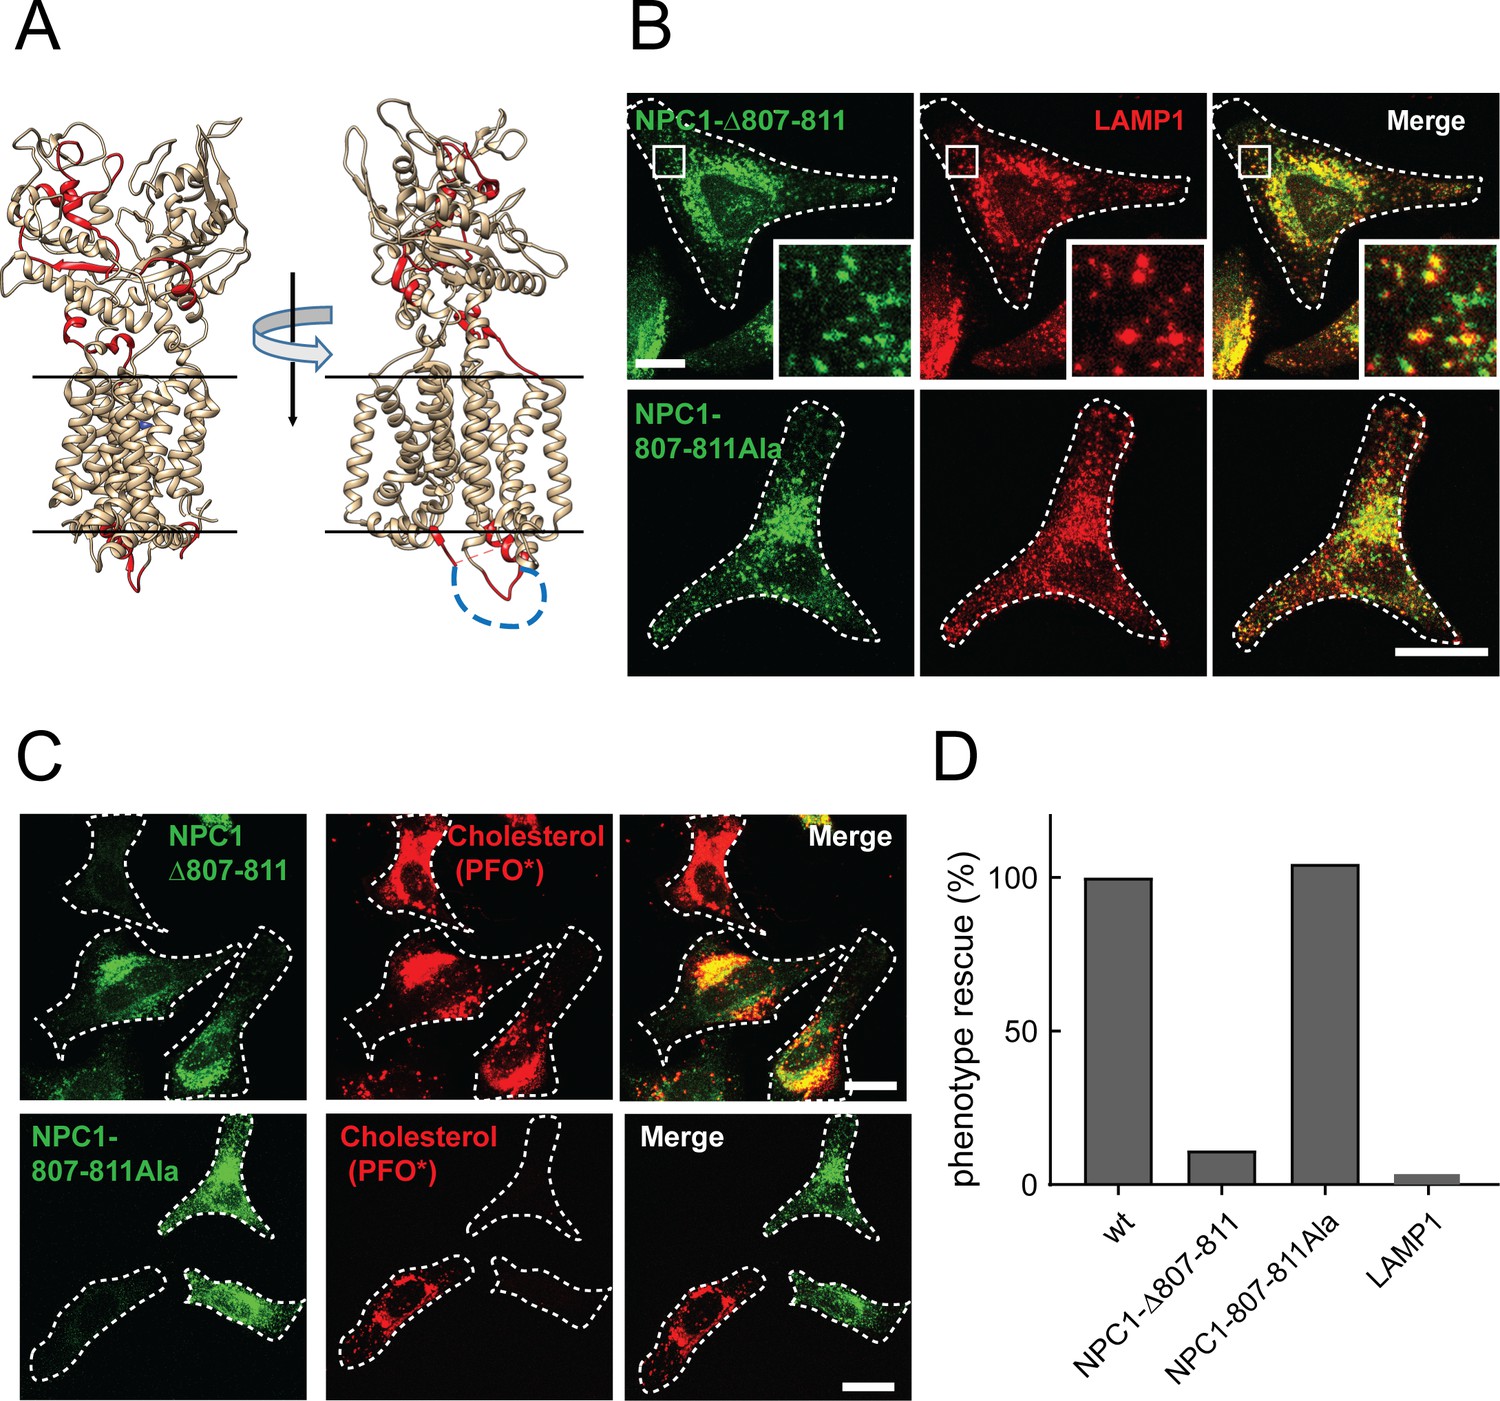
NPC1 Δloop mutant cannot rescue cholesterol export from lysosomes.
(A) Cholesterol-cross-linked peptides (Hulce et al., 2013) are highlighted in red for two orientations of the crystal structure of N-terminal domain- and first transmembrane domain-deleted NPC1 (PDBID: 5u74). The disordered cytoplasmic loop residues 800–814 are shown as a blue dotted line. (B) Confocal immunofluorescence microscopy analysis of the localization of mouse NPC1-Δ807–811, NPC1-807-811Ala and LAMP1 proteins in HeLa cells (bar, 20 μm). White boxes in images indicate regions of cells enlarged in the insets shown at the lower right of each image. (C) Confocal immunofluorescence microscopy of cholesterol accumulation rescue. NPC1−/− HeLa cells were transfected with GFP-tagged mouse NPC1-Δ807–811 or mouse NPC1-807-811Ala plasmids for 48 h and assayed for cholesterol accumulation rescue as in Figure 1 (bar, 20 μm). (D) Quantitation of cholesterol accumulation rescue using flow cytometry. GFP-positive cells with similar expression levels were analyzed: 2480 NPC1; 427 NPC1-Δ807–811; 764 NPC1-807-811Ala; LAMP1 expressing control, 1753 cells counted. Shown are the normalized data from mean fluorescence intensity flow cytometry values.
Figure 4 with 1 supplement
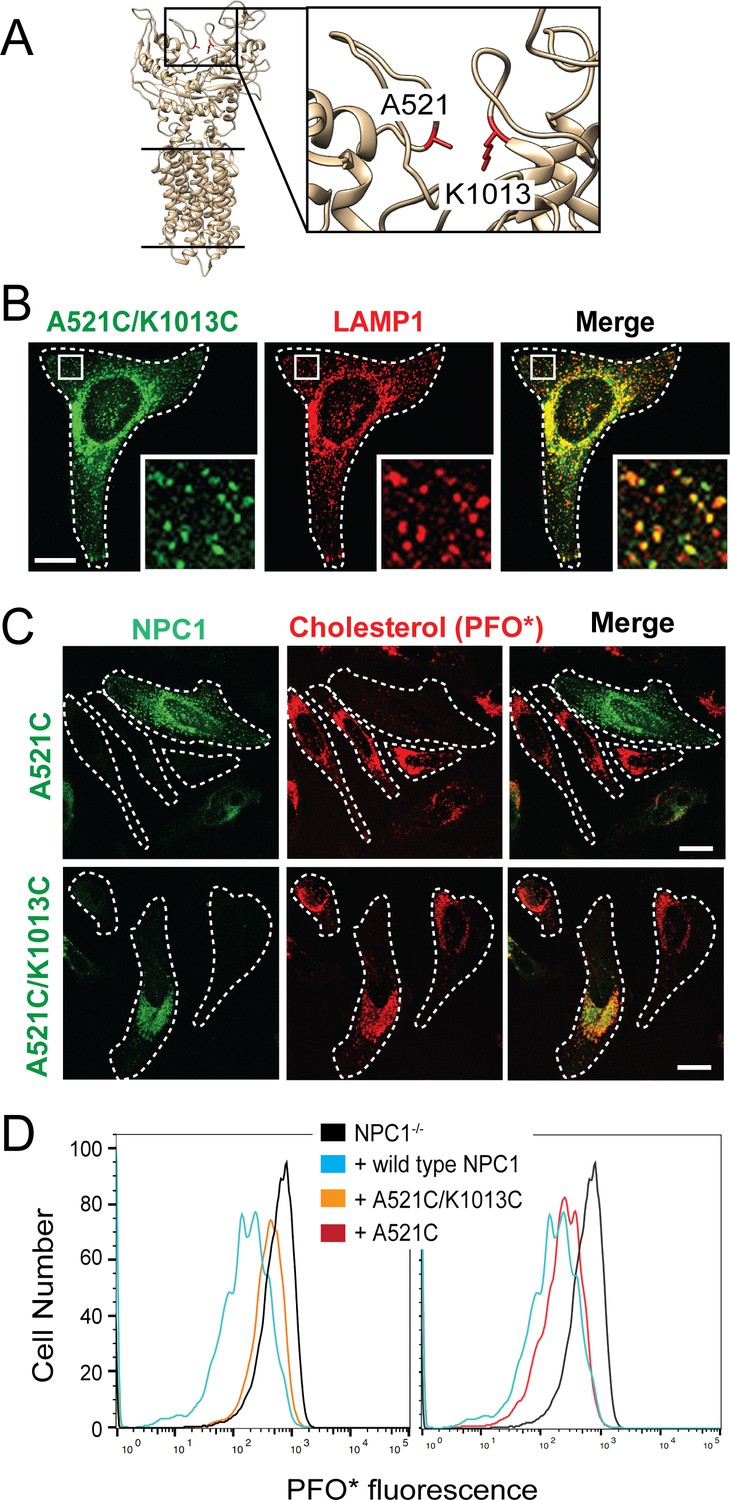
NPC1 Disulfide bond-locked MLD and CTD fails to rescue cholesterol export from lysosomes.
(A) Partial NPC1 structure; inset, close-up view of the MLD/CTD interface. The amino acid residues mutated to cysteines for disulfide bond formation are shown and highlighted in red. (B) Confocal immunofluorescence microscopy analysis of mouse NPC1-A521C/K1013C and LAMP1 proteins in HeLa cells (bar, 20 μm). White boxes in images indicate regions of cells enlarged in the insets shown at the lower right of each image. (C) Confocal immunofluorescence microscopy of cholesterol accumulation rescue for NPC1-A521C or mouse NPC1-A521C/K1013C. (D) Flow cytometry of the rescue experiment analyzed in (C). GFP-positive cells with similar expression levels were analyzed: 17746 NPC1-/- cells; 1315 NPC1 wild type; 1137 NPC1-A521C/K1013C cells; 837 NPC1-A521C cells; cell numbers were normalized for comparison.
Figure 4—figure supplement 1

Extracted ion chromatograms from LC-MS analysis of proteolyzed A521C/K1013C NPC1.
Protein was carbamidomethylated in the presence or absence of reducing agent prior to deglycosylation and proteolysis. In both samples, blue traces represent m/z = 596.2818 (corresponding to the NPC1 peptide APCSLNDTSLL carbamidomethylated at the engineered cysteine A521C and deamidated at the N524 glycosylation site).
Figure 5
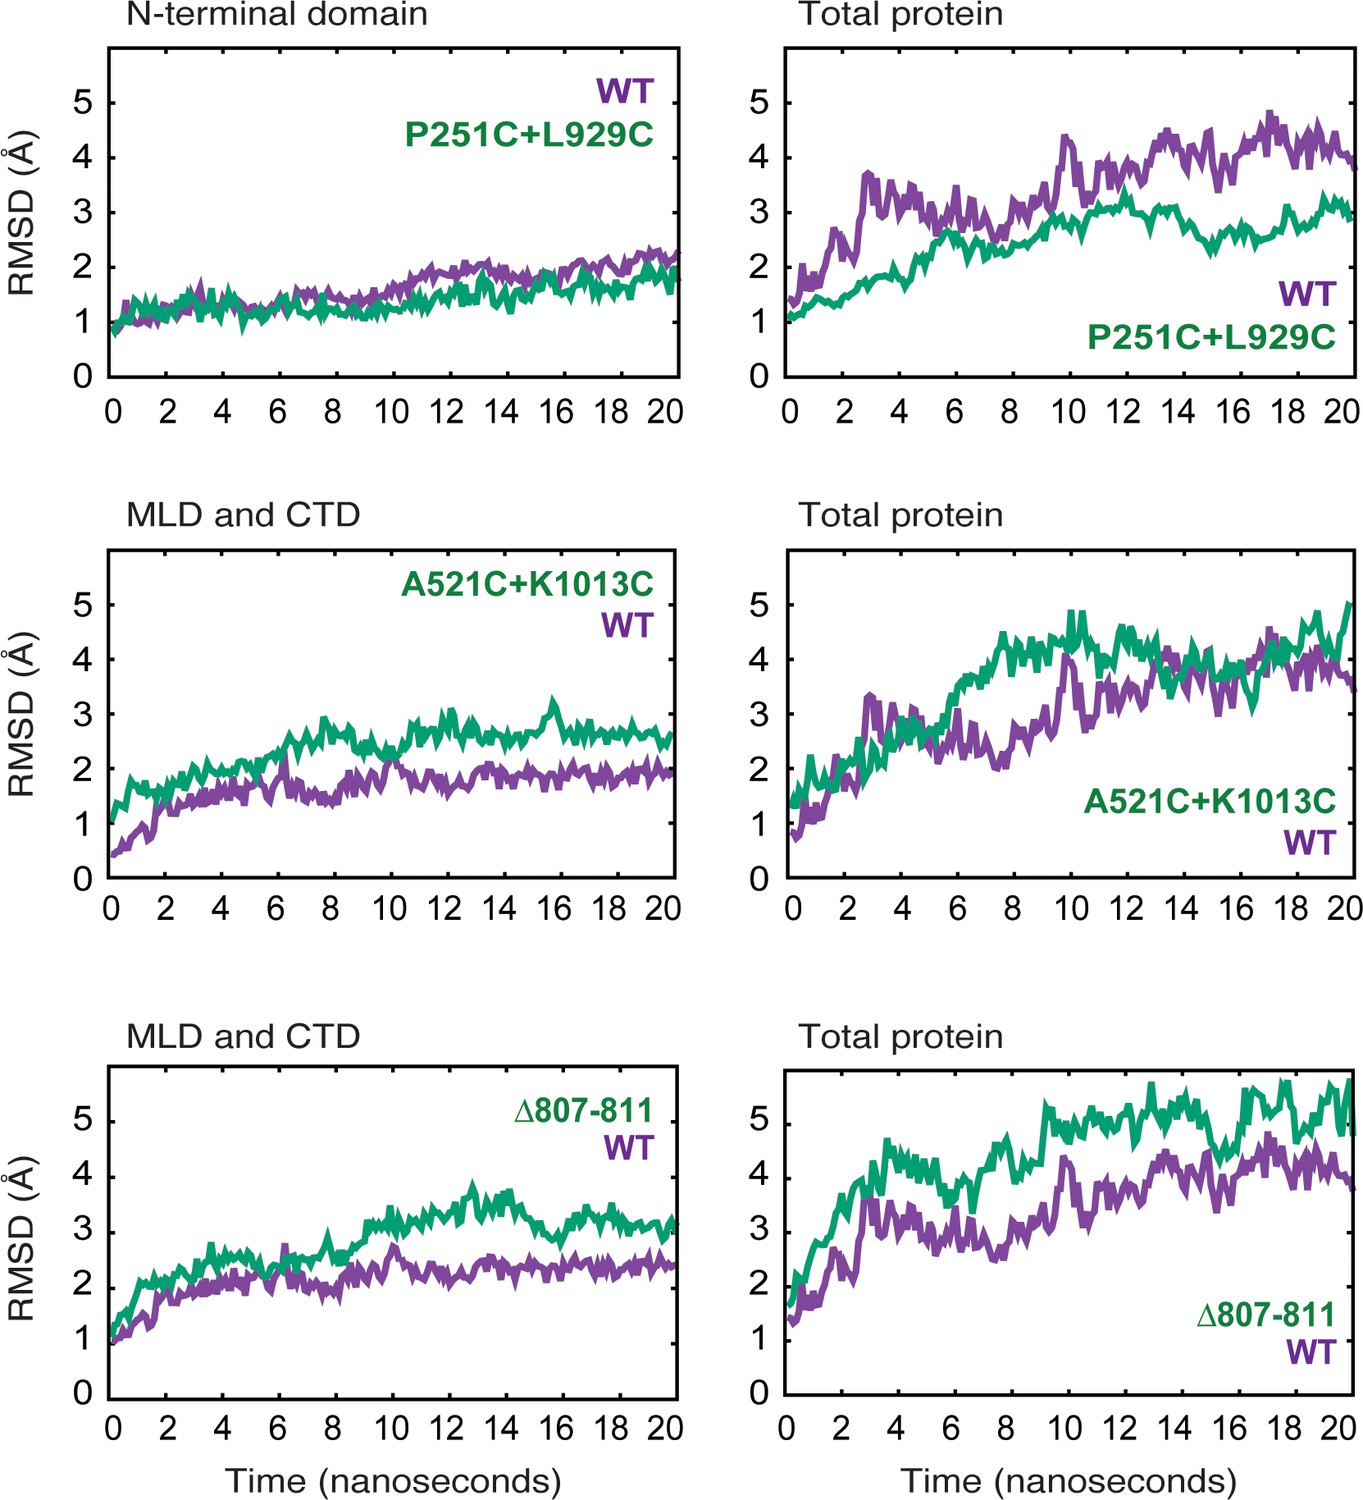
Molecular dynamics simulations of NPC1 wild type and mutant proteins.
RMSD (Å) of protein backbone atoms for each simulated model is plotted as a function of time for the indicated mutants in relation to their wild type counterparts.
Figure 6
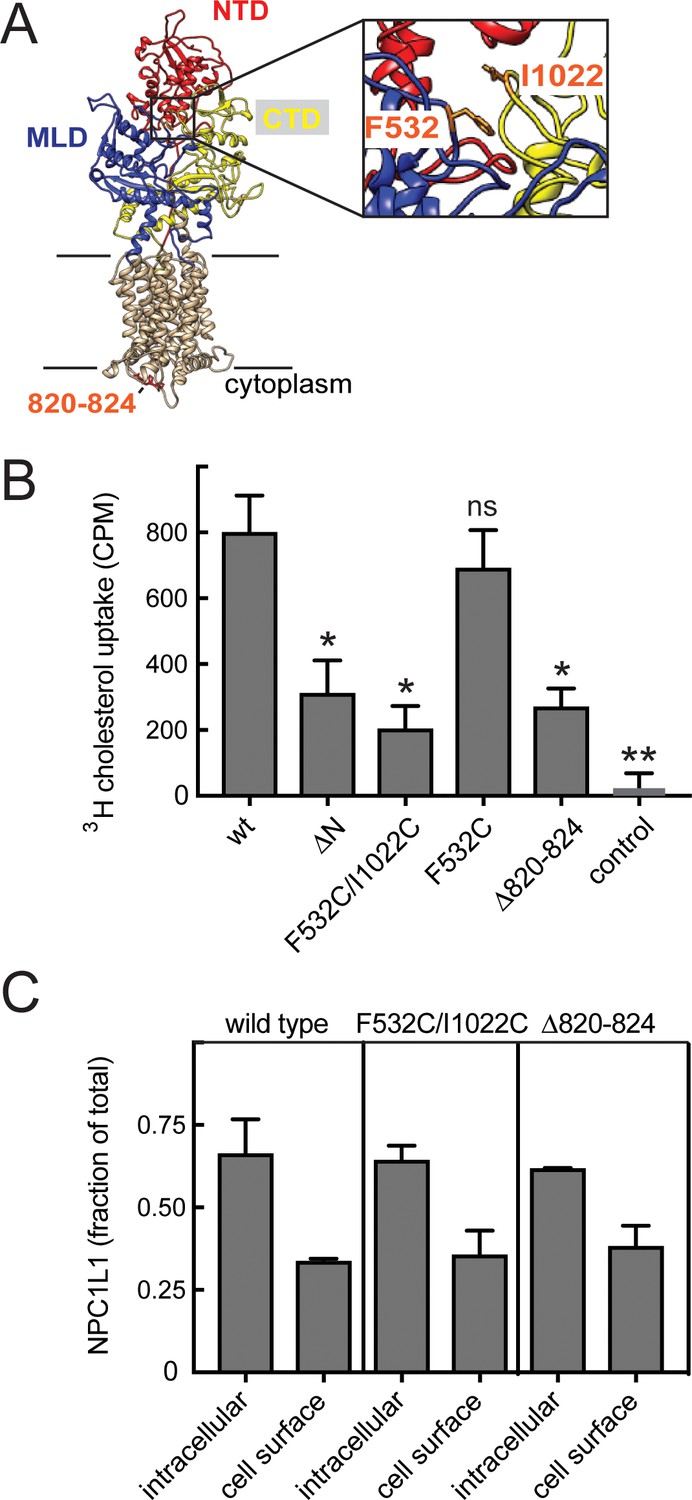
Inter-domain mobility is required for cholesterol transport by NPC1L1 protein.
(A) Structure model of NPC1L1 built by Swiss-Model using NPC1 (PDBID: 5u74) as template for UNIPROT Q9UHC9-1. Extracellular domains are labeled and colored as in Figure 1; NTD, residues 33–275; MLD, 373–632; CTD, 861–1111. In orange are residues 820–824, F532 and I1022 (enlarged in a slightly rotated inset at right). (B) Cholesterol uptake by cells expressing the indicated constructs. p values determined by unpaired t test were ΔN, 0.03; F523/I1022C, 0.01; F532C, ns; Δ820–824, 0.01; control, 0.004. (C) Localization of NPC1L1 proteins determined by cell surface biotinylation. HEK293T cells transfected with GFP-tagged constructs were surface-labeled with Sulfo-NHS-biotin-EZ-link on ice for 30 min and biotin-labeled proteins captured on streptavidin beads and analyzed by immunoblot using anti-GFP antibody. Quantitation of the LI-COR data is shown; error bars represent SEM of triplicate determinations. Mutant values were statistically indistinguishable from wild type (all p values not significant).
Figure 7 with 1 supplement
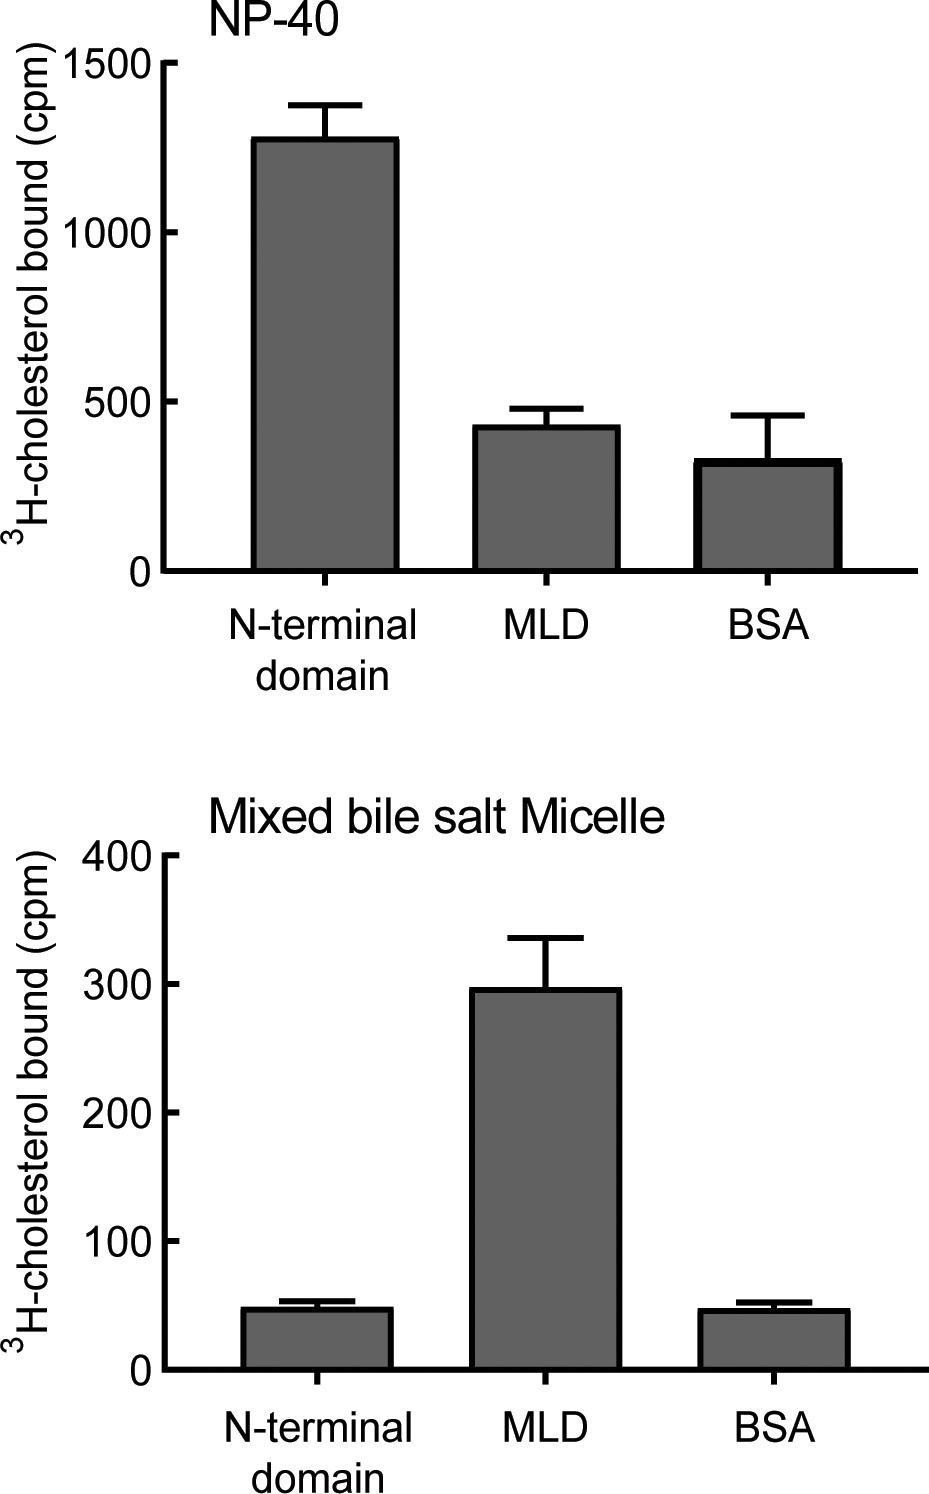
NPC1L1 MLD binds bile salt micelles.
Binding of purified NPC1L1 N-terminal domain or MLD to 3H-cholesterol, delivered either in sub-CMC NP-40 (A) or in mixed bile salt micelles (B). Error bars represent SEM for triplicate determinations from a representative experiment from five independent experiments.
Figure 7—figure supplement 1
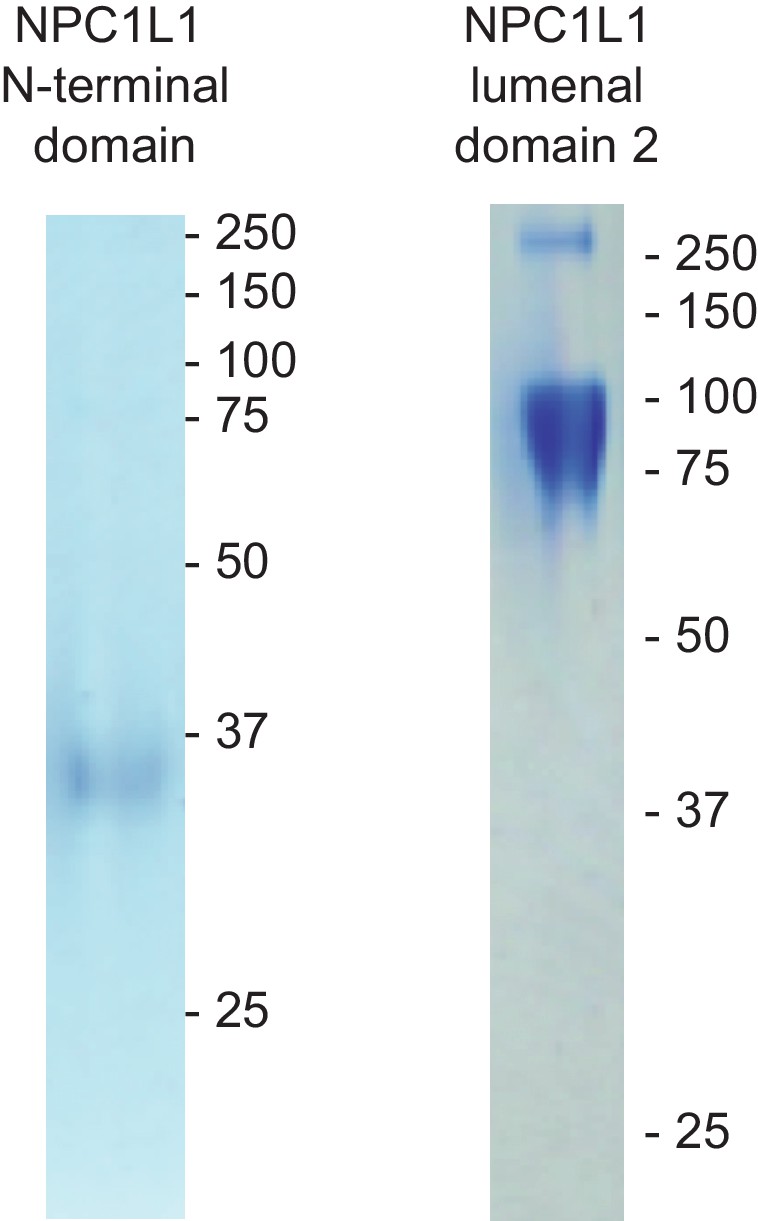
Purified NPC1L1 N-terminal domain and NPC1L1 MLD used in Figure 6.
Coomassie stained SDS PAGE gels are shown.
Figure 8
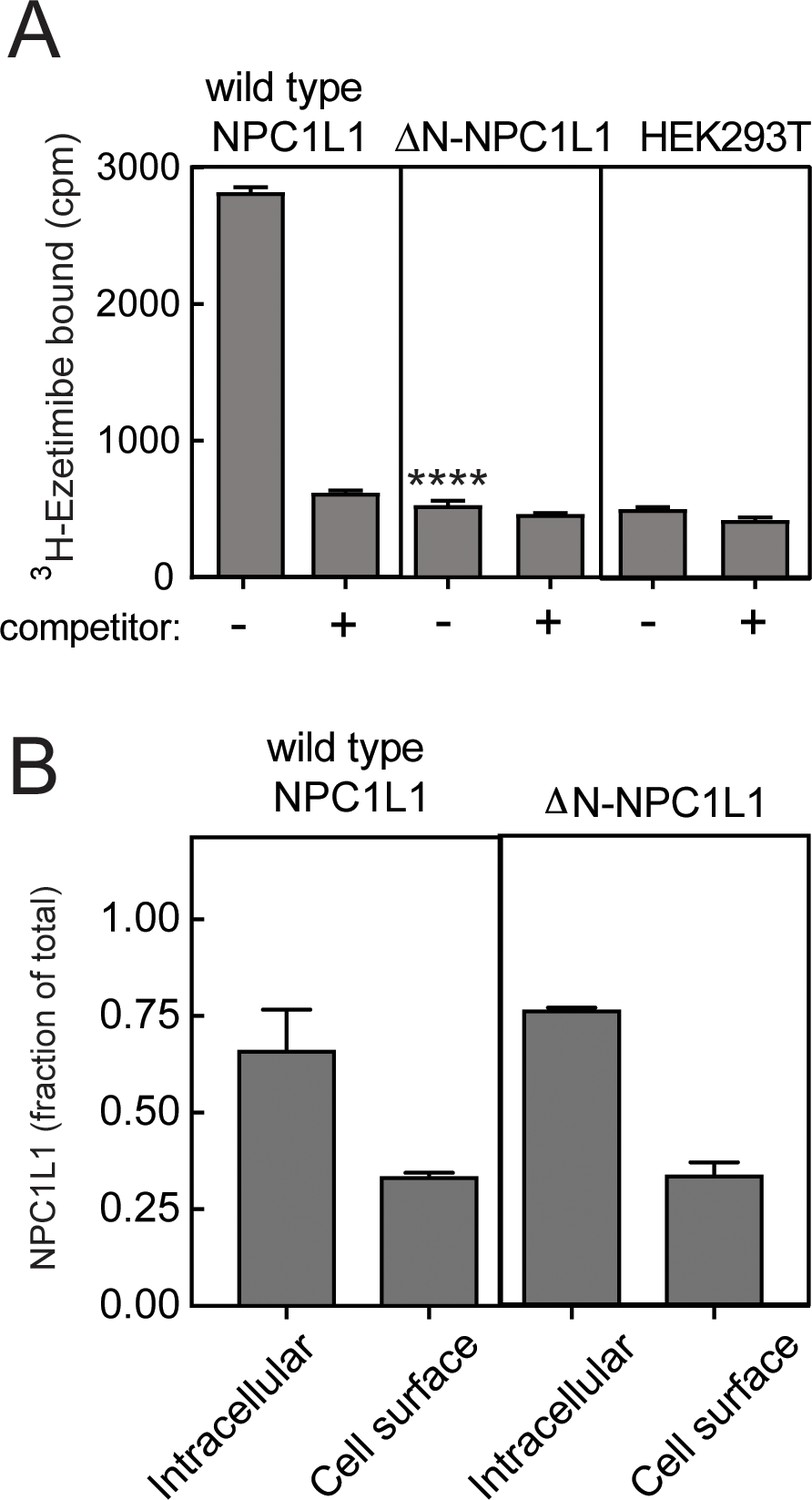
NPC1L1 N-terminal domain is essential for ezetimibe binding at the cell surface.
(A) 3H-ezetimibe binding to HEK293T cells transfected with either wild type or N-terminal domain deleted ΔN-NPC1L1. Forty-eight hours post transfection, cells were incubated with 50 nM 3H-ezetimibe for 2 h at 37°C ± 10 µM cold ezetimibe. Untransfected HEK293T cells were used as control. Equal protein amounts of total cell lysates were analyzed by scintillation counter. Error bars represent SEM for a representative experiment carried out in triplicate. The p value for ΔN-NPC1L1 compared with wild type was <0.001 without competitor. (B) Localization of NPC1L1 proteins determined by cell surface biotinylation as in Figure 5; error bars represent SEM of triplicate determinations. There was no significant difference between wild type and mutant samples as determined by unpaired t test.
Figure 9
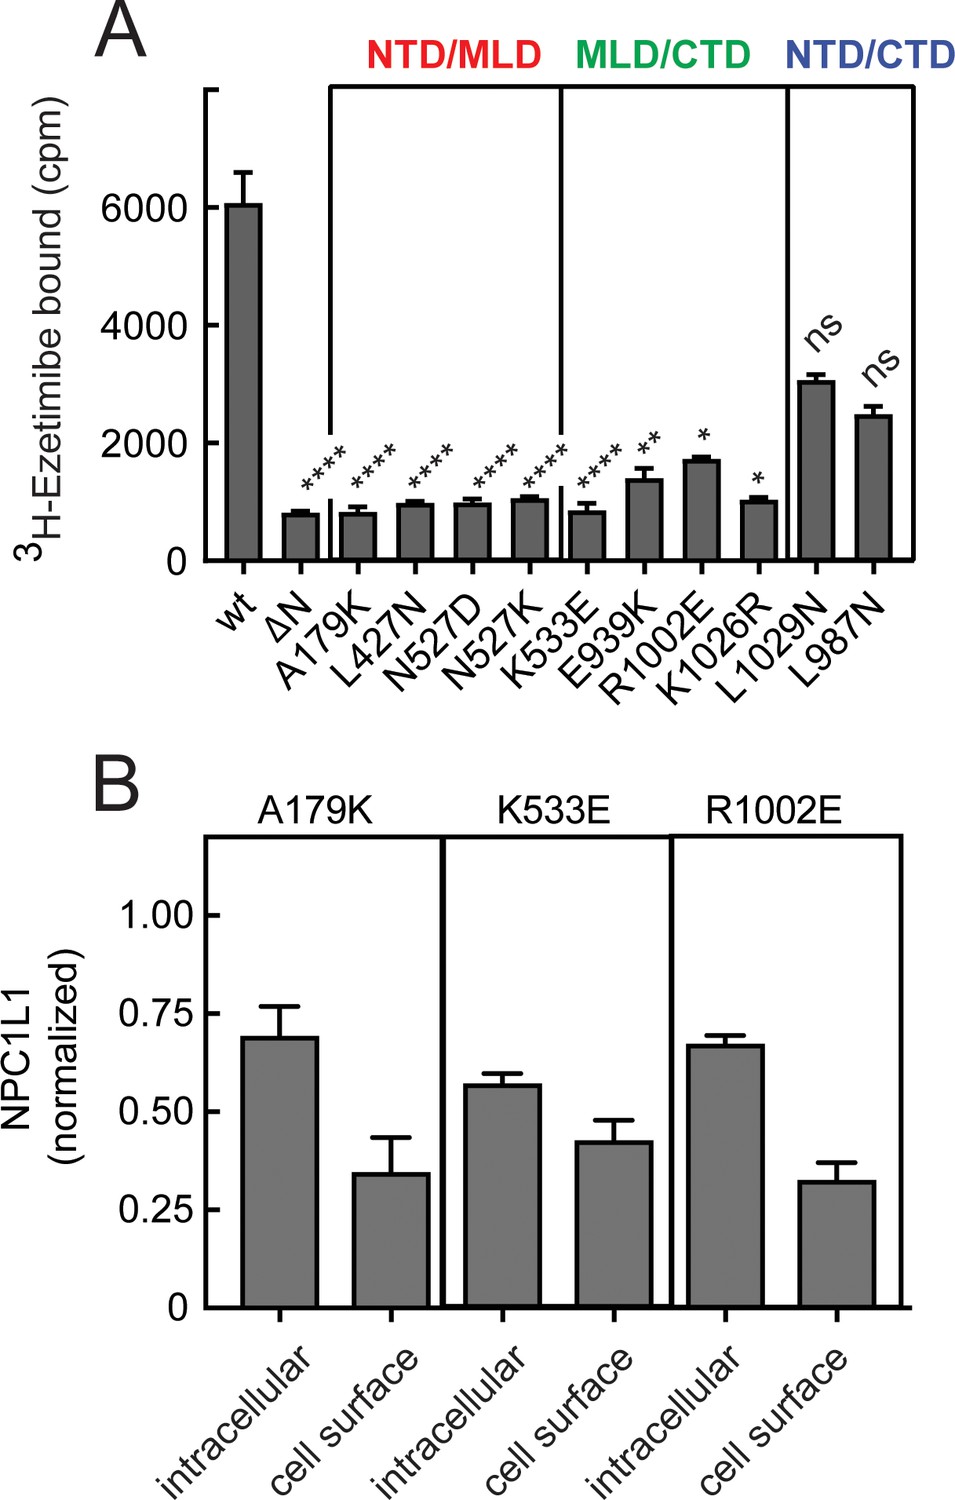
Inter-domain interfaces of NPC1L1 are critical for ezetimibe binding.
(A) 3H-ezetimibe binding of HEK293T cells transfected with either wild type NPC1L1 or mutant NPC1L1 proteins designed to disrupt the interfacial interactions between domains of NPC1L1. The colored labels in (A) represent interfaces altered by the mutants shown. Error bars represent SEM for triplicate samples. p values compared with wild type were <0.0001 for all mutants except E939K, 0.004; R1002E, 0.03; K1026R, 0.011; L1029N, ns; L987N, ns. (B) Localization of representative NPC1L1 mutants as in Figure 5; LI-COR data quantitation is shown and error bars represent SEM for triplicate samples. Intracellular and cell surface values were not significantly different for K533W and R1002E samples compared with A179K determined by unpaired t test.
Tables
Table 1
Distance correlation coefficients for mutants analyzed.
Strongest inter-domain correlations are indicated in bold.
| A521C+K1013C | ||||
|---|---|---|---|---|
| NTD | MLD | CTD | TMD | |
| NTD | -- | -- | -- | -- |
| MLD | -- | 1.000 | 0.850 | 0.810 |
| CTD | -- | 0.850 | 1.000 | 0.594 |
| TMD | -- | 0.810 | 0.594 | 1.000 |
| P251C+L929C | ||||
| NTD | MLD | CTD | TMD | |
| NTD | 1.000 | 0.969 | 0.945 | 0.931 |
| MLD | 0.969 | 1.000 | 0.919 | 0.942 |
| CTD | 0.945 | 0.919 | 1.000 | 0.952 |
| TMD | 0.931 | 0.942 | 0.952 | 1.000 |
| Δ807-811 | ||||
| NTD | MLD | CTD | TMD | |
| NTD | 1.000 | 0.496 | 0.522 | 0.391 |
| MLD | 0.496 | 1.000 | 0.836 | 0.398 |
| CTD | 0.522 | 0.836 | 1.000 | 0.395 |
| TMD | 0.391 | 0.398 | 0.395 | 1.000 |
| WT | ||||
| NTD | MLD | CTD | TMD | |
| NTD | 1.000 | 0.569 | 0434 | 0.529 |
| MLD | 0.569 | 1.000 | 0.751 | 0.811 |
| CTD | 0.434 | 0.751 | 1.000 | 0.617 |
| TMD | 0.529 | 0.811 | 0.617 | 1.000 |
Table 2
Rationale for NPC1L1 domain interface mutants generated.
| Residue | Residues in other domains within 5 Å | Type of interaction | Mutation chosen |
|---|---|---|---|
| A179 | L523, Y524, N527 | Hydrophobic/hydrophilic | K (possibly trigger steric clash and disrupt the interface) |
| L427 | A180 | van der waals/hydrophobic | N (possibly disrupt the hydrophobic interface) |
| N527 | R112, Q257 | Hydrophilic | D (could stabilize the interface, restricting domain flexibility); K (potentially destabilize the interface because of positive charge repulsion) |
| K533 | K1026 | Electrostatic | E (could stabilize and restrict domain flexibility) |
| E939 | P549, F551 | van der waals | K (longer sidechain might result in steric clash, disrupt the interface) |
| R1002 | D250 | Electrostatic | E (possibly disrupt the interface) |
| K1026 | K533 | Electrostatic | R (possibly stabilize the interface and restrict domain flexibility) |
| L1029 | L530, M543 | van derwaals/hydrophobic | N (possibly disrupt the interface) |
| L987 | I72 | van derwaals/hydrophobic | N (possibly disrupt the interface) |
Key resources table
| Reagent type (species) or resource | Designation | Source or reference | Identifiers | Additional information |
|---|---|---|---|---|
| Gene Mus musculus | NPC1 | PMID:27551080 | ||
| Gene (Homo sapiens) | NPC1L1 | PMID:27075173 | ||
| Gene (Homo sapiens) | LAMP1 | PMID:27664420 | ||
| Cell line (Homo sapiens) | HeLa NPC1 KO | PMID:26578804 | ||
| Cell line (Homo sapiens) | HEK293T | ATCC | ||
| Cell line (Homo sapiens) | 293F | ATCC | ||
| Cell line (Spodoptera frugiperda) | SF9 | ATCC | ||
| Transfected construct Mus musculus | NPC1-eGFP | PMID:27551080 | ||
| Transfected construct (Homo sapiens) | NPC1L1-eGFP | PMID:27075173 | ||
| Transfected construct (Homo sapiens) | LAMP1-eGFP | PMID:27664420 | ||
| Transfected construct (Homo sapiens) | pFastBac-NPC1L1-wt-N-terminal domain | PMID:27075173 | ||
| Transfected construct (Homo sapiens) | pCMV-FLAG-His6-NPC1L1-MLD | PMID:27075173 | ||
| Antibody | Chicken polyclonal anti-GFP | Life technologies | 1:1000 | |
| Antibody | IRDye 680RD polyclonal Donkey anti-chicken | LI-COR | 926–68075 | 1:10000 |
| Antibody | IRDye 800CW streptavidin | LI-COR | 926–32230 | 1:10000 |
| Antibody | Mouse monoclonal anti-GFP | NeuroMab | N86-38 | 1:1000 |
| Antibody | rabbit polyclonal anti-LAMP1 | Novus | NB120-19294 | 1:1000 |
| Antibody | Alexa Fluor 488 polyclonal Goat anti-mouse | Life Technologies | A-11001 | 1:2000 |
| Antibody | Alexa Fluor 568 polyclonal Goat anti-rabbit | Life Technologies | A-11011 | 1:2000 |
| Recombinant DNA reagent | 293 fectin | Invitrogen | ||
| Recombinant DNA reagent | polyethyleneimine | SIGMA-Aldrich | ||
| Recombinant DNA reagent | Lipofectamine 3000 | Life Technologies | Cat #A10262 | |
| Chemical compound, drug | Ezetimibe | Santa Cruz Biotechnology | sc-205690 | |
| Software, algorithm | Flowjo | https://www.flowjo.com/ | ||
| Software, algorithm | FIJI | PMID:22743772, doi:10.1038/nmeth.2019 |
Additional files
Download links
A two-part list of links to download the article, or parts of the article, in various formats.
Downloads (link to download the article as PDF)
Open citations (links to open the citations from this article in various online reference manager services)
Cite this article (links to download the citations from this article in formats compatible with various reference manager tools)
Inter-domain dynamics drive cholesterol transport by NPC1 and NPC1L1 proteins
eLife 9:e57089.
https://doi.org/10.7554/eLife.57089


