CD163 and pAPN double-knockout pigs are resistant to PRRSV and TGEV and exhibit decreased susceptibility to PDCoV while maintaining normal production performance
- State Key Laboratory of Animal Nutrition and Key Laboratory of Animal Genetics, Breeding and Reproduction of Ministry of Agriculture and Rural Affairs of China, Institute of Animal Sciences, Chinese Academy of Agricultural Sciences, China
- State Key Laboratory of Agricultural Microbiology and Key Laboratory of Preventive Veterinary Medicine in Hubei Province, College of Veterinary Medicine, Huazhong Agricultural University, China
- Shandong Landsee Genetics Co., Ltd., China
- Shenzhen Kingsino Technology Co., Ltd., China
- College of Life Science and Engineering, Foshan University, China
- Department of Animal BioSciences, University of Guelph, Canada
Figures
Figure 1 with 1 supplement
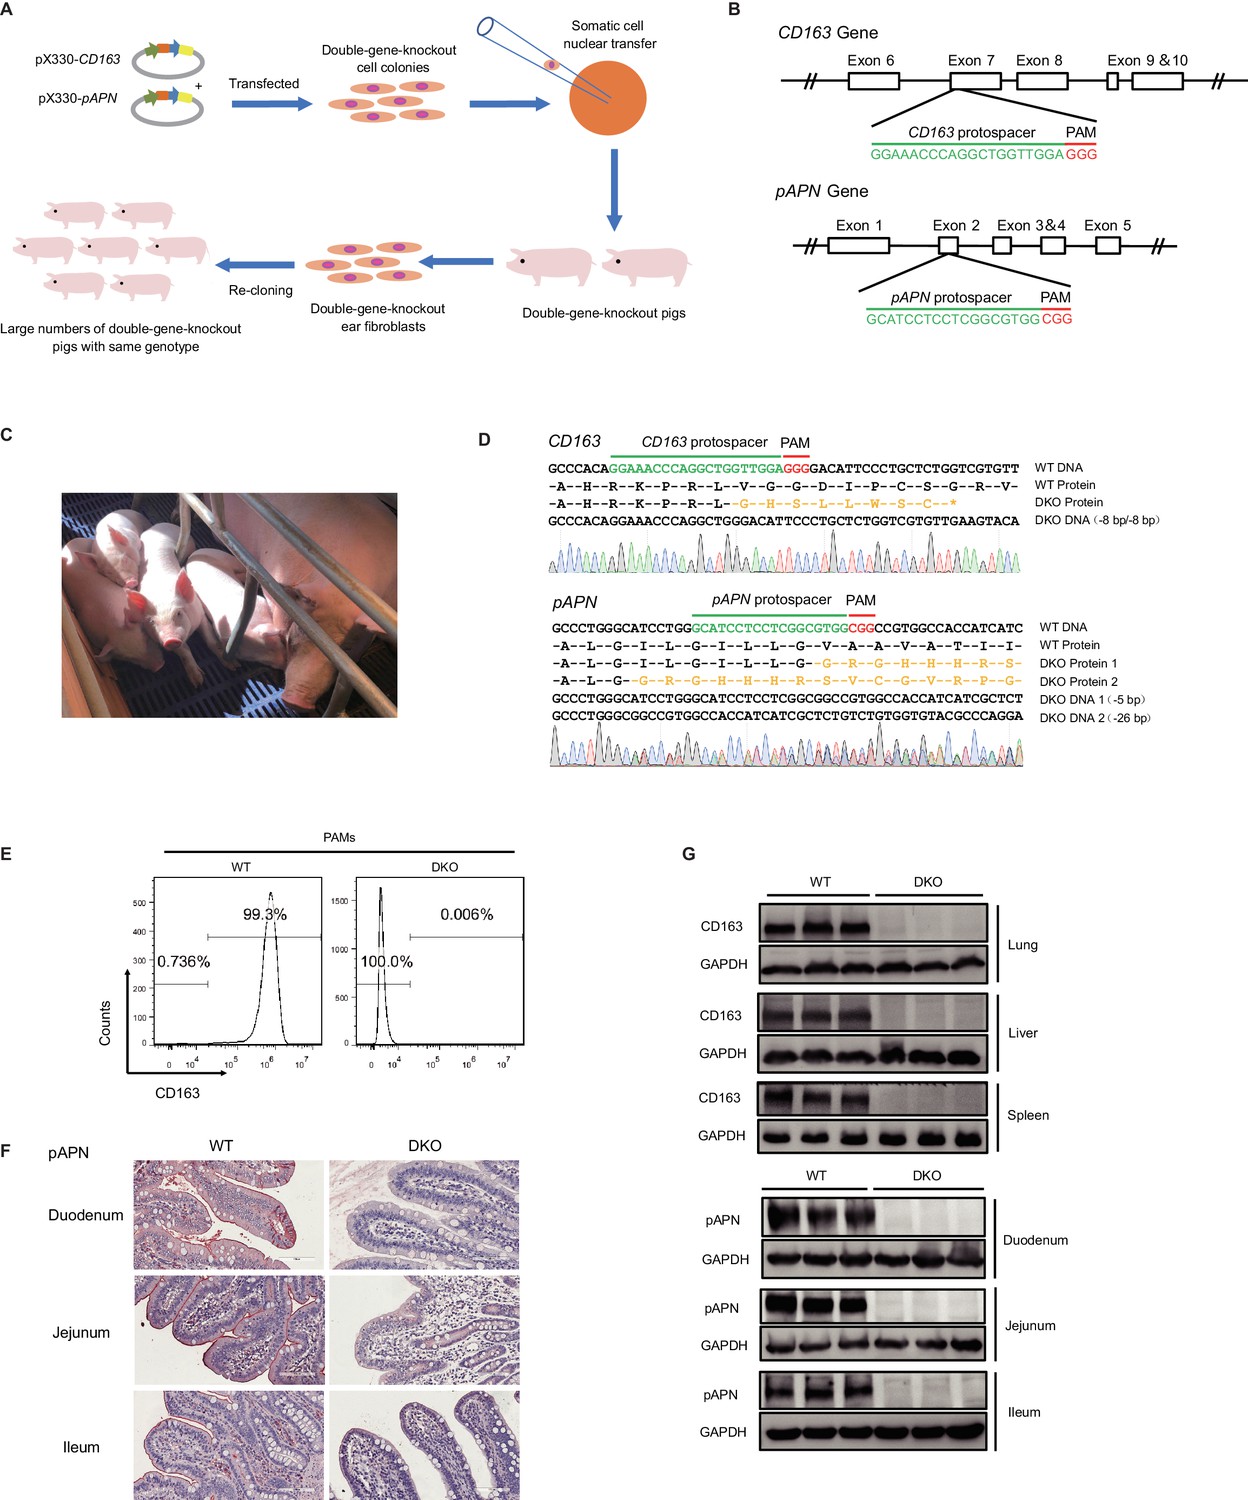
Generation of CD163 and pAPN DKO pigs by CRISPR/Cas9.
(A) Schematic overview of the generation process for DKO cloned pigs. (B) Genetic maps of the CD163 (top) and pAPN (bottom) genes with the location and sequences of the sgRNAs. Exons, white boxes; sgRNA protospacer sequences, green; and PAM sequences, red. (C) Four F0 generation cloned pigs (1085#, 1143#, 1144#, 1145#) aged 1-month-old and a surrogate. (D) Sanger sequencing confirmation of DKO genotypes for three F0 cloned piglets (1143#, 1144#, 1145#). sgRNA protospacer sequences, green; PAM sequences, red; predicted amino acid sequences resulting from frameshift mutations, yellow. (E) Detection of CD163 expression on the surface of PAMs by flow cytometry. (F) Detection of pAPN expression in different small intestine segments by IHC. PAMs and tissues were derived from DKO and WT pigs. (G) Western blot analysis confirmed CD163 and pAPN expression are undetectable in different tissues of DKO pigs (N = 3).
Figure 1—figure supplement 1
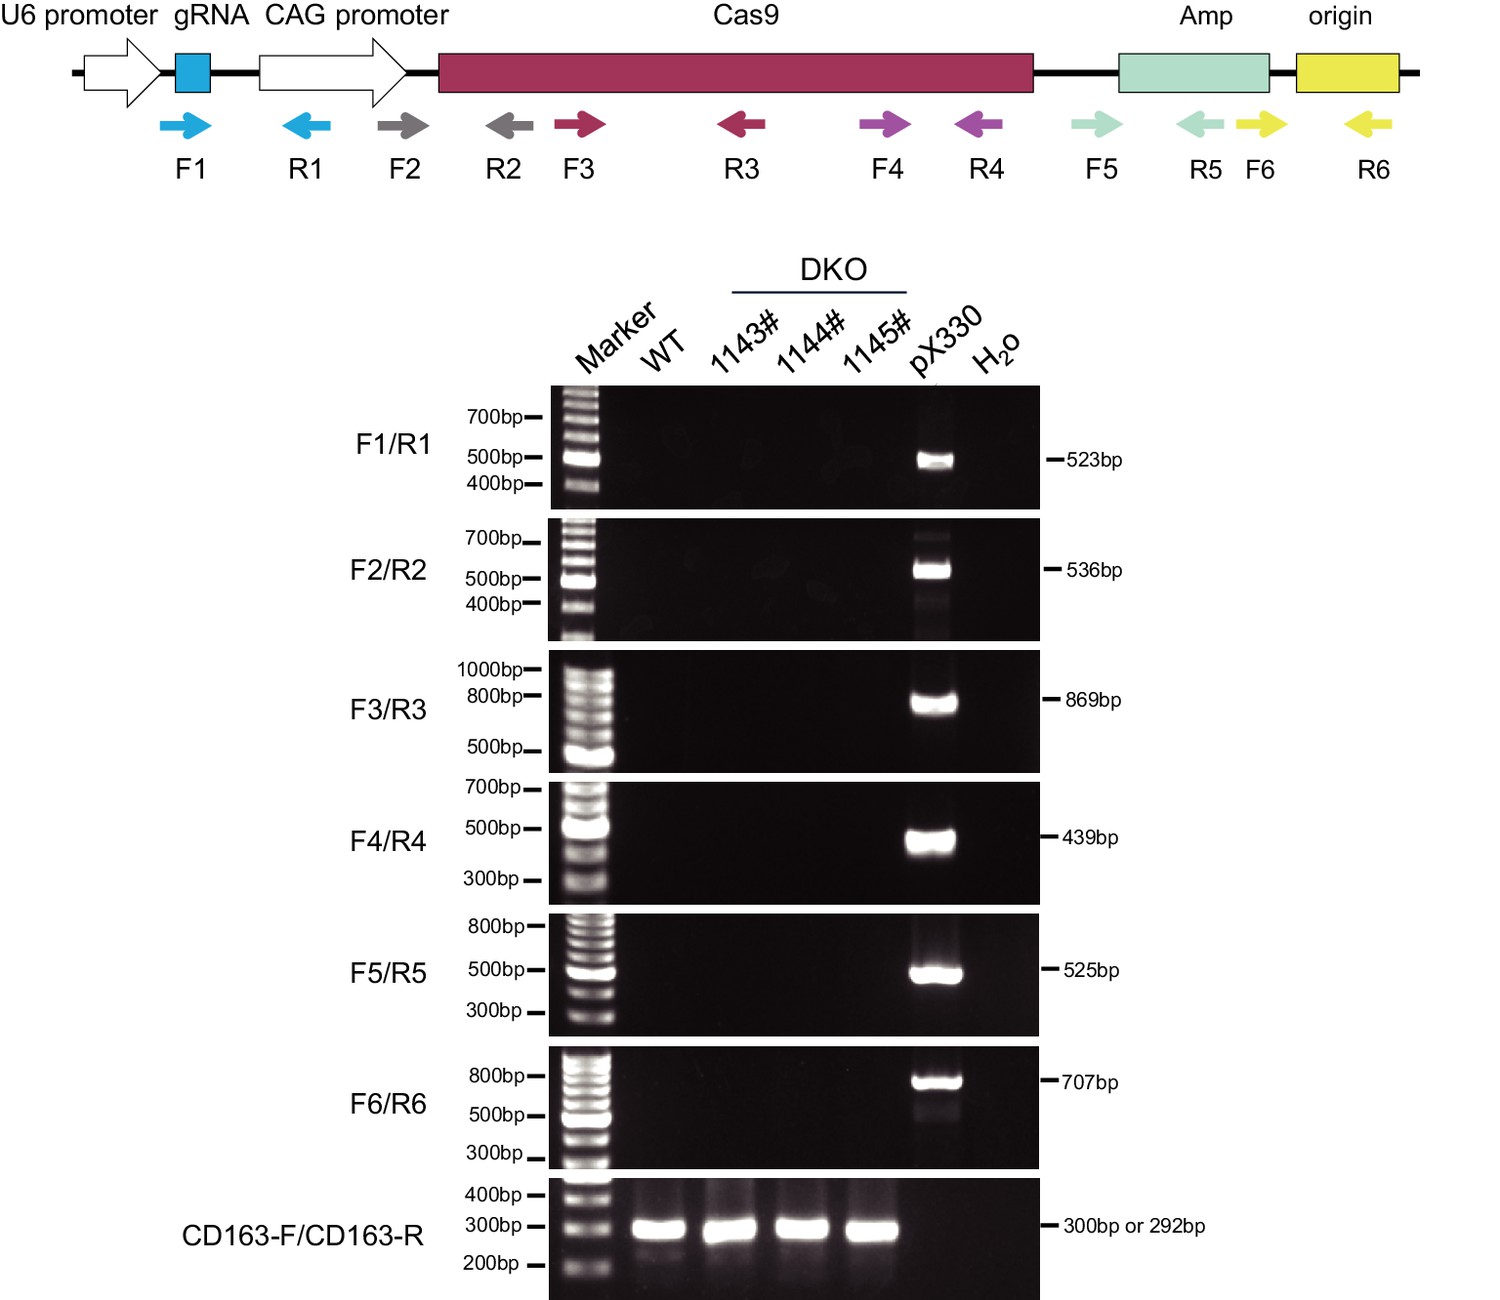
PCR detection of random integration of the pX330 plasmid backbone.
Different colored and shaped boxes represent elements on the pX330 plasmid, arrows behind the boxes show the binding sites of primers in pX330 plasmid. Primer sequences are listed in Supplementary file 6.
Figure 2
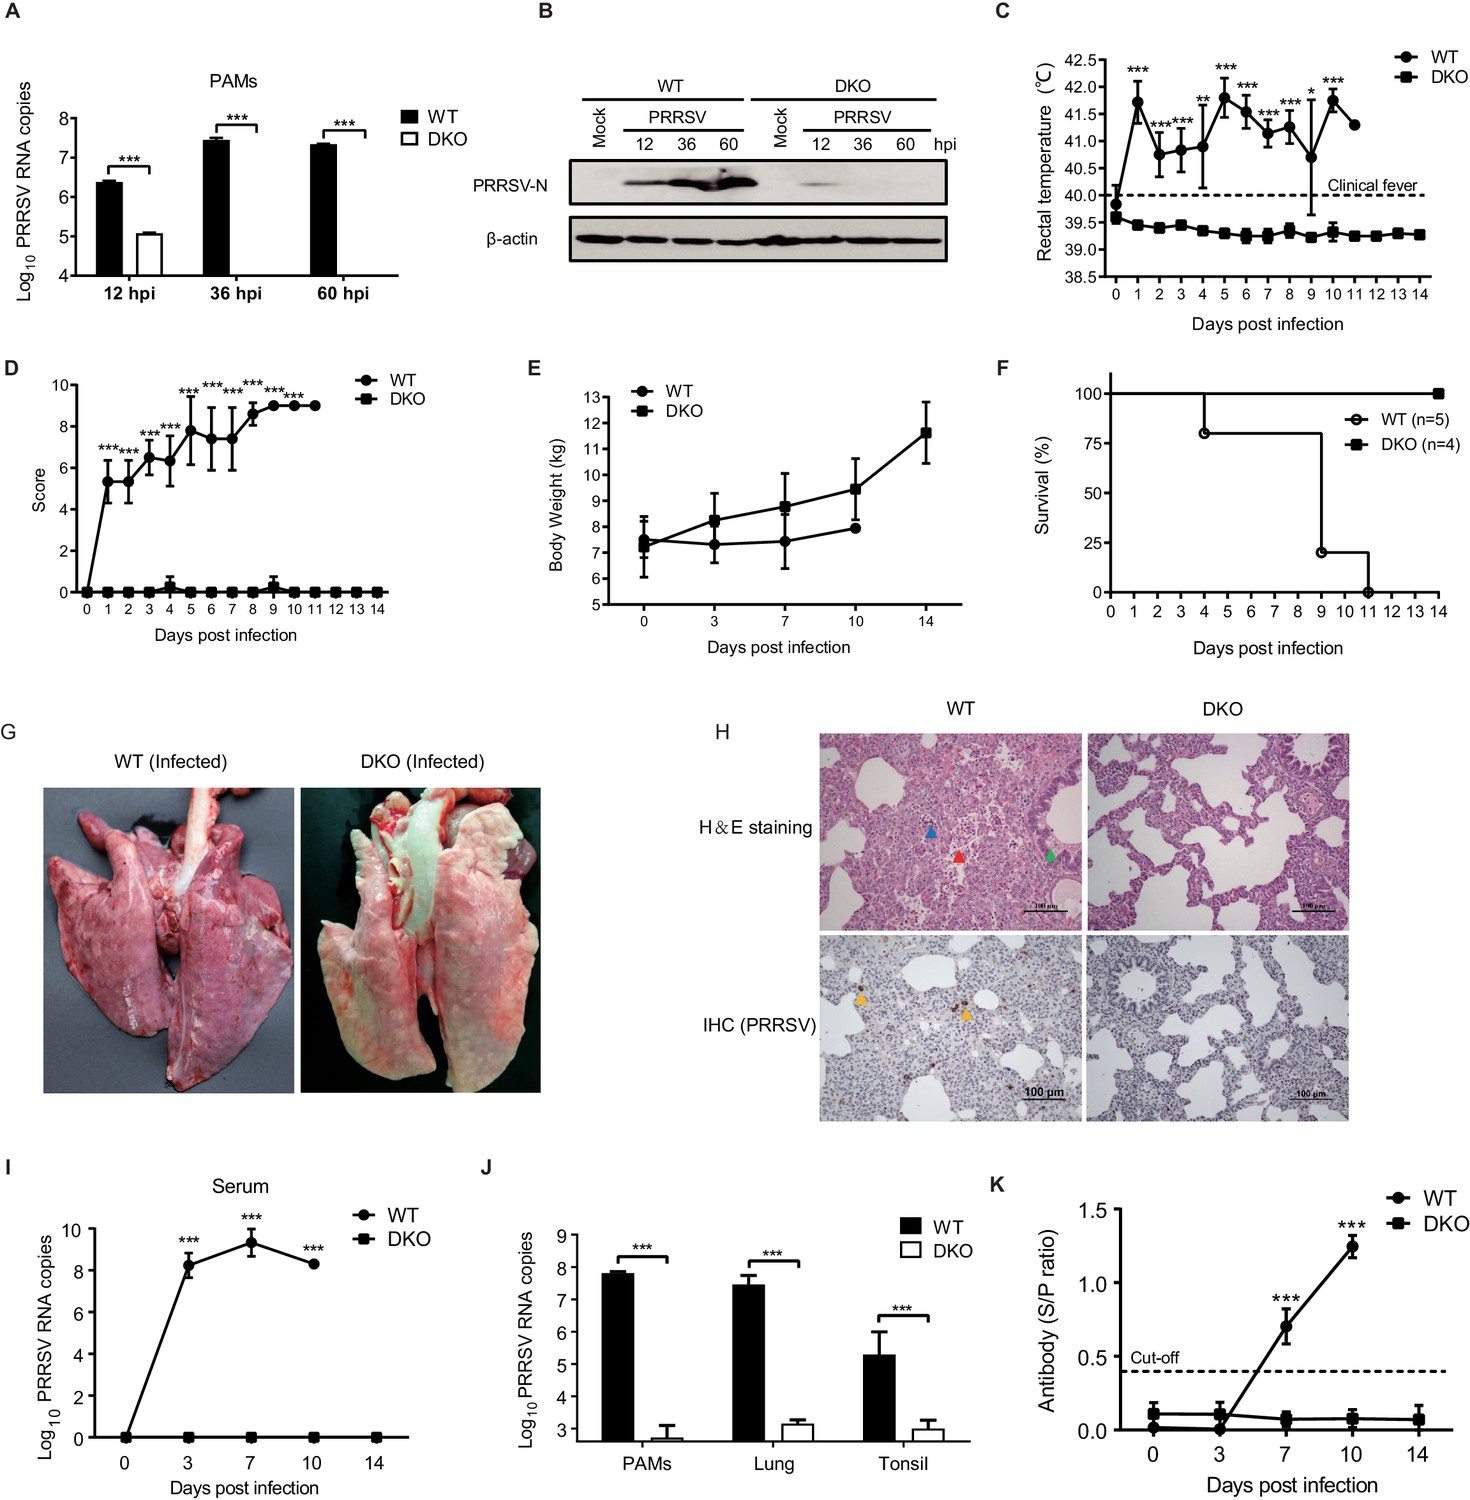
DKO pigs are resistant to genotype 2 PRRSV infection.
(A) qRT-PCR detection of PRRSV load and (B) western blot confirmation of PRRSV-N protein expression in PAMs from WT and DKO pigs at 12, 36, and 60 hpi (MOI = 0.1). (C) Rectal temperatures and (D) clinical symptoms scores were recorded daily beginning at 0 dpi to 14 dpi. Temperatures > 40°C were considered fever. WT: 0 to 4 dpi, N = 6; 5 to 8 dpi, N = 5; 9 dpi, N = 4; 10 dpi, N = 2; 11 dpi, N = 1. DKO: 0 to 14 dpi, N = 4. (E) Body weights measured at 0, 3, 7, 10, and 14 dpi. WT: 0 to 3 dpi, N = 6; 7 dpi, N = 5; 10 dpi, N = 2. DKO: 0 to 14 dpi, N = 4. (F) Survival curves of WT and DKO pigs with PRRSV. WT, N = 5; DKO, N = 4. (G) Representative lesions of infected lungs. (H) H and E staining (top) of lesions in lung tissue; IHC (bottom) detection of viral antigens in PRRSV-infected lungs. Lymphocytic infiltration (blue triangle); necrotic cells in the alveolar wall (red triangle); bronchial wall dilated and filled with serous fluid (green triangle); PRRSV-N protein (yellow triangle) (I) PRRSV loads in serum at 0, 3, 7, 10, and 14 dpi. WT: 0 to 3 dpi, N = 6; 7 dpi, N = 5; 10 dpi, N = 2. DKO: 0 to 14 dpi, N = 4. (J) PRRSV loads in PAMs (WT group: N = 3; DKO group: N = 3), lung tissues (WT: N = 5; DKO: N = 3), and tonsil tissues (WT: N = 5; DKO: N = 4). (K) PRRSV-specific antibodies in serum. WT: 0 to 3 dpi, N = 6; 7 dpi, N = 5; 10 dpi, N = 2. DKO: 0 to 14 dpi, N = 4. Data are expressed as means ± SD. Statistical significance was determined by Student’s t test; ns, p>0.05; *p<0.05; **p<0.01; ***p<0.001.
-
Figure 2—source data 1
The qRT-PCR detection of PRRSV load in PAMs.
- https://cdn.elifesciences.org/articles/57132/elife-57132-fig2-data1-v1.xlsx
-
Figure 2—source data 2
Rectal temperatures of pigs.
- https://cdn.elifesciences.org/articles/57132/elife-57132-fig2-data2-v1.xlsx
-
Figure 2—source data 3
Clinical symptoms scores of pigs.
- https://cdn.elifesciences.org/articles/57132/elife-57132-fig2-data3-v1.xlsx
-
Figure 2—source data 4
Body weights of pigs.
- https://cdn.elifesciences.org/articles/57132/elife-57132-fig2-data4-v1.xlsx
-
Figure 2—source data 5
The survival rate of pigs.
- https://cdn.elifesciences.org/articles/57132/elife-57132-fig2-data5-v1.xlsx
-
Figure 2—source data 6
The qRT-PCR detection of PRRSV load in serum.
- https://cdn.elifesciences.org/articles/57132/elife-57132-fig2-data6-v1.xlsx
-
Figure 2—source data 7
The qRT-PCR detection of PRRSV load in PAMs, lung tissues and tonsil tissues.
- https://cdn.elifesciences.org/articles/57132/elife-57132-fig2-data7-v1.xlsx
-
Figure 2—source data 8
PRRSV-specific antibodies in serum (S/P ration).
- https://cdn.elifesciences.org/articles/57132/elife-57132-fig2-data8-v1.xlsx
Figure 3
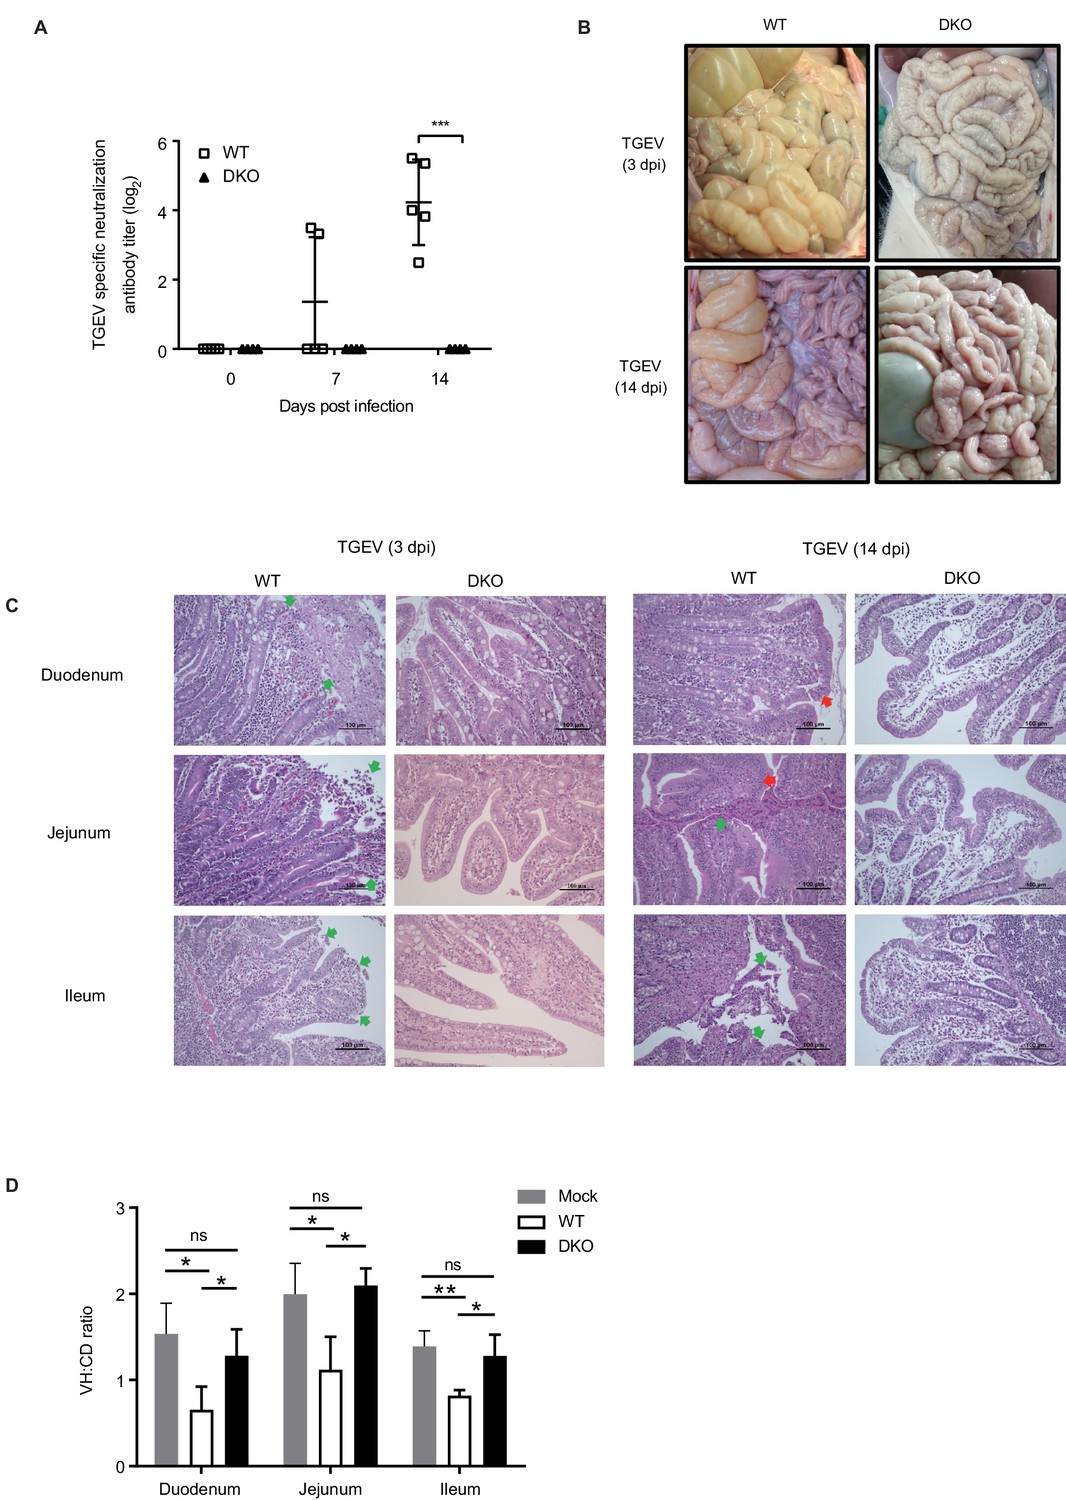
DKO pigs are resistant to TGEV infection.
(A) TGEV-specific antibody detection in serum of WT and DKO pigs at 0, 7, and 14 dpi. WT group: N = 5; DKO group: N = 4. (B) Representative macroscopic lesion of small intestines at 3 dpi (top) and 14 dpi (bottom) in WT and DKO pigs. (C) H and E staining of lesions small intestine sections derived from both WT and DKO pigs at 3 dpi (left) and 14 dpi (right). H and E staining shows intestinal villi fusion, plasma cells accumulating in the lamina propria, and infiltration of eosinophils (red arrow), and necrosis and shedding of intestinal mucosal epithelial cells (green arrow). (D) The ratio of intestinal villus height to the crypt depth derived from both WT and DKO pigs at 3 dpi. Mock: duodenum to ileum, N = 3. WT: duodenum to ileum, N = 3. DKO: duodenum, N = 4; jejunum, N = 3; ileum, N = 4. Data are expressed as the mean ± SD. Statistical significance was determined by Student’s t-test; ns, p>0.05; *p<0.05; **p<0.01; ***p<0.001.
-
Figure 3—source data 1
TGEV-specific neutralization antibody in serum.
- https://cdn.elifesciences.org/articles/57132/elife-57132-fig3-data1-v1.xlsx
-
Figure 3—source data 2
The ratio of intestinal villus height to the crypt depth in TGEV group.
- https://cdn.elifesciences.org/articles/57132/elife-57132-fig3-data2-v1.xlsx
Figure 4 with 1 supplement
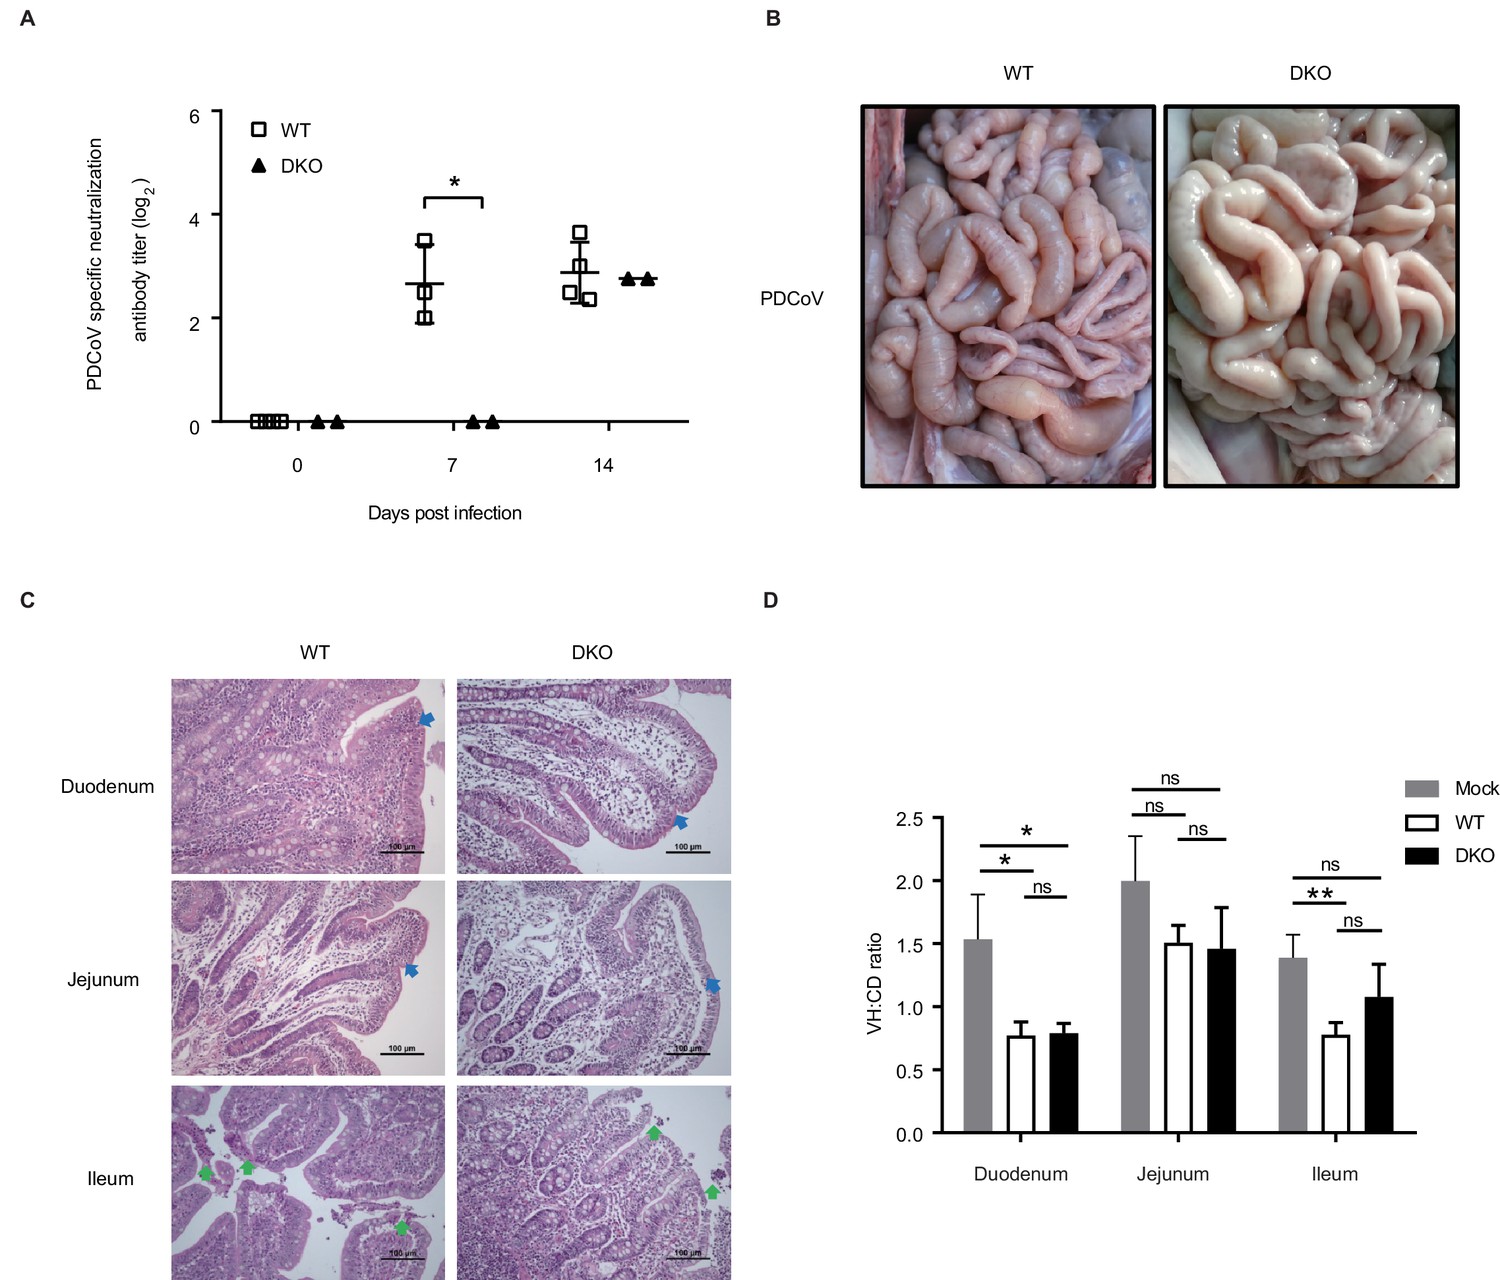
DKO pigs exhibit reduced susceptibility to PDCoV.
(A) PDCoV-specific antibody detection in serum from both WT and DKO pigs at 0, 7, and 14 dpi. WT group: 0 dpi, N = 4; 7 dpi, N = 3; 14 dpi, N = 4. DKO group, N = 2. (B) Representative macroscopic lesions of the small intestines at 14 dpi from WT and DKO groups of pigs challenged with PDCoV. (C) H and E staining of small intestine segments sections to detect lesions; small intestine tissues were derived from PDCoV-infected WT and DKO pigs. Intestinal villi fusion, infiltration of lymphocytes in the intestinal mucosa, and a large number in the intrinsic membrane (blue arrow), and necrosis and shedding of intestinal mucosal intraepithelial cells and naked lamina propria (green arrow). (D) The ratio of intestinal villus height to the crypt depth derived from both WT and DKO pigs at 14 dpi. Mock: duodenum to ileum, N = 3. WT: duodenum to ileum, N = 3. DKO: duodenum to ileum, N = 3. Data are expressed as the mean ± SD. Statistical significance was determined by Student’s t-test; ns, p>0.05; *p<0.05; **p<0.01; ***p<0.001.
-
Figure 4—source data 1
PDCoV-specific neutralization antibody in serum.
- https://cdn.elifesciences.org/articles/57132/elife-57132-fig4-data1-v1.xlsx
-
Figure 4—source data 2
The ratio of intestinal villus height to the crypt depth in PDCoV group.
- https://cdn.elifesciences.org/articles/57132/elife-57132-fig4-data2-v1.xlsx
Figure 4—figure supplement 1
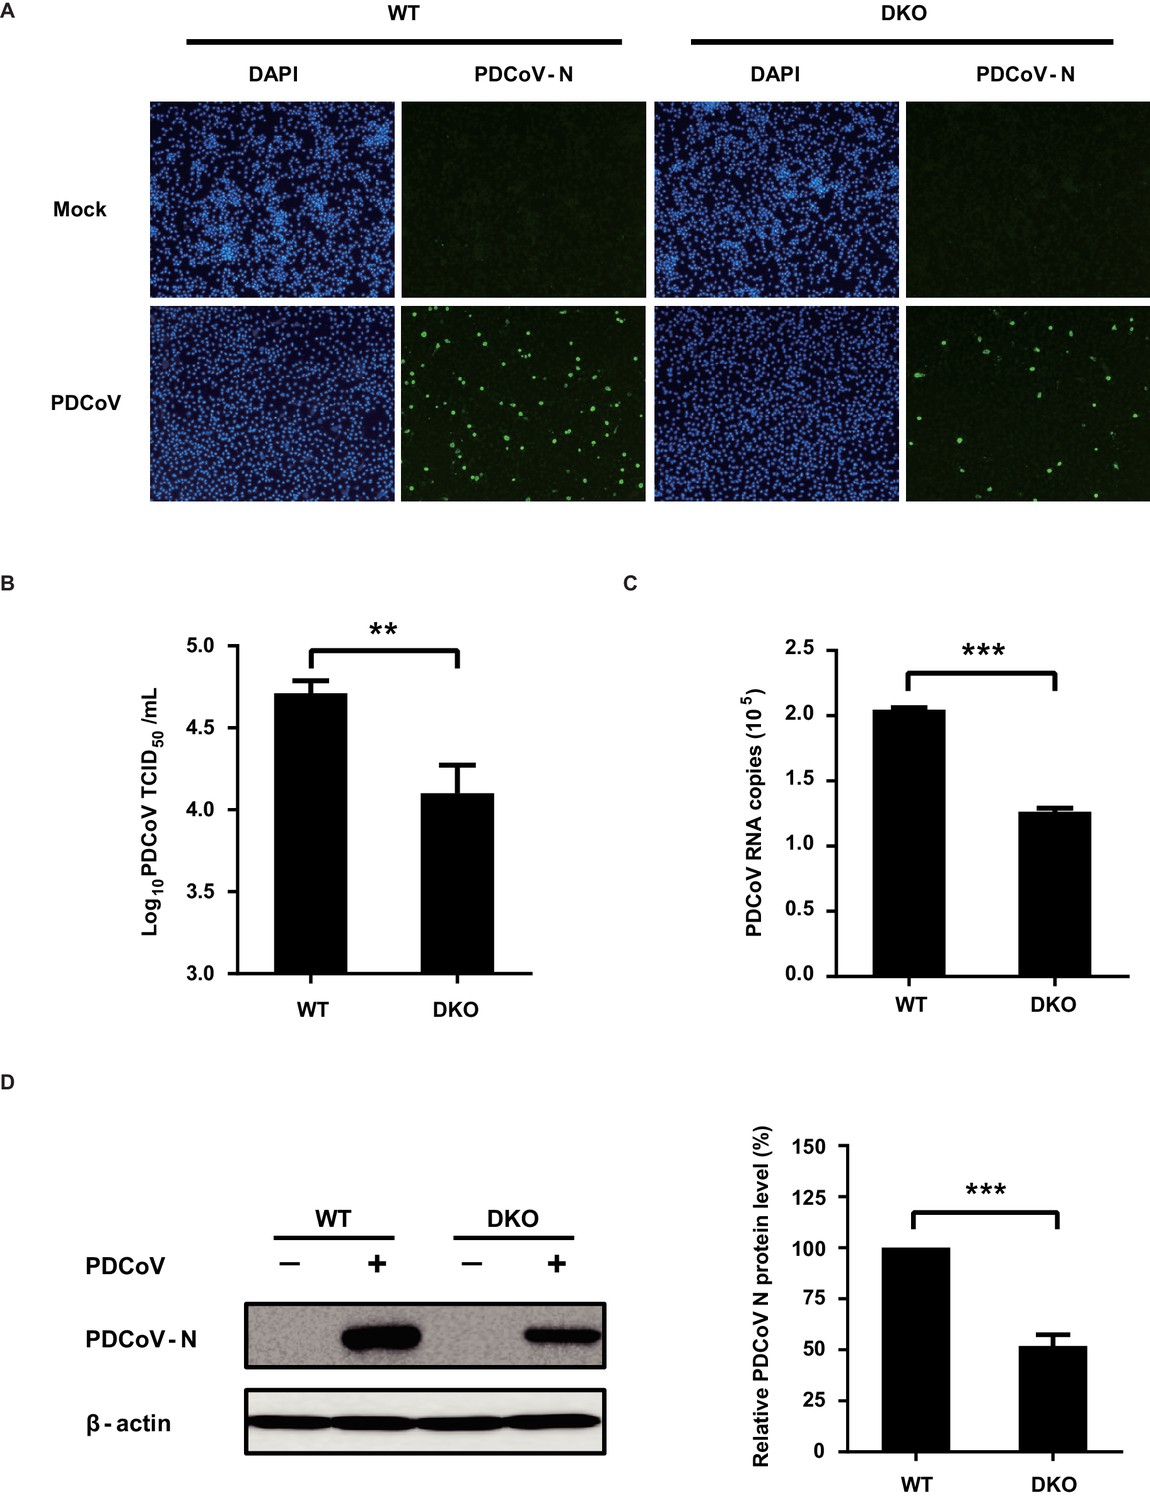
PAMs of DKO pigs exhibit reduced susceptibility to PDCoV.
(A) WT PAMs and DKO PAMs were infected or mock-infected with PDCoV (MOI = 10); at 24 hpi, PDCoV-N-specific fluorescence signals were detected by IFA. (B) WT PAMs and DKO PAMs were infected with PDCoV (MOI = 10); at 24 hpi, cells were collected and the viral titer was determined by TCID50 assays (in LLC-PK1 cells). (C, D) WT PAMs and DKO PAMs were infected with PDCoV (MOI = 10); at 24 hpi, cells were harvested and analyzed using qRT-PCR (C) and western blot assays (D). The PDCoV-N protein level was quantified by ImageJ. Data are expressed as the mean ± SD. Statistical significance was determined by Student’s t test; ns, p>0.05; *p<0.05; **p<0.01; ***p<0.001.
-
Figure 4—figure supplement 1—source data 1
The TCID50 detection of PDCoV titer in PAMs.
- https://cdn.elifesciences.org/articles/57132/elife-57132-fig4-figsupp1-data1-v1.xlsx
-
Figure 4—figure supplement 1—source data 2
The qRT-PCR detection of PDCoV RNA copies in PAMs.
- https://cdn.elifesciences.org/articles/57132/elife-57132-fig4-figsupp1-data2-v1.xlsx
-
Figure 4—figure supplement 1—source data 3
The western blot detection of the relative PDCoV-N protein level in PAMs.
- https://cdn.elifesciences.org/articles/57132/elife-57132-fig4-figsupp1-data3-v1.xlsx
Figure 5
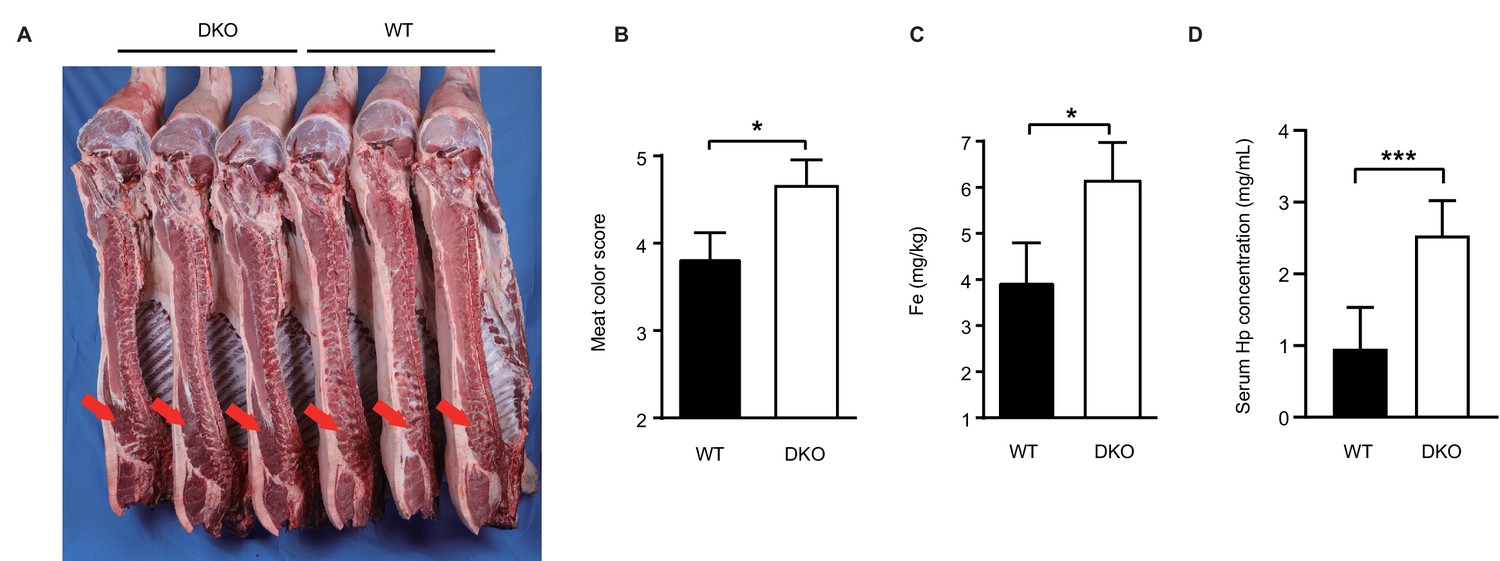
DKO pigs maintain normal production performance.
(A) Carcass photo of DKO and WT pigs. The meat of DKO pigs becomes darker red (red arrow). (B) Meat color scores for WT and DKO pigs. WT group: N = 3; DKO group: N = 3. (C) Detection of Fe content in longissimus dorsi muscle from both experimental groups. WT group: N = 3; DKO group: N = 3. (D) Serum Hp levels of WT and DKO pigs. WT group: N = 22; DKO group: N = 6. Data are expressed as the mean ± SD. Statistical significance was determined by Student’s t-test; ns, p>0.05; *p<0.05; **p<0.01; ***p<0.001.
-
Figure 5—source data 1
Meat color scores for WT and DKO pigs.
- https://cdn.elifesciences.org/articles/57132/elife-57132-fig5-data1-v1.xlsx
-
Figure 5—source data 2
Detection of Fe content in longissimus dorsi muscle from WT pigs and DKO pigs.
- https://cdn.elifesciences.org/articles/57132/elife-57132-fig5-data2-v1.xlsx
-
Figure 5—source data 3
Serum Hp levels of WT and DKO pigs.
- https://cdn.elifesciences.org/articles/57132/elife-57132-fig5-data3-v1.xlsx
Tables
Table 1
Carcass traits and meat quality characteristics of 11-month-old DKO and WT Large White pigs.
| Item | Mean ± SEM of WT | Mean ± SEM of DKO | p Value | |
|---|---|---|---|---|
| Live weight at slaughter (kg) | 160.6 ± 7.371 N=3 | 163.6 ± 3.215 N=3 | 0.7280 | ns |
| Carcass weight (kg) | 122.3 ± 6.930 N=3 | 127.2 ± 2.242 N=3 | 0.5433 | ns |
| Carcass length (cm) | 118.6 ± 1.468 N=3 | 117.6 ± 0.8988 N=3 | 0.6164 | ns |
| Dressing percentage (%) | 76.11 ± 0.9685 N=3 | 77.74 ± 0.2221 N=3 | 0.1763 | ns |
| Ham percentage (%) | 31.66 ± 0.6855 N=3 | 31.74 ± 0.5382 N=3 | 0.9313 | ns |
| Lean rate (%) | 69.94 ± 0.9530 N=3 | 66.74 ± 0.9995 N=3 | 0.08160 | ns |
| Loin eye area (cm2) | 55.79 ± 3.145 N=3 | 61.72 ± 3.515 N=3 | 0.2766 | ns |
| Average backfat thickness (mm) | 15.22 ± 0.4129 N=3 | 17.97 ± 2.076 N=3 | 0.2628 | ns |
| Muscle pH 1 | 6.100 ± 0.07211 N=3 | 6.183 ± 0.1676 N=3 | 0.6715 | ns |
| Muscle pH 24 | 5.673 ± 0.01764 N=3 | 5.670 ± 0.01000 N=3 | 0.8774 | ns |
| Meat color score | 3.833 ± 0.1667 N=3 | 4.667 ± 0.1667 N=3 | 0.02410 | * |
| Marbling | 1.167 ± 0.1667 N=3 | 1.167 ± 0.1667 N=3 | >0.9999 | ns |
| Drip loss (%) | 3.547 ± 0.3310 N=3 | 3.257 ± 0.1690 N=3 | 0.4788 | ns |
-
ns, p>0.05; *p<0.05.
-
Table 1—source data 1
Carcass traits and meat quality characteristics of DKO and WT Large White pigs.
- https://cdn.elifesciences.org/articles/57132/elife-57132-table1-data1-v1.xlsx
Table 2
Total protein, total fat, ash, moisture, and individual mineral content of DKO lean meat and WT lean meat.
| Item | Mean ± SEM of WT | Mean ± SEM of DKO | p Value | |
|---|---|---|---|---|
| Total protein (%) | 23.40 ± 0.2517 N=3 | 23.03 ± 0.3930 N=3 | 0.4760 | ns |
| Total fat (%) | 1.100 ± 0.1528 N=3 | 2.033 ± 0.3712 N=3 | 0.0807 | ns |
| Ash (%) | 1.100 ± 0 N=3 | 1.100 ± 0 N=3 | ||
| Moisture (%) | 73.73 ± 0.6360 N=3 | 72.90 ± 0.6083 N=3 | 0.3973 | ns |
| P (mg/100 g) | 220.0 ± 2.000 N=3 | 219.3 ± 3.333 N=3 | 0.8722 | ns |
| Ca (mg/kg) | 36.33 ± 2.134 N=3 | 43.17 ± 6.598 N=3 | 0.3802 | ns |
| Cu (mg/kg) | <0.5000 | <0.5000 | ||
| Fe (mg/kg) | 3.953 ± 0.4872 N=3 | 6.160 ± 0.4701 N=3 | 0.0311 | * |
| K (g/kg) | 3.293 ± 0.2972 N=3 | 2.897 ± 0.1821 N=3 | 0.3186 | ns |
| Mg (mg/kg) | 260.3 ± 0.3333 N=3 | 262.3 ± 1.202 N=3 | 0.1841 | ns |
| Mn (mg/kg) | <0.3000 | <0.3000 | ||
| Na (mg/kg) | 353.3 ± 6.360 N=3 | 356.0 ± 14.50 N=3 | 0.8744 | ns |
| Se (mg/kg) | 0.1013 ± 0.004667 N=3 | 0.08200 ± 0.008660 N=3 | 0.1208 | ns |
-
ns, p>0.05; *p<0.05.
-
Table 2—source data 1
Total protein, total fat, ash, moisture, and individual mineral content of DKO lean meat and WT lean meat.
- https://cdn.elifesciences.org/articles/57132/elife-57132-table2-data1-v1.xlsx
Table 3
Comparison of the concentration, motility, and velocity distribution of the sperm between DKO and WT Large White pigs.
| Item | Mean ± SEM of WT | Mean ± SEM of DKO | p Value | |
|---|---|---|---|---|
| Concentration (106/mL) | 1089 ± 137.9 N=4 | 1176 ± 231.5 N=3 | 0.7461 | ns |
| Motility (%) | 88.00 ± 2.345 N=4 | 86.00 ± 3.215 N=3 | 0.6268 | ns |
| Rapid (%) | 2.000 ± 1.683 N=4 | 2.500 ± 0.7638 N=3 | 0.8206 | ns |
| Medium (%) | 33.25 ± 1.702 N=4 | 35.50 ± 11.79 N=3 | 0.8320 | ns |
| Slow (%) | 52.25 ± 2.926 N=4 | 48.00 ± 9.504 N=3 | 0.6449 | ns |
| Static (%) | 12.00 ± 2.345 N=4 | 14.00 ± 3.215 N=3 | 0.6268 | ns |
-
ns, p>0.05.
-
Table 3—source data 1
Comparison of the concentration, motility, and velocity distribution of the sperm between DKO and WT Large White pigs.
- https://cdn.elifesciences.org/articles/57132/elife-57132-table3-data1-v1.xlsx
Key resources table
| Reagent type (species) or resource | Designation | Source or reference | Identifiers | Additional information |
|---|---|---|---|---|
| Gene (Sus scrofa) | CD163 | Sus scrofa (pig) Genome Database | GenBank: NC_010447 | |
| Gene (Sus scrofa) | pAPN | Sus scrofa (pig) Genome Database | GenBank: NC_010449.5 | |
| Strain, strain background (highly pathogenic porcine reproductive and respiratory syndrome virus (HP-RRSV)) | WUH3 | Li et al., 2009 | GenBank: HM853673 | |
| Strain, strain background (transmissible gastroenteritis virus (TGEV)) | WH-1 | An et al., 2014 | GenBank: HQ462571 | |
| Strain, strain background (Porcine deltacoronavirus (PDCoV)) | CHN-HN-2014 | Dong et al., 2016 | GenBank: KT336560 | |
| Genetic reagent (Sus scrofa) | Large White pigs | Ninghe national original pig farm | The Large White pigs used in this experiment were of the same strain | |
| Cell line (Sus scrofa) | pig fetal fibroblasts (PEFs) (Large White pigs) | Ruan et al., 2015 | Primary cell line: PEFs were isolated from 35-day-old male Large White pigs | |
| Cell line (Sus scrofa) | porcine alveolar macrophages (PAMs) (Large White pigs) | Wensvoort et al., 1991 | Primary cell line: PAMs were isolated from DKO Large White piglets and WT Large White piglets | |
| Cell line (Sus scrofa) | ST cells | ATCC | ATCC: CRL-1746; RRID:CVCL_2204 | |
| Cell line (Sus scrofa) | LLC-PK1 cells | ATCC | ATCC: CL-101; RRID:CVCL_0391 | |
| Antibody | anti-CD163 (rabbit polyclonal) | Proteintech | Proteintech:16646–1-AP; RRID:AB_2756528 | WB (1:1000) |
| Antibody | anti-pAPN (rabbit polyclonal) | ABclonal | Abclonal: A5662; RRID:AB_2766422 | WB (1:500) |
| Antibody | anti-GAPDH (rabbit monoclonal) | Cell Signaling | Cell Signaling: 3683; RRID:AB_1642205 | WB (1:1000) |
| Antibody | anti-PRRSV-N (mouse monoclonal) | Jiang et al., 2010 | WB (1:2000) (Made in our laboratory) | |
| Antibody | anti- PDCoV-N (mouse monoclonal) | Luo et al., 2016 | WB (1:1000) (Made in our laboratory) | |
| Antibody | anti-β-actin (rabbit monoclonal) | ABclonal | Abclonal: AC026; RRID:AB_2768234 | WB (1:5000) |
| Antibody | anti-PDCoV-N (mouse monoclonal) | Luo et al., 2016 | IFA (1:100) (Made in our laboratory) | |
| Antibody | anti-CD163 (mouse monoclonal) | Bio-Rad | Bio-Rad: MCA2311PE; RRID:AB_1510025 | Flow cytometry (1:10) |
| Antibody | anti-pAPN (rabbit monoclonal) | Abcam | Abcam: ab108310; RRID:AB_10866195 | IHC (1:300) |
| Antibody | anti-PRRSV-N (mouse monoclonal) | State Key Laboratory of Agricultural Microbiology, College of Veterinary Medicine, Huazhong Agricultural University, Wuhan, China | IHC (1:800) (Made in our laboratory) | |
| Recombinant DNA reagent | pX330 vector | Addgene | Addgene: #42230 | |
| Commercial assay or kit | enzyme-linked immunosorbent assay (ELISA) kit for PRRSV antibody detection | IDEXX Laboratories Inc | DEXX Laboratories:99–40959 | |
| Commercial assay or kit | enzyme-linked immunosorbent assay (ELISA) kit for detection of the content of Hp in serum | Alpha Diagnostic | Alpha Diagnostic:6250–40 | |
| Software, algorithm | GraphPad Prism software | GraphPad Prism | Version 6.0.0; RRID:SCR_002798 |
Additional files
-
Source data 1
Amino acid content of DKO lean meat and WT lean meat.
- https://cdn.elifesciences.org/articles/57132/elife-57132-data1-v1.xlsx
-
Source data 2
Birth weights and average daily gains of WT pigs and DKO pigs from birth weight to slaughtering weight.
- https://cdn.elifesciences.org/articles/57132/elife-57132-data2-v1.xlsx
-
Supplementary file 1
Genotypes of cell lines used in somatic cell nuclear transfer.
- https://cdn.elifesciences.org/articles/57132/elife-57132-supp1-v1.docx
-
Supplementary file 2
Embryo transfer data for CD163 and pAPN DKO pigs.
- https://cdn.elifesciences.org/articles/57132/elife-57132-supp2-v1.docx
-
Supplementary file 3
Potential off-target sites identified for CD163 sgRNA and pAPN sgRNA.
- https://cdn.elifesciences.org/articles/57132/elife-57132-supp3-v1.docx
-
Supplementary file 4
Amino acid content of DKO lean meat and WT lean meat.
- https://cdn.elifesciences.org/articles/57132/elife-57132-supp4-v1.docx
-
Supplementary file 5
Primers for genotyping.
- https://cdn.elifesciences.org/articles/57132/elife-57132-supp5-v1.docx
-
Supplementary file 6
Primers for PCR detection of random integration.
- https://cdn.elifesciences.org/articles/57132/elife-57132-supp6-v1.docx
-
Supplementary file 7
Primers for off-target analysis.
- https://cdn.elifesciences.org/articles/57132/elife-57132-supp7-v1.docx
-
Supplementary file 8
Birth weights and average daily gains of of WT pigs and DKO pigs from birth weight to slaughtering weight.
- https://cdn.elifesciences.org/articles/57132/elife-57132-supp8-v1.docx
-
Transparent reporting form
- https://cdn.elifesciences.org/articles/57132/elife-57132-transrepform-v1.pdf
Download links
A two-part list of links to download the article, or parts of the article, in various formats.
Downloads (link to download the article as PDF)
Open citations (links to open the citations from this article in various online reference manager services)
Cite this article (links to download the citations from this article in formats compatible with various reference manager tools)
CD163 and pAPN double-knockout pigs are resistant to PRRSV and TGEV and exhibit decreased susceptibility to PDCoV while maintaining normal production performance
eLife 9:e57132.
https://doi.org/10.7554/eLife.57132


