Evidence for transmission of COVID-19 prior to symptom onset
- University of British Columbia, Canada
- Simon Fraser University, Canada
- National University of Singapore, Singapore
- Centre for Infectious Disease Control, National Institute for Public Health and the Environment, Netherlands
- Leiden University Medical Center, Netherlands
Figures
Figure 1
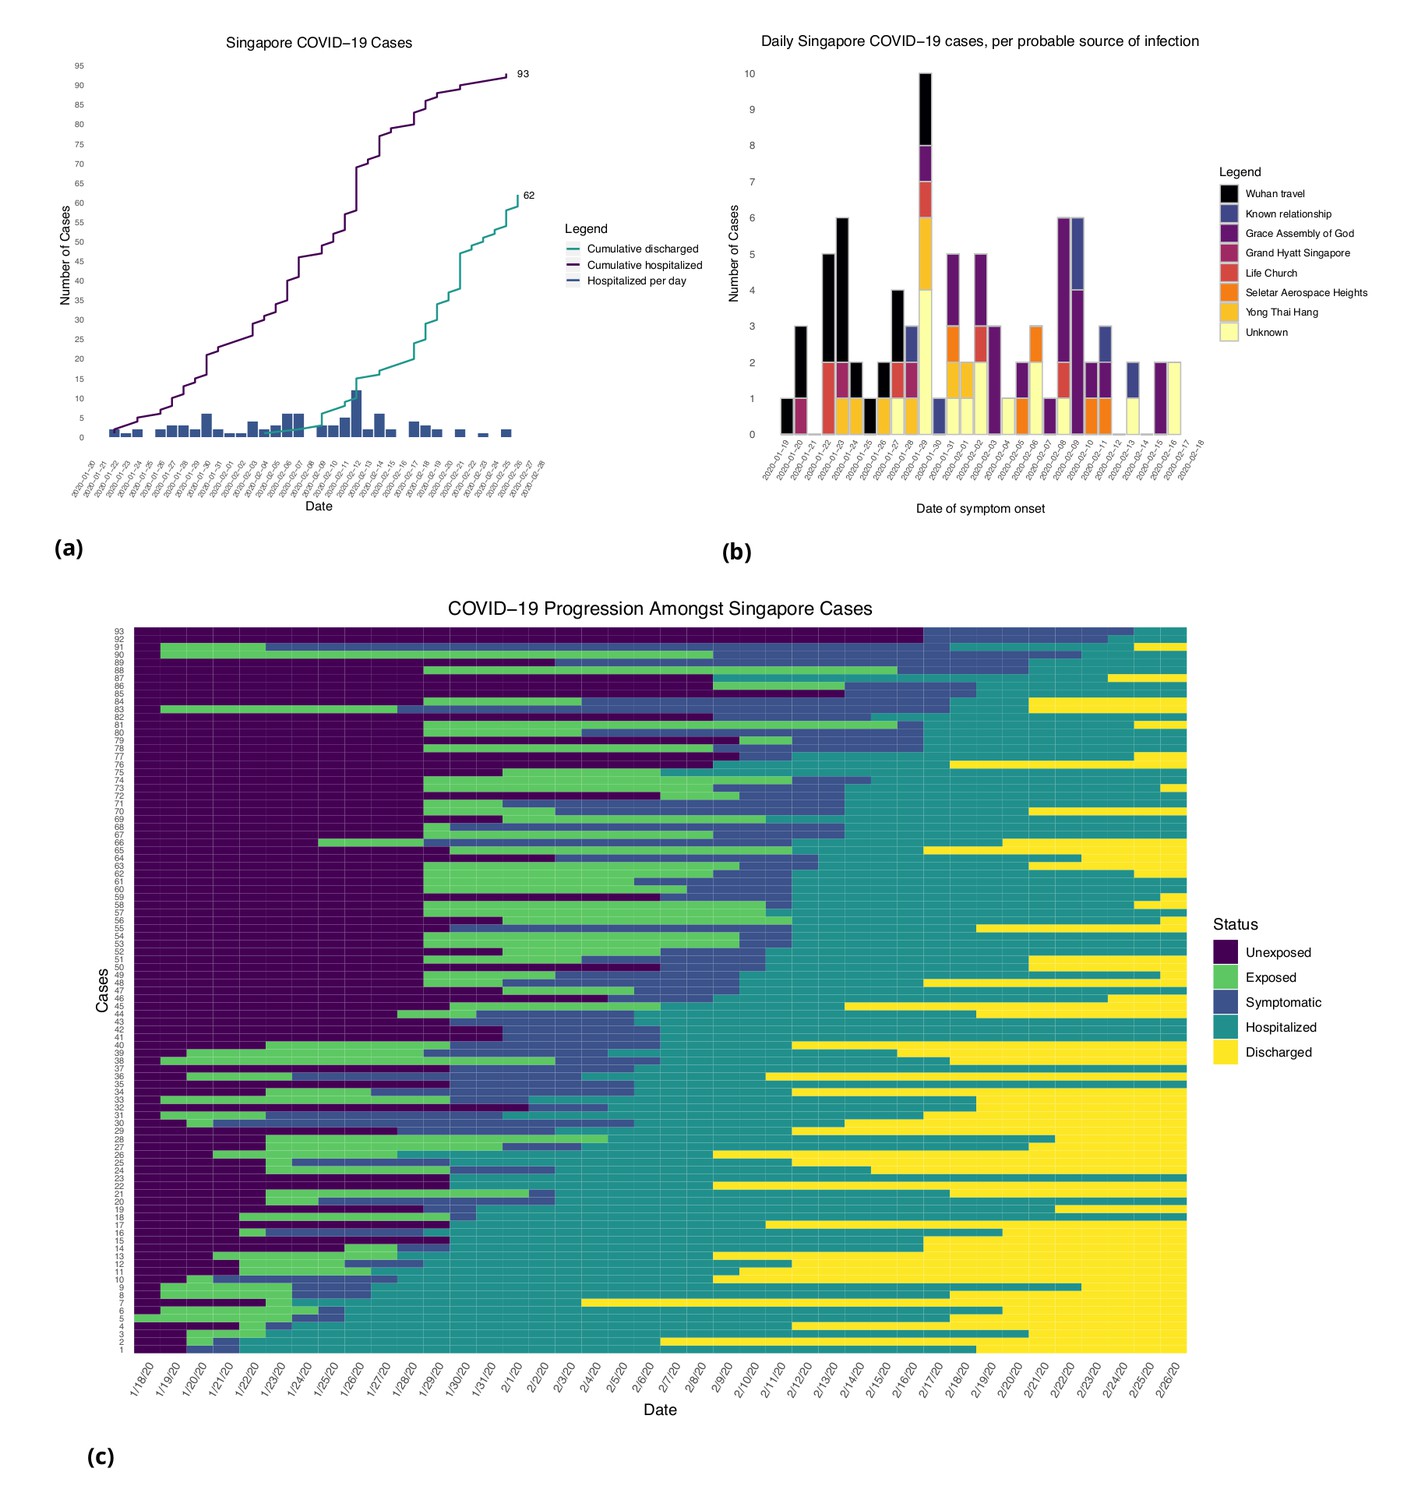
Singapore COVID-19 cases.
(a) Daily hospitalized cases and cumulative hospitalized and discharged cases. (b) Daily incidence with probable source of infection. (C) Disease timeline, including dates at which each case is unexposed, exposed, symptomatic, hospitalized, and discharged. Not all cases go through each status as a result of missing dates for some cases.
Figure 2
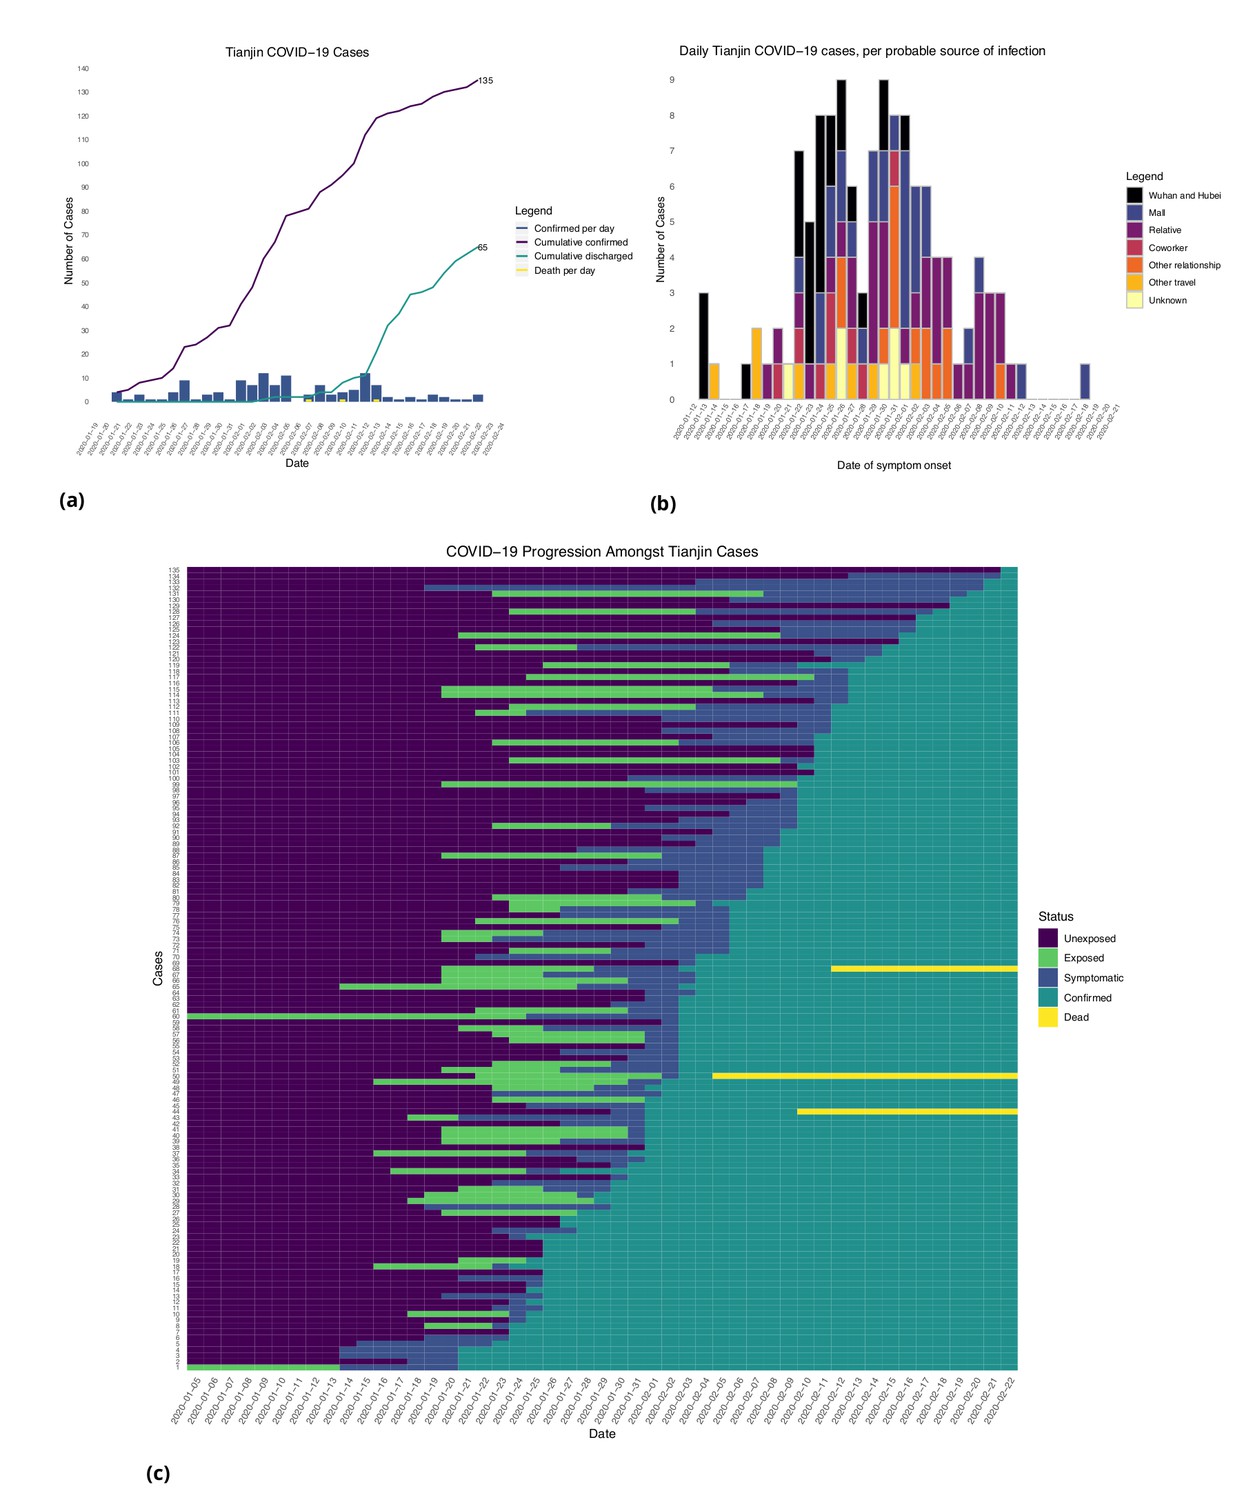
Tianjin COVID-19 cases.
(a) Daily and cumulative confirmed cases, cumulative discharges and daily death cases. (b) Daily incidence with probable source of infection. (c) Disease progression timeline; not all cases go through each status as a result of missing dates for some cases.
Figure 3
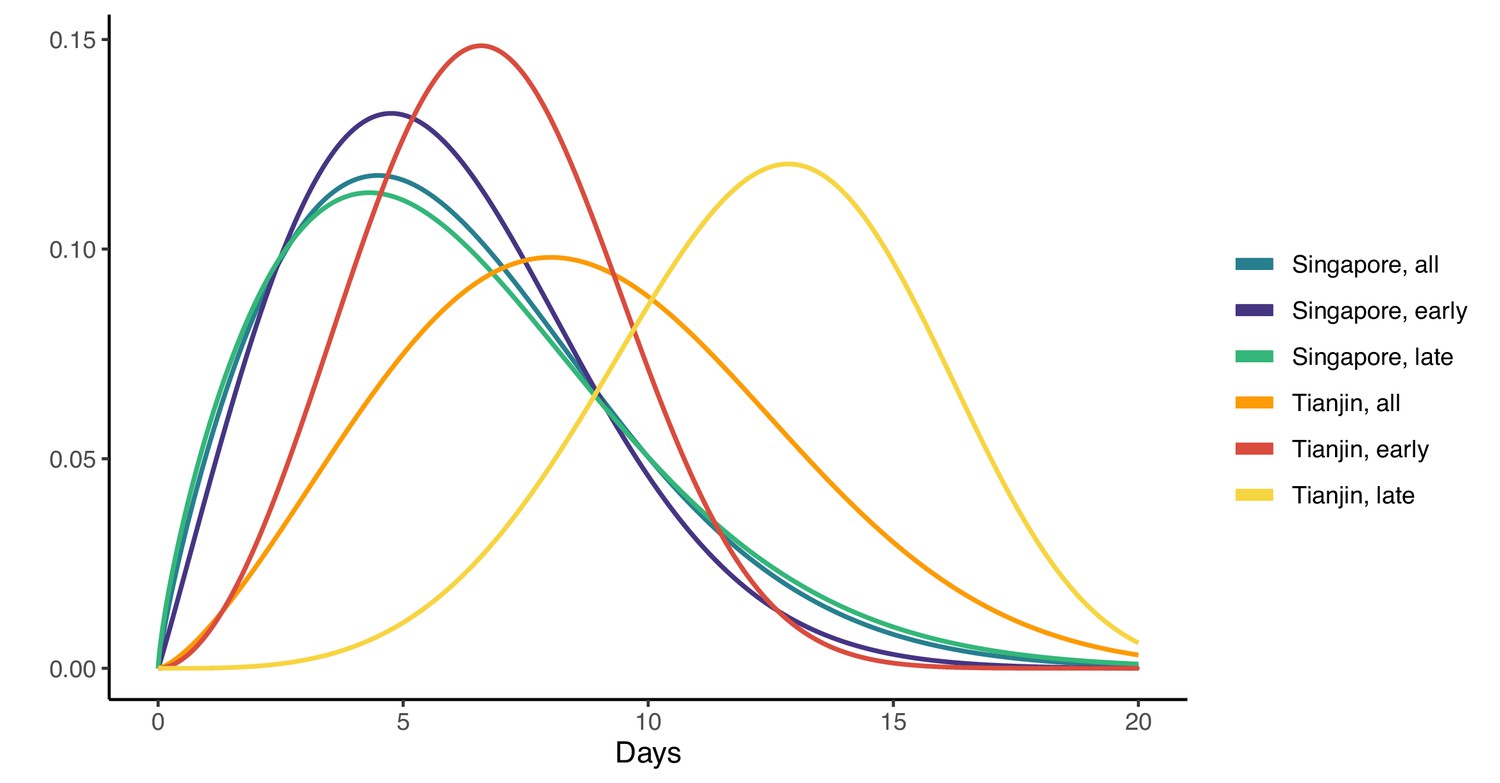
Fitted gamma COVID-19 incubation period distributions (without intermediates).
Cases are defined as ‘early’ if they have symptom onset on or prior to January 31, and are classified ‘late’ otherwise.
Figure 4
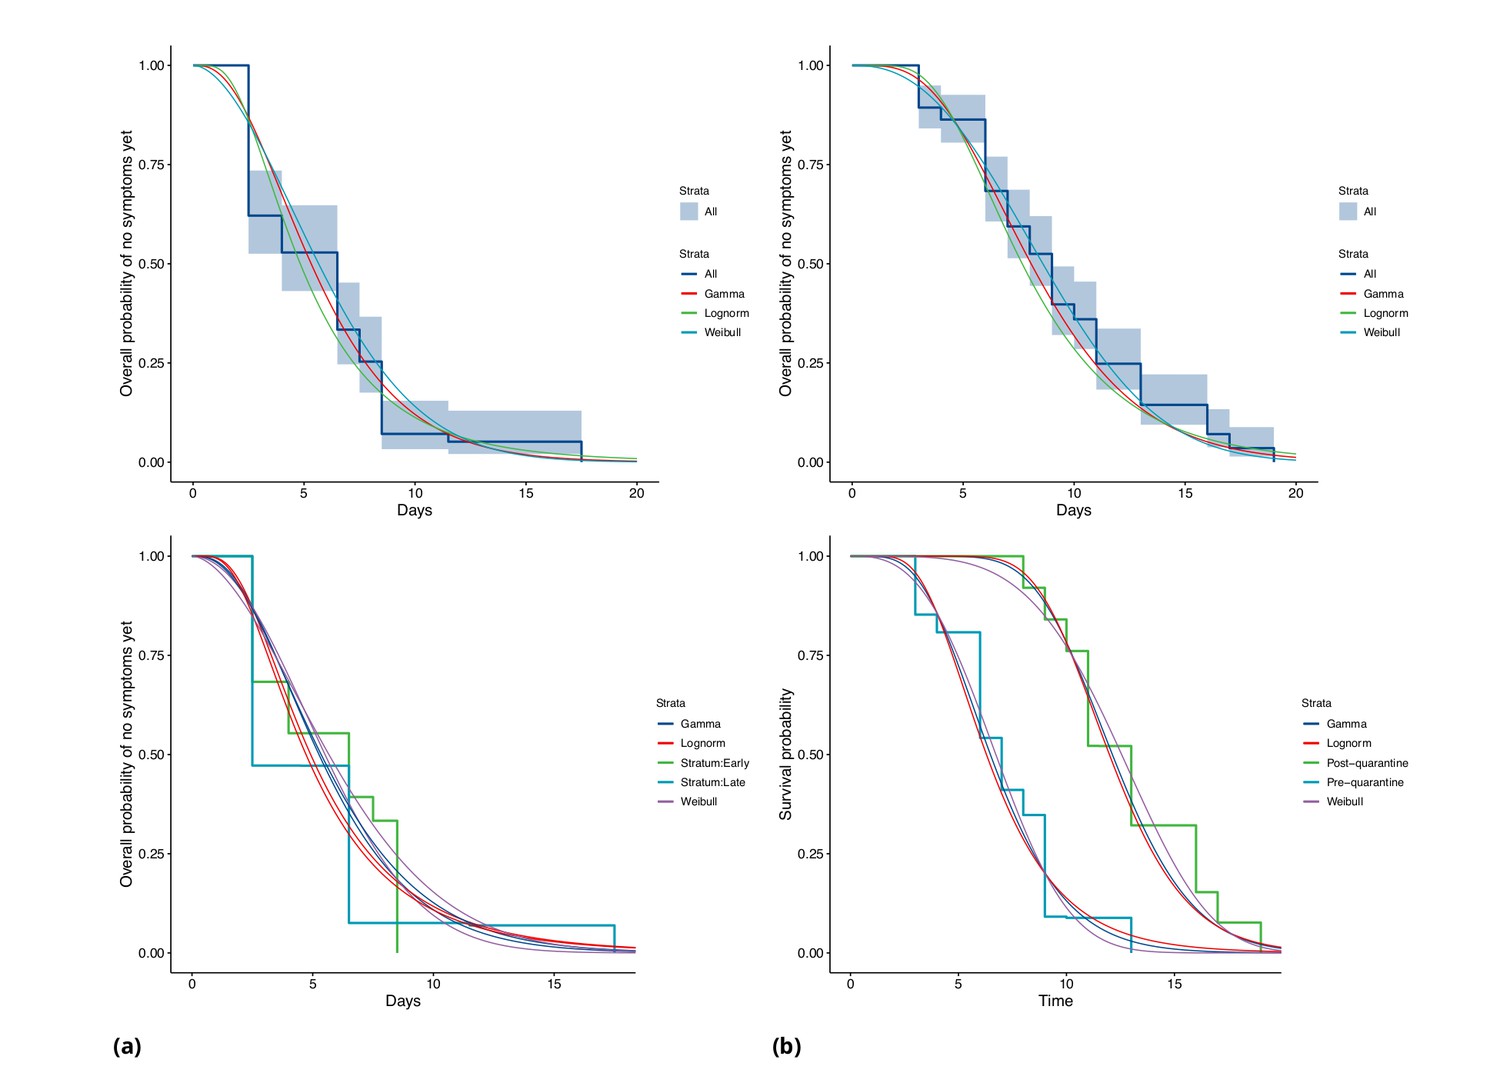
COVID-19 incubation period Kaplan-Meier curves for (a) Singapore and (b) Tianjin.
Top panels show unstratified data (all cases with symptom onset given). Bottom panels show ‘early’ and ‘late’ cases, where early cases are defined as those with symptom onset on or prior to January 31, and late otherwise.
Figure 5
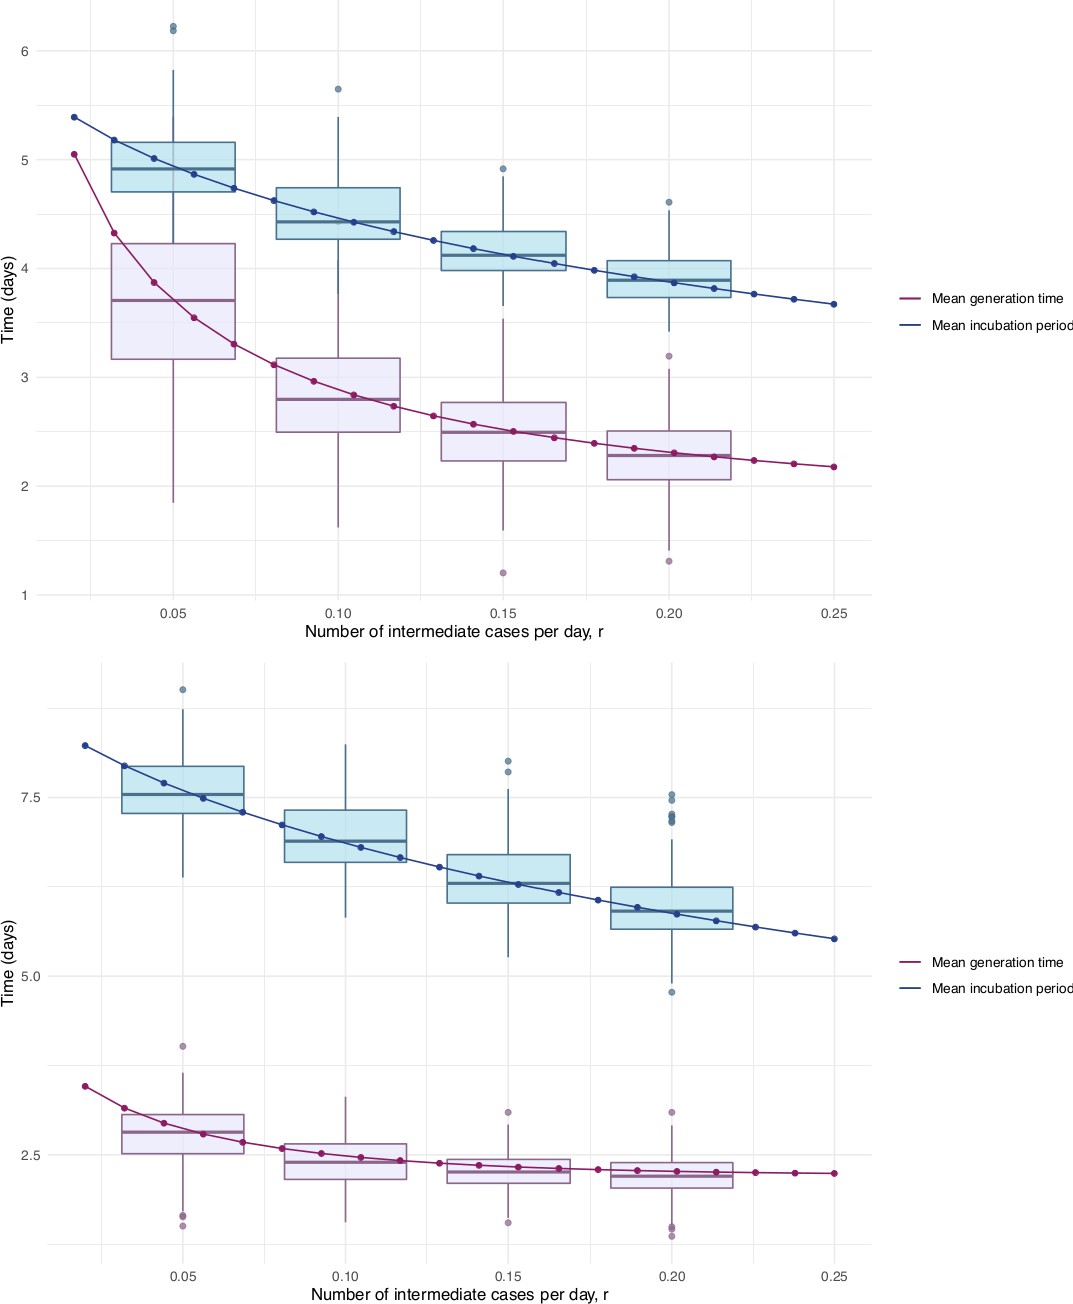
Mean incubation period and generation time estimates from the incubation period intermediates analysis, under the assumption that the scale parameter for both distributions is equal, shown with dependence on the mean number of unknown intermediate cases per day of the empirical time elapsed between exposure and symptom onset.
The incubation period is longer than the generation time, so this analysis suggests that symptom onset occurs after infectiousness begins. Top: Singapore. Bottom: Tianjin. The means are the scale times the shape, which is fixed at 2.1 in Singapore and 2.2 in Tianjin. Varying this fixed value for the shape parameter was not found to significantly impact the results.
Figure 6
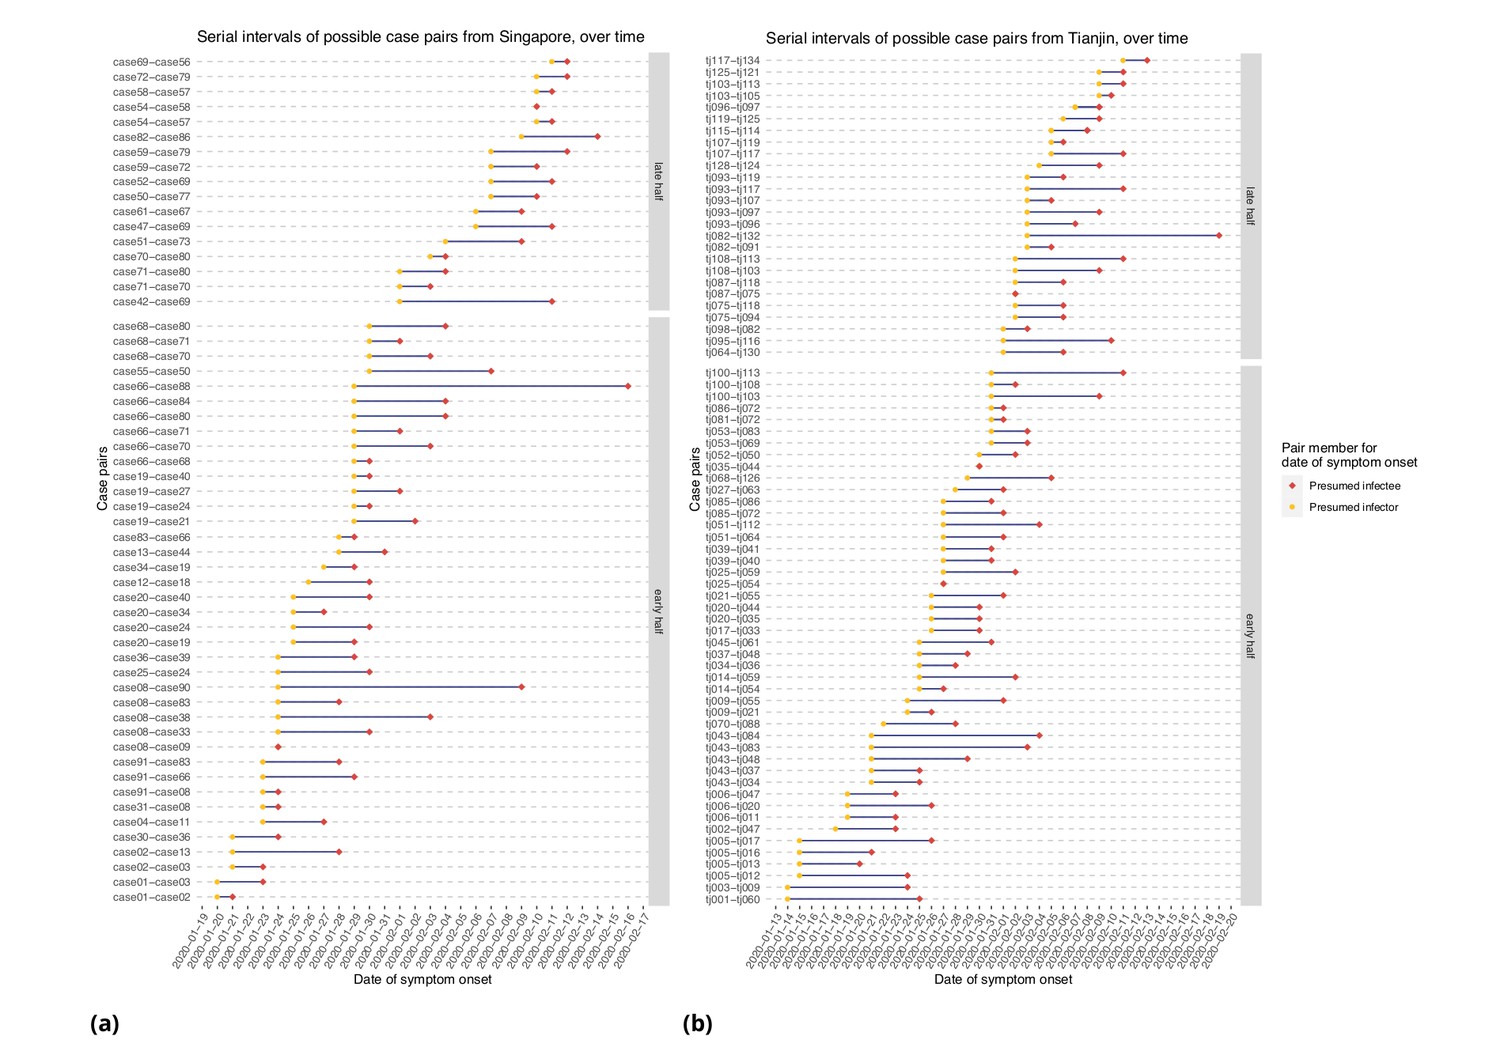
Serial intervals of possible case pairs in (a) Singapore and (b) Tianjin.
Pairs represent a presumed infector and their presumed infectee plotted by date of symptom onset. Cases are defined as 'early' if they have symptom onset on or prior to January 31st.
Figure 7
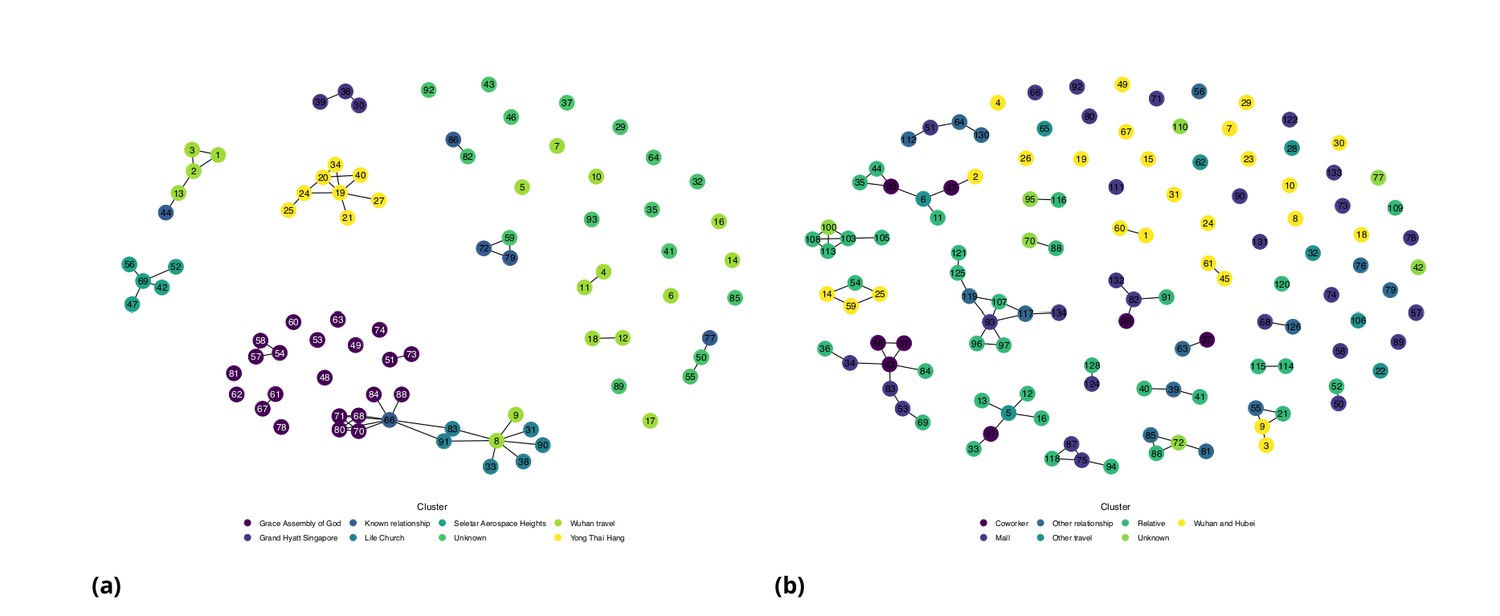
Network diagram for (a) Singapore (b) Tianjin.
Figure 8
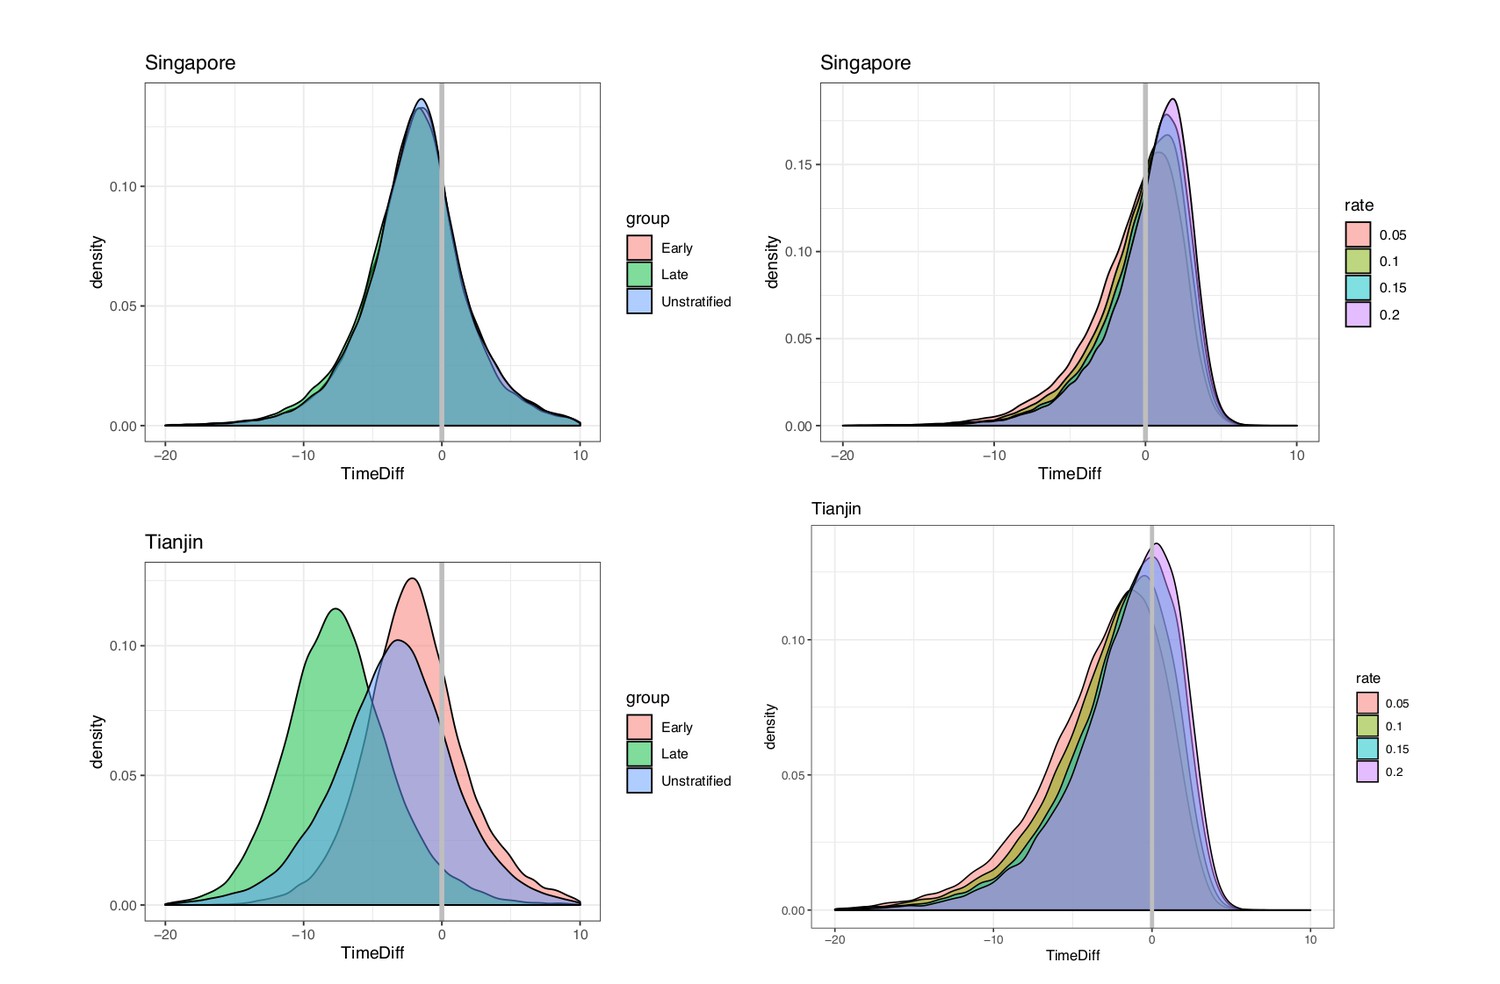
Pre-symptomatic infection as estimated by samples of (serial interval - incubation period), accounting for covariation.
Top: Singapore. Bottom: Tianjin. Left: without intermediates. Right: accounting for intermediates. Grey vertical line: 0. Samples below zero indicate pre-symptomatic transmission. In all cases there is substantial pre-symptomatic transmission.
Appendix 1—figure 1
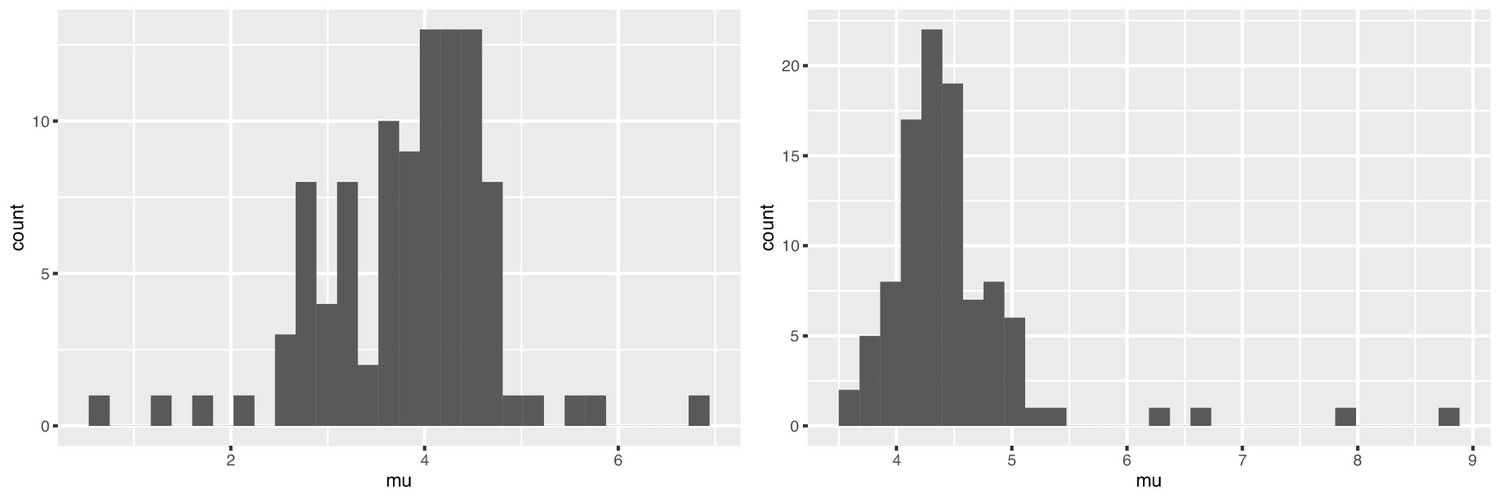
Bootstrap values of the mean serial interval for (left) Singapore and (right) Tianjin, based on 100 replicates using the first four cases in each cluster.
Tables
Table 1
Mean incubation period, serial interval and pre-symptomatic transmission.
Incubation periods are based on the gamma estimates because these are the most convenient for taking the covariation of serial intervals and incubation periods into account (done throughout the table). 95% CIs are provided in brackets.
| Without intermediates | Incubation (days) | Serial interval (days) | Mean difference (days) | Portion pre-symptomatic(-) |
|---|---|---|---|---|
| Singapore (all) | 5.99 (4.97, 7.14) | 4.0 (2.73, 5.57) | 1.99 | 0.74 |
| Singapore (early) | 5.91 (4.50,7.64) | 1.91 | 0.742 | |
| Singapore (late) | 6.06 (4.70, 7.67 ) | 2.06 | 0.744 | |
| Tianjin (all) | 8.68 (7.72, 9.7) | 5.0 (3.82, 6.12) | 3.68 | 0.81 |
| Tianjin (early) | 6.88 (5.97,7.87) | 1.88 | 0.72 | |
| Tianjin (late) | 12.4 (11.1,13.7) | 7.4 | 0.96 | |
| Account for intermediates | ||||
| Singapore | 4.91 | 4.17 (2.44, 5.89) | 0.77 | 0.53 |
| Singapore | 4.43 | 0.26 | 0.46 | |
| Singapore | 4.12 | −0.05 | 0.41 | |
| Singapore | 3.89 | −0.28 | 0.38 | |
| Tianjin | 7.54 | 4.31 (2.91, 5.72) | 3.23 | 0.79 |
| Tianjin | 6.89 | 2.58 | 0.74 | |
| Tianjin | 6.30 | 1.99 | 0.67 | |
| Tianjin | 5.91 | 1.6 | 0.64 | |
Appendix 1—table 1
Incubation period estimates (without intermediates) using gamma, Weibull and log normal distributions.
95% confidence intervals for the shape and scale (log mean and sd for log normal) parameters are shown in brackets.
| Gamma | Median | Shape | Scale |
|---|---|---|---|
| Singapore Cluster | 5.32 | 3.05 (2.0, 3.84) | 1.95 (1.23, 2.34) |
| Tianjin Cluster | 8.06 | 4.74 (3.35, 5.72) | 1.83 (1.29, 2.04) |
| Weibull | Median | Shape | Scale |
| Singapore Cluster | 5.66 | 1.83 (1.45, 2.30) | 6.91 (5.77, 8.29) |
| Tianjin Cluster | 8.59 | 2.41 (1.99, 2.90) | 10.01 (8.94, 11.20) |
| Log normal | Median | Log mean | Standard deviation |
| Singapore Cluster | 4.83 | 1.57 (1.38, 1.81) (mean 4.81) | 0.60 (0.47, 0.76) |
| Tianjin Cluster | 7.66 | 2.04 (1.92, 2.22) (mean 7.69) | 0.47 (0.39, 0.56) |
Appendix 1—table 2
Incubation period estimates (without intermediates) using stratified data
| Tianjin | |||
|---|---|---|---|
| Gamma | Median | Shape | Scale |
| Early | 6.48 | 6.01 (3.61, 7.26) | 1.140 (0.66,1.276) |
| Late | 12.1 | 17.78 (9.52, 21.47) | 0.695 (0.379,0.778) |
| Weibull | Median | Shape | Scale |
| Early | 6.73 | 2.88 (2.16, 3.48) | 7.643 (6.735, 8.553) |
| Late | 12.6 | 4.34 (3.10, 5.24) | 13.661 (12.245, 15.289) |
| Log normal | Median | Log mean | Standard deviation |
| Early | 6.30 | 1.84 (1.70,2.03) | 0.426 (0.331,0.547) |
| Late | 12.0 | 2.48 (2.38,2.67) | 0.233 (0.172,0.315) |
| Singapore | |||
| Gamma | Median | Shape | Scale |
| Early | 5.26 | 3.22 (1.67, 4.05) | 1.818 (0.847,2.18) |
| Late | 5.35 | 2.96 (1.68,3.72) | 2.034 (1.132,2.439) |
| Weibull | Median | Shape | Scale |
| Early | 5.51 | 2.05 (1.34,2.58) | 6.587 (5.077,7.897) |
| Late | 5.67 | 1.75 (1.29,2.21) | 6.989 (5.408,8.38) |
| Log normal | Median | Log mean | Standard deviation |
| Early | 4.91 | 1.59 (1.33,1.82) | 0.598 (0.421,0.848) |
| Late | 4.72 | 1.55 (1.25,1.78) | 0.606 (0.441,0.834) |
Appendix 1—table 3
Serial interval estimates: accounting for intermediates.
| ordering | Number cases per cluster | (Tianjin) | (Tianjin) | (Singapore) | (Singapore) |
|---|---|---|---|---|---|
| Onset | 3 | 4.17 | 0.998 | 4.03 | 1.06 |
| Onset | 4 | 4.31 | 0.935 | 4.17 | 1.06 |
| Onset | 5 | 4.43 | 0.999 | 4.43 | 1.09 |
| Onset | 6 | 4.54 | 1.05 | 4.76 | 1.15 |
| Last Exposure | 4 | 5.09 | 1.27 | 4.26 | 1.17 |
| Bootstrap | 4 | 4.49 (sd 0.716) | 0.995 (sd 0.307) | 3.83 (sd 0.882) | 1.24 (sd 0.538) |
Appendix 1—table 4
Serial interval estimates: accounting for intermediates and using imputed dates of symptom onset
| ordering | Number cases per cluster | (Tianjin) | (Tianjin) | (Singapore) | (Singapore) |
|---|---|---|---|---|---|
| Onset | 3 | 4.35 | 0.907 | 4.18 | 1.05 |
| Onset | 4 | 4.40 | 0.864 | 4.27 | 1.04 |
| Onset | 5 | 4.48 | 0.909 | 4.41 | 0.981 |
| Onset | 6 | 4.55 | 0.948 | 4.71 | 1.08 |
| Last Exposure | 4 | 4.81 | 0.948 | 4.62 | 2.11 |
| Bootstrap | 4 | 4.53 (sd 0.585) | 0.941 (sd 0.358) | 4.31 (sd 1.03) | 1.50 (sd 0.629) |
Appendix 1—table 5
Mean incubation period and mean serial interval estimates for COVID-19 generated by other studies.
| Data | Number of Cases | Mean Incubation Period (days) | Mean Serial Interval (days) | Reference |
|---|---|---|---|---|
| Wuhan first cases | 425 | 5.2 (95CI 4.1-7.0) | 7.5 (95CI 5.3-19) | Li et al., 2020b |
| South Korea first cases | 24 | 3.6 | 4.6 | Ki and Task Force for 2019-nCoV, 2020 |
| Travellers from Wuhan | 88 | 6.4 (95CI 5.6-7.7) | - | Backer et al., 2019 |
| Diagnosis outside Wuhan (excluding Wuhan residents) | 52 | 5.0 (95CI 4.2-6.0) | - | Linton et al., 2020 |
| Diagnosis outside Wuhan (including Wuhan residents) | 158 | 5.6 (95CI 5.0-6.3) | - | Linton et al., 2020 |
| Transmission chains in Hong Kong | 21 chains | - | 4.4 (95CI 2.9-6.7) | Zhao et al., 2020 |
| Infector-infectee pairs* | 28 pairs | - | 4.0 (95CI 3.1-4.9) | Nishiura et al., 2020 |
-
*Note: included 3 infector-infectee pairs from this Singapore cluster. Remainder from Vietnam (4), South Korea (7), Germany (4), Taiwan (1) and China (9).
Additional files
Download links
A two-part list of links to download the article, or parts of the article, in various formats.
Downloads (link to download the article as PDF)
Open citations (links to open the citations from this article in various online reference manager services)
Cite this article (links to download the citations from this article in formats compatible with various reference manager tools)
Evidence for transmission of COVID-19 prior to symptom onset
eLife 9:e57149.
https://doi.org/10.7554/eLife.57149


