Flotillin-mediated membrane fluidity controls peptidoglycan synthesis and MreB movement
- Molecular Microbiology, Groningen Biomolecular Sciences and Biotechnology Institute, University of Groningen, Netherlands
- Biozentrum, Ludwig-Maximilians-Universität München, Germany
- Institute for General Microbiology, Christian-Albrechts-University, Germany
- Institute of Chemistry & Biology of Membranes & Nanoobjects (UMR5248 CBMN), IECB, CNRS, Université Bordeaux, Institut Polytechnique Bordeaux, France
- Department of Drug Design and Optimization (DDOP), Helmholtz-Institute for Pharmaceutical Research Saarland (HIPS) - Helmholtz Centre for Infection Research (HZI), Germany
- Department of Pharmacy, Saarland University, Germany
- Stratingh Institute for Chemistry, University of Groningen, Netherlands
- Molecular Cell Biology, Groningen Biomolecular Sciences and Biotechnology Institute, University of Groningen, Netherlands
Figures
Figure 1 with 2 supplements
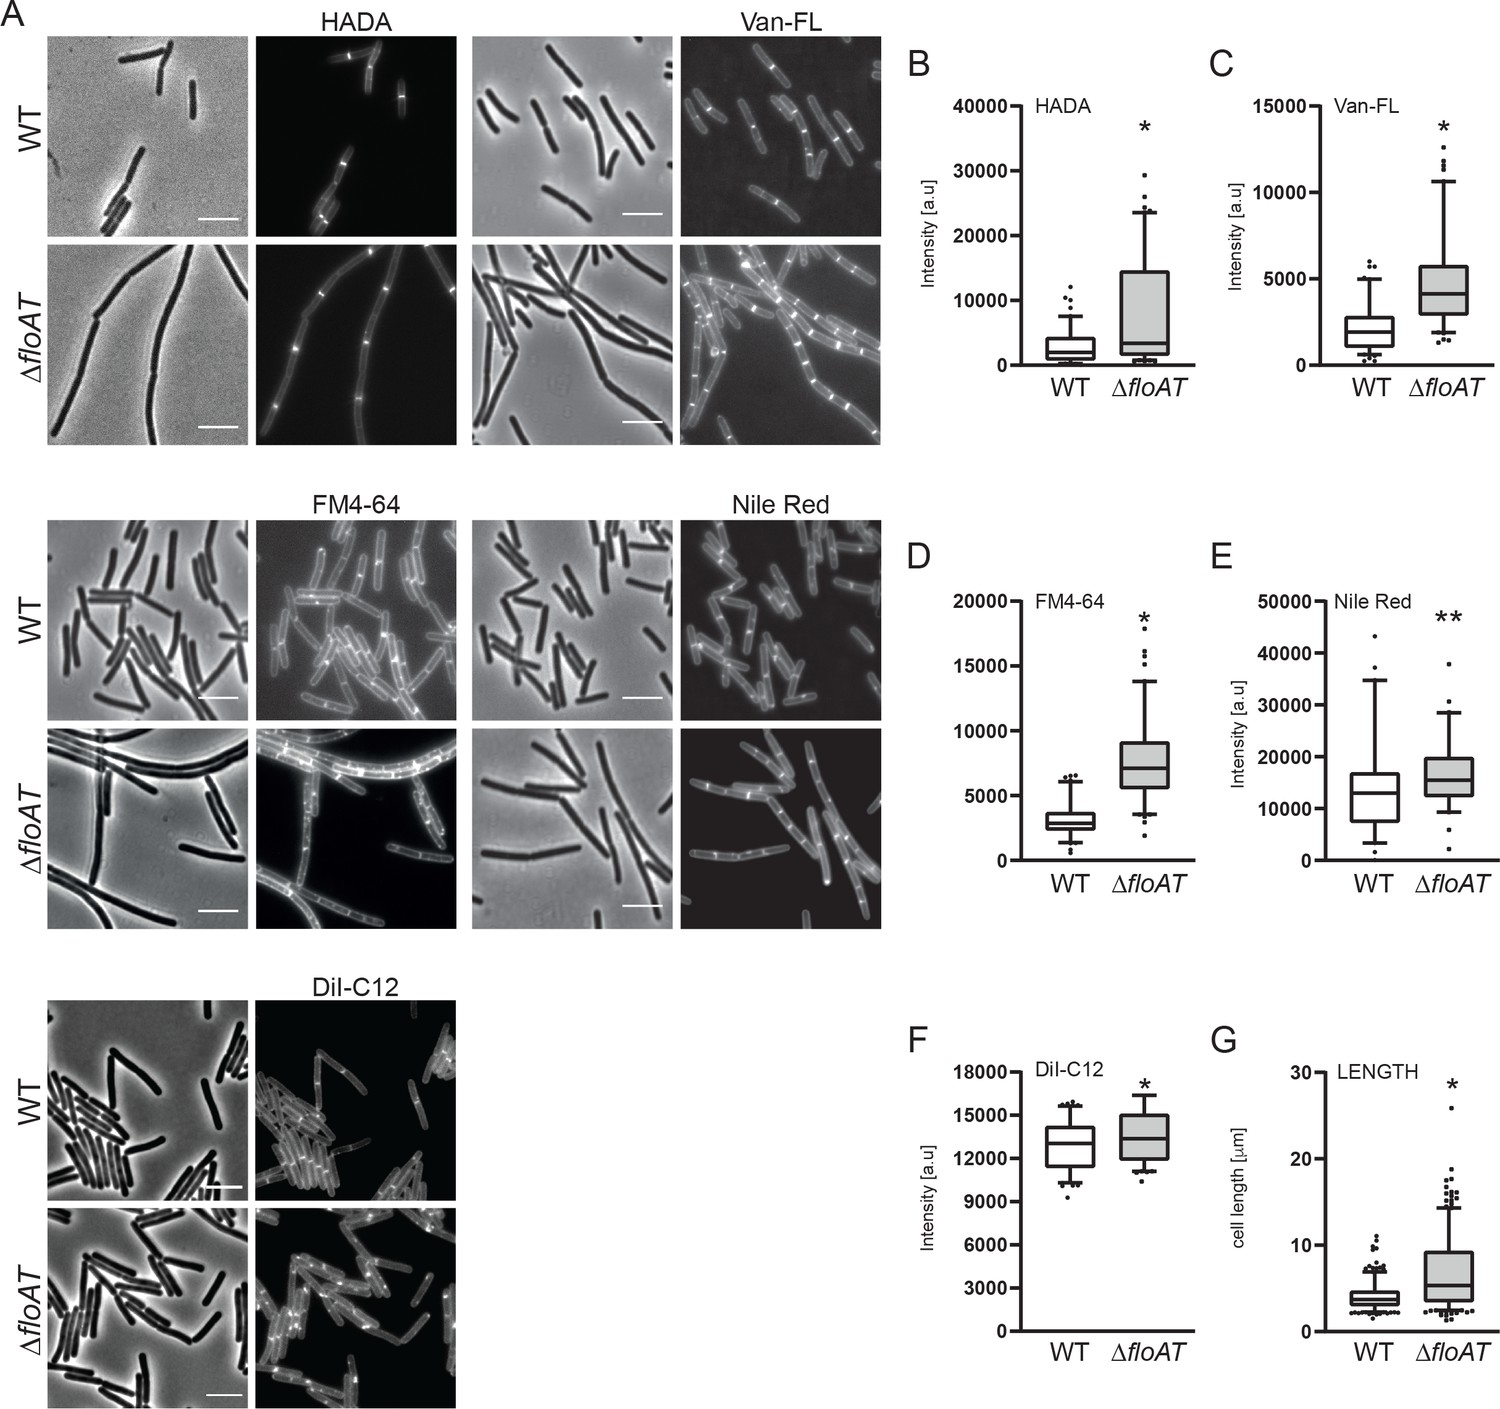
Accumulation of peptidoglycan synthesis and membrane material at division sites in a flotillin mutant.
(A) Morphology of the exponentially growing wild type (WT) and ΔfloAT strains labelled with HADA, fluorescent Vancomycin (Van-FL), FM 4–64, Nile Red, and DiI-C12. Scale bar: 5 μm. (B–F) Peak intensity of HADA (B), Van-FL (C), Nile Red (D), FM4-64 (E) and DiI-C12 (F) labelled division sites of the cells shown in (A). Cells from each strain (n ≥ 100, except E, n = 60) were analysed using the ObjectJ macro tool PeakFinder followed by statistical analysis with Prism. Significant differences are based on the two-tailed Mann-Whitney test (*p<0.05; **p<0.01). (G) Distribution of the cell length of the strains analysed in (A). Statistical analysis of the data (n = 100, two tailed Mann-Whitney test, *p<0.05) was performed with Prism, resulting in box plot graphs.
-
Figure 1—source data 1
Fluorescence intensity and cell length measurements.
- https://cdn.elifesciences.org/articles/57179/elife-57179-fig1-data1-v1.xlsx
Figure 1—figure supplement 1
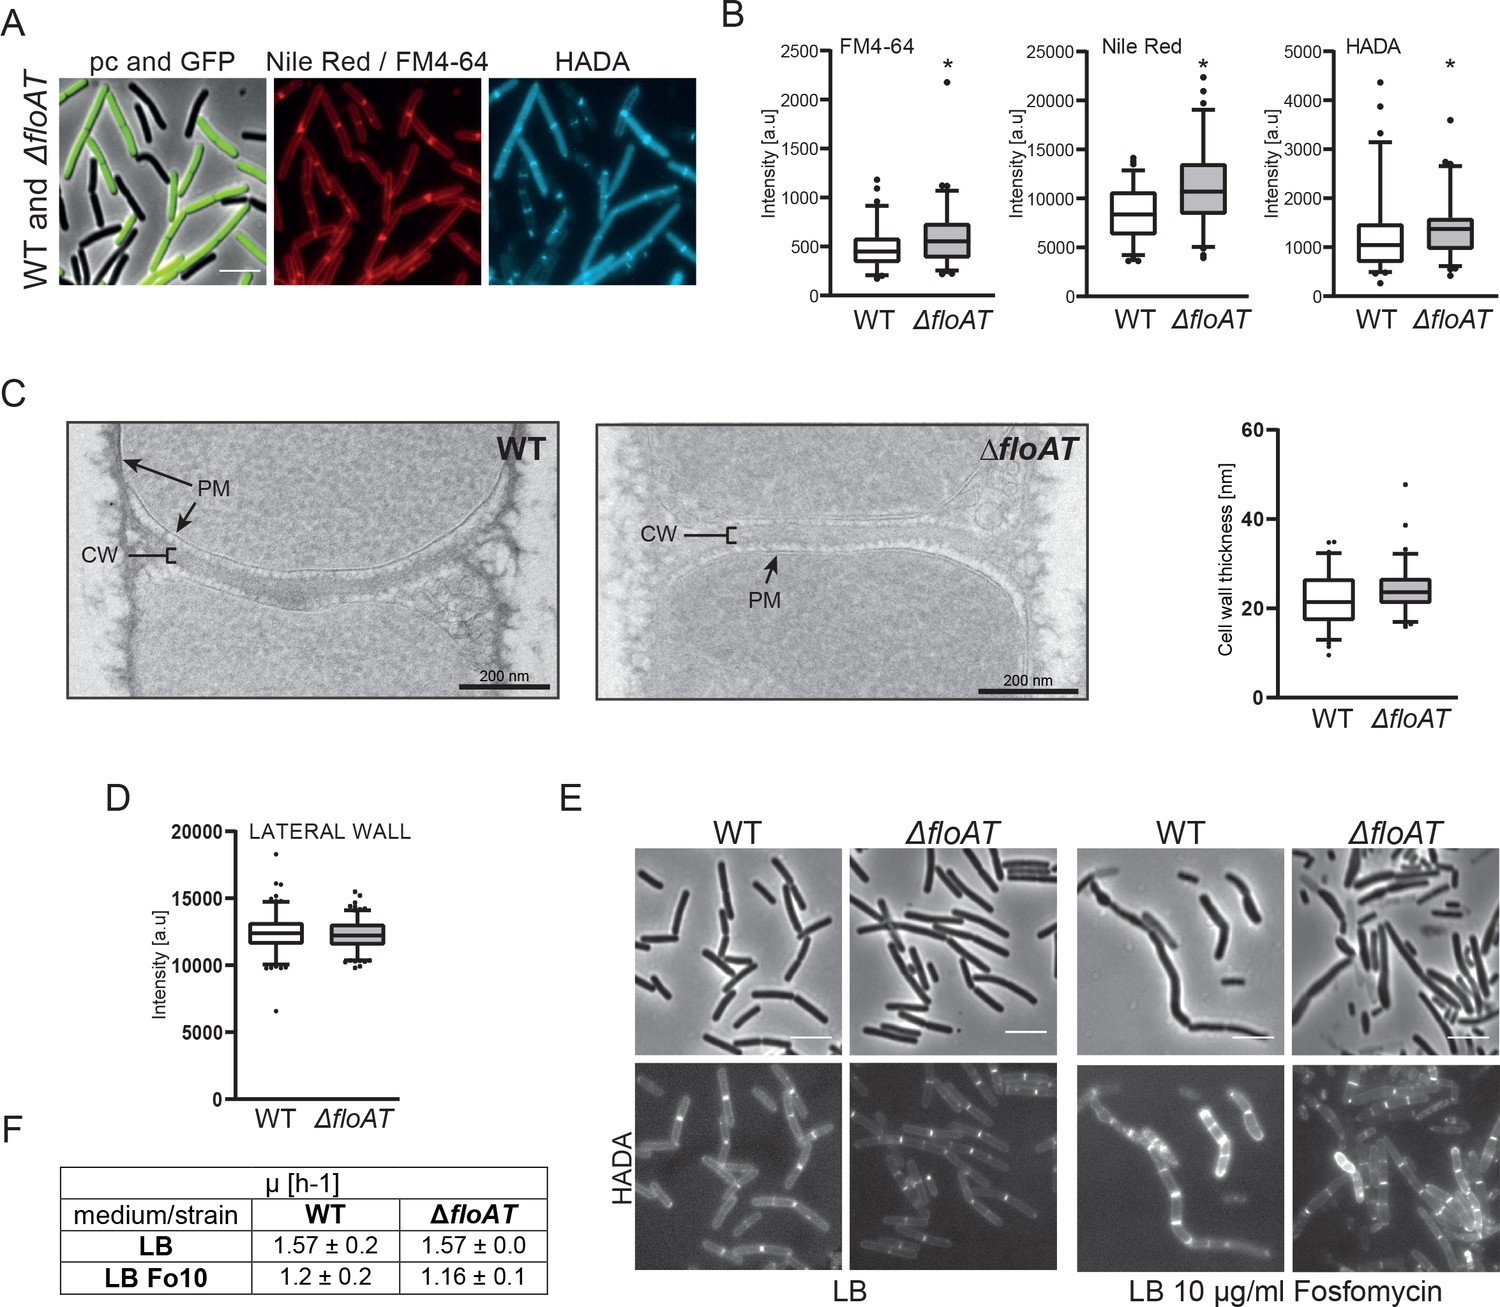
Control experiments showing that differences in septal labeling intensity are not due to microscopy settings, septum thickness, or dye diffusion.
(A) Morphology of the exponentially growing 4259 (WT-GFP) and ΔfloAT strains labelled simultaneously with Nile Red or FM 4–64 and HADA. (B) Septal peak intensity of FM4-64, Nile Red and HADA labelled division sites of the cells shown in (A). Cells from each strain (n = 70) were analysed on the same agarose pad using the ObjectJ macro tool PeakFinder followed by statistical analysis with Prism resulting in box plot graphs. Significant differences are based on the two-tailed Mann-Whitney test (*p<0.05). (C) Electron micrographs of the septal plane of the exponentially growing 168 (WT) and ΔfloAT strains alongside with a comparison of their cell wall thickness analysis represented as box plot graphs (n = 70). (D) Peak intensities of Nile-Red labelling of the lateral membranes of the WT and ΔfloAT strains depicted in (A). A Mann-Whitney T-test (p<0.05, n ≥ 160), showed no significant statistical difference in intensity between the tested strains. (E) Morphology of exponentially growing 168 (WT) and ΔfloAT strains cultivated in rich (LB) medium grown with or without a sub-lethal concentration of Fosfomycin (LB + 10 μg/ml Fosfomycin) and labelled with HADA. Scale bar 5 μm. (F) Growth rate of the cells depicted in (E) based on two biological replicates and three technical repetitions.
-
Figure 1—figure supplement 1—source data 1
Growth data plotted in FS1F.
- https://cdn.elifesciences.org/articles/57179/elife-57179-fig1-figsupp1-data1-v1.xlsx
-
Figure 1—figure supplement 1—source data 2
Data plotted in F1F1Sb, F1FS1C, F1FS1.
- https://cdn.elifesciences.org/articles/57179/elife-57179-fig1-figsupp1-data2-v1.xlsx
Figure 1—figure supplement 2
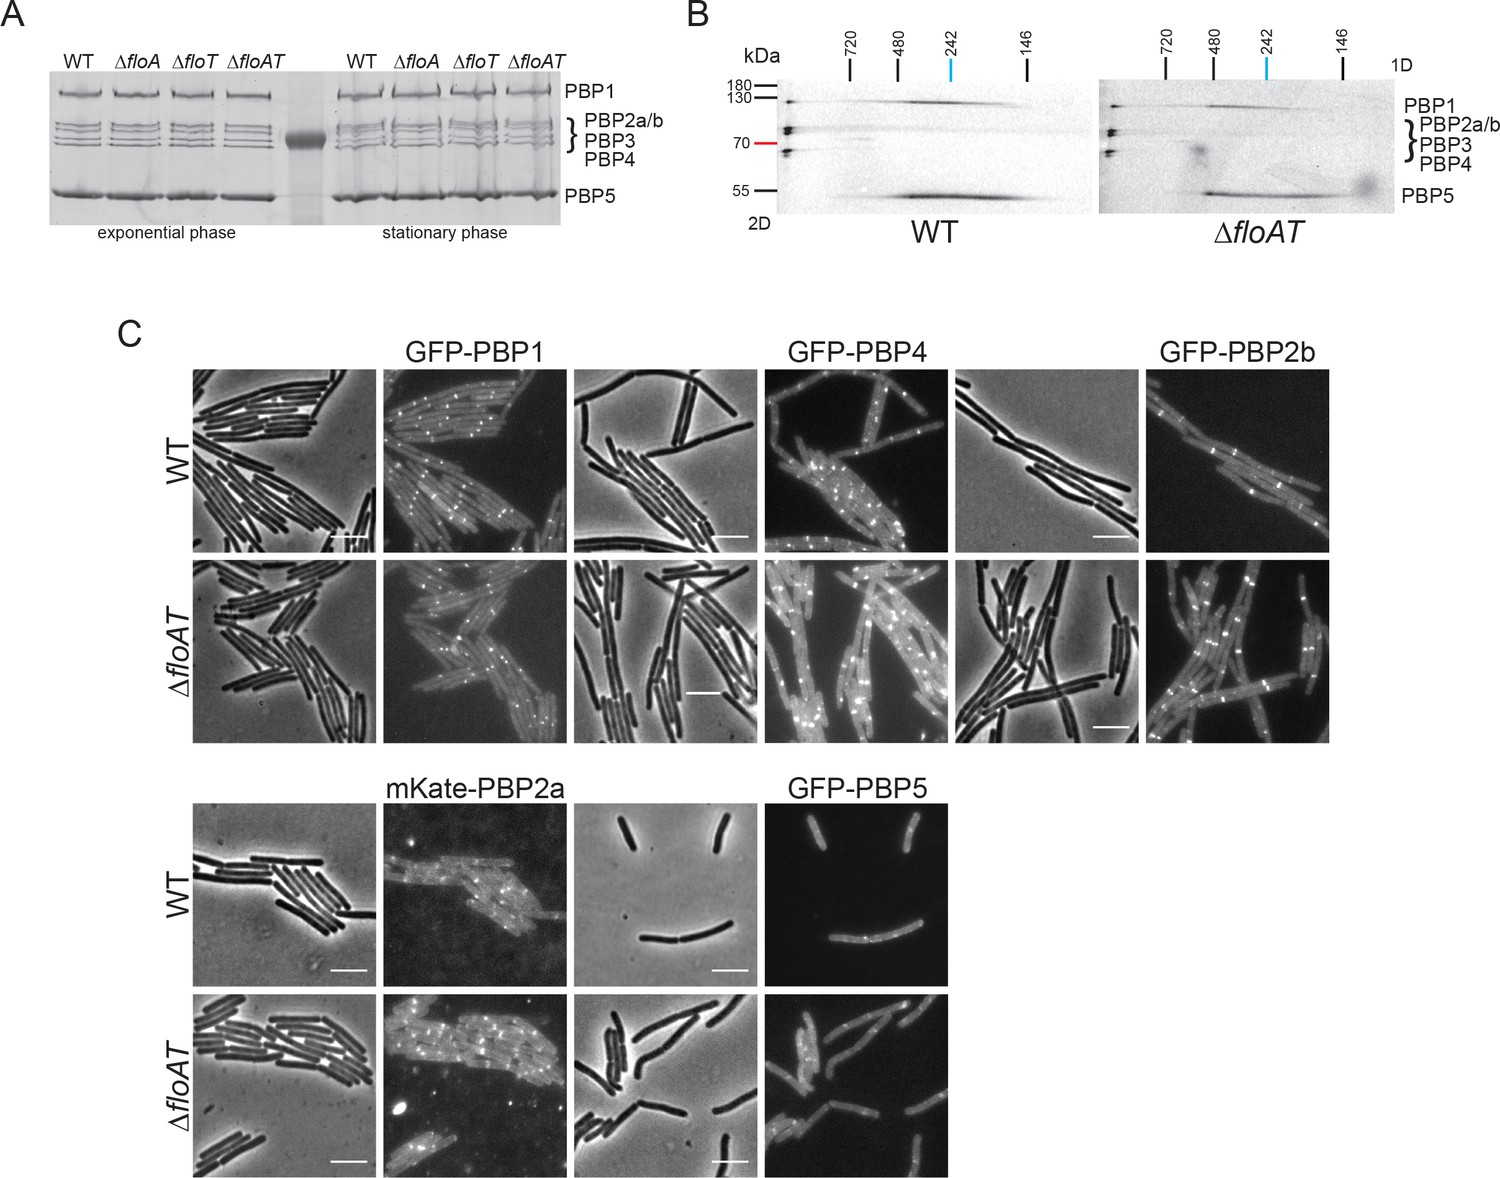
Absence of flotillins does not affect expression, oligomerisation or localisation of PBPs.
(A) Expression pattern of PBPs in wild type and flotillin deficient strains visualised with Bocillin-FL. Membrane fractions isolated from cells (wt, ΔfloA, ΔfloT and ΔfloAT) in exponential and stationary phase of growth were labelled with Bocillin-FL and run on an SDS-PAGE. The fluorescent signal was detected using Typhoon Trio scanner. (B) Two-dimensional (2D) BN/SDS-PAGE of PBP membrane oligomers labelled with Bocillin-FL. Membrane fractions of wt and ΔfloAT strains were isolated, labelled with Bocillin-FL and loaded onto Blue-Native PAGE. The respective lanes were excised, horizontally immobilised on top of the SDS-PAGE gel and resolved. The fluorescent signal was detected using a Typhoon Trio scanner. PBPs 1, 2, 3 and 4 are present in a complex that is not resolved in the native gel, which is resolved at the left of the second dimension gel. PBP5 cannot be found in this complex but runs across a continuum of mass in the second dimension gel. A similar continuum is found for a second fraction of PBP1. This continuum either comes from a second complex that is disintegrating in the first dimension or from various complexes with different but close masses. Although our analysis clearly indicates that several PBPs are part of high Mw complexes, no differences in the patterns of the PBP complexes were found in membranes of the ΔfloAT strain. (C) Localisation patterns of GFP-PBP fluorescent fusions in flotillin deletion strains. Exponentially growing wild-type (wt) and flotillin deletion (ΔfloAT) strains expressing the indicated GFP-PBP fusions were imaged by phase contrast and fluorescence microscopy. The PBPs chosen were the two main aPBPs 1 and 4, the division associated bPBP 2b, the elongation associated bPBP 2a, and the main D,D-carboxypeptidase PBP5. No obvious differences in the localisation patterns for the PBPs were detected in the absence of flotillins. Scale bar 5 μm.
Figure 2 with 4 supplements
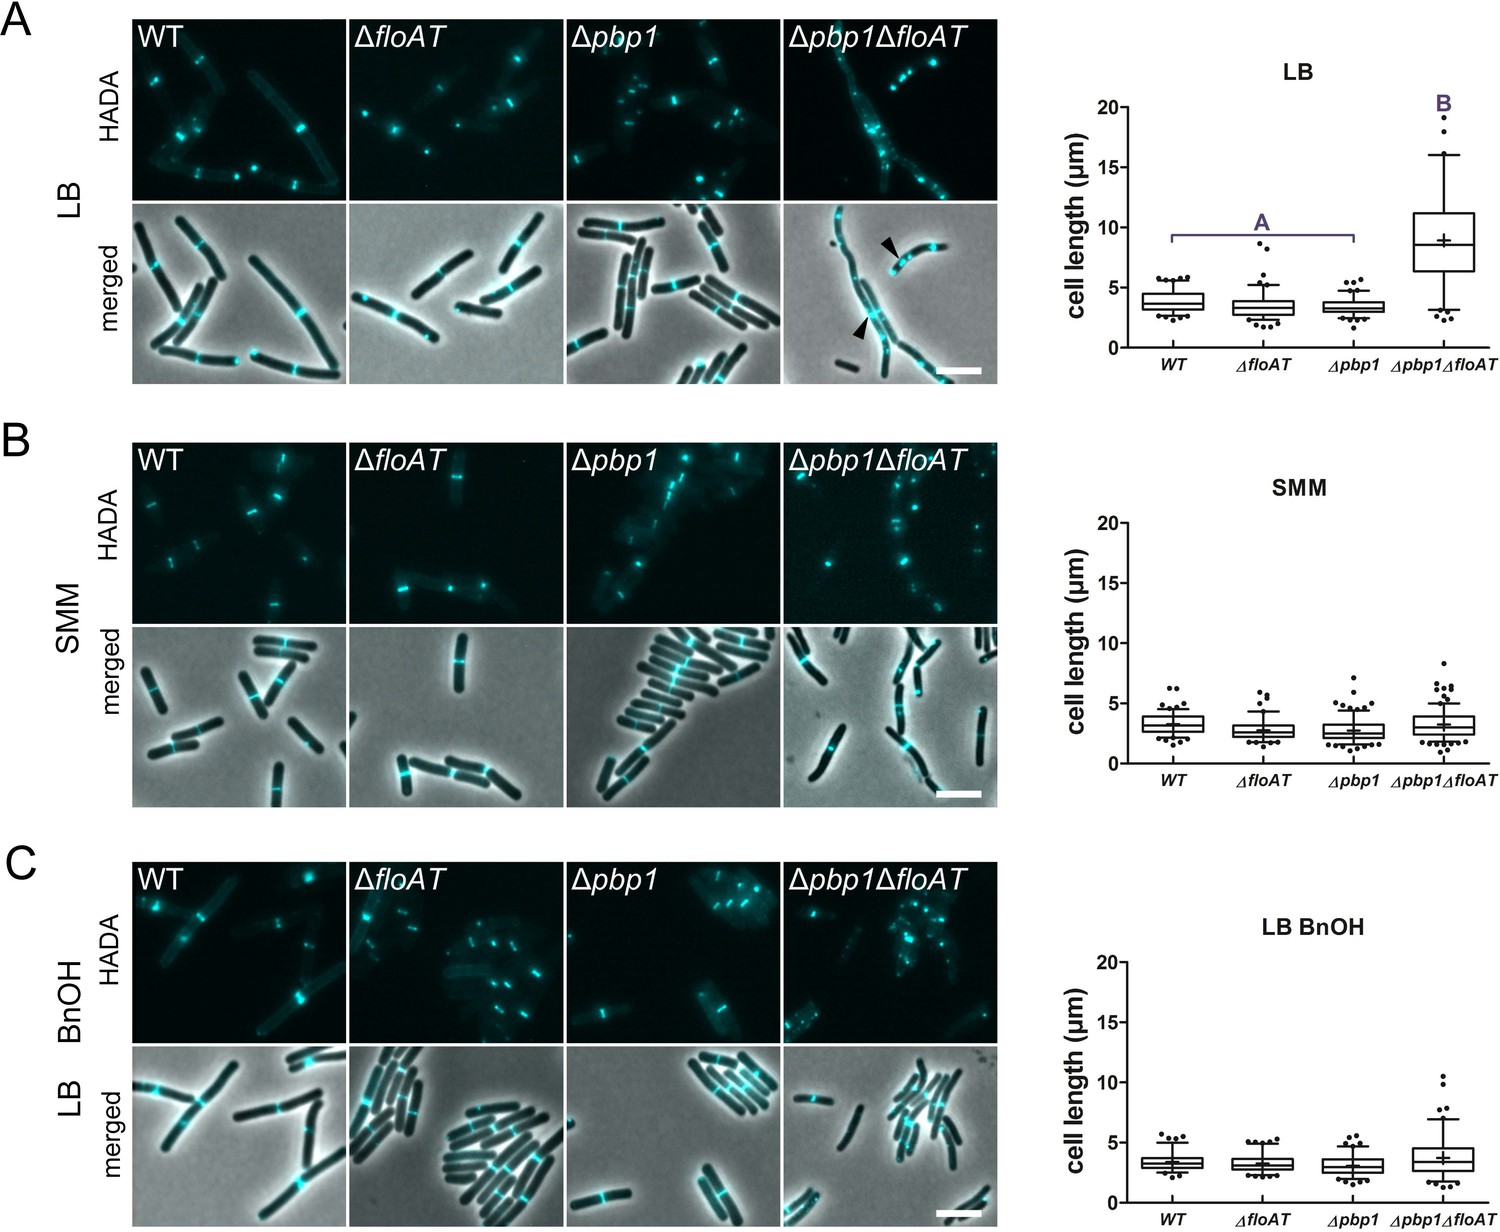
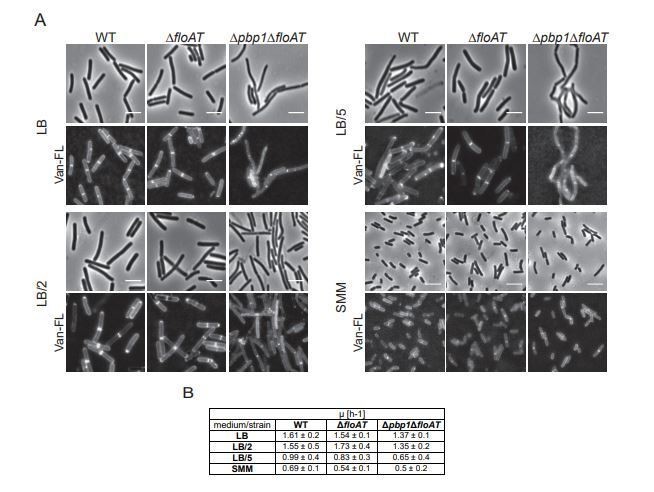
Cell morphology and cell wall synthesis localisation is dependent on growth conditions.
Morphology of the WT, ΔfloAT, Δpbp1, and ∆pbp1ΔfloAT strains grown in (A) rich (LB), (B) minimal (SMM) medium, and in (C) rich medium with membrane fluidising conditions (0.1% benzyl alcohol, LB+BnOH). Cells were labelled with HADA, and aberrant cell shape and peptidoglycan synthesis are indicated with arrowheads. Panels on the right indicate corresponding cell length distributions (n ≥ 100). Distributions were analysed using Dunn’s multiple comparison tests after Kruskal–Wallis. Statistically significant cell length distribution classes (p<0.001) are represented as letters above each graph – in B and C there were no significant differences. Scale bar: 4 µm.
-
Figure 2—source data 1
Cell length measurements.
- https://cdn.elifesciences.org/articles/57179/elife-57179-fig2-data1-v1.xlsx
Figure 2—figure supplement 1
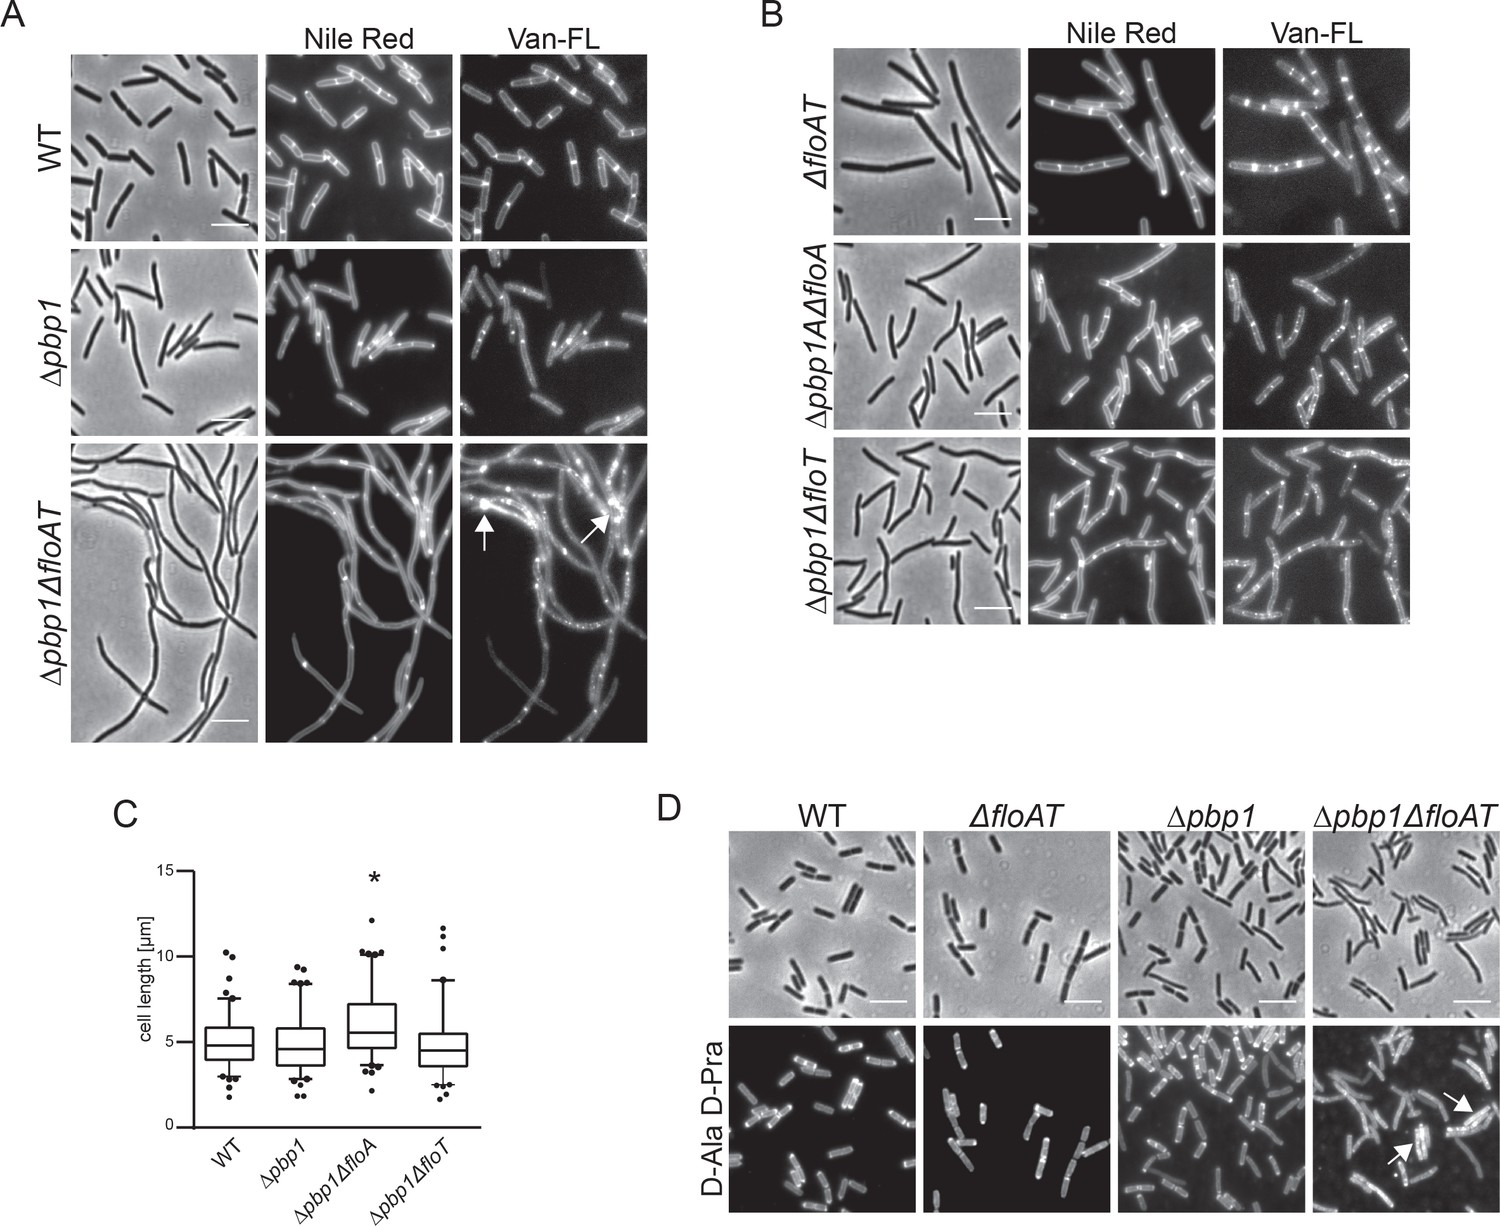
Deletion of both flotillins and PBP1 induces filamentation and delocalisation of peptidoglycan synthesis.
(A) Exponentially growing wt, Δpbp1 and Δpbp1ΔfloAT strains were labelled with Nile Red and Vancomycin-FL (Van-FL). Arrows indicate accumulation of the dye. (B) Exponentially growing ΔfloAT, Δpbp1ΔfloA and Δpbp1ΔfloT strains were labelled with membrane stain Nile Red and cell wall dye Vancomycin-FL (Van-FL). (C) Distribution of lengths of cells with a combination of deletions of pbp1 with either floA or floT, imaged in A, B. Statistical analysis and generation of box plots was performed with Prism. Significant differences are based on the two-tailed Mann-Whitney test (n = 100, *p<0.05). (D) Exponentially growing wt, ΔfloAT, Δpbp1 and Δpbp1ΔfloAT strains were labelled with fluorescent azide bound to D-Ala-D-Pra dipeptide. Arrows indicate accumulation of the dye. There are less filaments observed in this procedure as some filaments break during the fixation procedure that precedes the click reaction. Scale bar (same for all) 5 μm.
-
Figure 2—figure supplement 1—source data 1
Cell length measurements plotted in F2F1C.
- https://cdn.elifesciences.org/articles/57179/elife-57179-fig2-figsupp1-data1-v1.xlsx
Figure 2—figure supplement 2
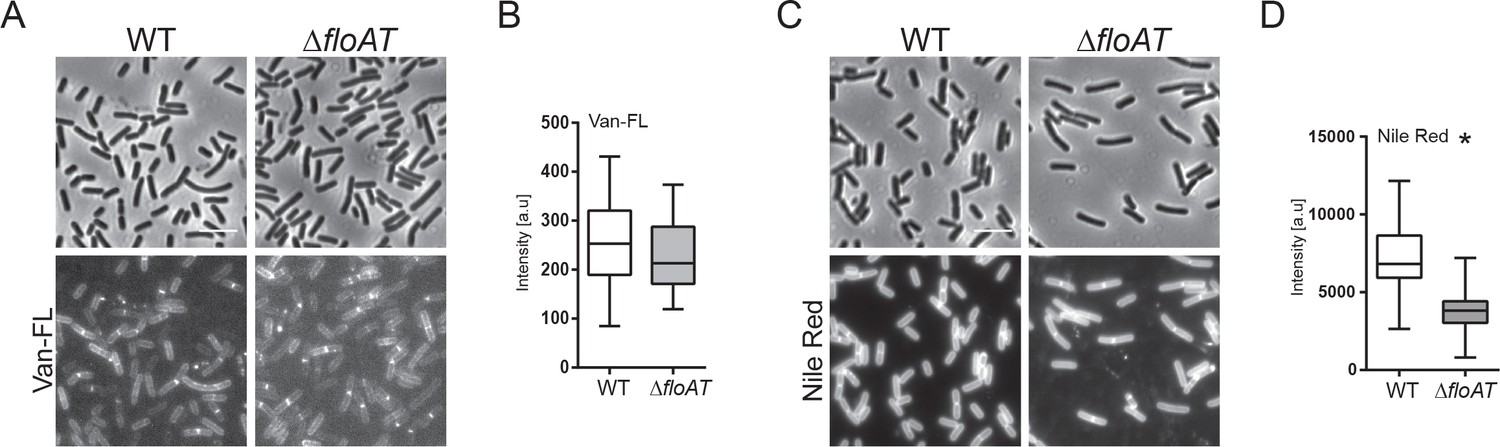
Septum labelling of wild type and flotillin mutant cells grown on minimal medium.
(A, C) Morphology of the exponentially growing wt and ΔfloAT strains in the minimal medium labelled with fluorescent Vancomycin (Van-FL, (A) and Nile Red (C). Scale bar 5 μm. (B, D) Peak intensity of Van-FL (B), and Nile Red (D) labelled division sites of the cells shown in (A and C). Cells from each strain (n = 50) were analysed using the ObjectJ macro tool PeakFinder followed by statistical analysis with Prism, where the significant difference is based on an unpaired Welch t-test (*p<0.05).
-
Figure 2—figure supplement 2—source data 1
Fluorescence intensity measurements plotted in F2FS2.
- https://cdn.elifesciences.org/articles/57179/elife-57179-fig2-figsupp2-data1-v1.xlsx
Figure 2—figure supplement 3
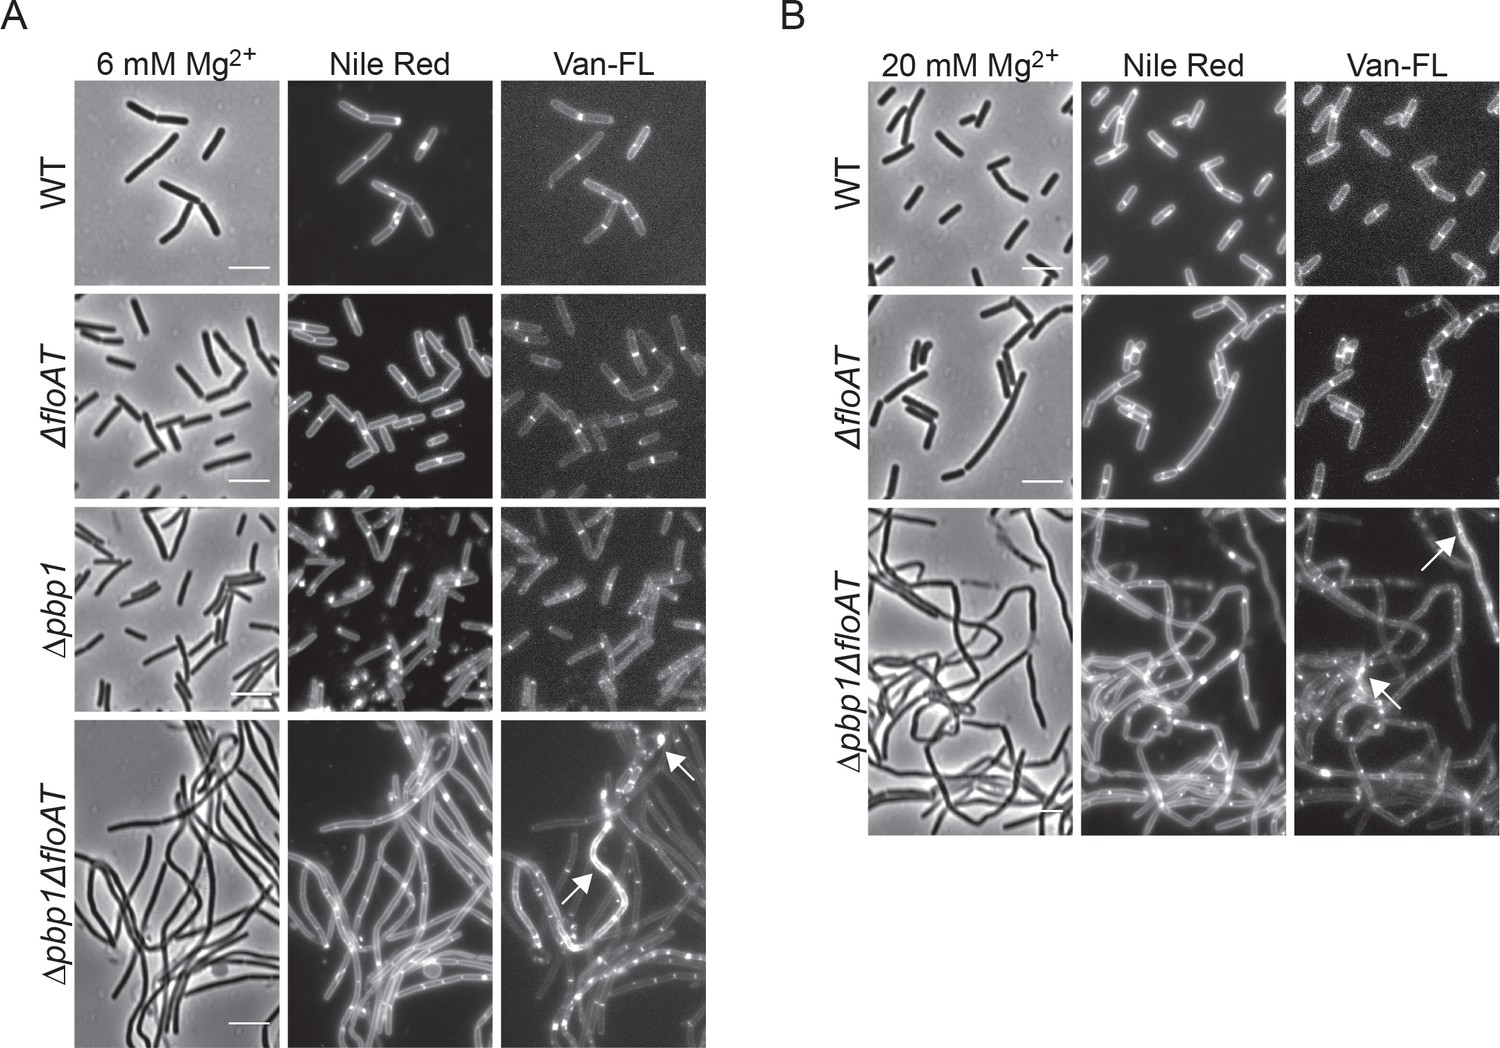
Filamentation and delocalisation of peptidoglycan synthesis in the absence of flotillins and PBP1 is not rescued by the addition of magnesium.
Cell morphology of wt, ΔfloAT, ∆pbp1, and ∆pbp1ΔfloAT strains grown in LB supplemented with (A) 6 mM magnesium (Mg2+) or (B) 20 mM magnesium, labelled with Nile Red and Vancomycin-FL (Van-FL). Exponentially growing cells were labelled, and imaged directly with phase contrast and fluorescence microscopy. Arrowheads indicate accumulation of the dye. Scale bar 5 μm.
Figure 2—figure supplement 4
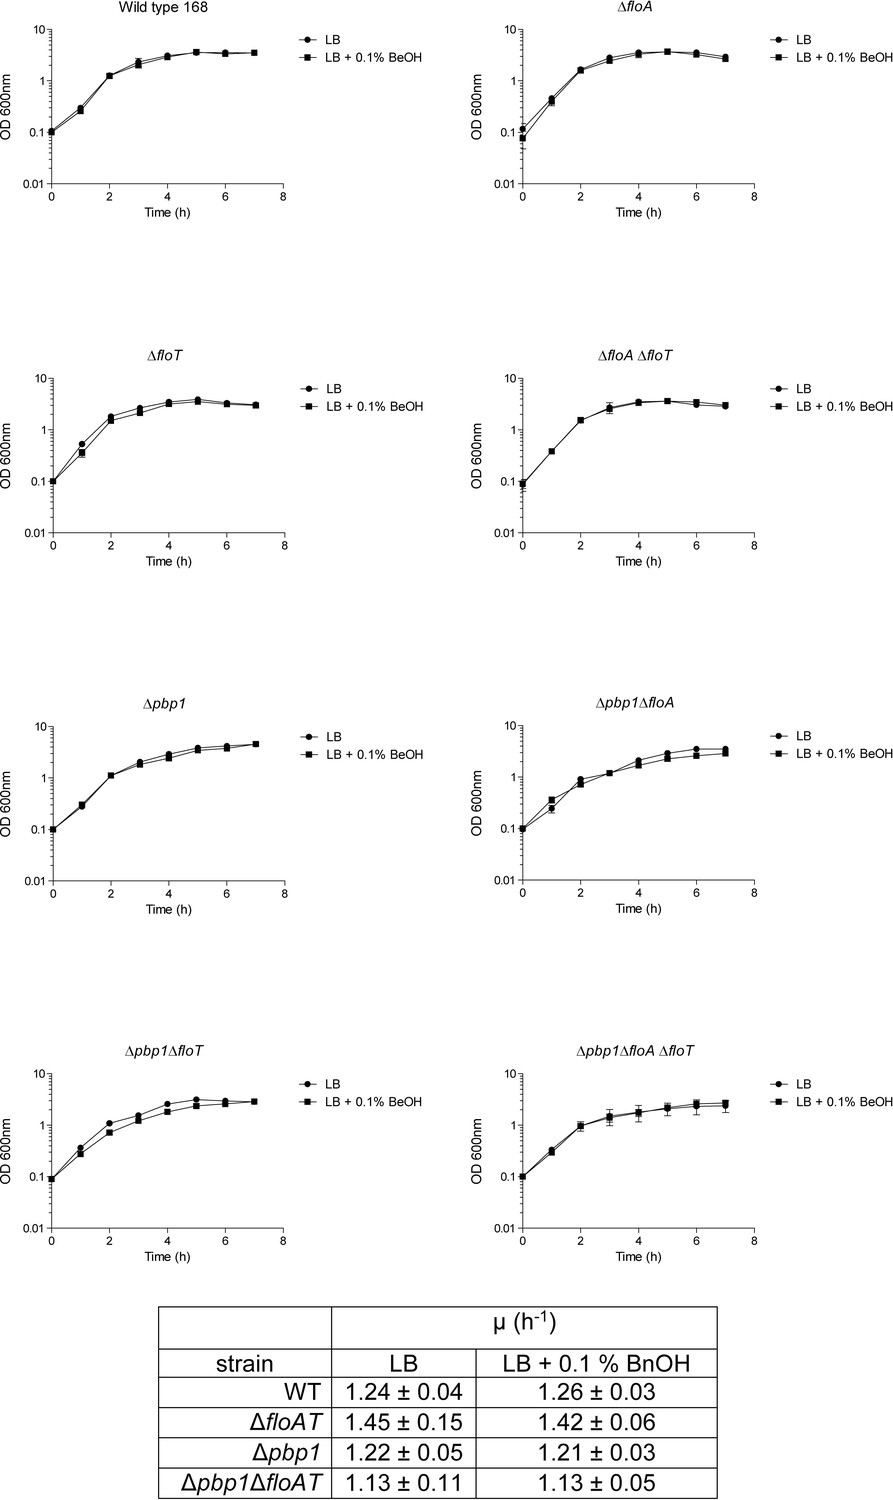
Growth curves and growth rates show similar growth for wt, ΔfloAT, ∆pbp1, and ∆pbp1ΔfloAT (as well as ΔfloA, ΔfloT, ∆pbp1ΔfloA and ∆pbp1ΔfloT) strains grown on LB or on LB supplemented with BnOH (0.1% (w/v)).
Each datapoint represents the average from biological triplicates and error bars indicate standard deviation.
-
Figure 2—figure supplement 4—source data 1
Growth curve data.
- https://cdn.elifesciences.org/articles/57179/elife-57179-fig2-figsupp4-data1-v1.xlsx
Figure 3 with 1 supplement
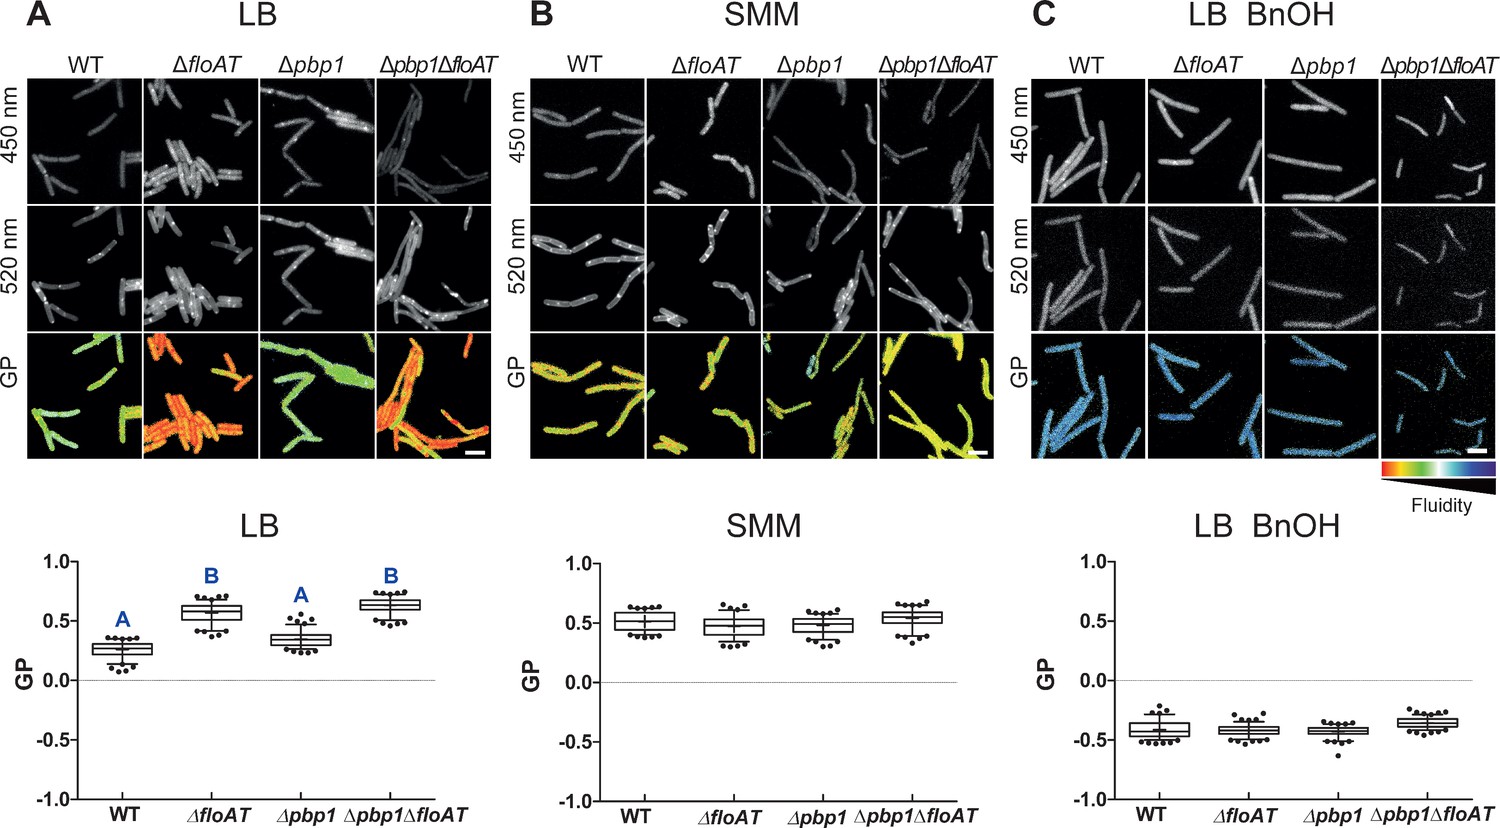
Flotillins increase overall membrane fluidity at high growth rate.
Changes in overall membrane fluidity were assessed by Laurdan microscopy in cells grown on LB (A), SMM (B) and LB+BnOH (C). Micrographs show colour-coded generalised polarisation (GP) maps in which red indicates regions of decreased fluidity (scale bar: 4 µm). Correspondent theoretical GP measurements in the graphs vary from −1 (more fluid) to 1 (less fluid). Significant statistical differences according to Dunn’s multiple comparison tests after Kruskal–Wallis are represented as letters above each graph in panel (A). Data labelled ‘A’ are significantly different from data labelled ‘B’; data with the same letter are not significantly different. No statistically significant difference was observed for the data in panels (B) and (C) (p<0.001; n ≥ 150, two biological replicates).
-
Figure 3—source data 1
GP measurement.
- https://cdn.elifesciences.org/articles/57179/elife-57179-fig3-data1-v1.xlsx
Figure 3—figure supplement 1
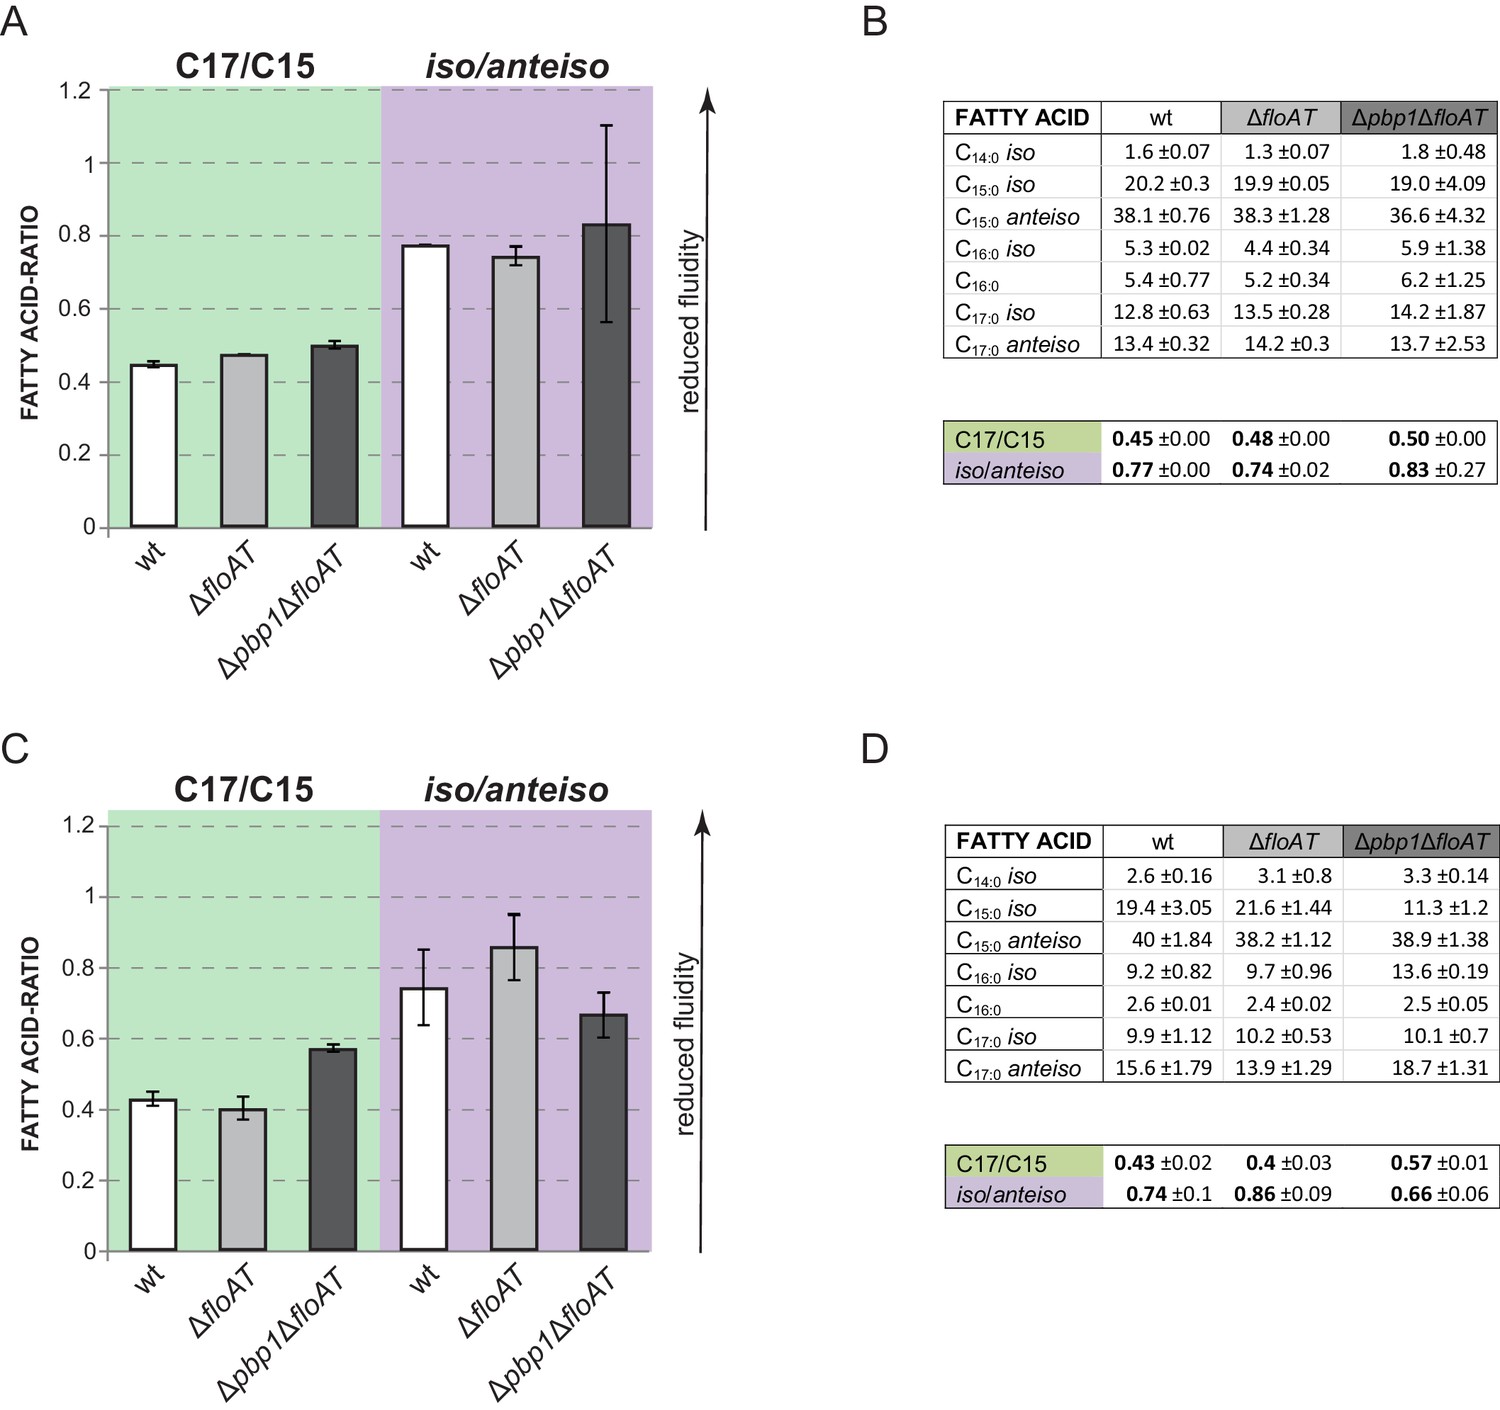
Fatty acid composition analysis.
(A, C) Ratios between chain lengths of the major fatty acids (C17 and C15) and ratios between the iso and anteiso forms of fatty acids of the exponentially growing wt, ∆floAT and ∆pbp1∆floAT strains cultivated in LB (A) or minimal medium (C). (B), (D) - Corresponding total fatty acid profiles and determination of the ratios in the graphs A and C, respectively. Lipid species contributing more that 1% to overall membrane composition are shown. The charts represent the average value of two independent analyses. Fatty acid ratios remain stable upon deletion of flotillins. Triple deletion of both flotillins and PBP1 causes some variability of the total lipid fractions.
-
Figure 3—figure supplement 1—source data 1
Fatty acid composition data.
- https://cdn.elifesciences.org/articles/57179/elife-57179-fig3-figsupp1-data1-v1.xlsx
Figure 4 with 6 supplements
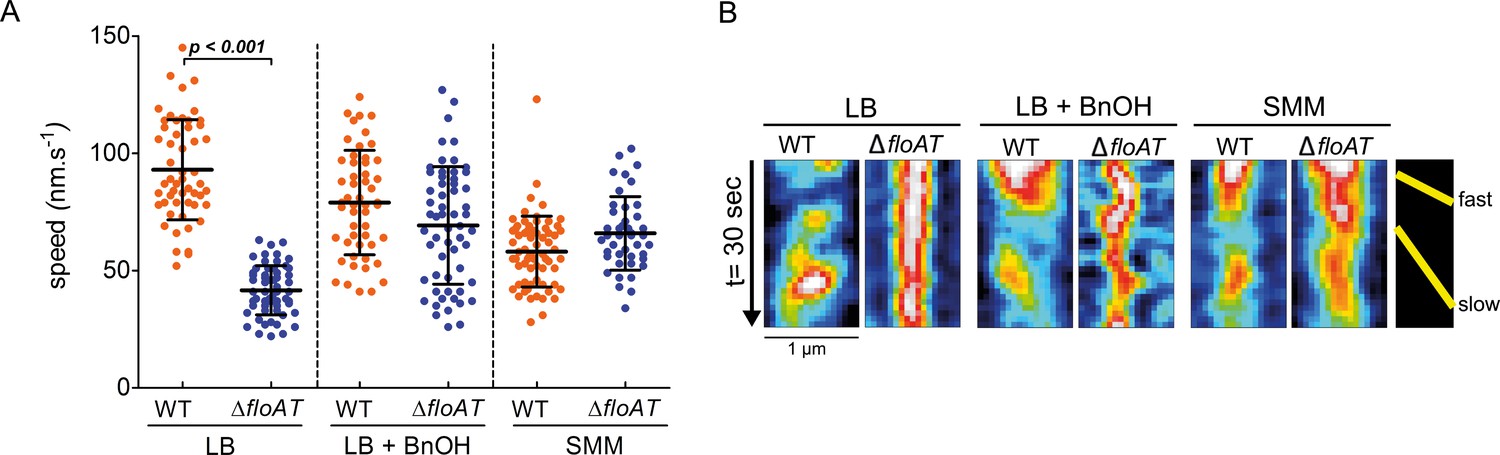
MreB speed is linked to membrane fluidity.
(A) The MreB speed in different strain backgrounds and growth conditions was analysed by time-lapse TIRF microscopy. Scatter plot of the speed of patches obtained from individual tracks in 5 different cells are represented per fusion and condition. Average speeds are shown; error bars indicate the standard deviation. Significant statistical differences according to Dunn’s multiple comparison tests after Kruskal–Wallis are represented (p<0.001). (B) Representative kymographs showing fast and slow moving patches of mRFPruby-MreB in B. subtilis cells lacking endogenous mreB (WT) or mreB and floAT (ΔfloAT). See Figure 4—videos 1–6 for corresponding raw image series.
-
Figure 4—source data 1
MreB patch mobility measurements determined by TIRFM.
- https://cdn.elifesciences.org/articles/57179/elife-57179-fig4-data1-v1.xlsx
Figure 4—video 1
Visualisation of xylose inducible mrfpRuby-MreB patches dynamics (strain 4070) during exponential growth in LB medium at 37°C by TIRF microscopy.
Exposure time was 2 s and frame rate 1 image/sec over 30 s. MreB patches rotate perpendicularly to the longitudinal cell axis with an average speed of 92.98 nm/s (+/- 21.37). This movie refers to MreB speed presented in Figure 4. Speed of the movie: 15 fps.
Figure 4—video 2
Visualisation of xylose inducible mrfpRuby-MreB patches dynamics (strain 4070) during exponential growth in SMM medium at 37°C by TIRF microscopy.
Exposure time was 2 s and frame rate 1 image/sec over 30 s. MreB patches rotate perpendicularly to the longitudinal cell axis with an average speed of 58.09 nm/s (+/- 15.08). This movie refers to MreB speed presented in Figure 4. Speed of the movie: 10 fps.
Figure 4—video 3
Visualisation of xylose inducible mrfpRuby-MreB in ΔfloAT patches dynamics (strain 4076) during exponential growth in LB medium at 37°C by TIRF microscopy.
Exposure time was 2 s and frame rate 1 image/sec over 30 s. MreB patches rotate perpendicularly to the longitudinal cell axis with an average speed of 41.59 nm/s (+/- 10.48). This movie refers to MreB speed presented in Figure 4. Speed of the movie: 15 fps.
Figure 4—video 4
Visualisation of xylose inducible mrfpRuby-MreB in ΔfloAT patches dynamics (strain 4076) during exponential growth in SMM medium at 37°C by TIRF microscopy.
Exposure time was 2 s and frame rate 1 image/sec over 30 s. MreB patches rotate perpendicularly to the longitudinal cell axis with an average speed of 65.88 nm/s (+/- 15.68). This movie refers to MreB speed presented in Figure 4. Speed of the movie: 15 fps.
Figure 4—video 5
Visualisation of xylose inducible mrfpRuby-MreB patches dynamics (strain 4070) during exponential growth in LB medium supplemented with BnOH (0.1%) at 37°C by TIRF microscopy.
Exposure time was 2 s and frame rate 1 image/sec over 30 s. MreB patches rotate perpendicularly to the longitudinal cell axis with an average speed of 79.00 nm/s (+/- 22.25). This movie refers to MreB speed presented in Figure 4. Speed of the movie: 15 fps.
Figure 4—video 6
Visualisation of xylose inducible mrfpRuby-MreB in ΔfloAT patches dynamics (strain 4076) during exponential growth in LB medium supplemented with BnOH (0.1%) at 37°C by TIRF microscopy.
Exposure time was 2 s and frame rate 1 image/sec over 30 s. MreB patches rotate perpendicularly to the longitudinal cell axis with an average speed of 69.22 nm/s (+/- 25.03). This movie refers to MreB speed presented in Figure 4. Speed of the movie: 15 fps.
Figure 5 with 1 supplement
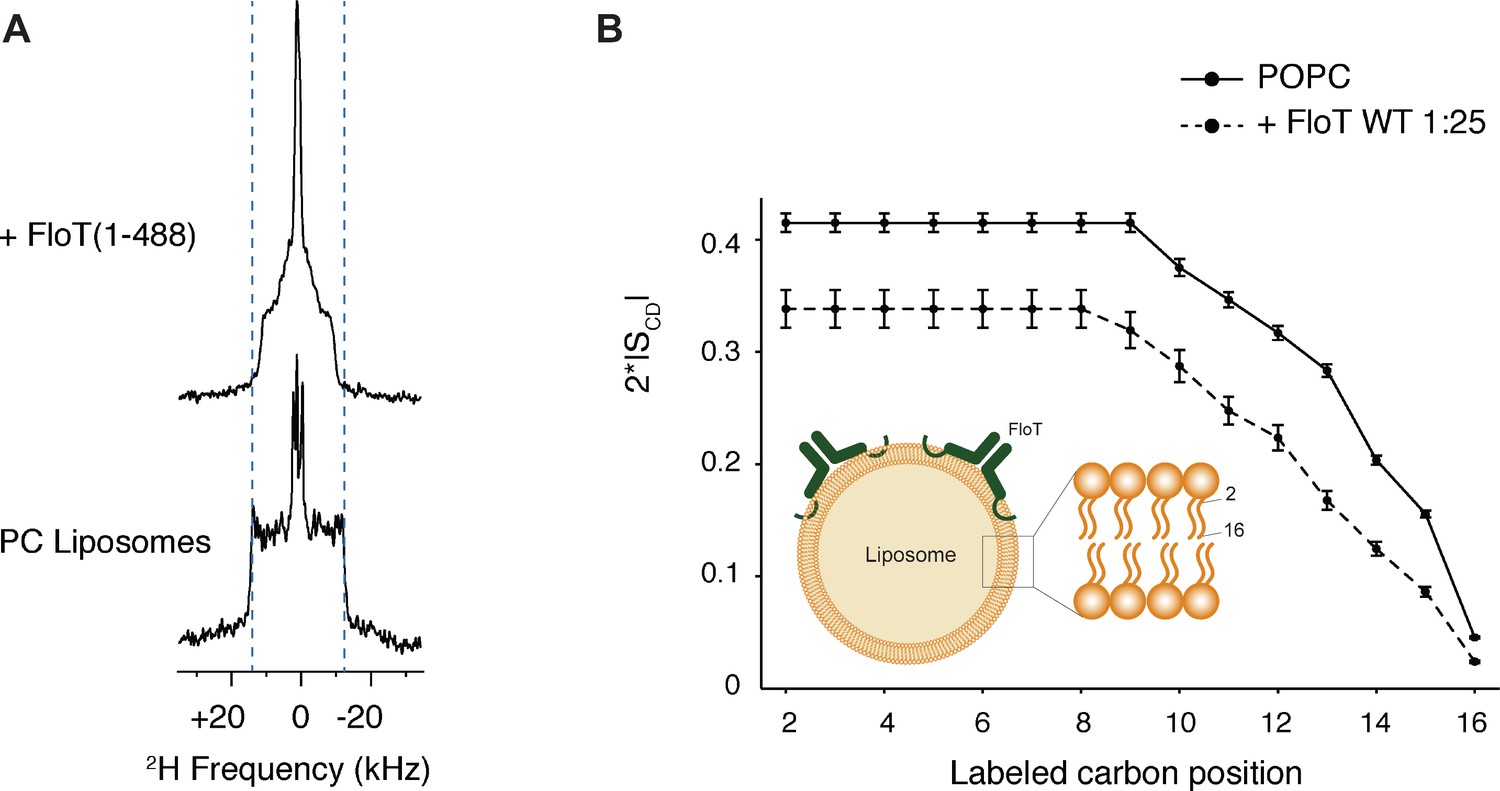
Lipid ordering of FloT probed by 2H solid-state NMR.
(A) Wide-line 2H spectra of POPC-d31 liposomes with or without FloT at a lipid-to-protein molar ratio of 25:1 acquired at 298 K. (B) Effect of FloT on the C-2H order parameters of the PC acyl chain. De-Pake-ing and simulations were applied on the 2H solid-state NMR spectra to determine accurately individual quadrupolar splittings. Order parameters of POPC-d31 acyl chain were derived from experimental quadrupolar splittings and plotted as a function of the labelled carbon position. Insert: schematic depiction of a liposome with added FloT which attaches to the membrane via a hairpin loop (Bach and Bramkamp, 2015).
Figure 5—figure supplement 1
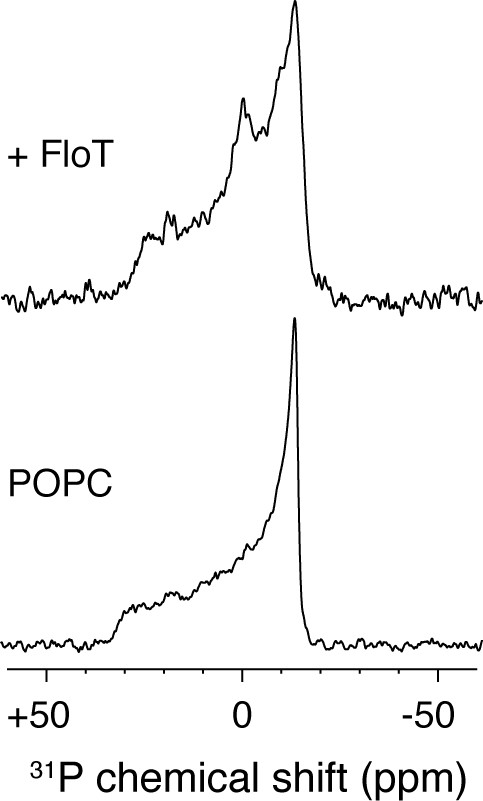
31P solid-state NMR experiments of POPC liposomes with or without FloT at a lipid-to-protein molar ratio of 25:1.
All the spectra were acquired at 298 K and a Lorentzian line broadening of 50 Hz was applied before the Fourier transformation.
Author response image 1
Tables
Key resources table
| Reagent type (species) or resource | Designation | Source or reference | Identifiers | Additional information |
|---|---|---|---|---|
| Strain, strain background (Escherichia coli) | BL21(DE3) | Thermo Fisher Scientific | EC0114 | Chemically competent cells |
| Strain, strain background (Bacillus subtilis) | BB001 | Bach and Bramkamp, 2013 | trpC2 yqfA::tet | |
| Strain, strain background (Bacillus subtilis) | BB003 | Bach and Bramkamp, 2013 | trpC2 yuaG::pMUTIN4 yqfA::tet | |
| Strain, strain background (Bacillus subtilis) | DB003 | Donovan and Bramkamp, 2009 | trpC2 yuaG::pMUTIN4 | |
| Strain, strain background (Bacillus subtilis) | RWBS5 | Domínguez-Escobar et al., 2011 | trpC2 amyE::spc Pxyl-mrfpruby-mreB | |
| Strain, strain background (Bacillus subtilis) | PS832 | Popham and Setlow, 1995 | Prototrophic revertant of 168 | |
| Strain, strain background (Bacillus subtilis) | 2082 | Scheffers et al., 2004 | trpC2 pbpD::cat Pxyl–gfp–pbpD 1–510 | |
| Strain, strain background (Bacillus subtilis) | 2083 | Scheffers et al., 2004 | trpC2 ponA::cat Pxyl–gfp–ponA 1–394 | |
| Strain, strain background (Bacillus subtilis) | 2085 | Scheffers et al., 2004 | trpC2 dacA::cat Pxyl–gfp–dacA 1–423 | |
| Strain, strain background (Bacillus subtilis) | 3105 | Scheffers et al., 2004 | trpC2 pbpC::cat Pxyl-gfp–pbpC 1–768 | |
| Strain, strain background (Bacillus subtilis) | 3122 | Scheffers et al., 2004 | trpC2 pbpB::cat Pxyl-gfp-pbpB 1–825 | |
| Strain, strain background (Bacillus subtilis) | 3511 | Scheffers and Errington, 2004 | trpC2 ponA::spc | |
| Strain, strain background (Bacillus subtilis) | 4042 | Lages et al., 2013 | trpC2 pbpA::cat Pxyl-mkate2-pbpA 1−804 | |
| Strain, strain background (Bacillus subtilis) | 4056 | Morales Angeles et al., 2017 | trpC2 dacA::kan | |
| Strain, strain background (Bacillus subtilis) | 4059 | This work | trpC2 dacA::cat Pxyl-gfp–dacA 1–423yuaG::pMUTIN4 yqfA::tet | Scheffers lab |
| Strain, strain background (Bacillus subtilis) | 4064 | This work | trpC2 dacA::kan yuaG::pMUTIN4 yqfA::tet | Scheffers lab |
| Strain, strain background (Bacillus subtilis) | 4090 | This work | trpC2 ponA::spc yuaG::pMUTIN4 | Scheffers lab |
| Strain, strain background (Bacillus subtilis) | 4091 | This work | PS832 ponA::spc yqfA::tet | Scheffers lab |
| Strain, strain background (Bacillus subtilis) | 4092 | This work | trpC2 ponA::spc yuaG::pMUTIN4 yqfA::tet | Scheffers lab |
| Strain, strain background (Bacillus subtilis) | 4095 | This work | trpC2 ponA::cat Pxyl-gfp–ponA 1–394 yuaG::pMUTIN4 yqfA::tet | Scheffers lab |
| Strain, strain background (Bacillus subtilis) | 4099 | This work | trpC2 pbpB::cat Pxyl-gfp-pbpB 1–825yuaG::pMUTIN4 yqfA::tet | Scheffers lab |
| Strain, strain background (Bacillus subtilis) | 4102 | This work | trpC2 pbpA::cat Pxyl-mkate2-pbpA 1−804 yuaG::pMUTIN4 yqfA::tet | Scheffers lab |
| Strain, strain background (Bacillus subtilis) | 4108 | This work | trpC2 pbpD::cat Pxyl-gfp–pbpD 1–510yuaG::pMUTIN4 yqfA::tet | Scheffers lab |
| Strain, strain background (Bacillus subtilis) | 4122 | This work | trpC2 pbpC::cat Pxyl-gfp–pbpC 1–768yuaG::pMUTIN4 yqfA::tet | Scheffers lab |
| Strain, strain background (Bacillus subtilis) | 4128 | This work | trpC2 ponA::spc pbpD::cat Pxyl-gfp–pbpD 1–510 | Scheffers lab |
| Strain, strain background (Bacillus subtilis) | 4129 | This work | trpC2 ponA::spc yuaG::pMUTIN4 pbpD::cat Pxyl-gfp–pbpD 1–510 | Scheffers lab |
| Strain, strain background (Bacillus subtilis) | 4070 | This work | trpC2 mreB::kan amyE::spc Pxyl-mrfpruby-mreB | Scheffers lab |
| Strain, strain background (Bacillus subtilis) | 4076 | This work | trpC2 mreB::kan amyE::spc Pxyl-mrfpruby-mreB yuaG::pMUTIN4 yqfA::tet | Scheffers lab |
| Strain, strain background (Bacillus subtilis) | 4259 | This work; Veening et al., 2009 | trpC2 amyE::PrrnB-gfp | Scheffers lab |
| Other | Bocillin | Thermo Fisher Scientific | BOCILLIN FL Penicillin, Sodium Salt | 5 µg/ml |
| Other | HADA | Synthesised as described (Morales Angeles et al., 2017) | 7-hydroxycoumarin 3-carboxylic acid-amino-D-alanine | 50 µM |
| Other | Vancomycin-FL | Sigma-Aldrich and Molecular Probes (Zhao et al., 2017) | Van-FL | 1:1 mixture of Vancomycin and BODIPYFL Vancomycin (Zhao et al., 2017), final concentration 1 µg/ml |
| Other | Nile Red | Thermo Fisher Scientific | 5H-Benzo[α]phenoxazin-5-one, 9-(diethylamino)- 7385-67-3 | 0.5 µg/ml |
| Other | 16:0-d31-18:1 PC | Avanti | 860399 | Phospholipids |
| Other | Laurdan | Sigma-Aldrich | 6-Dodecanoyl-N,N-dimethyl-2-naphthylamine | - |
| Other | Benzyl alcohol | Sigma-Aldrich | Benzyl alcohol | - |
| Other | DiI-C12 | Thermo Fisher Scientific | 1,1'-Didodecyl-3,3,3',3'-Tetramethylindocarbocyanine Perchlorate | 2.5 µg/ml |
| Other | FM4-64 | Thermo Fischer Scientific | (N-(3-Triethylammoniumpropyl)−4-(6-(4-(Diethylamino) Phenyl) Hexatrienyl) Pyridinium Dibromide) | 0.5 µg/ml, Invitrogen FM 4–64 Dye |
| Software, algorithm | Prism 5 | 1992–2010 GraphPad Software | RRID:SCR_002798 | - |
| Software, algortithm | ImageJ 1.52p/FIJI | Wayne Rasband – National Institutes of Health, USA | RRID:SCR_002285 | Free software |
| Software, algorithm | SPSS | SPSS | RRID:SCR_002865 | software |
| Software, algorithm | NMR Depaker 1.0rc1 software | [Copyright (C) 2009 Sébastien Buchoux] | software | |
| Software, algorithm | Bruker Topspin 3.2 software | Bruker | RRID:SCR_014227 | software |
Additional files
Download links
A two-part list of links to download the article, or parts of the article, in various formats.
Downloads (link to download the article as PDF)
Open citations (links to open the citations from this article in various online reference manager services)
Cite this article (links to download the citations from this article in formats compatible with various reference manager tools)
Flotillin-mediated membrane fluidity controls peptidoglycan synthesis and MreB movement
eLife 9:e57179.
https://doi.org/10.7554/eLife.57179


