Predicting the effect of statins on cancer risk using genetic variants from a Mendelian randomization study in the UK Biobank
- Department of Public Health and Primary Care, University of Cambridge, United Kingdom
- MRC Cancer Unit, University of Cambridge, United Kingdom
- MRC Integrative Epidemiology Unit, University of Bristol, United Kingdom
- Population Health Sciences, Bristol Medical School, University of Bristol, United Kingdom
- ACALM Study Unit, Aston Medical School, United Kingdom
- Unit of Cardiovascular and Nutritional Epidemiology, Institute of Environmental Medicine, Karolinska Institutet, Sweden
- Department of Surgical Sciences, Uppsala University, Sweden
- MRC Biostatistics Unit, University of Cambridge, United Kingdom
Figures
Figure 1
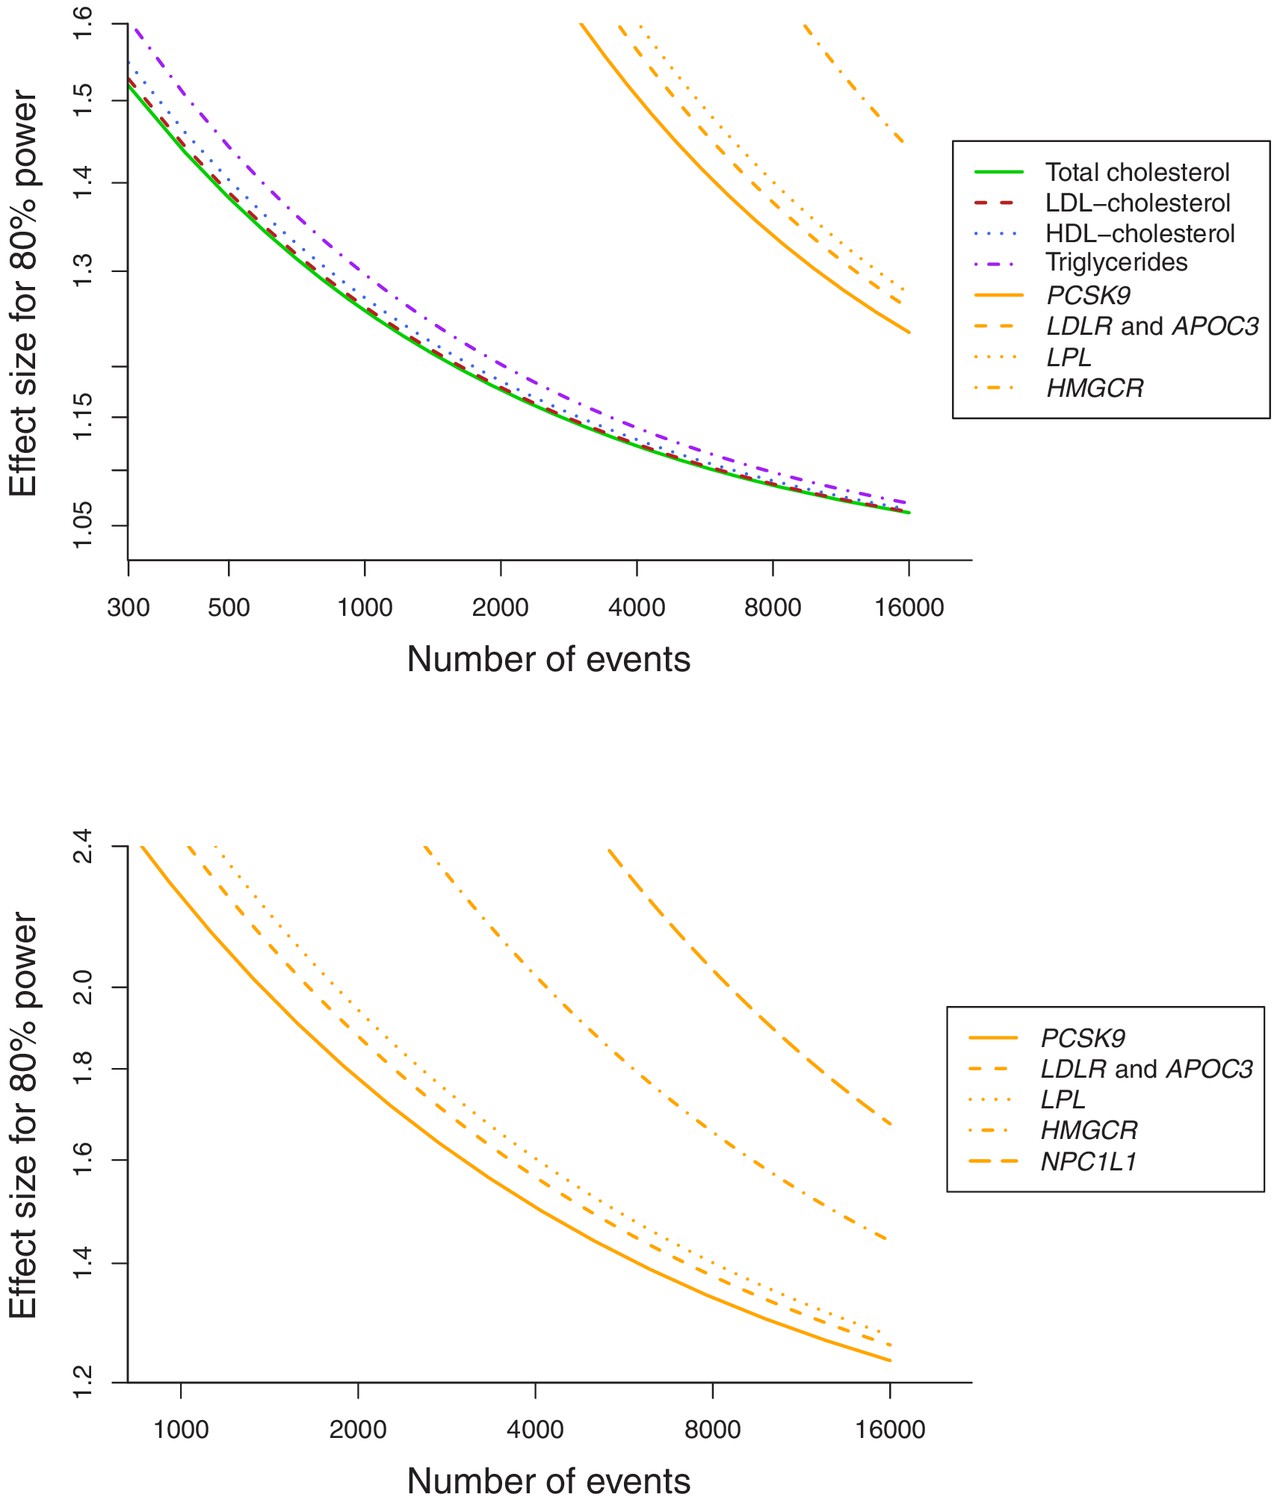
Power calculations for polygenic and gene-specific analyses, displaying the Mendelian randomization estimate that can be detected with 80% power assuming a sample size of 367,703 individuals for site-specific cancers.
Figure 2 with 8 supplements
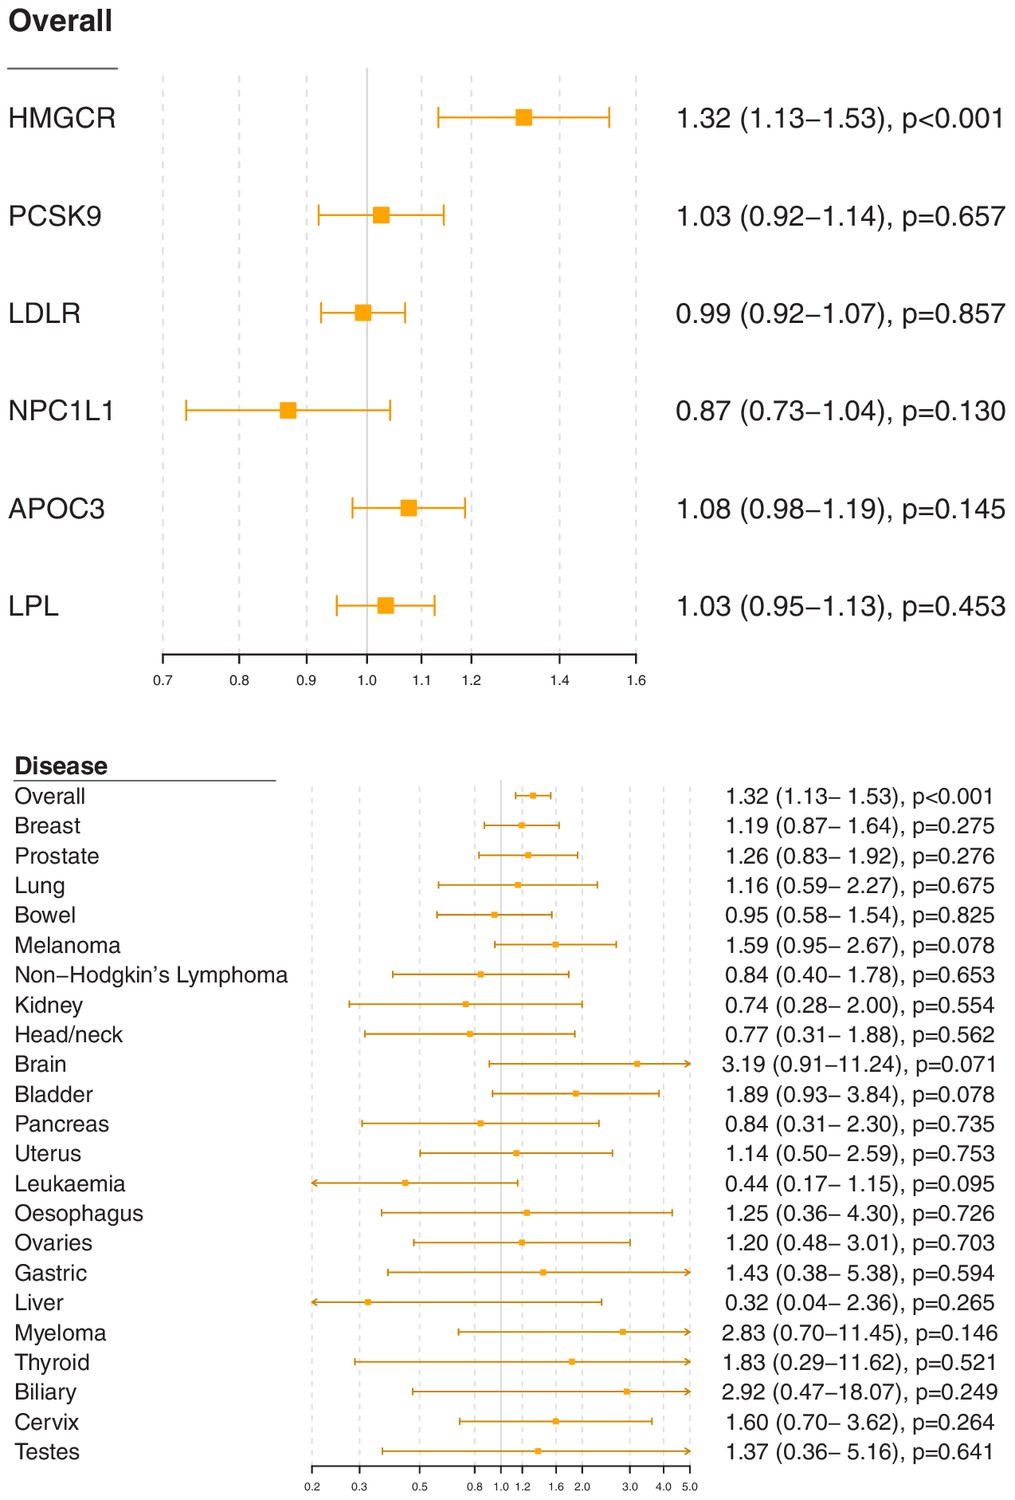
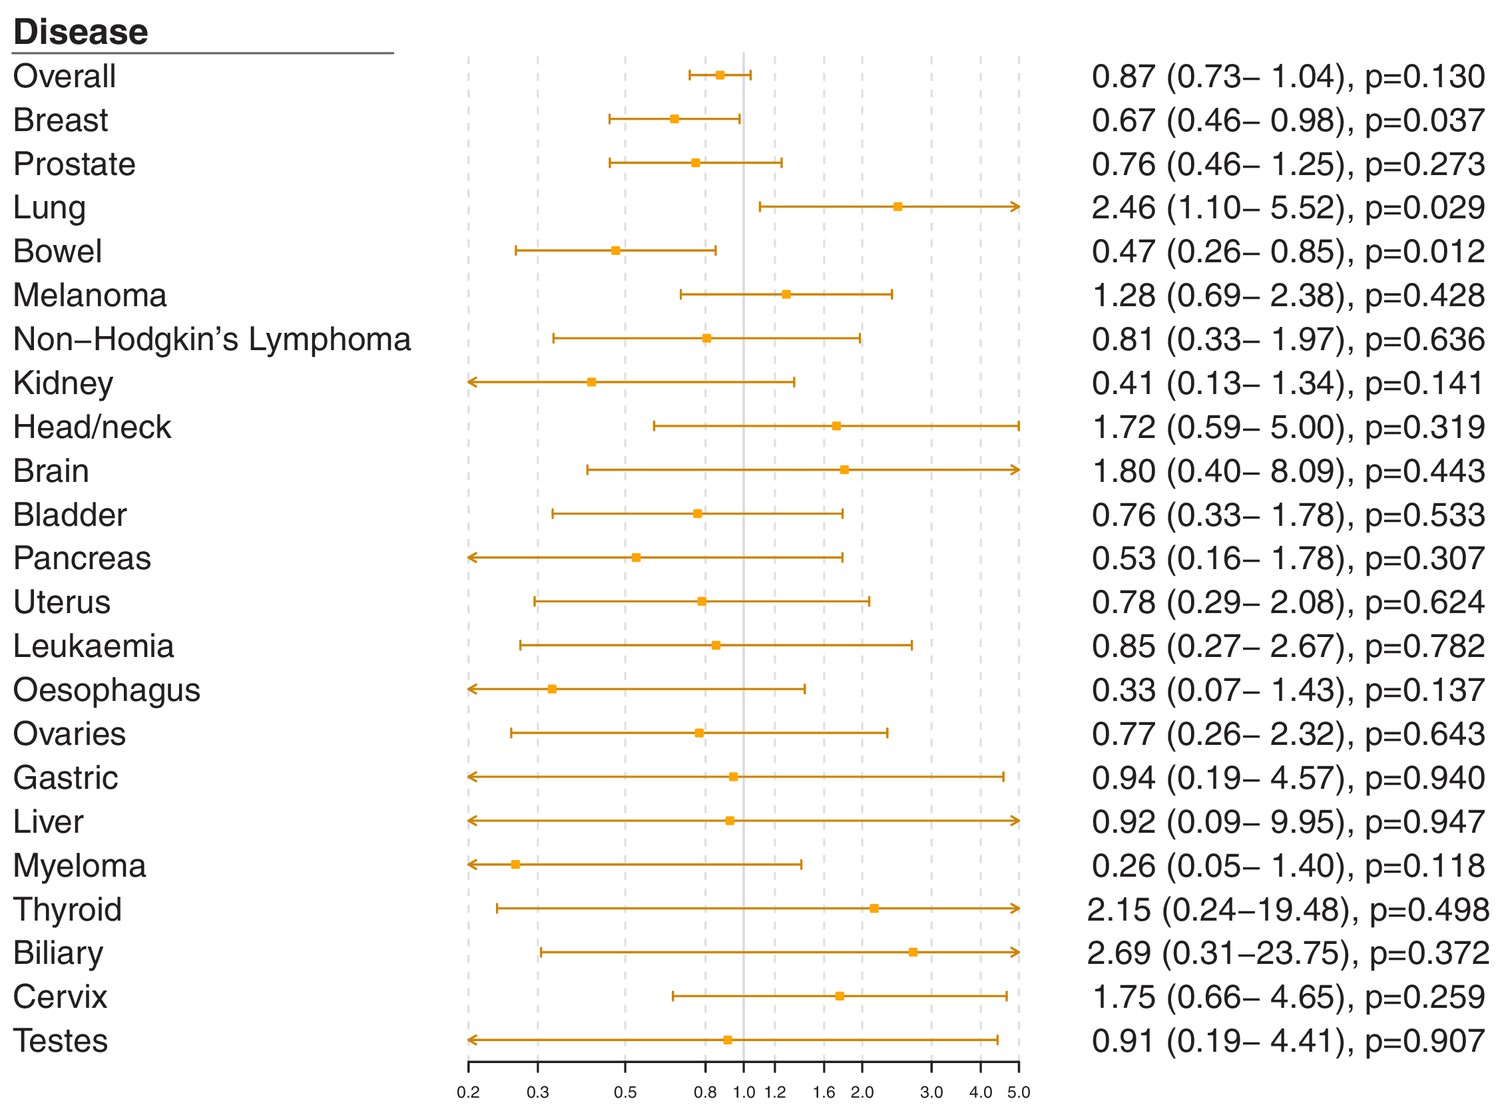
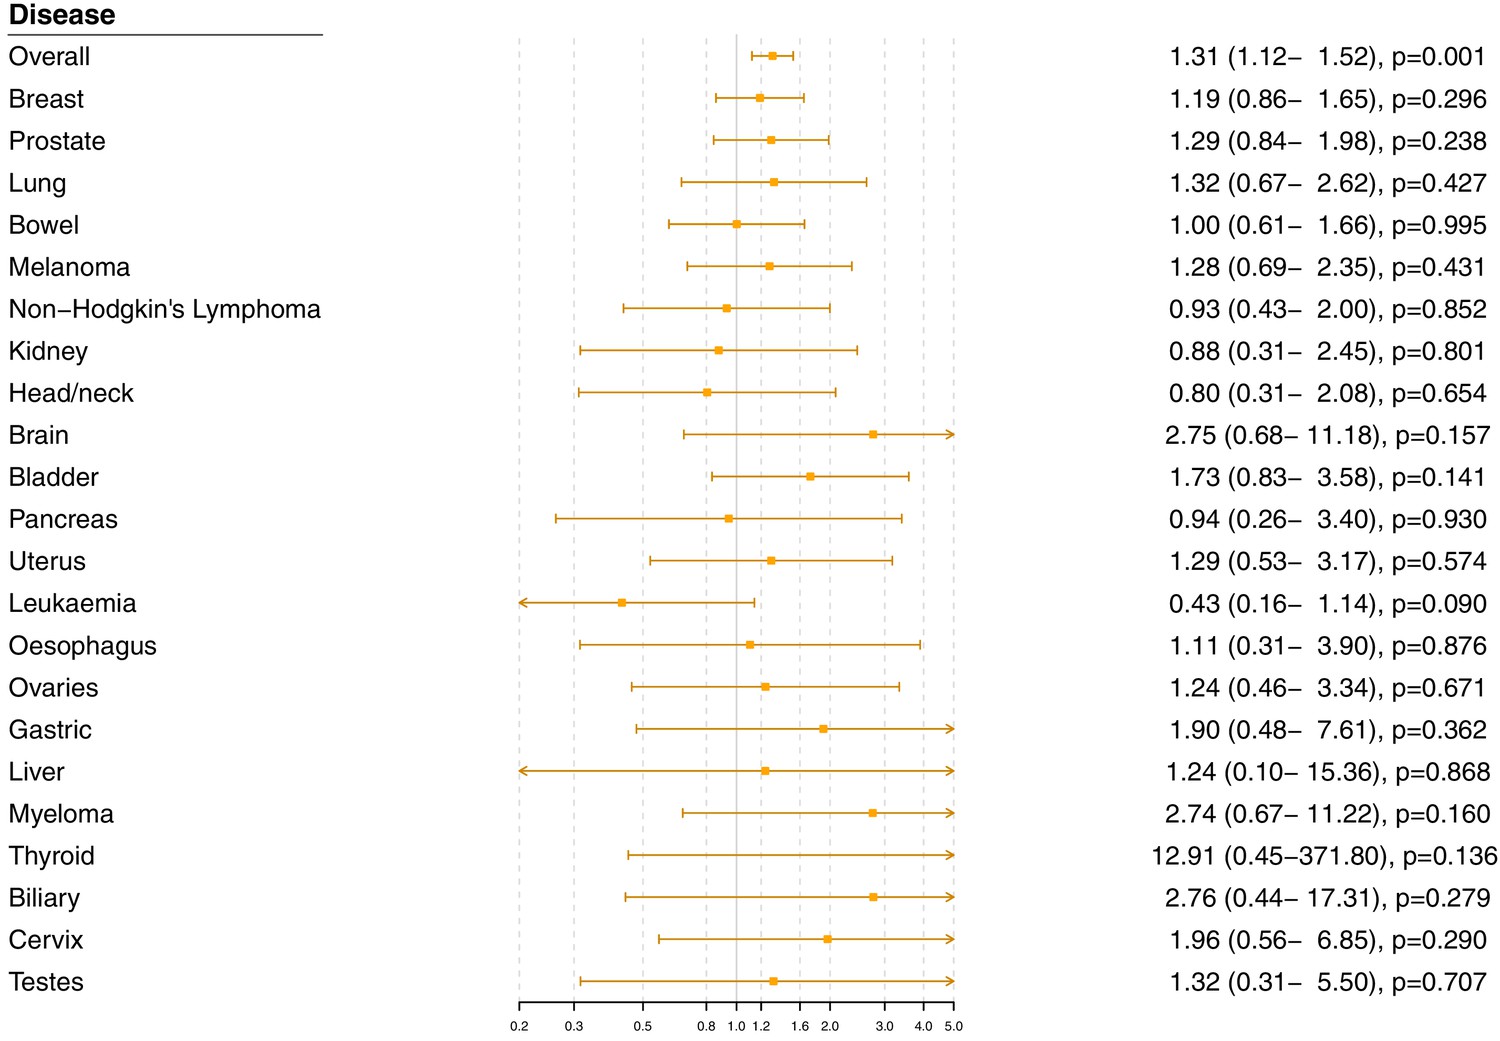
Gene-specific Mendelian randomization estimates (odds ratio with 95% confidence interval per one standard deviation increase in lipid fraction) for variants in gene regions representing targets of lipid-lowering treatments.
Estimates are scaled to a one standard deviation increase in LDL-cholesterol for the HMGCR, PCSK9, LDLR, and NPC1L1 regions, and a one standard deviation increase in triglycerides for the APOC3 and LPL regions. A: associations with overall cancer for each gene region in turn. B: associations with site-specific cancers for variants in the HMGCR gene region.
Figure 2—figure supplement 1
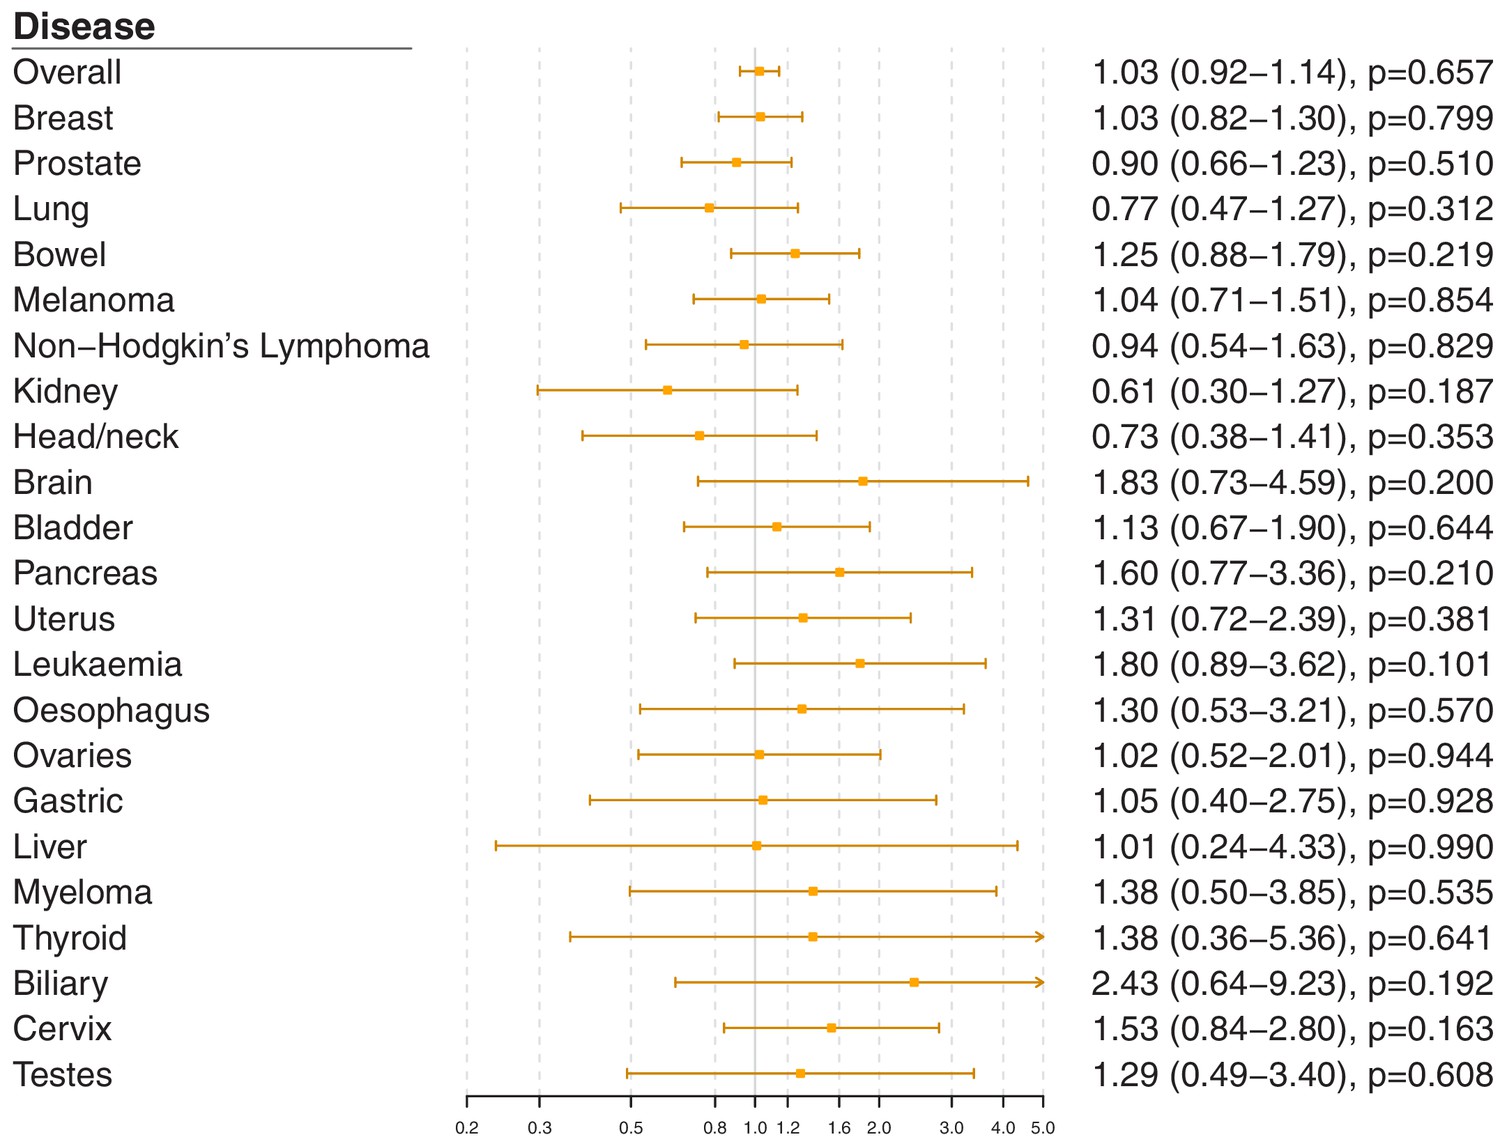
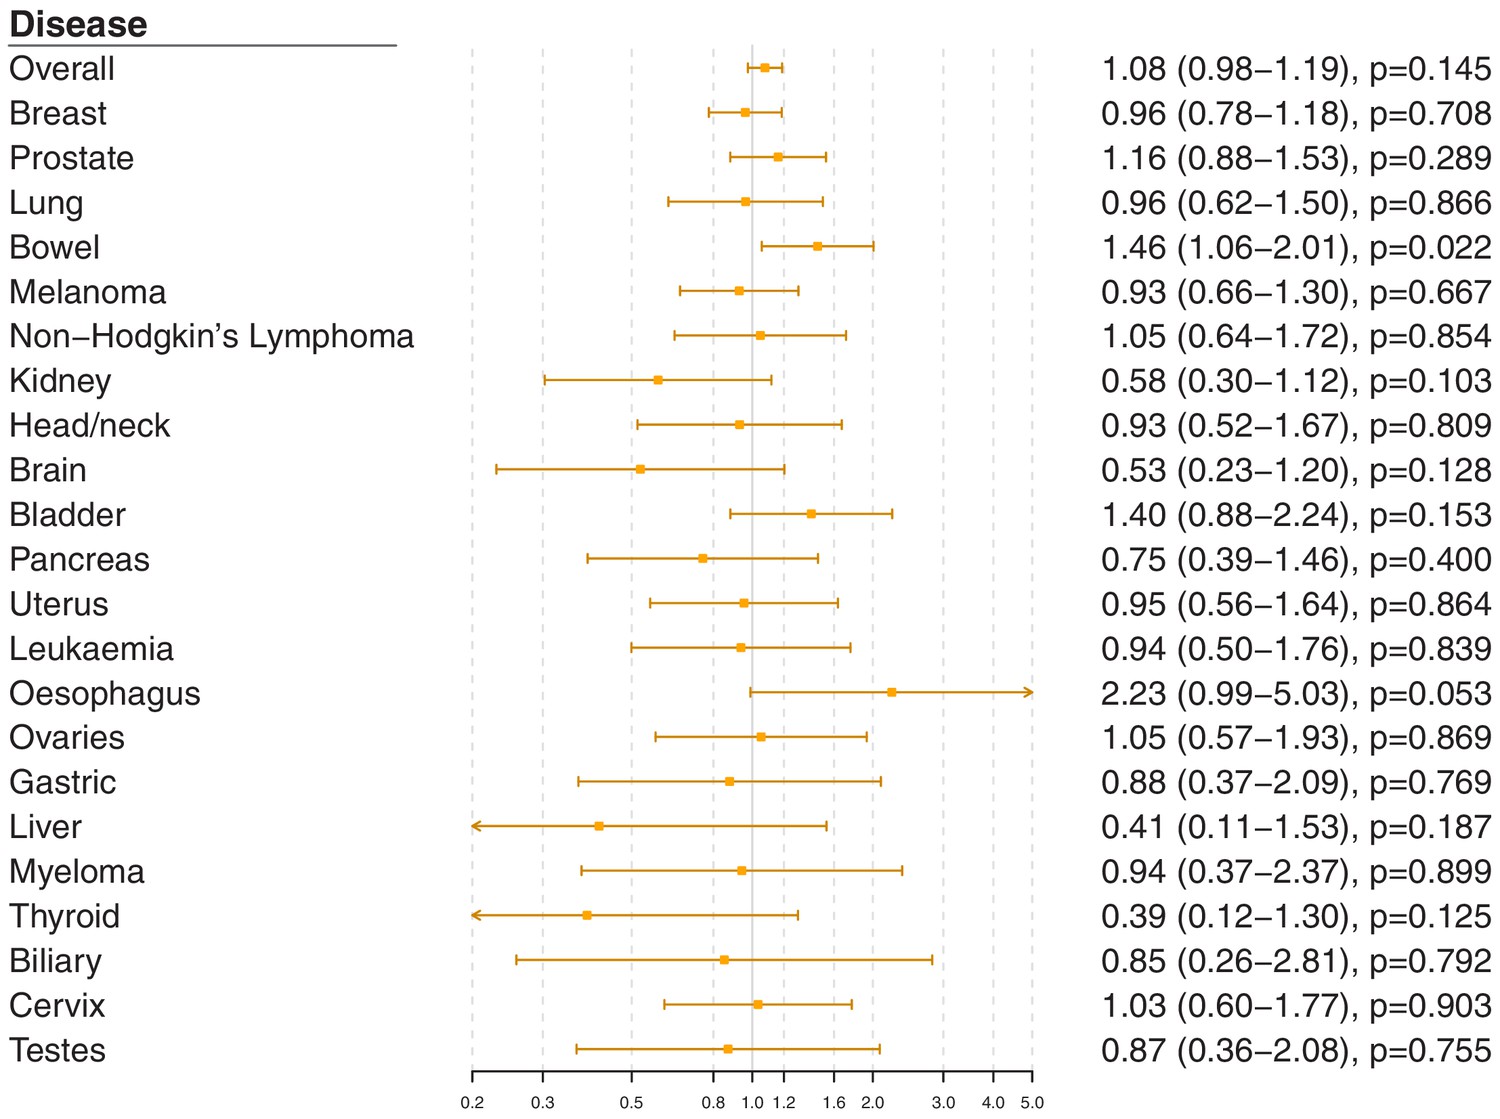
Gene-specific Mendelian randomization estimates (odds ratio with 95% confidence interval per one standard deviation increase in LDL-cholesterol) for variants in the PCSK9 gene region.
Figure 2—figure supplement 2
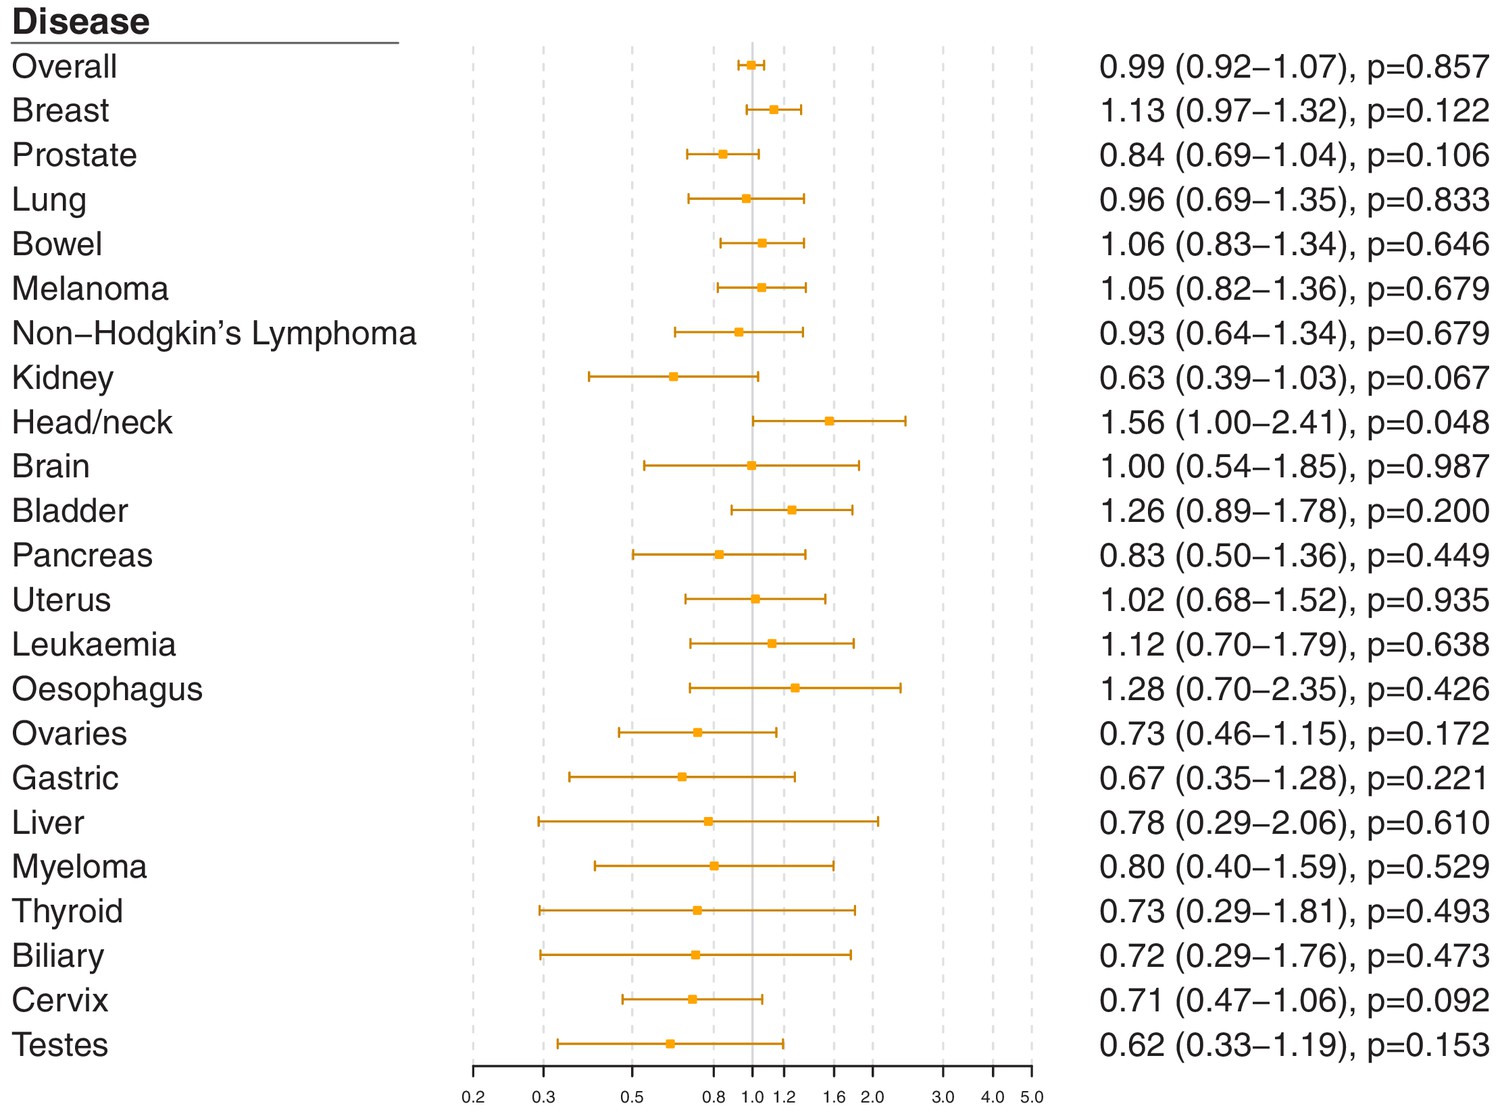
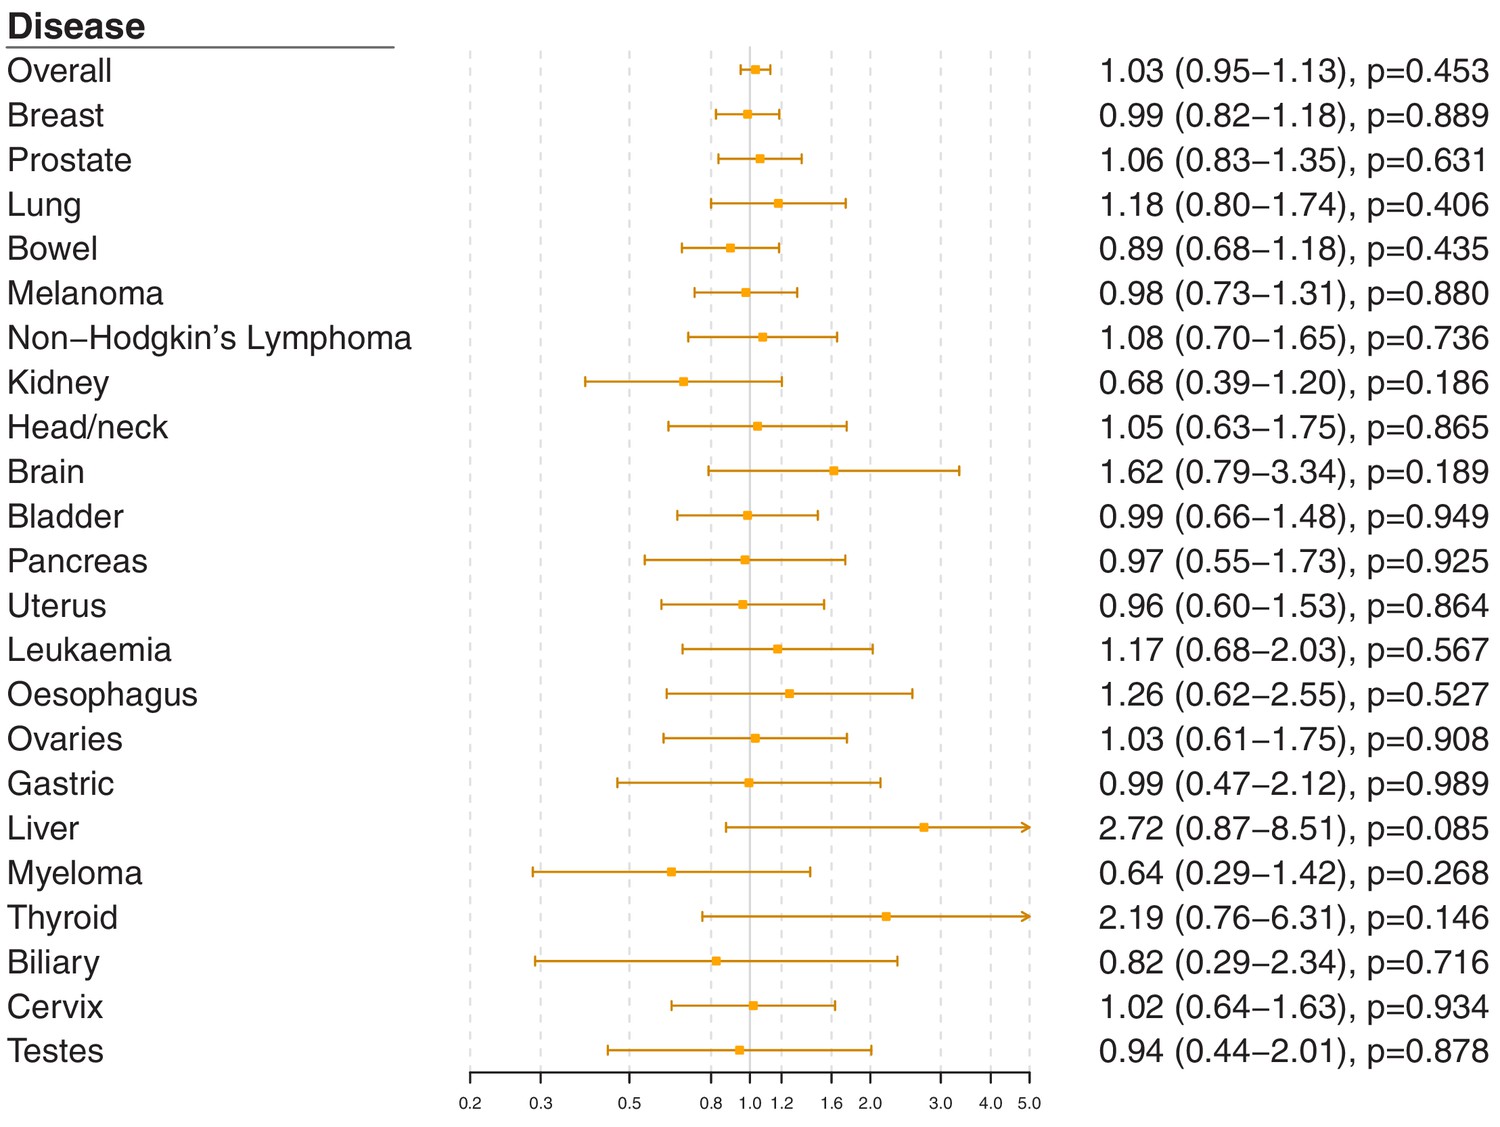
Gene-specific Mendelian randomization estimates (odds ratio with95%confidence interval per one standard deviation increase in LDL-cholesterol) for variants in theLDLRgene region.
Figure 2—figure supplement 3
Gene-specific Mendelian randomization estimates (odds ratio with 95% confidence interval per one standard deviation increase in LDL-cholesterol) for variants in theNPC1L1gene region.
Figure 2—figure supplement 4
Gene-specific Mendelian randomization estimates (odds ratio with 95% confidence interval per one standard deviation increase in LDL-cholesterol) for variants in theAPOC3gene region.
Figure 2—figure supplement 5
Gene-specific Mendelian randomization estimates (odds ratio with 95% confidence interval per one standard deviation increase in LDL-cholesterol) for variants in theLPLgene region.
Figure 2—figure supplement 6
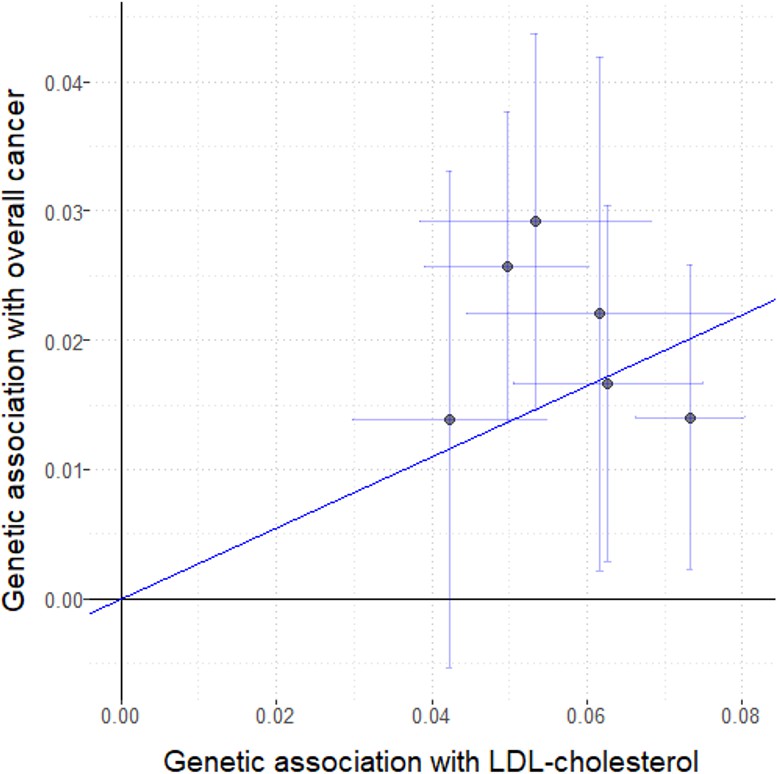
Genetic associations with LDL-cholesterol (standard deviation units) plotted against genetic associations with overall cancer (log odds ratios) for six variants in the HMGCR gene region.
Figure 2—figure supplement 7
Gene-specific Mendelian randomization estimates (odds ratio with 95% confidence interval per one standard deviation increase in LDL-cholesterol) for variants in the HMGCR gene region excluding self-reported outcomes.
Figure 2—figure supplement 8
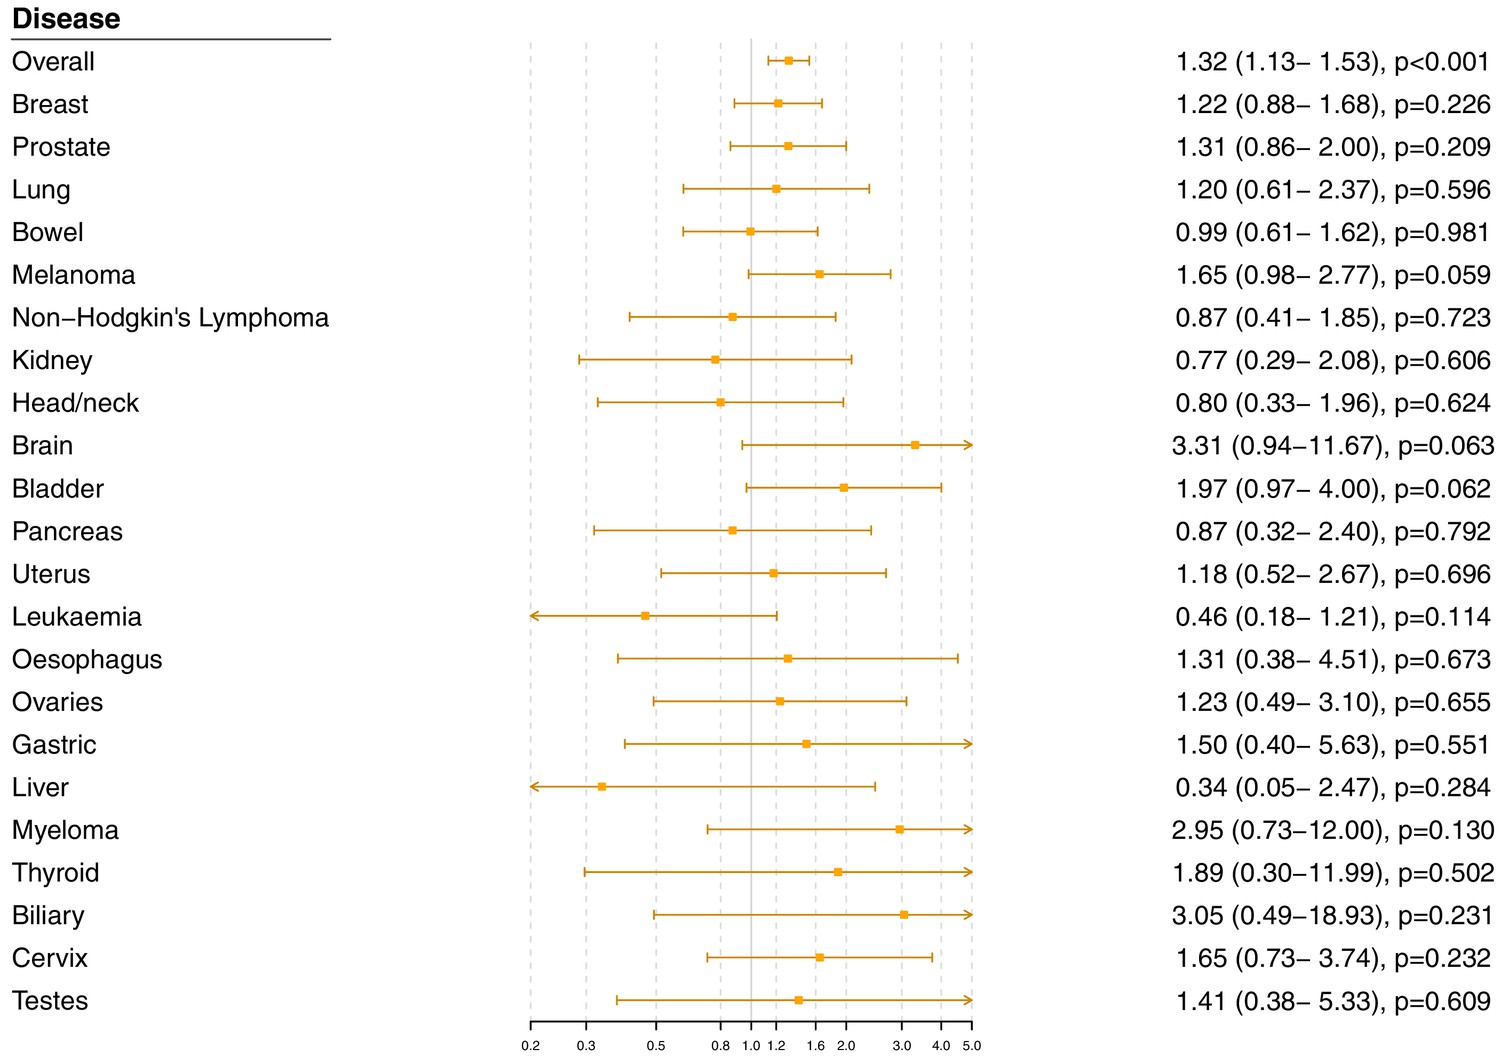
Gene-specific Mendelian randomization estimates (odds ratio with 95% confidence interval per one standard deviation increase in LDL-cholesterol) for variants in the HMGCR gene region excluding those with a cancer diagnosis other than site-specific cancer under analysis.
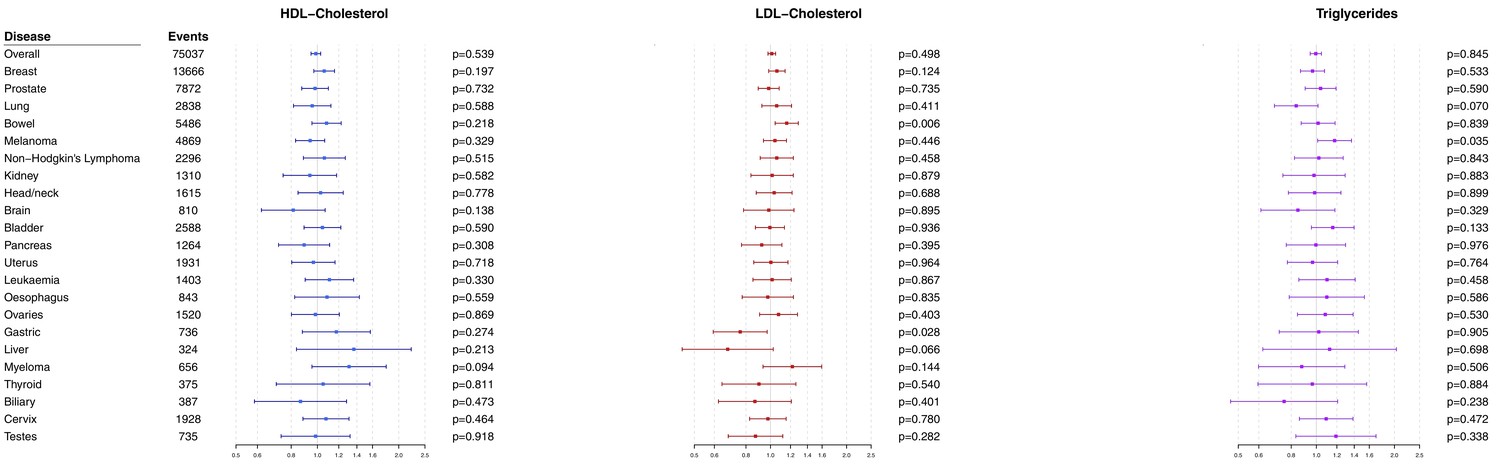
Figure 3 with 2 supplements
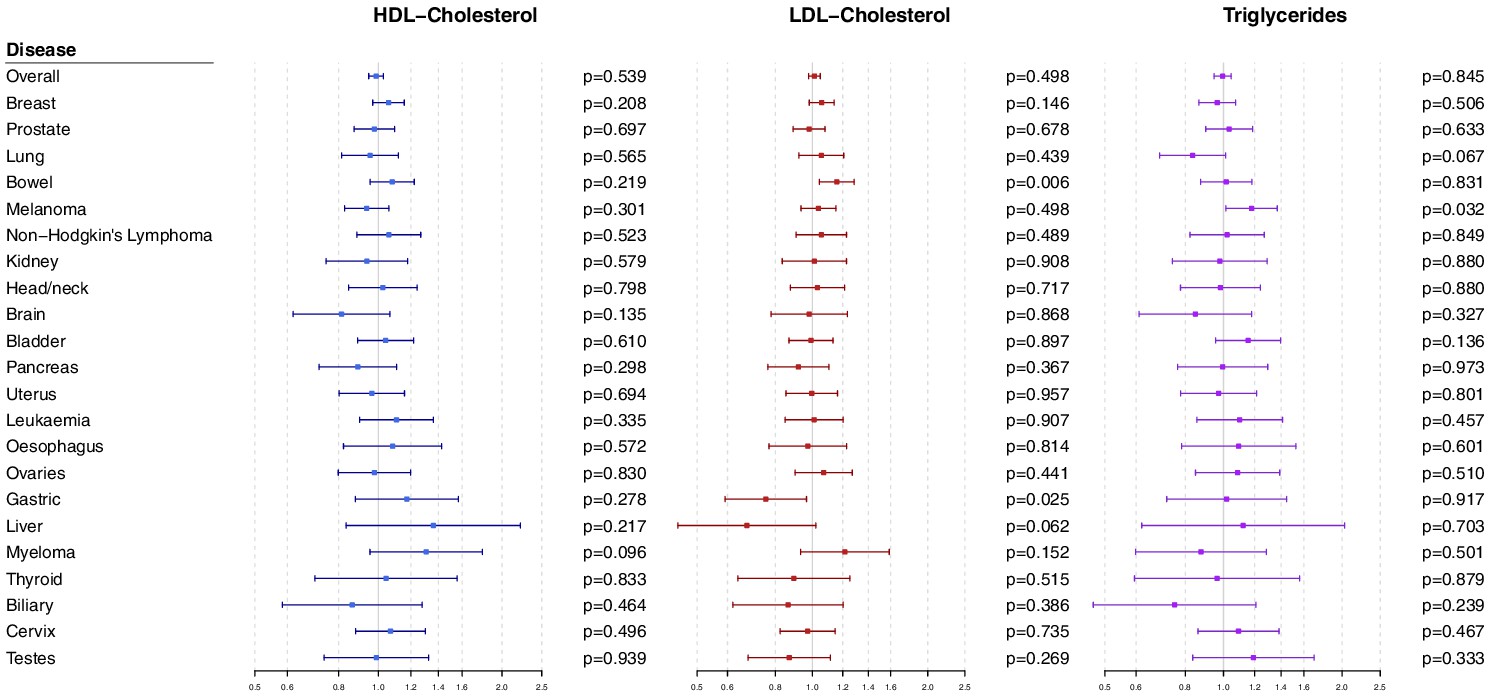
Multivariable Mendelian randomization estimates for HDL-cholesterol, LDL-cholesterol, and triglycerides (odds ratio with 95% confidence interval per one standard deviation increase in lipid fraction) from polygenic analyses including all lipid-associated variants.
Figure 3—figure supplement 1
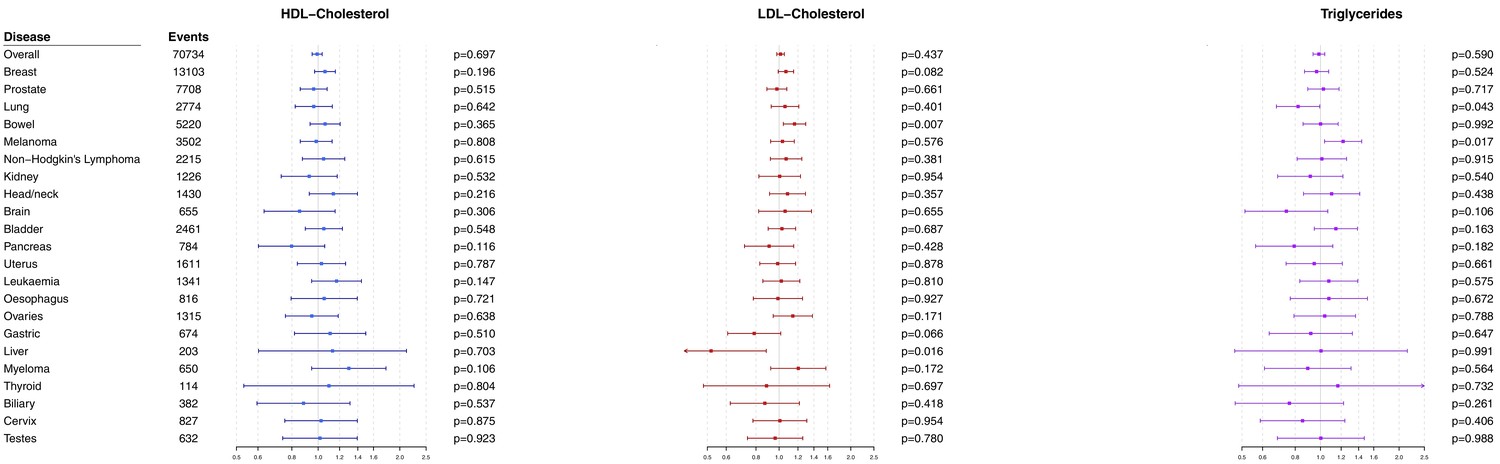
Multivariable Mendelian randomization estimates for HDL-cholesterol, LDL-cholesterol, and triglycerides (odds ratio with 95% confidence interval per one standard deviation increase in lipid fraction) from polygenic analyses including all lipid-associated variants excluding self-reported outcomes.
Figure 3—figure supplement 2
Multivariable Mendelian randomization estimates for HDL-cholesterol, LDL-cholesterol, and triglycerides (odds ratio with 95% confidence interval per one standard deviation increase in lipid fraction) from polygenic analyses including all lipid-associated variants excluding those with a cancer diagnosis other than the site-specific cancer under analysis.
Figure 4 with 3 supplements
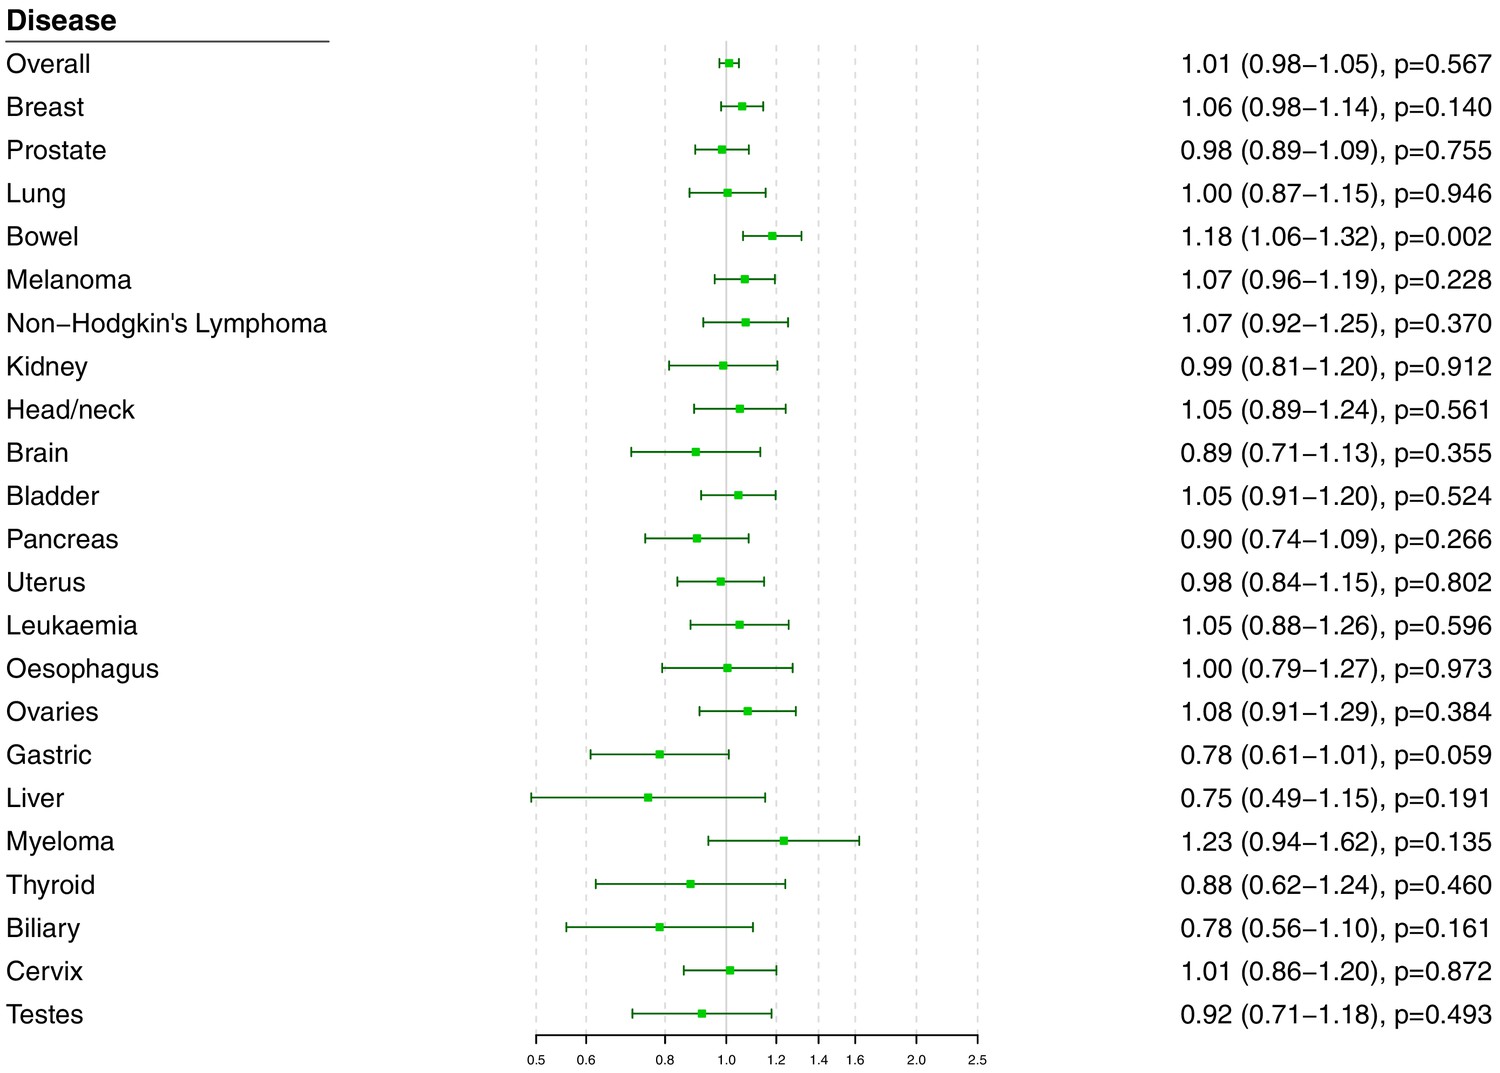
Univariable Mendelian randomization estimates for total cholesterol (odds ratio with 95% confidence interval per one standard deviation increase in lipid fraction) from polygenic analyses including all lipid-associated variants.
Figure 4—figure supplement 1
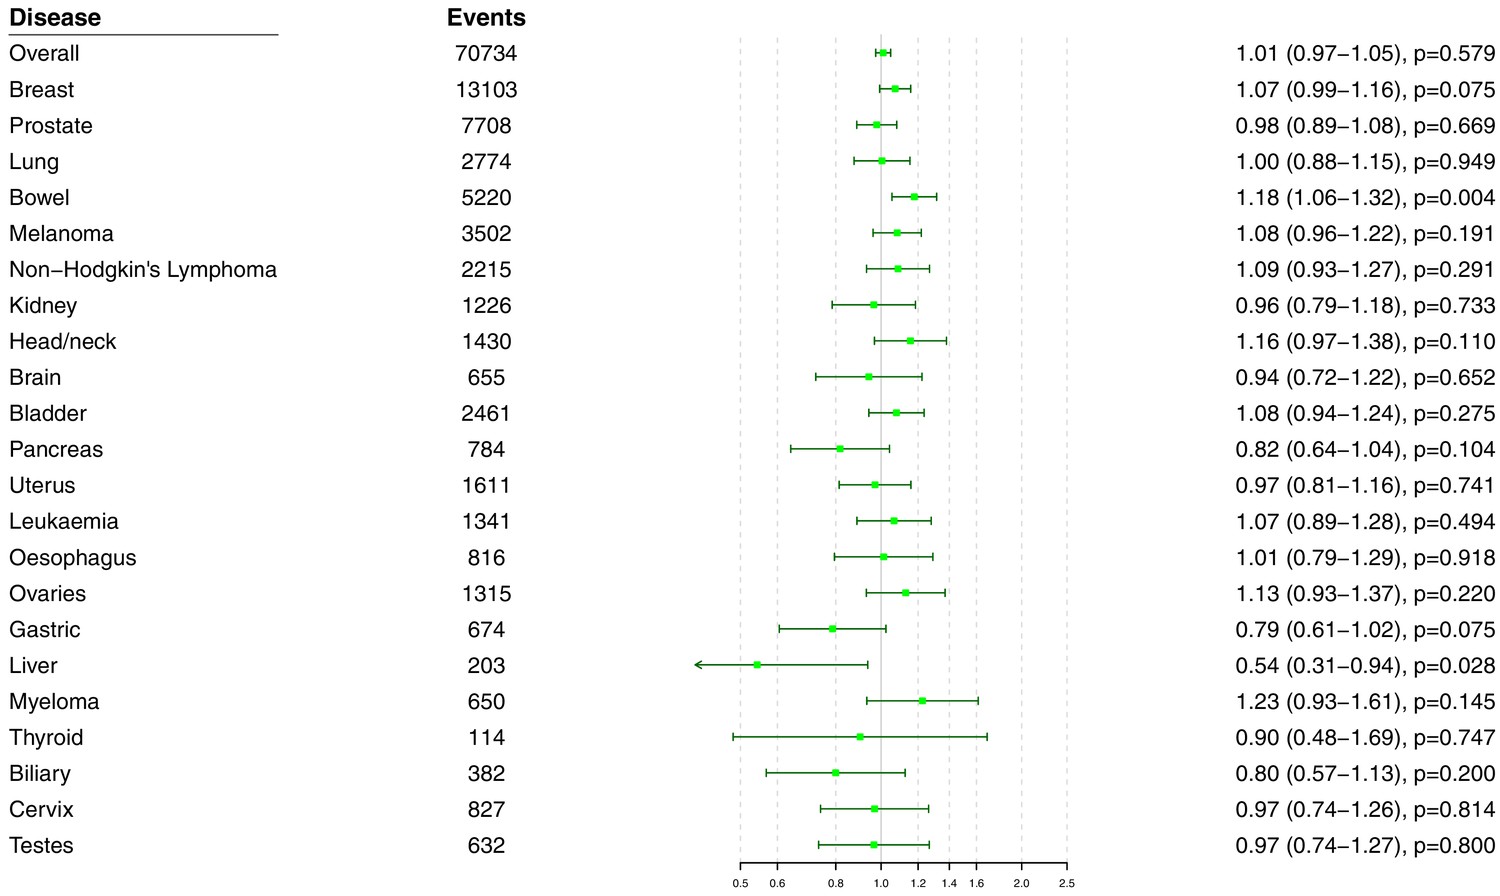
Univariable Mendelian randomization estimates for total cholesterol (odds ratio with 95% confidence interval per one standard deviation increase in lipid fraction) from polygenic analyses including all lipid-associated variants excluding self-reported outcomes.
Figure 4—figure supplement 2
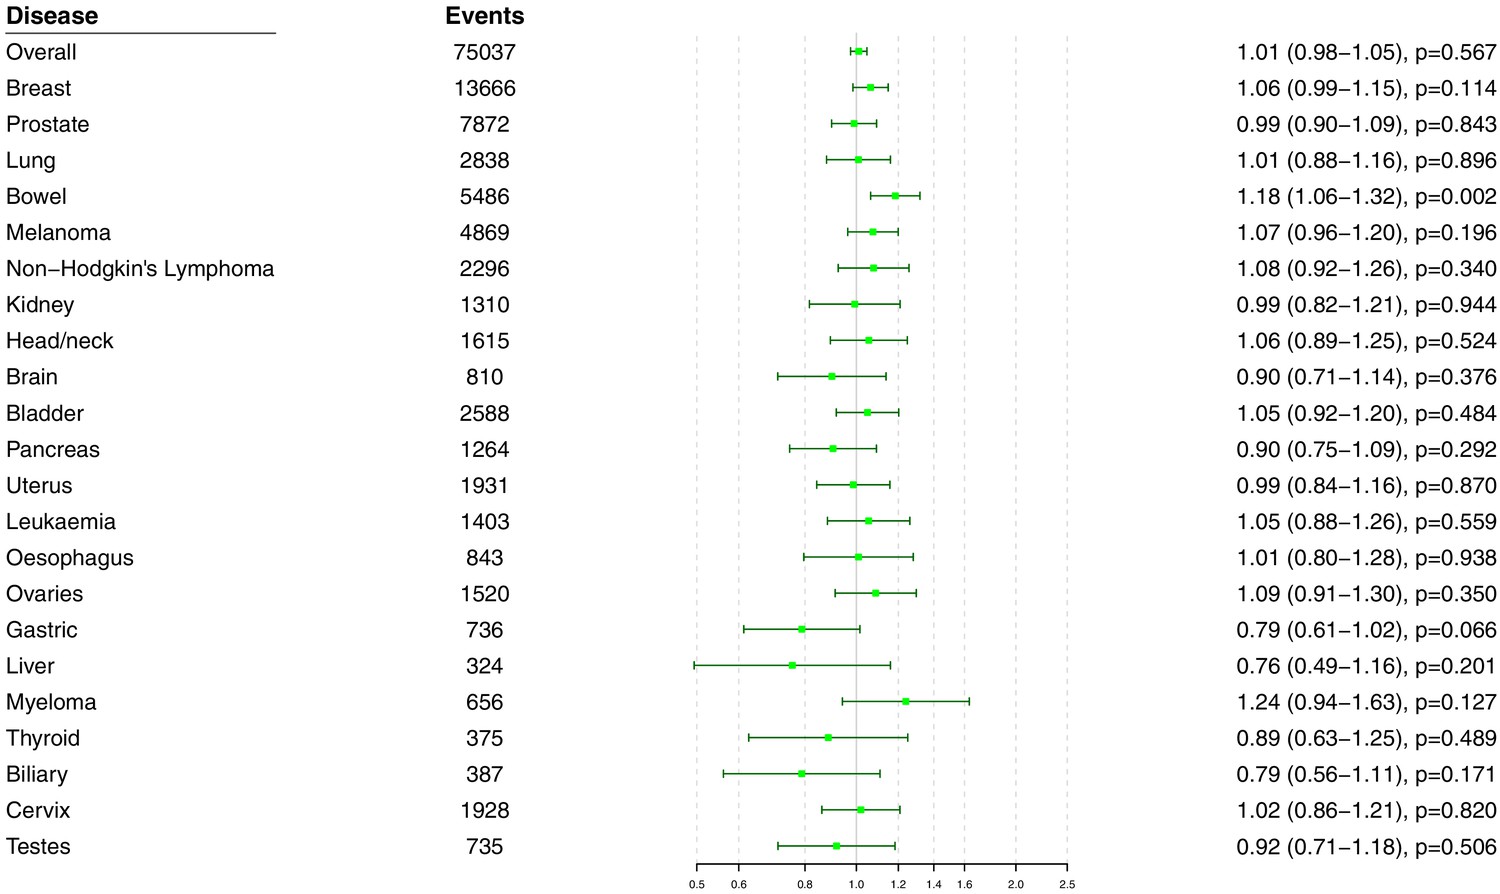
Univariable Mendelian randomization estimates for total cholesterol (odds ratio with 95% confidence interval per one standard deviation increase in lipid fraction) from polygenic analyses including all lipid-associated variants excluding those with a cancer diagnosis other than the site-specific cancer under analysis.
Figure 4—figure supplement 3
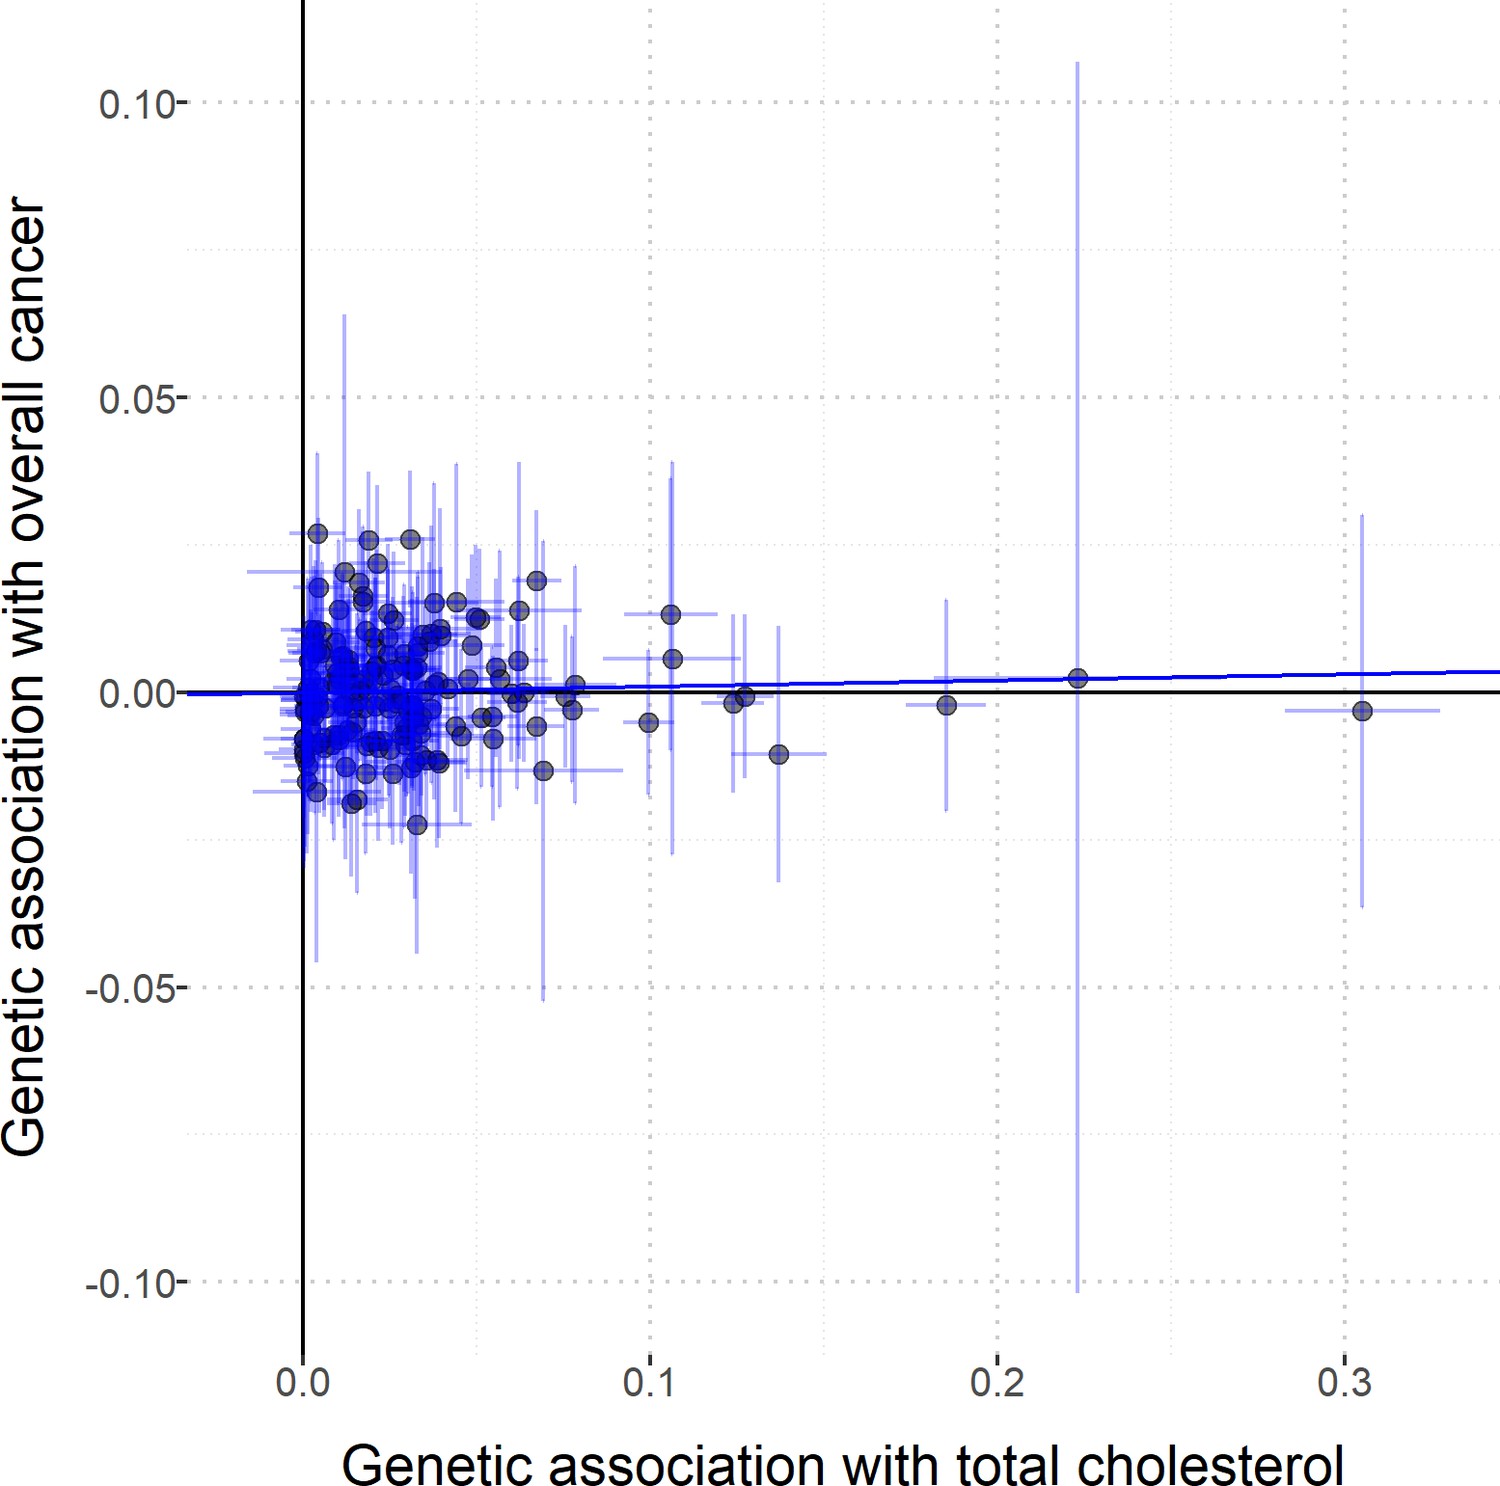
Scatterplot to assess heterogeneity of genetic associations with total cholesterol (horizontal axis, standard deviation units) against genetic associations with overall cancer (vertical axis, log odds ratios).
Error bars represent 95% confidence intervals. Solid diagonal line represents the inverse-variance weighted estimate.
Tables
Table 1
Baseline characteristics of the UK Biobank participants included in this study and the numbers of outcome events.
| Characteristic or cancer site/type | Mean (SD) or N (%)† |
|---|---|
| Sample size | 367,703 (100) |
| Female | 198,904 (54.1) |
| Age at baseline | 57.2 (8.1) |
| Body mass index | 27.3 (4.8) |
| Systolic blood pressure | 137.6 (18.6) |
| Diastolic blood pressure | 82.0 (10.1) |
| Smoking status (current/ex/ never)* | 37,866 (10.3)/185,704 (50.5)/143,777 (39.1) |
| Alcohol status (current/ex/ never)* | 342,797 (93.2)/12,732 (3.5)/11,646 (3.2) |
| History of type 2 diabetes | 15,834 (4.3) |
| Overall cancer | 75,037 (20.4) |
| Breast | 13,666 (6.9) |
| Prostate | 7872 (4.7) |
| Lung | 2838 (0.8) |
| Bowel | 5486 (1.5) |
| Melanoma | 4869 (1.3) |
| Non-Hodgkin’s lymphoma | 2296 (0.6) |
| Kidney | 1310 (0.4) |
| Head/neck | 1615 (0.4) |
| Brain | 810 (0.2) |
| Bladder | 2588 (0.7) |
| Pancreas | 1264 (0.3) |
| Uterus | 1931 (1.0) |
| Leukaemia | 1403 (0.4) |
| Esophagus | 843 (0.2) |
| Ovaries | 1520 (0.8) |
| Gastric | 736 (0.2) |
| Liver | 324 (0.1) |
| Myeloma | 656 (0.2) |
| Thyroid | 375 (0.1) |
| Biliary | 387 (0.1) |
| Cervix | 1928 (1.0) |
| Testes | 735 (0.4) |
-
*Excluding 356 participants with smoking status absent and 528 participants with alcohol consumption status absent.
†For sex-specific cancers, this is the percentage of individuals of the relevant sex.
Additional files
-
Source code 1
R files for performing Mendelian randomization analyses.
- https://cdn.elifesciences.org/articles/57191/elife-57191-code1-v1.zip
-
Source data 1
Summarized genetic associations with cancer outcomes estimated in UK Biobank.
- https://cdn.elifesciences.org/articles/57191/elife-57191-data1-v1.zip
-
Supplementary file 1
Supplementary tables 1-8.
- https://cdn.elifesciences.org/articles/57191/elife-57191-supp1-v1.docx
-
Transparent reporting form
- https://cdn.elifesciences.org/articles/57191/elife-57191-transrepform-v1.docx
Download links
A two-part list of links to download the article, or parts of the article, in various formats.
Downloads (link to download the article as PDF)
Open citations (links to open the citations from this article in various online reference manager services)
Cite this article (links to download the citations from this article in formats compatible with various reference manager tools)
Predicting the effect of statins on cancer risk using genetic variants from a Mendelian randomization study in the UK Biobank
eLife 9:e57191.
https://doi.org/10.7554/eLife.57191


