Globus pallidus dynamics reveal covert strategies for behavioral inhibition
- Department of Neurology, University of California, San Francisco, United States
- Department of Psychology, University of Sheffield, United Kingdom
- Department of Psychiatry; Neuroscience Graduate Program; Kavli Institute for Fundamental Neuroscience; Weill Institute for Neurosciences, University of California, San Francisco, United States
Figures
Figure 1 with 1 supplement
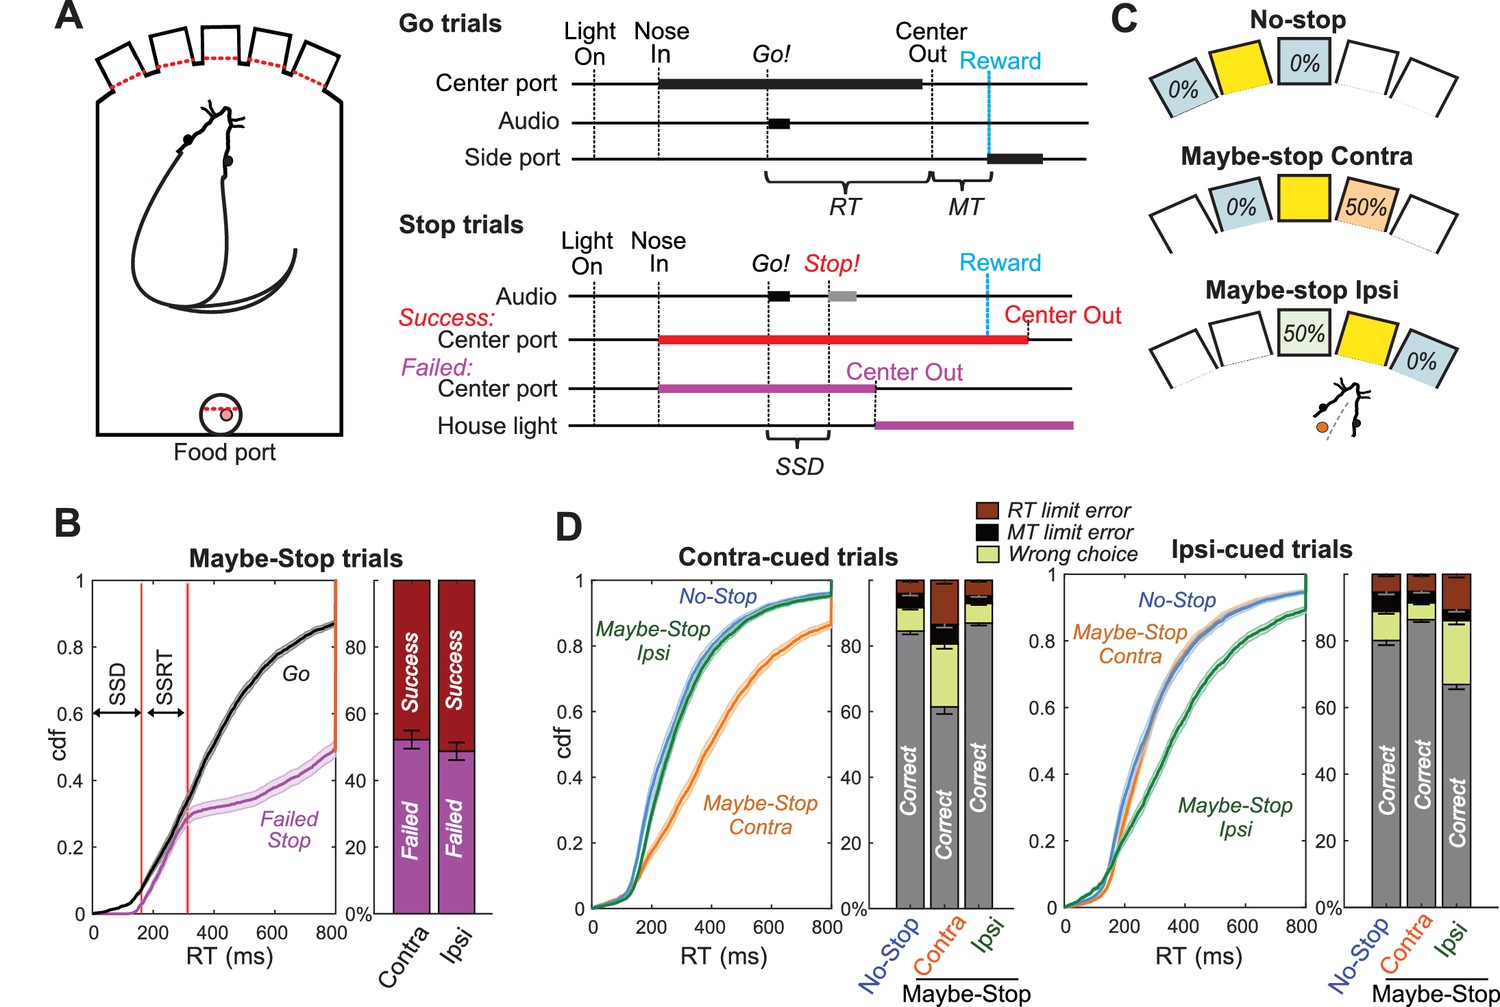
Reactive and Proactive Behavioral Inhibition.
(A) Left, operant box configuration; right, event sequence for Go and Stop trials. RT, reaction time; MT, movement time; SSD, stop-signal delay; Reward, delivery of a sugar pellet to the food port. (B) Left, distributions of Go and Failed-Stop RTs (on Maybe-Stop trials; shading, S.E.M. across n = 63 sessions). Failed-Stop RTs are similar to the faster part of the Go RT distribution, consistent with the ‘race’ model in which a relatively-fast Go process produces failures to stop. The tail of the Failed-Stop distribution (RT >500 ms) is presumed to reflect trials for which rats successfully responded to the Stop cue, but then failed to maintain holding until reward delivery (see Leventhal et al., 2012; Schmidt et al., 2013; Mayse et al., 2014). Right, proportions of failed and successful Stop trials after Contra and Ipsi Go cues. Error bars, S.E.M. across n = 63 sessions. (C) Trial start location indicates stop probabilities (locations counterbalanced across rats). In this example configuration recording from left GP, starting from the middle hole indicates the Maybe-stop Contra condition: Go cues instructing rightward movements might be followed by a Stop cue, but Go cues instructing leftward movements will not. (D) Proactive inhibition causes selective RT slowing for the Maybe-Stop direction (two-tail Wilcoxon signed rank tests on median RT for each session: contra cues in Maybe-Stop-contra versus No-Stop, z = 7.7, p=1.15 × 10⁻¹⁴; ipsi cues in Maybe-Stop-contra versus No-Stop, p=0.32). Additionally, under selective proactive inhibition rats were more likely to fail to respond quickly enough (RT limit errors; Wilcoxon signed rank tests, z = 7.2, p=5.41 × 10⁻¹³) and to select the wrong choice (uncued action direction; Wilcoxon signed rank tests, z = 7.0, p=2.59 × 10⁻¹²). Error bars, S.E.M. across n = 63 sessions. Only trials without a Stop cue are included here. RT limit error = Nose remained in Center port for >800 ms after Go cue onset; MT limit error = movement time between Center Out and Side port entry >500 ms.
Figure 1—figure supplement 1
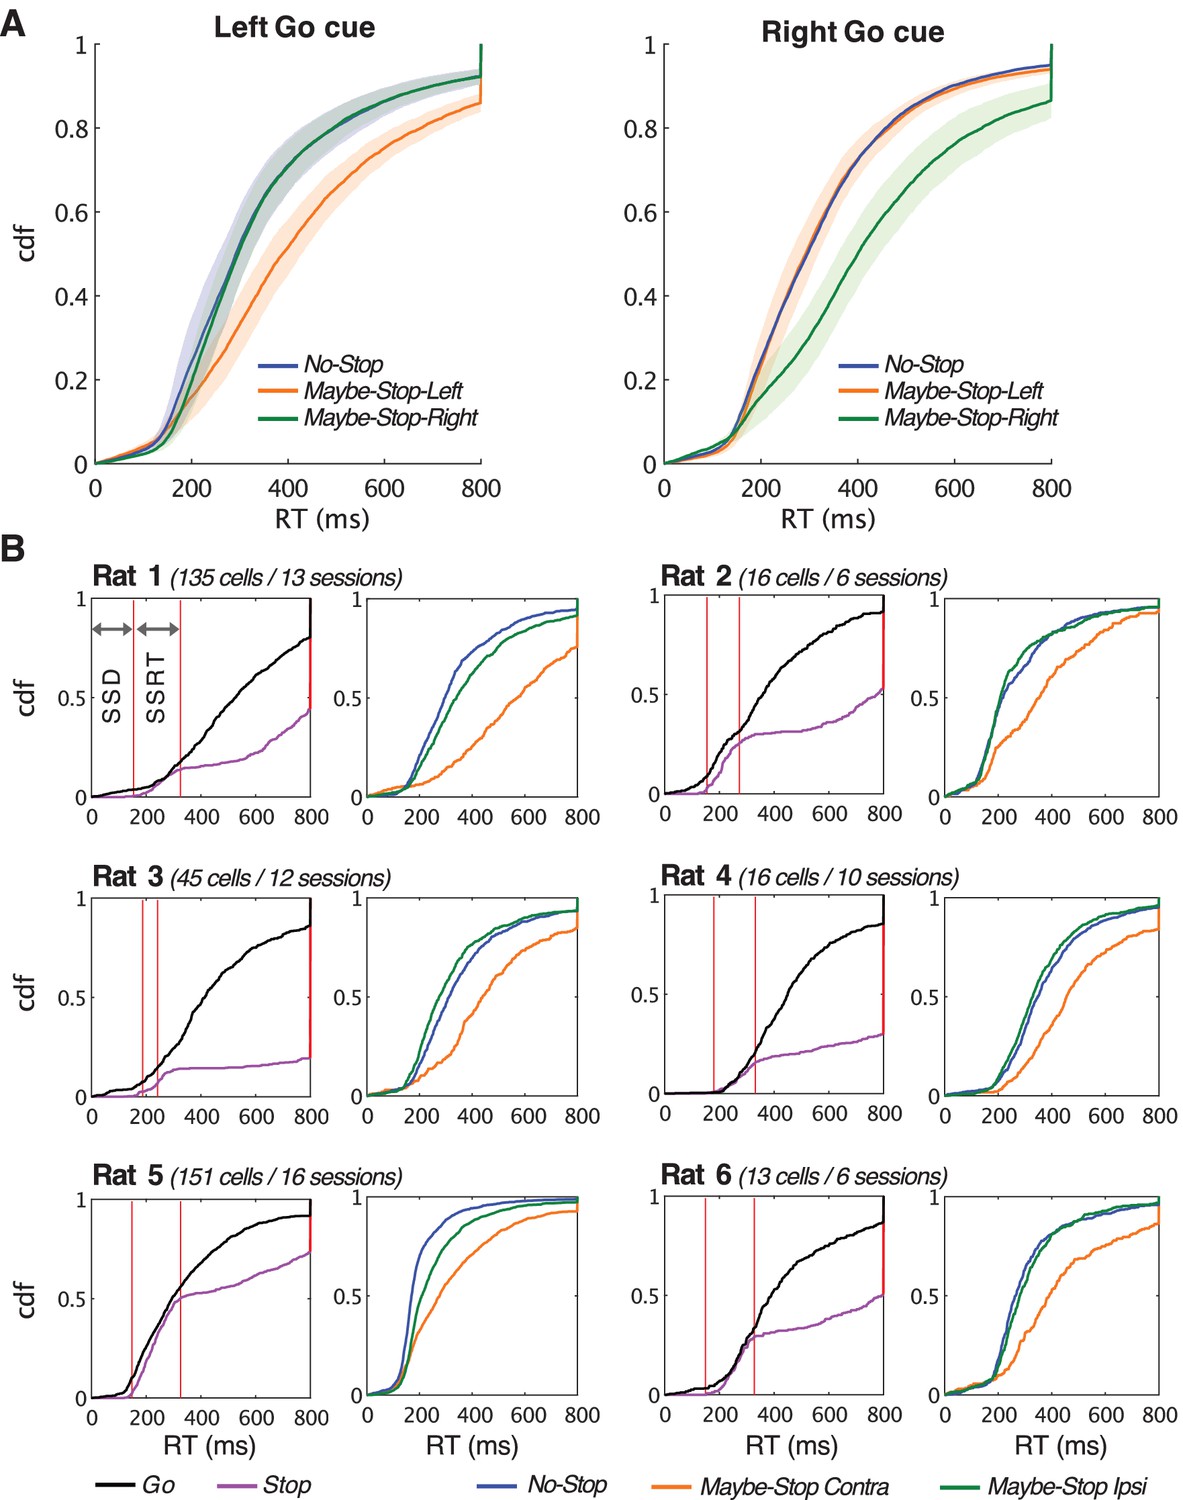
Behavioral data for all sessions and for each individual animal.
(A) Proactive slowing of RT is visible in aggregate across all recorded sessions (n = 251 sessions, from six rats), in both left and right directions. Shading indicates SEM across rats. (B) Cumulative density plots of RT for all sessions included in electrophysiology data analysis for each rat, in the same format as Figure 1. Left plots, comparison of Go RT and Stop-fail RT; right plots, selective proactive inhibition for movements contraversive to the recorded neurons.
Figure 2 with 1 supplement
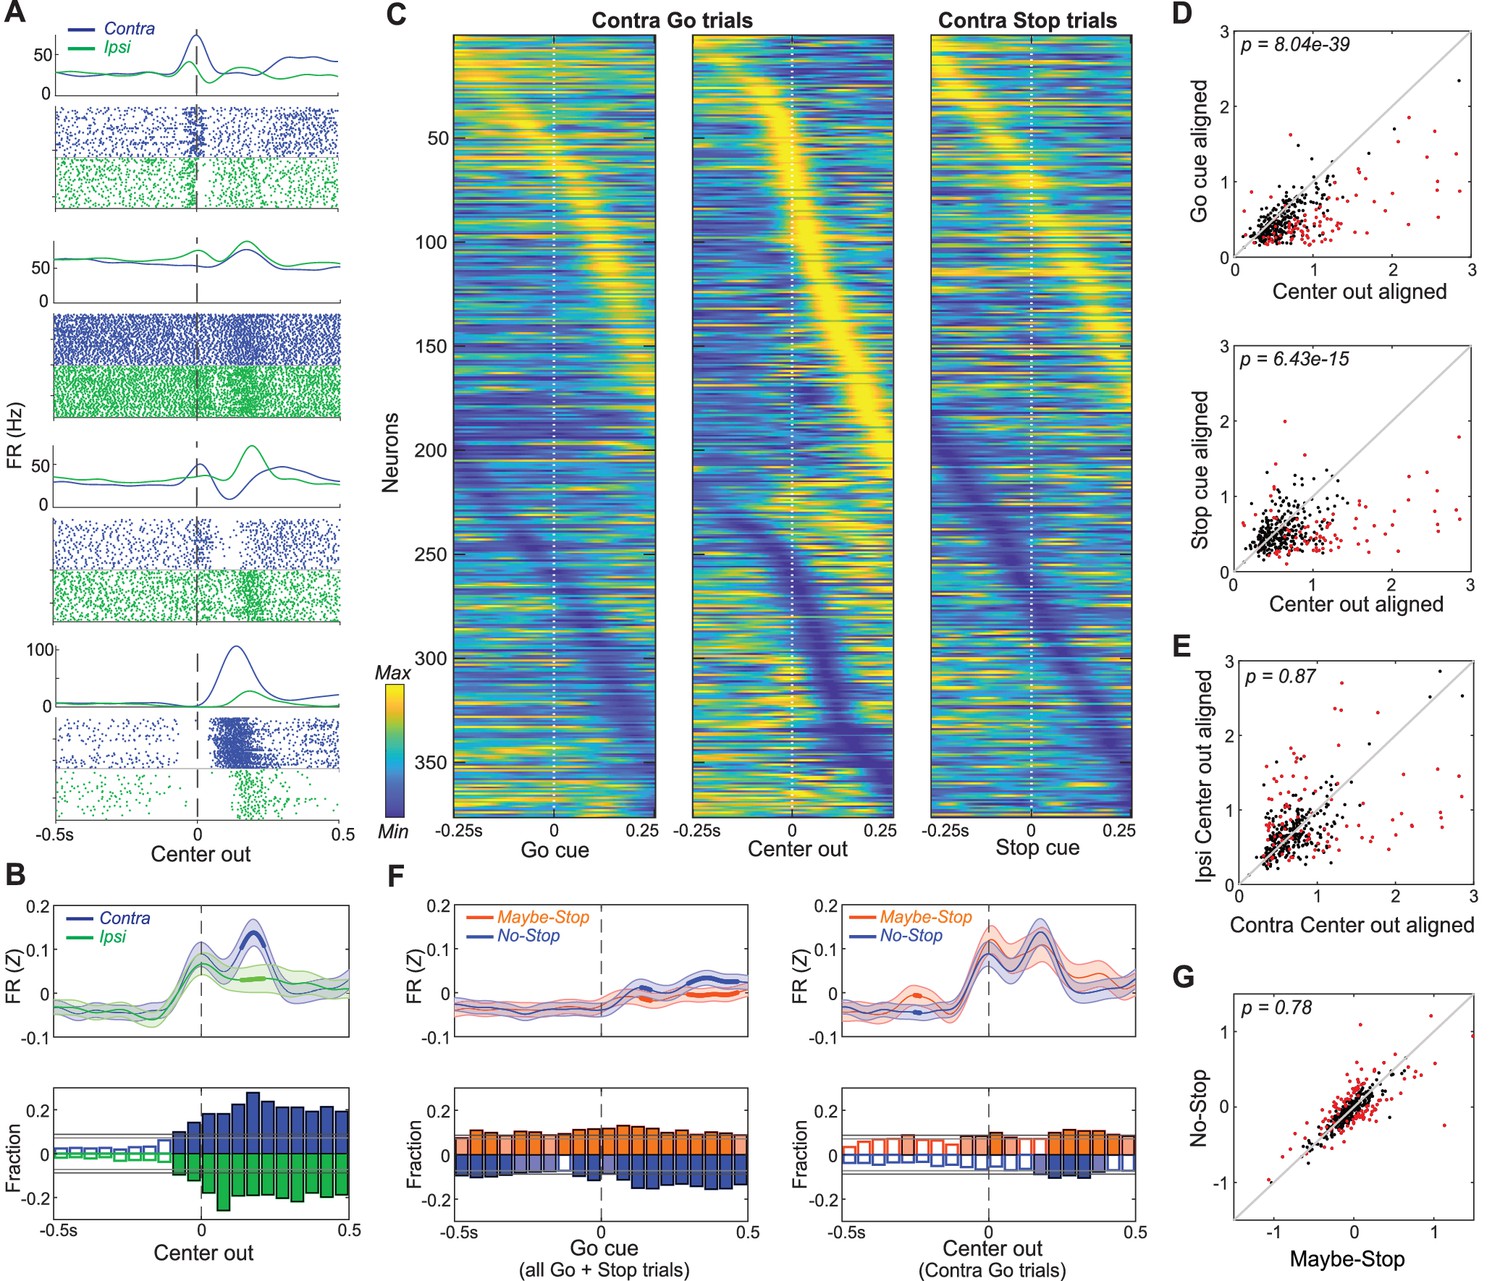
Movement-related activity of individual GP neurons.
(A) Four examples of single neurons, showing average firing rates (top) and spike rasters (bottom) aligned on movement onset (Center Out; correct No-Stop trials only). Activity for contra-, ipsi- movements are shown in blue and green respectively. (B) Top, averaged, Z-scored firing of GP cells around Center Out; time points when activity distinguishes movement direction are shown with thicker lines. Shaded band, +- S.E.M across n = 376 neurons. Bottom, fraction of neurons whose firing rate significantly distinguishes movement direction, across time (t-test for each neuron in each 50 ms bin, p<0.05). Higher firing rate for contra-, ipsi- shown in blue, green respectively. Horizontal grey lines indicate thresholds for a significant proportion of neurons (binomial test, p<0.05 without or with multiple-comparisons correction respectively) and bins that exceed these thresholds are filled in color. Many GP cells encoded movement direction even before Center-Out; this is less obvious after averaging. (C) Firing pattern of all GP cells (n = 376) on correct contra trials. Activity is scaled between minimum and maximum firing rate across alignments to Go cue (left), Center Out (middle) and the Stop cue (right). In each column cell order (top-bottom) is sorted using the time of peak deflection from average firing, separately for cells that showed bigger increases (top) or decreases (bottom). (D) GP population activity is more related to movements than cues. Scatter plots show peak deflections in firing rate (Z-scored) for each GP cell, comparing Center Out aligned data to Go cue aligned (top) or Stop cue aligned (bottom). Data included are 500 ms around alignment time. Indicated p-values are from Wilcoxon signed rank tests over the GP population; individual GP cells that showed significant differences are indicated with red points (t test, p<0.05). (E) Scatter plot indicates no overall movement direction bias. Same format, same statistical tests as D, but comparing peak deflections in Center Out aligned firing rate for contra, ipsi movements. (F) Top, comparing average firing between Maybe-Stop and No-Stop conditions. On left, data are aligned on Go cue, including all Maybe-Stop-Contra trials (including both contra- and ipsi-instructing Go cues and Stop trials). On right, data are aligned on Center-Out (and does not include Stop cue trials). Bottom, proportion of neurons whose firing rate is significantly affected by proactive inhibition (same format as B; bins exceeding p<0.05 threshold without multiple comparisons correction are filled in light color, bins exceeding corrected threshold are filled in dark color). Although GP neurons significantly distinguished Maybe-Stop and No-Stop conditions at multiple time points before the Go cue, there was no single time point at which the proportion of individually-significant neurons became large. (G) Comparison of individual cell activity in Maybe-Stop and No-Stop conditions, during the 500 ms epoch immediately before the Go cue.
Figure 2—figure supplement 1
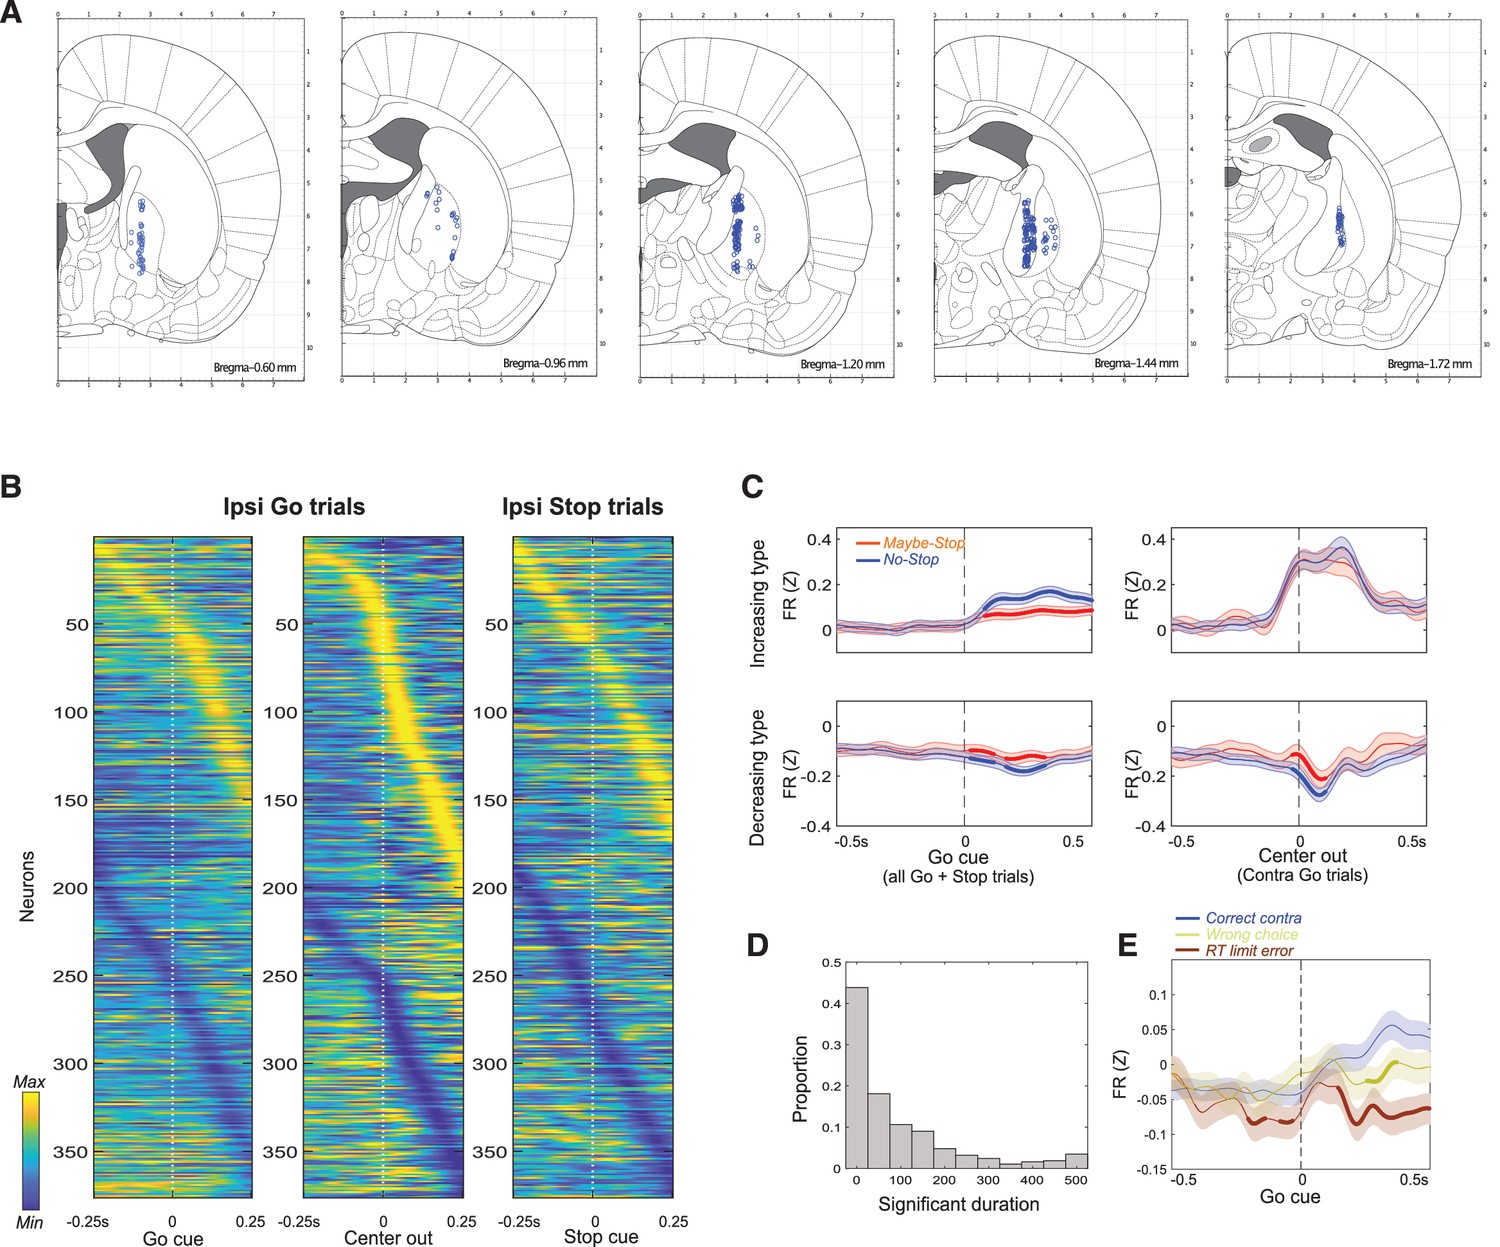
Further details of GP recordings.
(A) Estimated locations of recorded units, within coronal atlas sections (Paxinos, 2006). (B) Firing pattern of all GP cells (n = 376) on ipsi trials, shown in the same format as Figure 2C. (C) Proactive effects on average GP firing. As Figure 2F, but dividing units into those that predominantly increase or decrease firing rate. (D). Duration of significant difference between Maybe-Stop and No-Stop conditions, during the 500 ms before Go cue, for each neuron. Most units show a significant difference at some time, but very few show sustained changes with proactive inhibition. (E). Comparing average GP firing on Correct contra trials and error trials (wrong choices and RT limit errors).
Figure 3 with 1 supplement
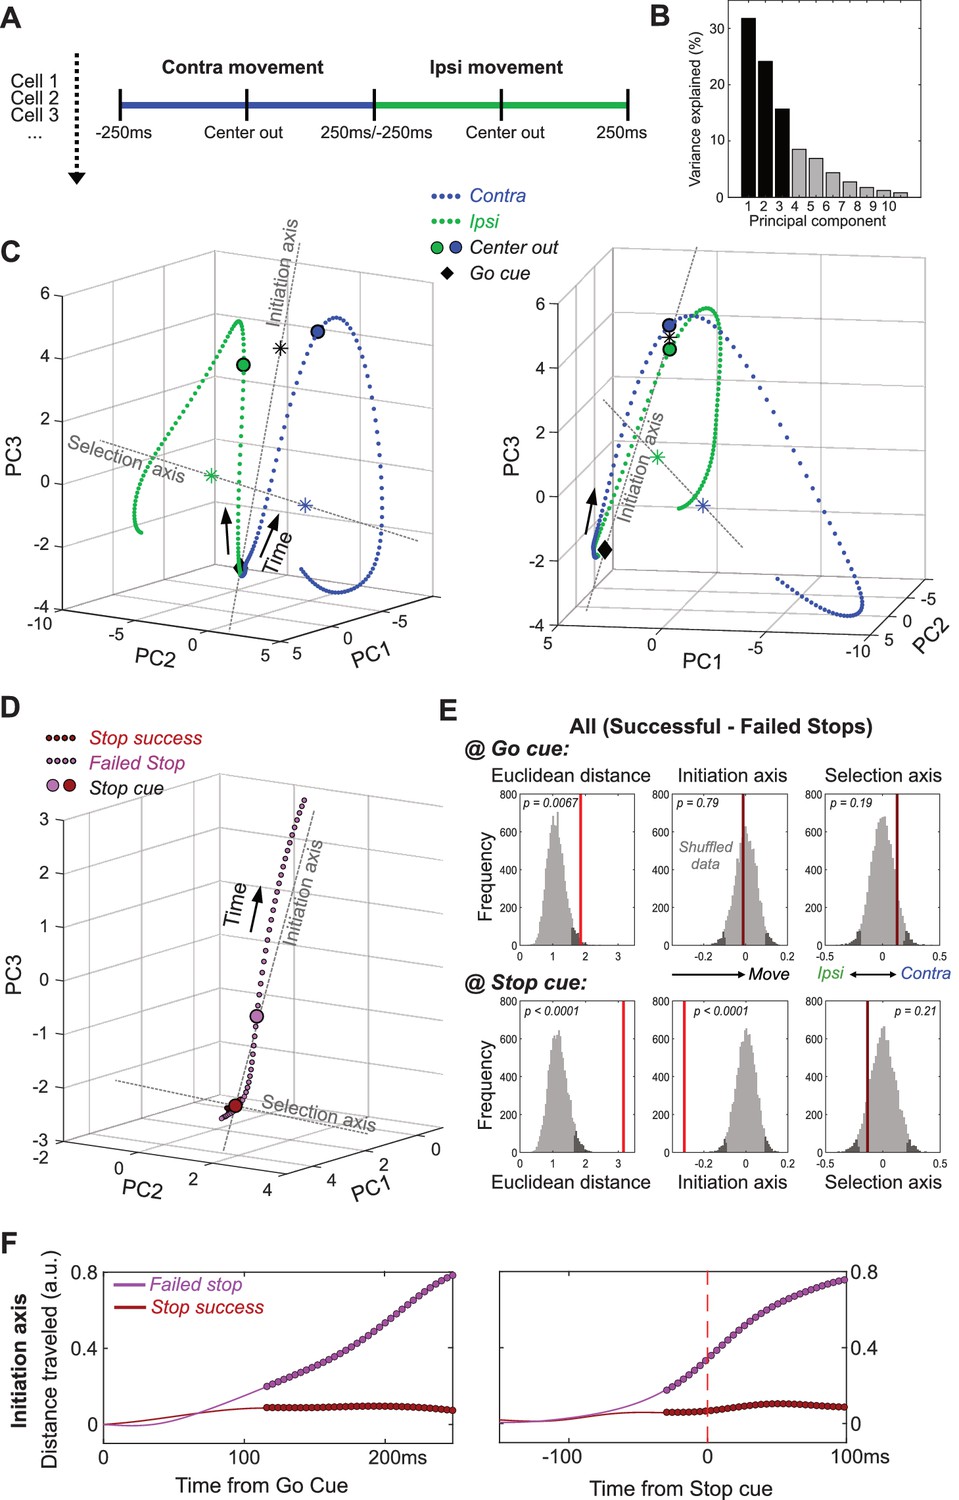
GP dynamics for Going and Stopping.
(A) PCA was performed using averaged, normalized firing rates for each GP cell, in a 500 ms epoch around Center Out for contra and ipsi movements (concatenated). (B) Variance explained by each of the first 10 PCs. (C) GP state-space trajectories for contra and ipsi movements (blue, green) within the first 3 PCs, shown from two different angles. Each small dot along the trajectory is separated by 4 ms. Trajectories begin at a similar mean location at the Go cue (diamonds), and diverge gradually until Center Out (large circles) then rapidly thereafter. ‘Initiation Axis’ joins the average position at Go cue and the average position at Center Out (black asterisk). ‘Selection Axis’ joins the means of each trajectory, colored asterisks. (D) Comparing state-space trajectories for Successful- and Failed-Stop trials. Same format and PCA space as C, but plotting trajectories aligned on the Stop cue (including both contra and ipsi trials). Filled circles indicate epochs of significant Euclidean distance between two trajectories (permutation test on each 4 ms time bin, p<0.05). (E) Permutation tests of whether the state-space positions for Successful- and Failed-Stop trials are significantly different, at either the Go cue (top) or the Stop cue (bottom). Positions are compared either in the 10-D PC space (Euclidean distance) or along the Initiation or Selection Axes. Grey distributions show surrogate data from 10000 random shuffles of trial types. Dark grey, most extreme 5% of distributions (one-tailed for Euclidean, 2-tailed for others). Red vertical lines show observed results (bright red, significant; dark red, n.s.). (F) Distance travelled along Initiation Axis for successful and failed Stop trials, aligned on either Go cue (left) or Stop cue (right). Thicker lines indicate epochs of significant difference between successful and failed Stop trajectories (permutation test on each 4 ms time bin, p<0.05). On Failed stops (only), activity has already evolved substantially by the time of the Stop cue.
Figure 3—figure supplement 1
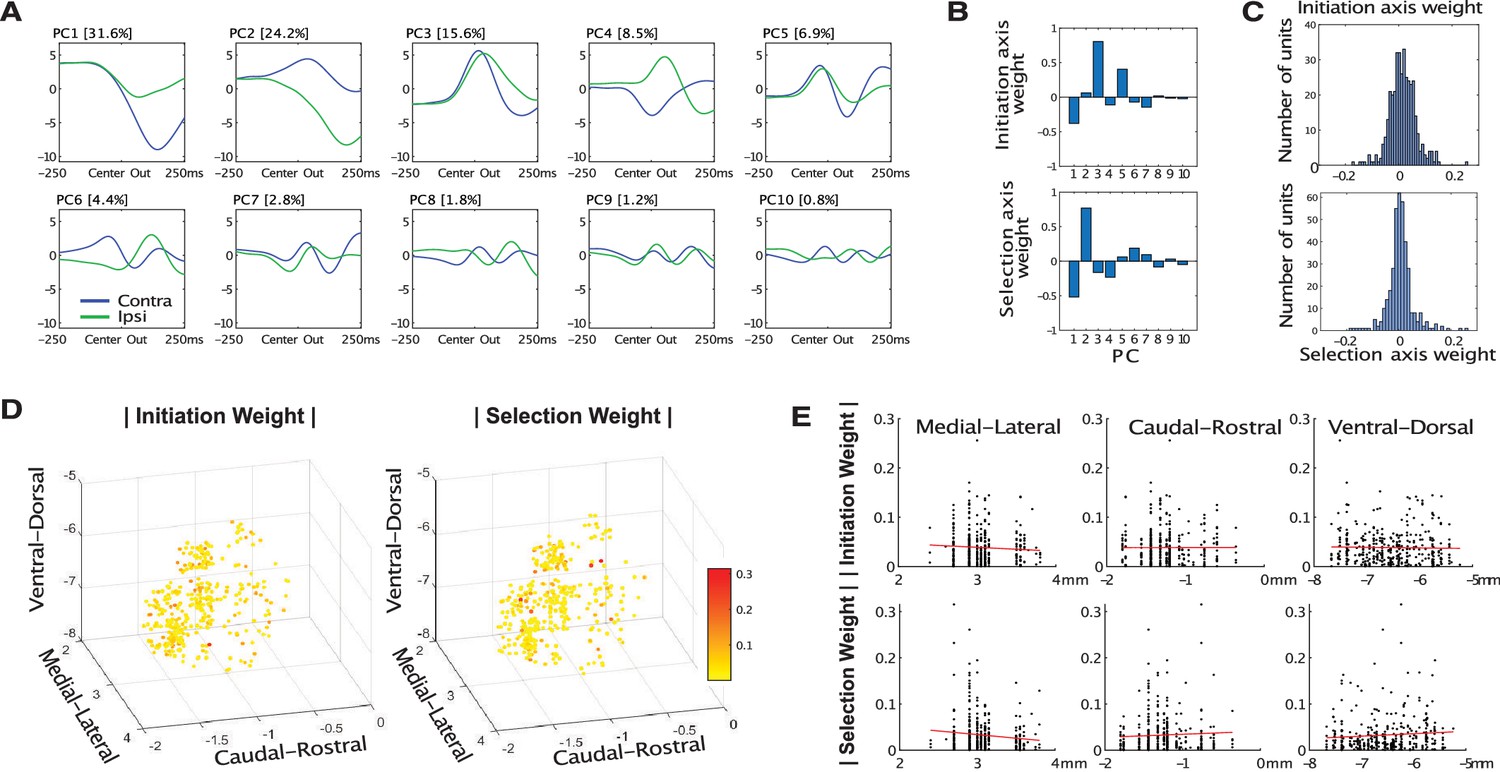
Principal Components.
(A) The first 10 principal components. (B) Relative contributions of each PC to the Initiation and Selection Axes (i,e, the eigenvector of each Axis in the 10-PC space). (C) Weight of each GP neuron on the Initiation and Selection Axis. (D, E) Spatial arrangement of absolute weight values.
Figure 4 with 2 supplements
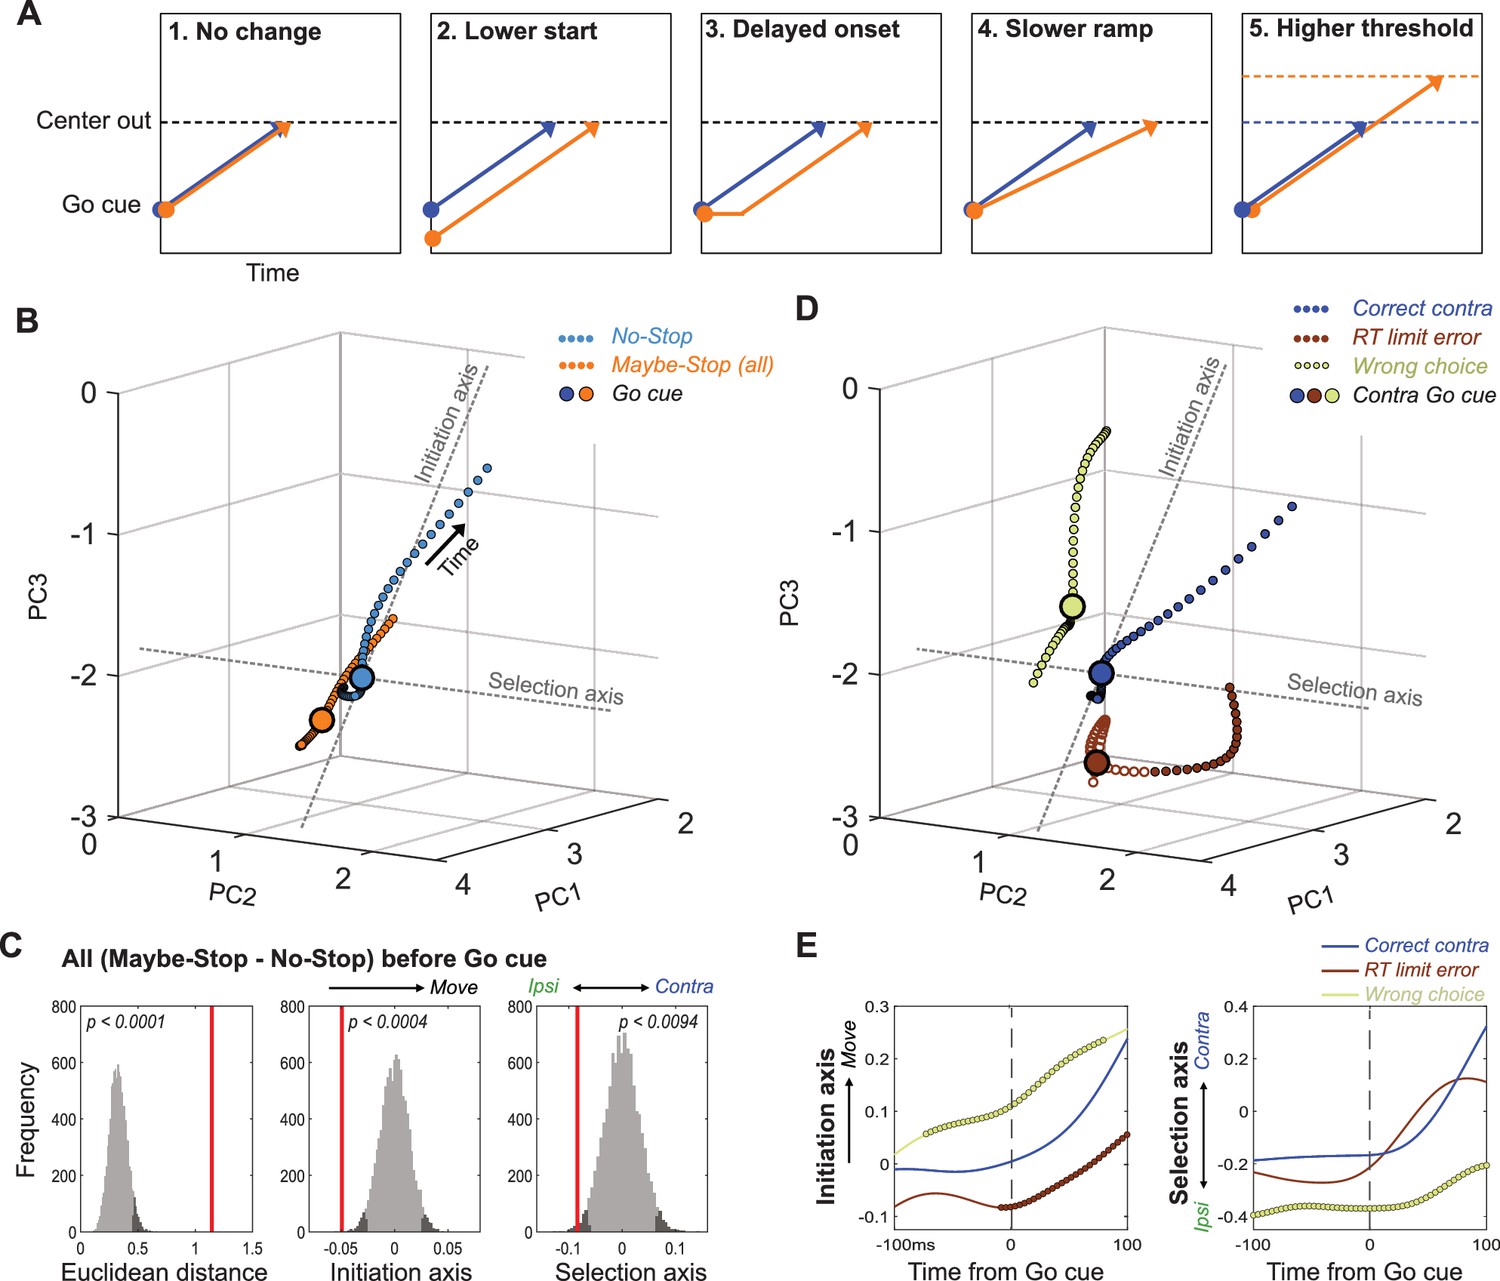
Distinct state-space positions at Go cue predict distinct outcomes.
(A) Alternative concepts for proactive inhibition, illustrated using a simplified rise-to-threshold framework (Brown and Heathcote, 2008; Noorani and Carpenter, 2016; Verbruggen and Logan, 2009). (B). Comparison of GP population state between Maybe-Stop-Contra trials (including both contra- and ipsi-instructing Go cues and Stop trials) and No-Stop trials (± 100ms around Go cue; same state-space as Figure 3). Filled circles indicate epochs of significant Euclidean distance between two trajectories (permutation test on each 4 ms time bin, p<0.05). (C). Permutation tests (same format as Figure 3). Just before the Go cue (-100-0ms) the Maybe-Stop state was significantly shifted away from action initiation, and in the ipsi direction. (D) Breakdown of GP state for trials with contra Go cues, by distinct trial outcomes. (E) Quantification of D, comparing evolution of activity along Initiation and Selection Axes on correct contra trials (blue), incorrect action selections (light green) and RT limit errors (brown; failure to initiate movement within 800ms). Thicker lines indicate epochs of significant difference to the Correct trajectory (permutation test on each 4 ms time bin, p<0.05).
Figure 4—figure supplement 1

Neural population results for individual rats, and corresponding behavior.
(A) Comparing proactive shifts along Initiation and Selection Axes for all rats together (left) and for individual rats. Rats 2,4 and 6 were grouped together as they had fewer recorded neurons. In left plots, thicker lines indicate epochs of significant difference between two conditions (permutation test on each 4 ms time bin, p<0.05). Note that Rat three had the largest Selection Axis bias towards ipsiversive movements before the Go cue (and a bias towards movement on the Initiation Axis). (B) RT results for the same animal groupings. In all cases there was a greater slowing of contra than ipsi movements, consistent with a selective proactive inhibition effect. However, Rat three showed a speeding of ipsi movements compared to the No-Stop condition, consistent with an ipsiversive bias and no overall movement inhibition.
Figure 4—figure supplement 2
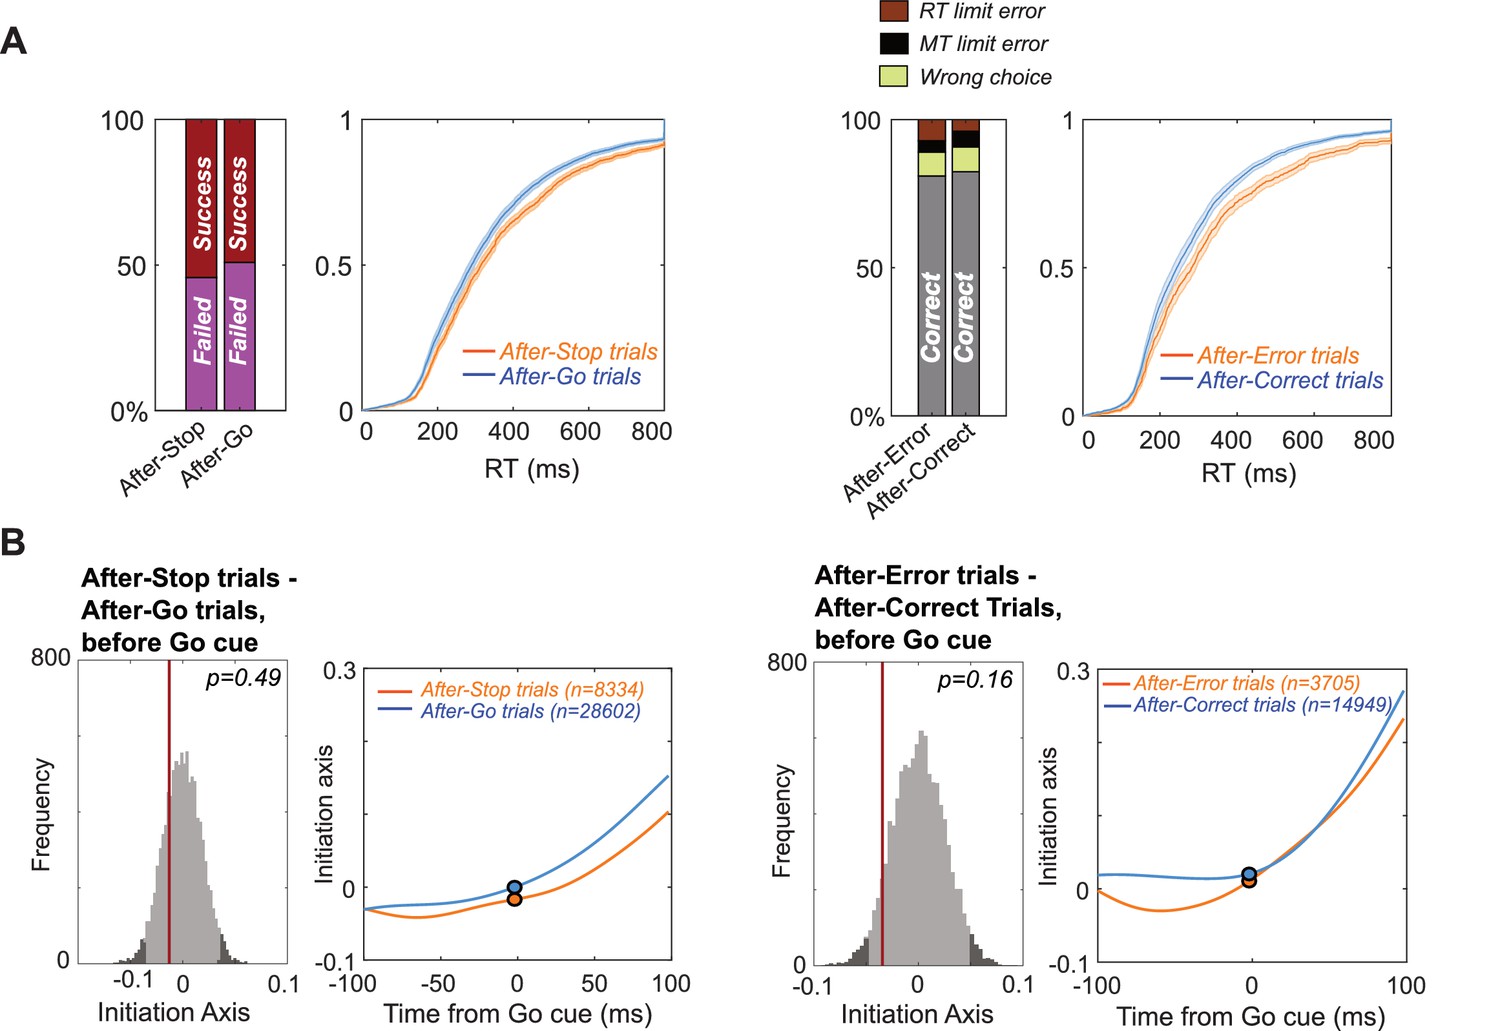
Trial-history dependence.
(A) (Left) On Maybe-Stop trials that followed Stop trials (‘After-Stop’), rats were more likely to succeed in stopping (Wilcoxon signed rank test, z = 2.67, p=0.008) and showed increased RT (Wilcoxon signed rank test, z = 4.46, p=8.02 × 10⁻⁶), compared to trials that followed Go trials. (Right) On No-Stop trials that followed error trials (‘After-Error’), rats were more likely to make RT limit errors (Wilcoxon signed rank test, z = 3.03, p=0.002) and showed increased RT (Wilcoxon signed rank test, z = 5.42, p=5.95 × 10⁻⁸). (B) Corresponding apparent shifts along the Initiation Axis did not reach significance (permutation tests, analysis epoch: −100–0 ms before Go cue).
Figure 5 with 2 supplements
Multiple dynamics underlying slower reaction times.
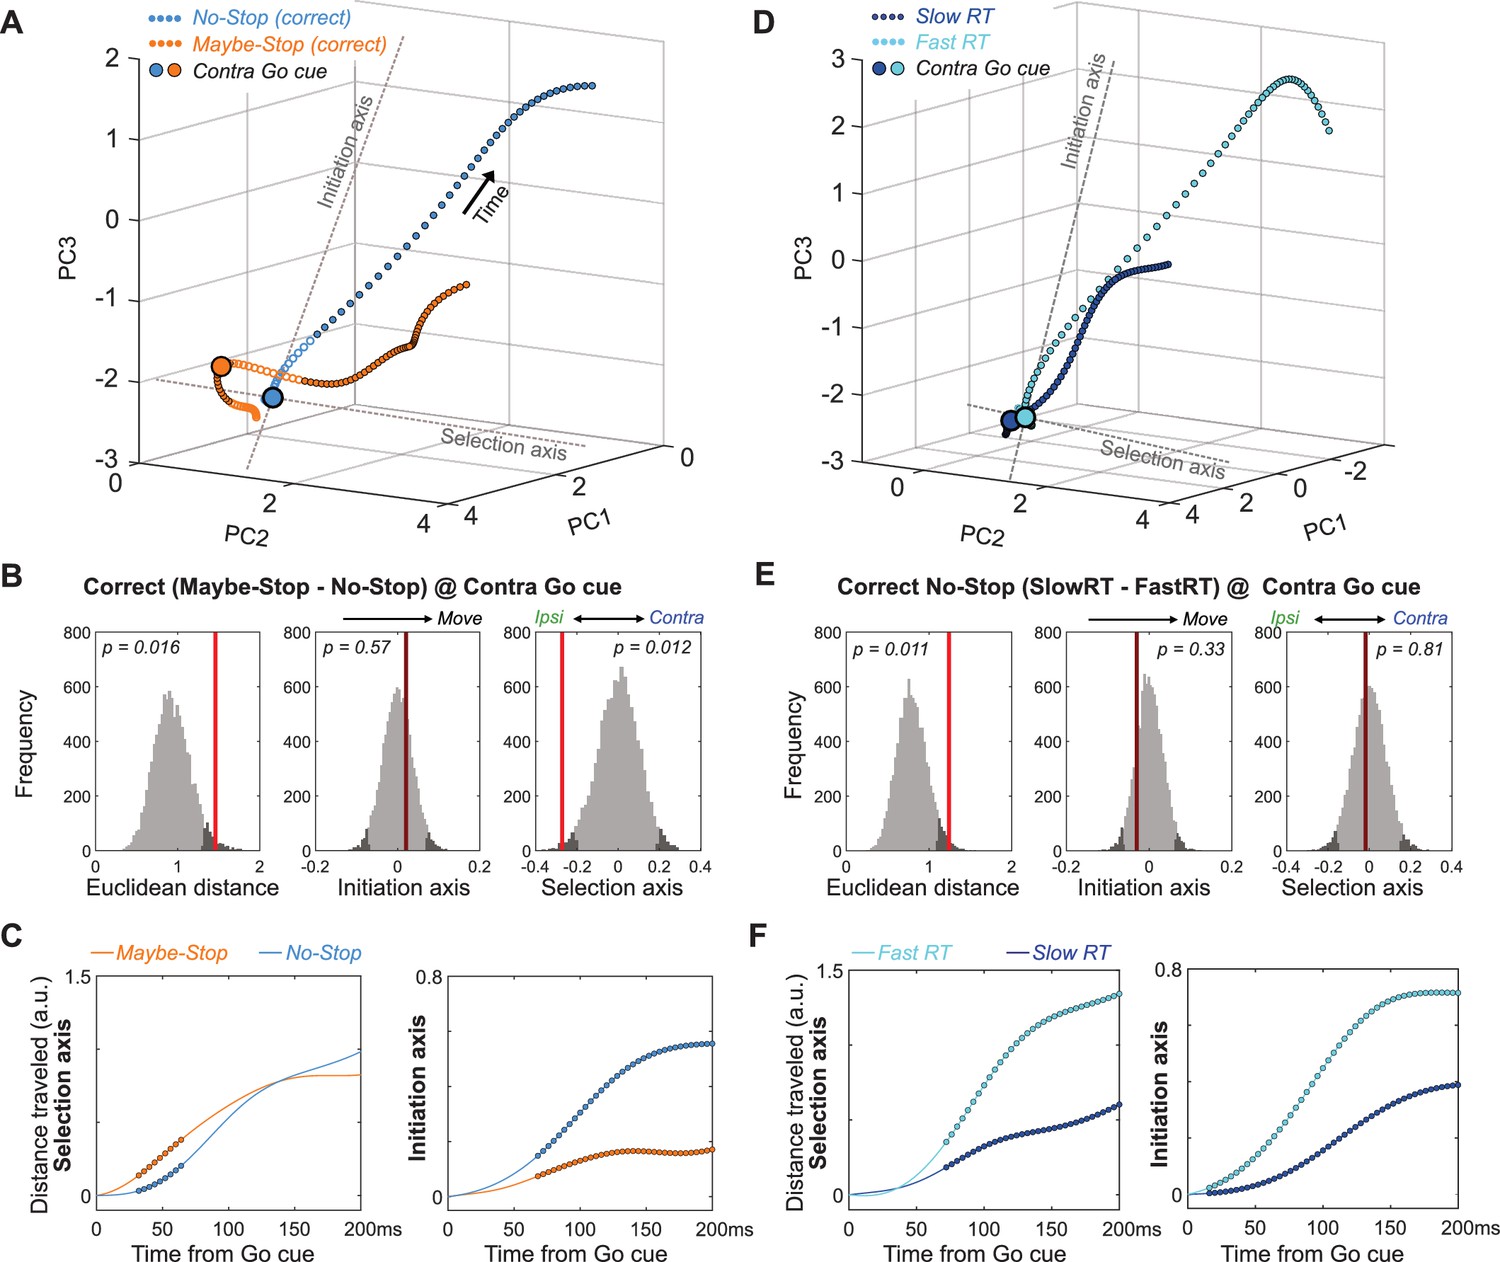
(A) Comparison of GP population state between correct Maybe-Stop (contra) and No-Stop (contra) trials (−100 to +250 ms around Go cue; same state-space and format as Figures 3 and 4). Time points of significant Euclidean separation between conditions are marked by filled circles. (B) Permutation tests (same format as Figures 3 and 4) comparing Maybe-Stop (contra) and No-Stop (contra) trials at the time of contra Go cue presentation. GP activity is significantly biased in the ipsi direction, when the contra-instructing cue might be followed by a Stop cue. (C) Examination of distance travelled after Go cue confirms that in the Maybe-Stop condition the trajectory first moves primarily along the Selection Axis (left), before making substantial progress along the Initiation Axis (right). (D–F) Same as A-C, but comparing correct contra No-Stop trials with faster or slower RTs (median split of RTs). Unlike Maybe-Stop trials, spontaneously slow RT trials do not show a starting bias (on either Initiation or Selection axes) and do not move on the Selection Axis before moving on the Initiation Axis.
Figure 5—figure supplement 1
Comparison of RT-matched Maybe-Stop and No-Stop trajectories.
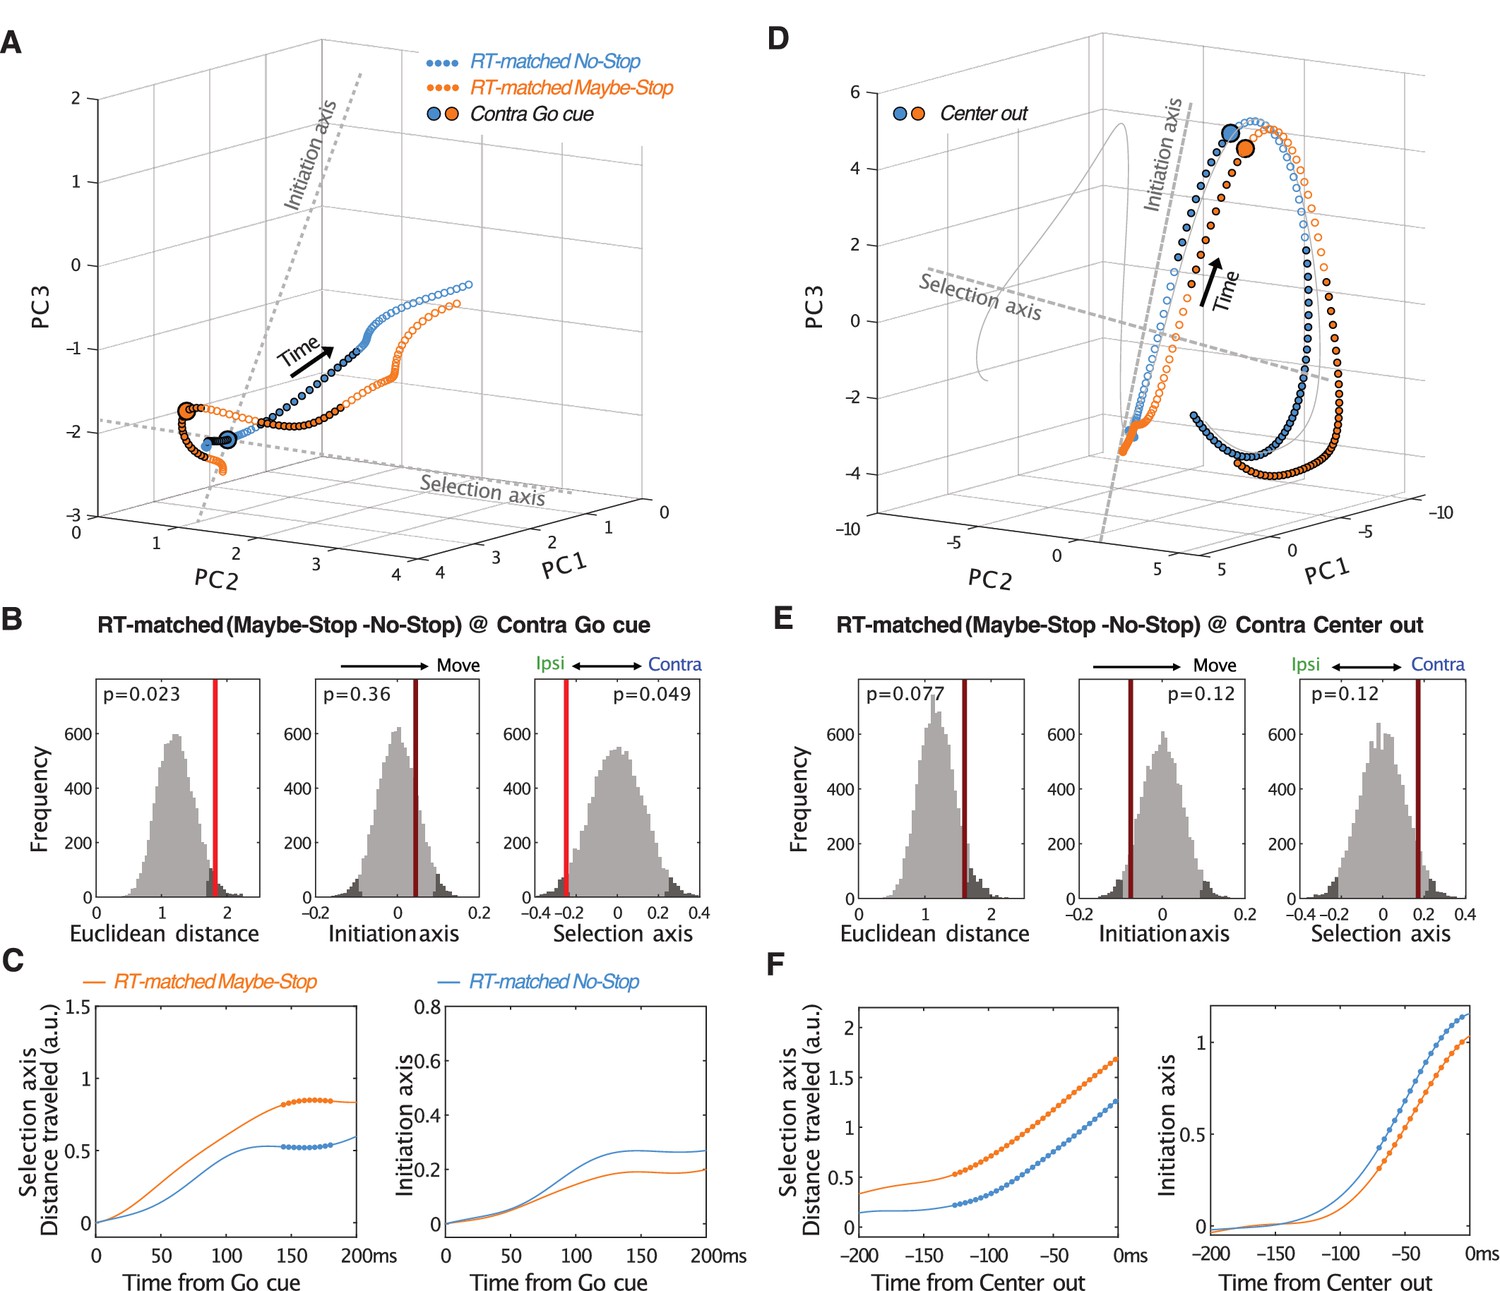
(A-C) Same as Figure 5A–C but using RT-matched subsets of trials. For RT matching, each RT from the Maybe-Stop condition was paired with the closest RT from the No-Stop condition; if no pair could be found within 250 ms, the trial was not used. After RT matching the mean Maybe-Stop RT was 371 ms (median 370 ms) and the median No-Stop RT was 369 ms (median 360 ms). (D–F) Same as A-C but aligned on movement onset (Center out).
Figure 5—figure supplement 2
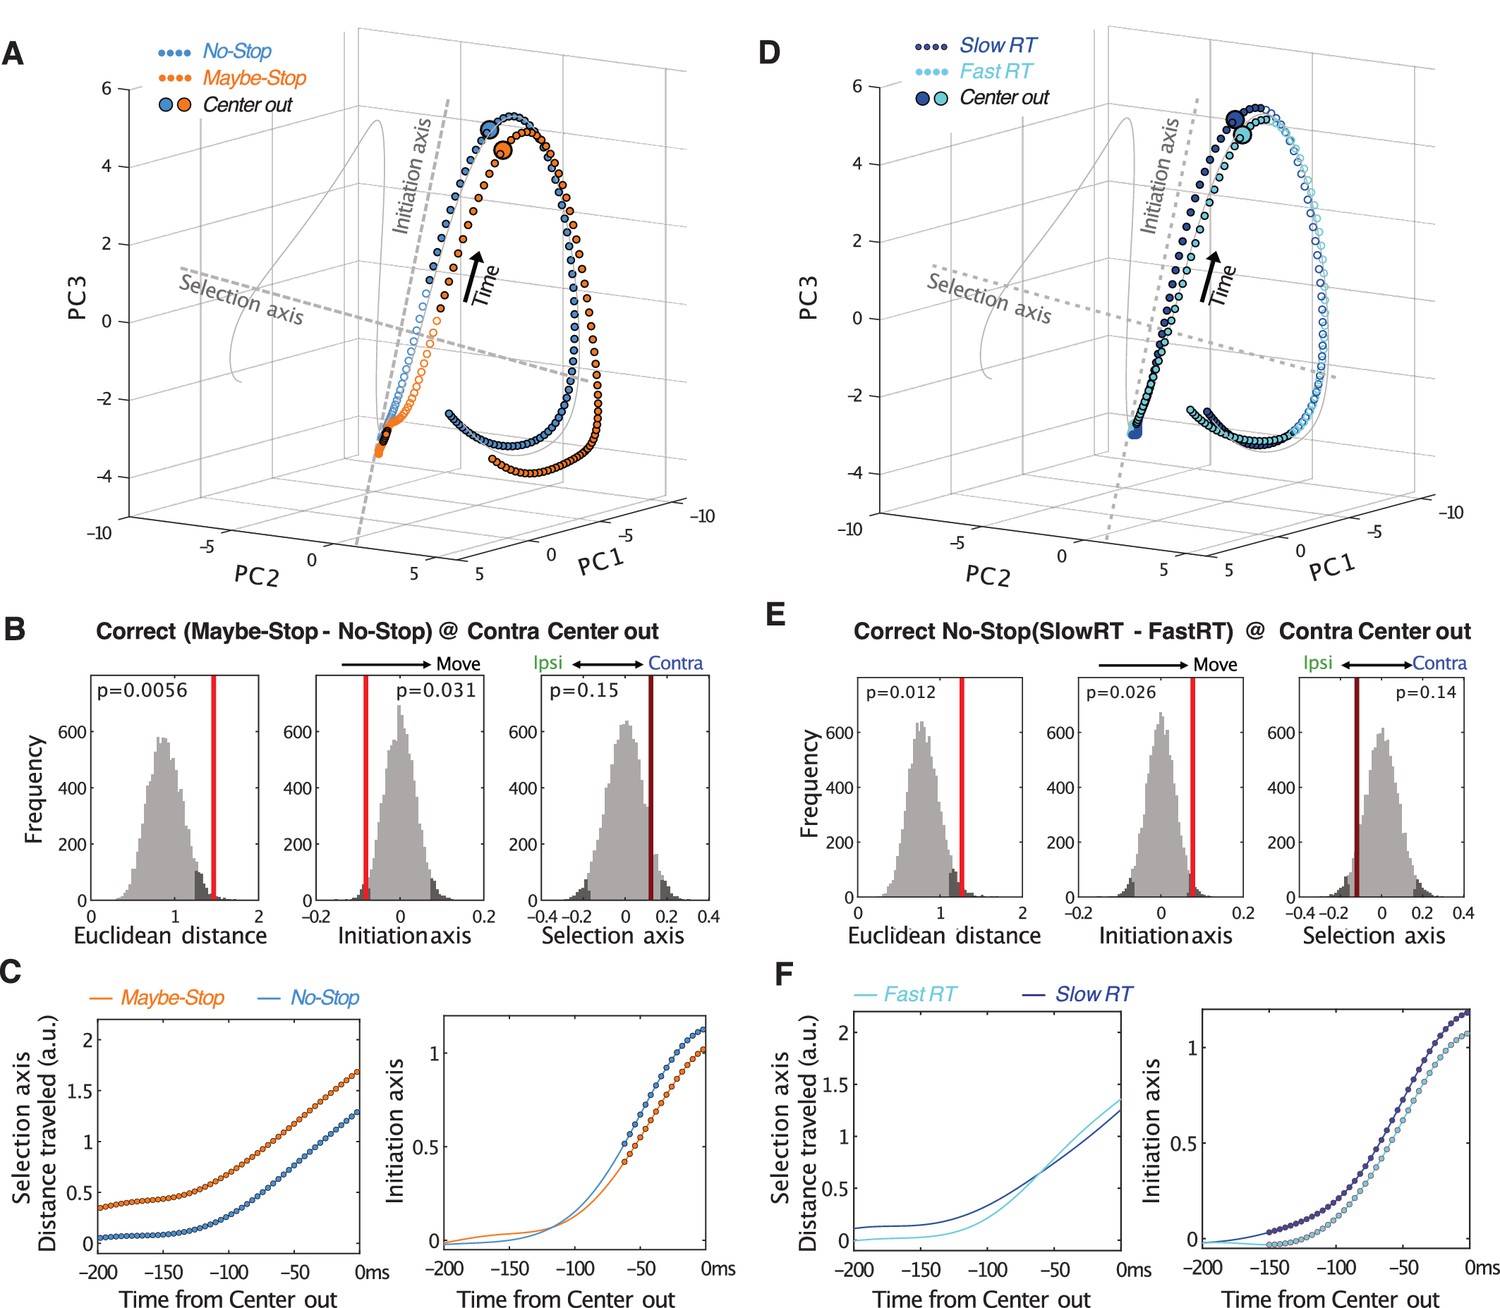
Comparison of Proactive and spontaneously Slow RT trajectories at movement onset.
All panels are as Figure 5, but aligned on movement onset (Center out).
Figure 6
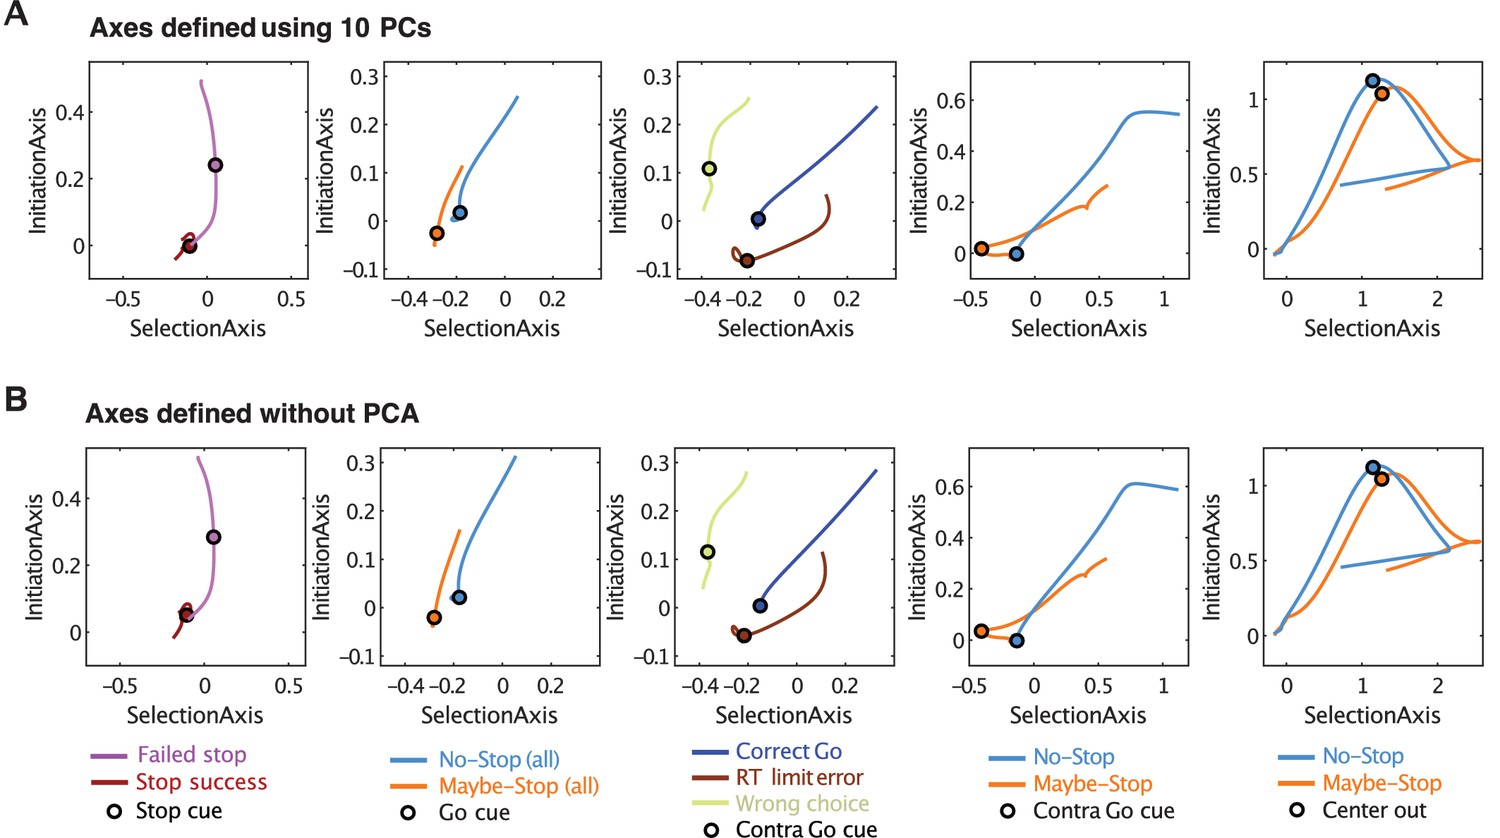
Defining Initiation, Selection Axes with or without prior dimension reduction.
Videos
Video 1
Using movement-related trajectories through state-space to define Initiation, Selection Axes.
Video 2
State-space location at the Go cue varies with distinct types of errors.
Video 3
Comparing neural trajectories for correct, contra Maybe-Stop versus No-Stop trials.
Additional files
Download links
A two-part list of links to download the article, or parts of the article, in various formats.
Downloads (link to download the article as PDF)
Open citations (links to open the citations from this article in various online reference manager services)
Cite this article (links to download the citations from this article in formats compatible with various reference manager tools)
Globus pallidus dynamics reveal covert strategies for behavioral inhibition
eLife 9:e57215.
https://doi.org/10.7554/eLife.57215


