Large-scale phenotypic drug screen identifies neuroprotectants in zebrafish and mouse models of retinitis pigmentosa
- Department of Ophthalmology, Wilmer Eye Institute, Johns Hopkins University, United States
- The Center for Nanomedicine, Wilmer Eye Institute, Johns Hopkins University, United States
- Department of Biostatistics, Johns Hopkins University, United States
- School of Chemistry, Xuzhou College of Industrial Technology, China
- College of Light Industry and Food Engineering, Nanjing Forestry University, China
- Department of Genetic Medicine, Johns Hopkins University, United States
- School of Biological Sciences, Victoria University of Wellington, New Zealand
- Department of Ophthalmology, Medical University of South Carolina, United States
- Department of Neurology, Johns Hopkins University, United States
- Institute for Cell Engineering, Johns Hopkins University, United States
- Department of Pharmacology and Molecular Sciences, Johns Hopkins University, United States
- Solomon H. Snyder Department of Neuroscience, Johns Hopkins University, United States
- Faculty of Health Sciences, University of Macau, Taipa, China
- Department of Oncology, Johns Hopkins University, United States
- Department of Molecular Biology and Genetics, Johns Hopkins University, United States
Figures
Figure 1 with 1 supplement
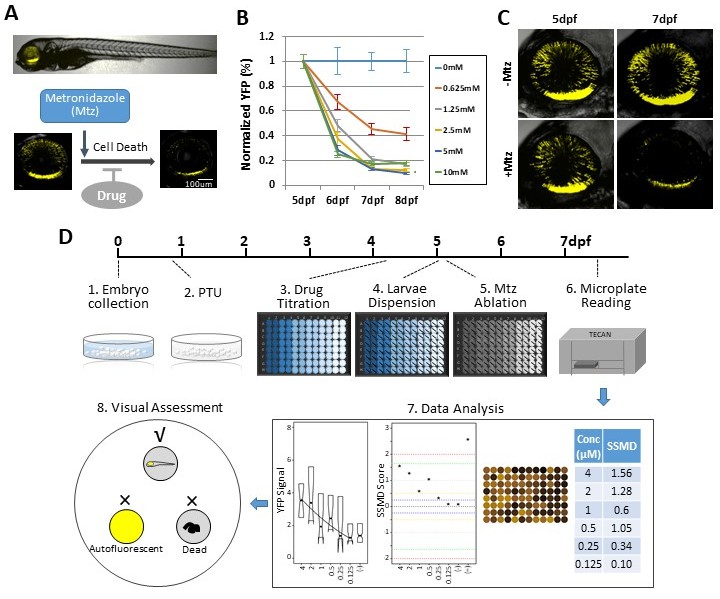
Zebrafish-inducible RP model and schematic of large-scale phenotypic screen.
(A–C) Prodrug (Metronidazole, Mtz) inducible ablation of rod photoreceptors in rho:YFP-NTR larvae. (A) In vivo confocal images of a rho:YFP-NTR larvae showing transgene expression specificity and whole retinas before and after Mtz-induced ablation of rod photoreceptors; schematic shows proposed neuroprotective effect of screened compounds. (B) Optimization of Mtz treatment regimen for large-scale screen: at five dpf, rho:YFP-NTR larvae were exposed to 10, 5, 2.5, 1.25, or 0.625 mM Mtz and YFP levels assessed daily by fluorescence microplate reader from 5 to 8 dpf (sample size: 56 larvae per group, two experimental repeats). The average YFP signal (±sem) for each Mtz treatment group is plotted as the percentage relative to non-ablated (0 mM Mtz) control signals per day. The 10, 5, and 2.5 mM Mtz-treated groups produced minimal YFP signal intensities (<20%) at 7 dpf (Supplementary file 1a; Figure 1B—source data 1). A 2.5 mM Mtz treatment over two days (5–7 dpf), the minimal Mtz concentration achieving maximal ablation, was therefore chosen for the large-scale primary screen. (C) Time series in vivo confocal images of representative non-ablated (-Mtz control, upper panel) and 2.5 mM Mtz-treated (+Mtz control, lower panel) retinas at 5 dpf (pre-Mtz) and 7 dpf (post-Mtz). By 7 dpf, only a limited number of YFP-positive cells are detectable in the +Mtz retina, mainly concentrated in a ventral band of high rod cell density. (D) Schematic of primary drug screening process: (1) At 0 dpf, large numbers of embryos were collected. (2) At 16 hpf, PTU was added to suppress melanization. (3) At 4 dpf, individual drugs were dispensed and titrated in 96-well plates using robotic liquid handlers; 16 wells per concentration (two columns) and six concentrations per drug. (4) At 5 dpf, the COPAS was used to dispense individual larvae into single wells of the drug titration 96-well plates. (5) After a 4 hr pre-exposure to drugs, larvae were treated with 2.5 mM Mtz to induce rod cell ablation. (6) At 7 dpf, YFP signals were quantified by fluorescence microplate reader assay. (7) Same day data analysis using a custom R code (https://github.com/mummlab/ARQiv2; Ding and Zhang, 2021) was used to plot signal to background ratios, SSMD plot, microplate heat map, and SSMD score table. (8) Drug plates producing SSMD scores of ≥1 were visually inspected using fluorescence stereomicroscopy to exclude autofluorescent and lethal compounds.
-
Figure 1—source data 1
Mtz titration test.
- https://cdn.elifesciences.org/articles/57245/elife-57245-fig1-data1-v4.xlsx
Figure 1—figure supplement 1
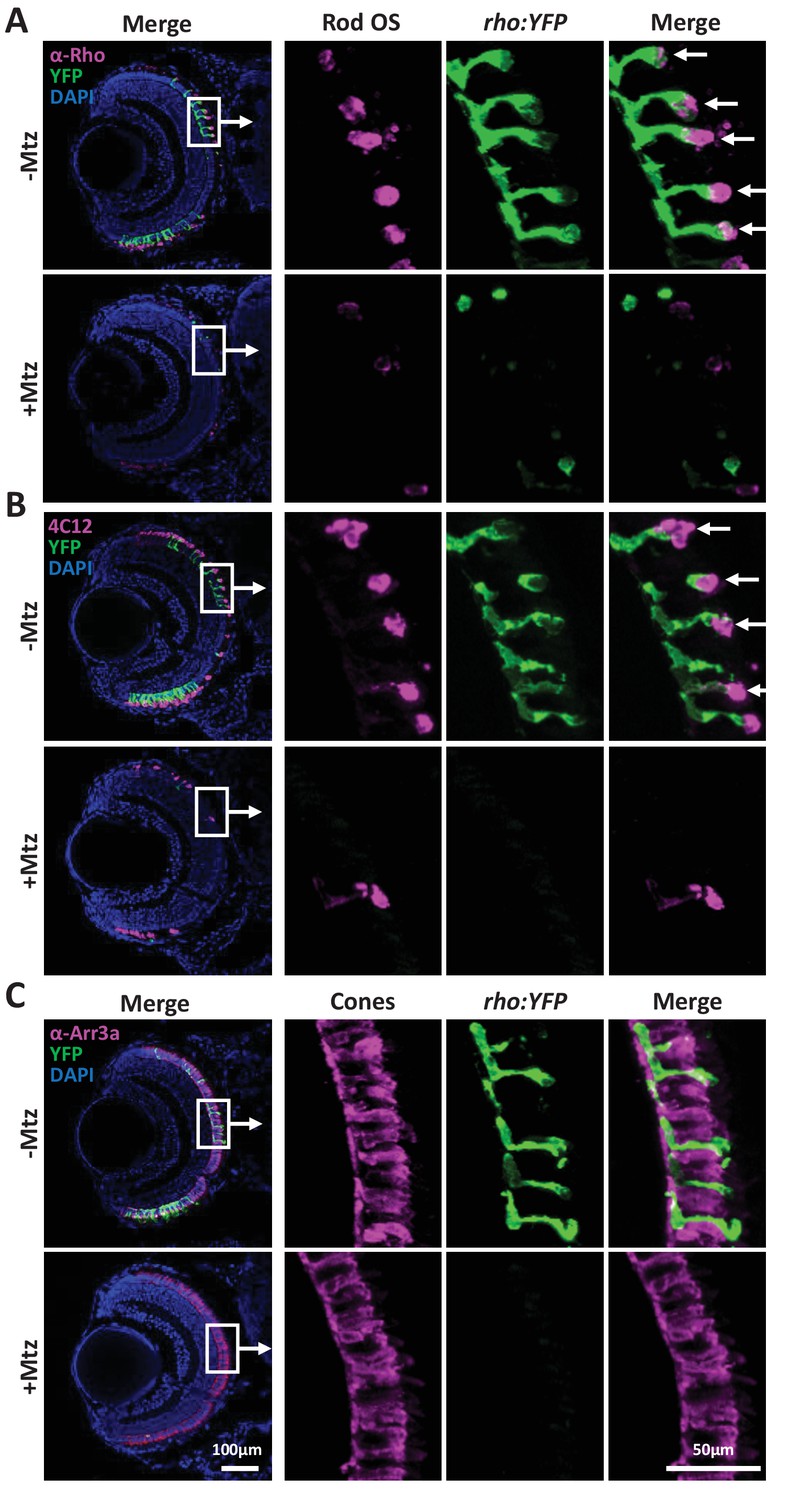
Immunohistological labeling of rod and cone photoreceptors in rho:YFP-NTR larvae.
(A–C) Immunohistological analysis of rod and cone photoreceptor markers in seven dpf rho:YFP-NTR larvae retinas treated ± 2.5 mM Mtz from 5 to 7 dpf. Representative whole retina and zoomed images of boxed regions are shown for two rod cells markers (A–B) and a cone cell marker (C) in non-ablated controls (-Mtz) and rod cell ablated retinas (+Mtz). (A) Anti-rhodopsin (α-Rho, 1d1 antibody) labeling of rod outer segments (Rod OS, magenta), YFP-expressing rods (rho:YFP-NTR, green) and/or nuclei (DAPI, blue). Arrows denote co-labeling with α-Rho and YFP. (B) Rod photoreceptor-specific antibody (4C12, uncharacterized antigen) labeling of rod outer segments (Rod OS, magenta), YFP-expressing rods (rho:YFP-NTR, green) and/or nuclei (DAPI, blue). Arrows denote co-labeling with α-Rho and YFP. (C) Anti-arrestin3a (α-Arr3a, zpr-1 antibody) labeling of cone cells (Cones, magenta), YFP-expressing rods (rho:YFP, green) and/or nuclei (DAPI, blue). Scale bars: 50 and 100 µm.
Figure 2 with 3 supplements
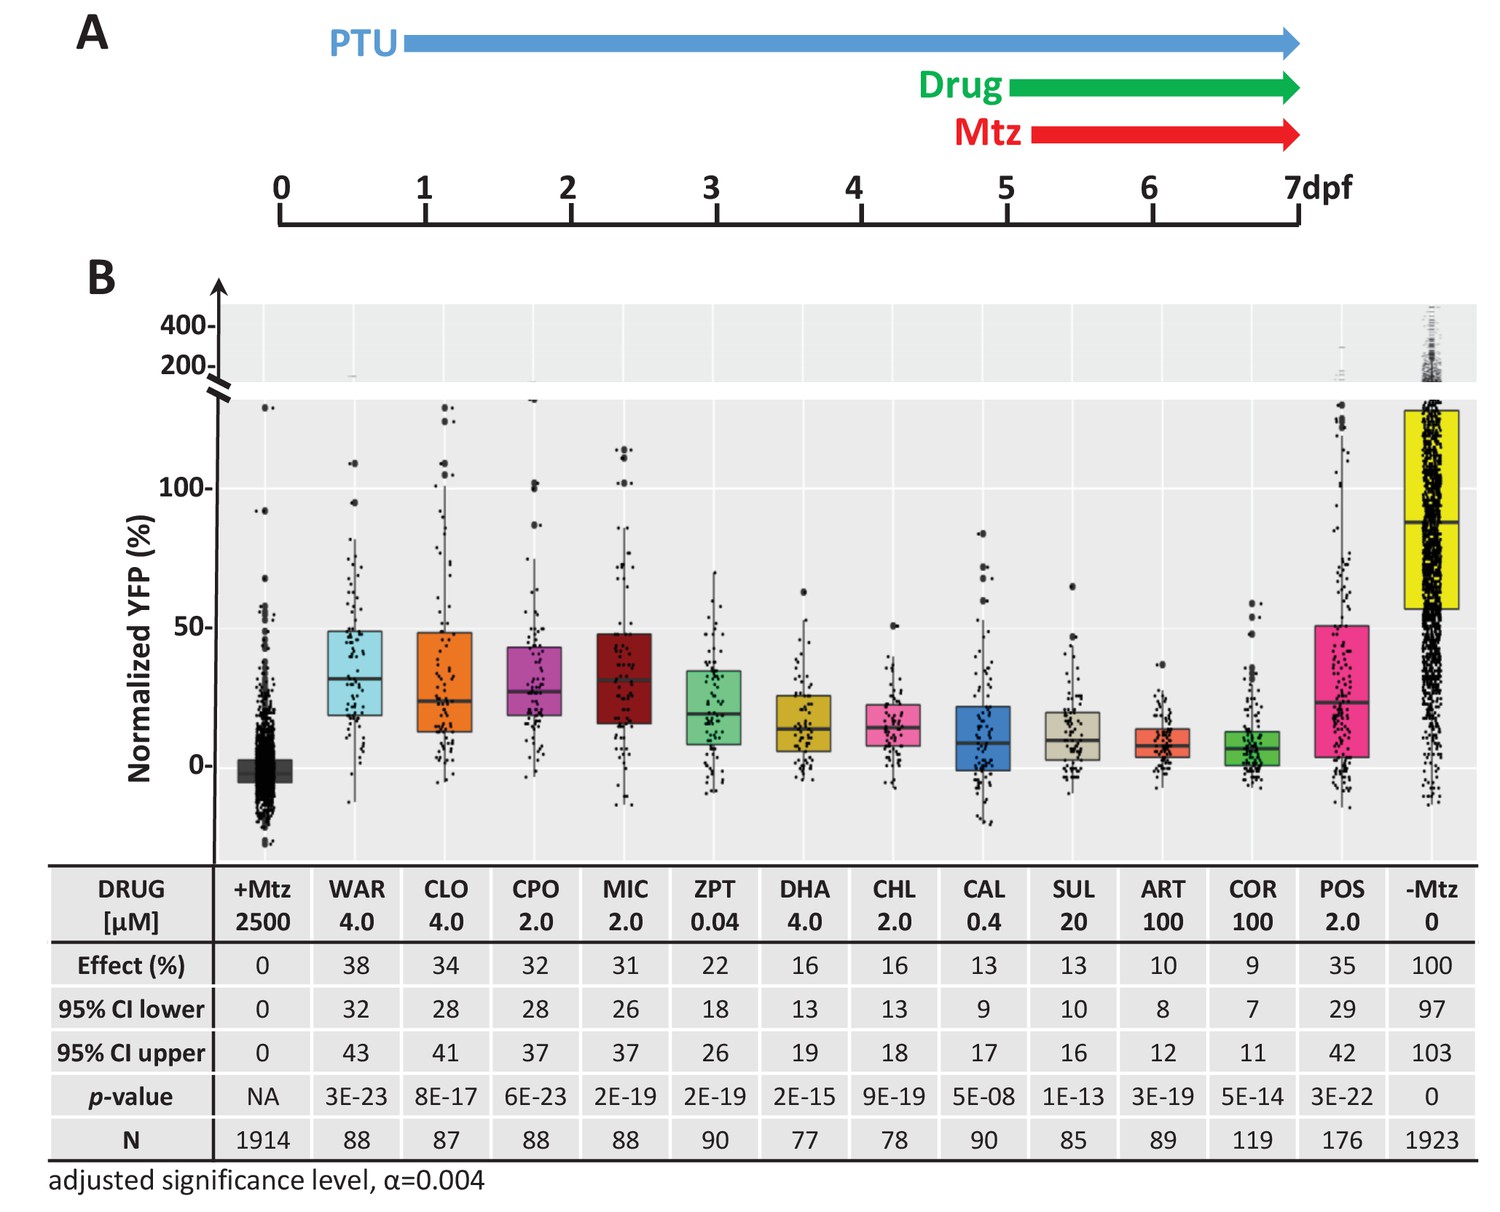
Confirmation of neuroprotective effects of lead compounds in rho:YFP-NTR zebrafish larvae.
(A) Diagram of confirmation assay protocol (see Figure 1D for further details). (B) Box plots of rod cell survival effects of eleven confirmed lead compounds (arrayed by level of neuroprotection) and the positive control compound (POS). YFP signal intensities were normalized to the signal window defined by setting ablated controls (+Mtz) at 0% and non-ablated controls (-Mtz) at 100% to account for: (1) individual variation in reporter expression between fish and, (2) fluctuations in signal window across assays, thus allowing data from identical conditions to be pooled across experimental repeats. Survival effects (normalized YFP %), 95% confidence intervals, p-values, and sample sizes (N) for each condition are shown in the table below. Student’s t-test was used to calculate p-values for each condition relative non-ablated controls (0 mM Mtz). Bonferroni correction for multiple comparisons resulted in an adjusted significance level of 0.004 (α=0.004). A minimum of three experimental replicates was performed for each condition (Figure 2—source data 1). No statistical differences in larval survival were observed for lead compounds relative to their respective +Mtz controls, except for DHA (86%) and CHL (87%; Fisher’s exact test, p<0.05). Common names, IUPAC names, abbreviations, PubChem CID, and chemical structures of lead compounds are listed in Table 1. Lead compound abbreviations: WAR, Warfarin; CLO, Cloxyquin; CPO, Ciclopirox olamine; MIC, Miconazole; ZPT, Zinc pyrithione; DHA, Dihydroartemisinin; CHL, Chloroxine; CAL, Calcimycin; SUL, Sulindac; ART, Artemisinin; COR, Cortexolone; POS, positive control. Other abbreviations: CI, confidence interval; Mtz, Metronidazole; PTU, N-phenylthiourea.
-
Figure 2—source data 1
Lead compound confirmation.
- https://cdn.elifesciences.org/articles/57245/elife-57245-fig2-data1-v4.xlsx
Figure 2—figure supplement 1
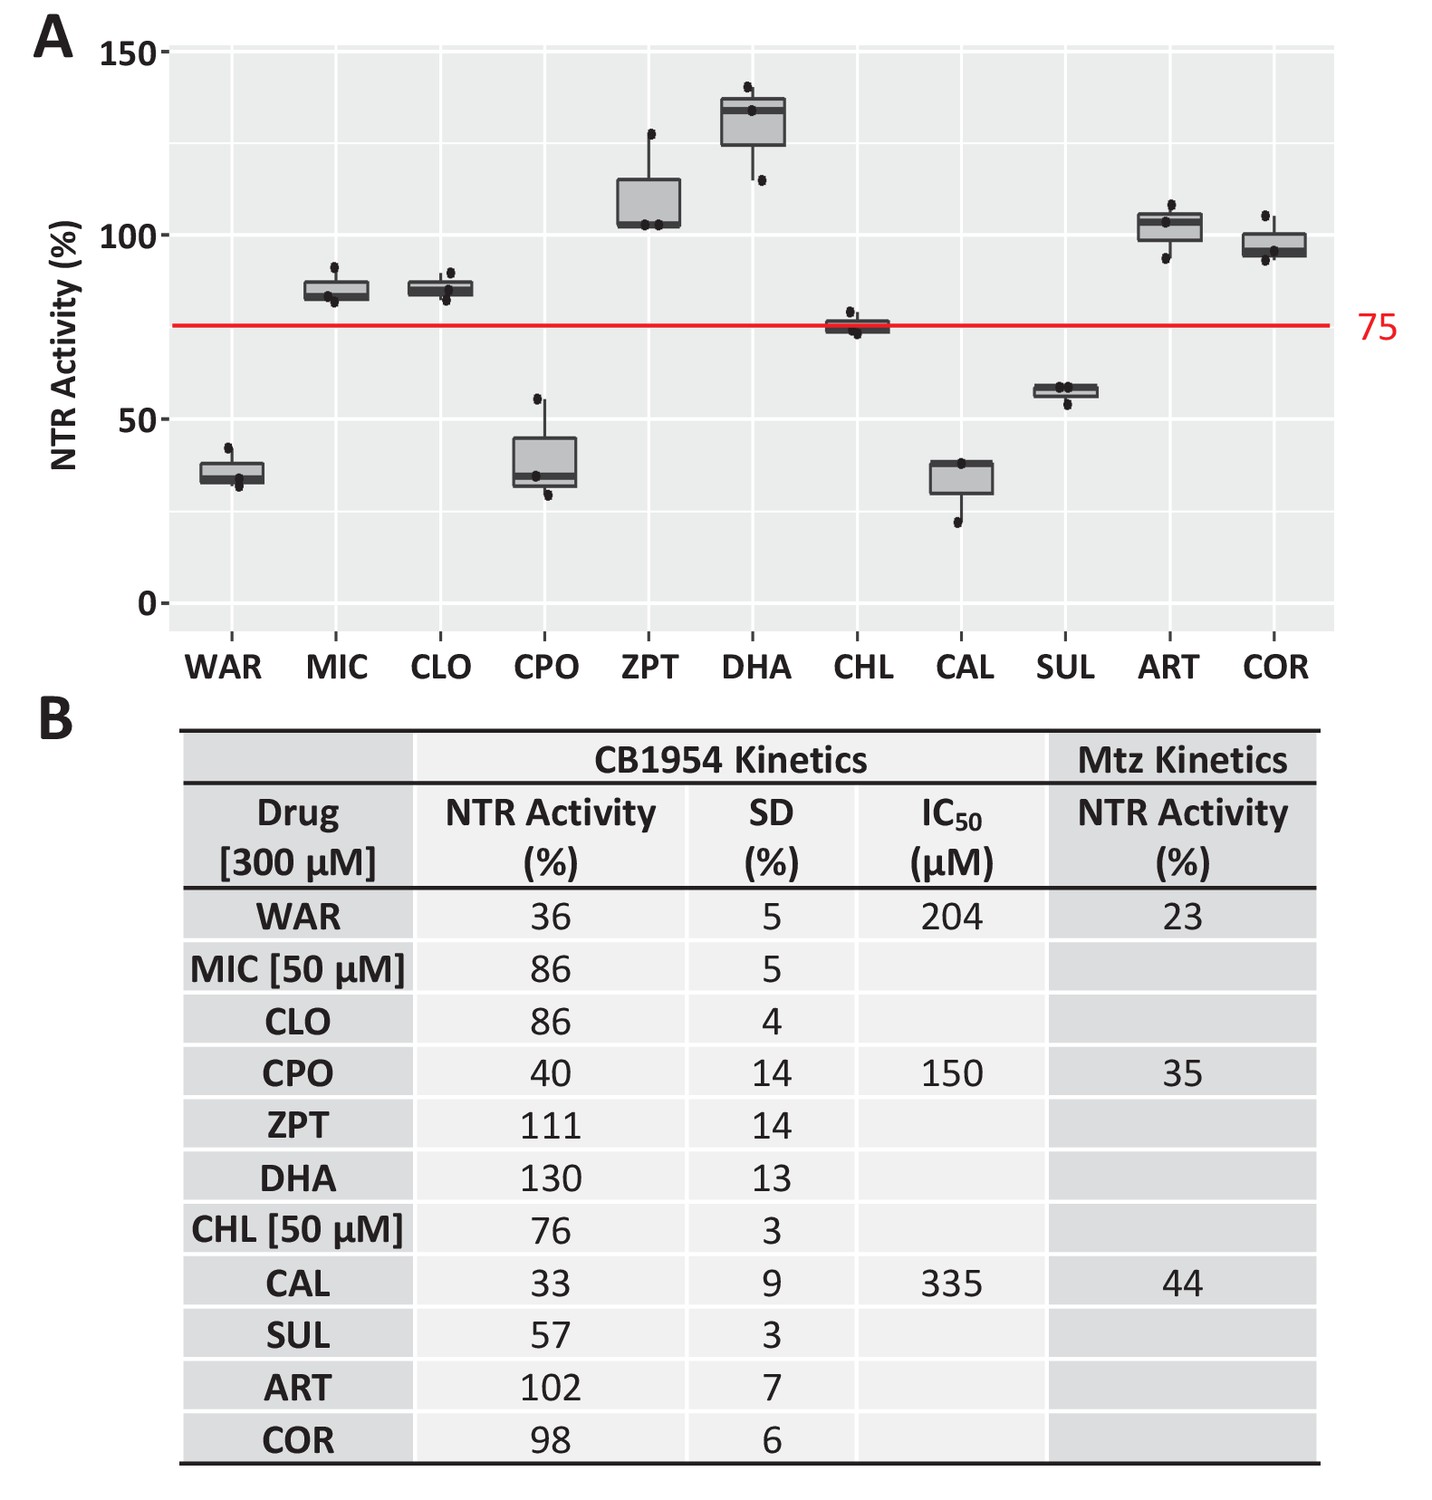
Test of lead compound effects on NTR enzymatic activity.
(A) Box plots of NTR inhibition activity (relative to NTR alone control, set at 100%) of lead compounds tested at 300 or 50 μM (see B) using an in vitro assay of CB1954 prodrug reduction kinetics. Compounds that resulted in ≤75% NTR activity (red line, WAR, CPO, CAL, and SUL) were considered potential NTR inhibitors. (B) Relative NTR activity levels and standard deviations (SD) for all leads, as well as IC50 values for CB1954 and Mtz reduction kinetics assays for three potential NTR inhibitors (WAR, CPO, and CAL). All kinetic assays were conducted in triplicate with a single purified batch of NfsB_Ec protein (Figure 2—figure supplement 1—source data 1). Lead compound abbreviations: WAR, Warfarin; MIC, Miconazole; CLO, Cloxyquin; CPO, Ciclopirox olamine; ZPT, Zinc pyrithione; DHA, Dihydroartemisinin; CHL, Chloroxine; CAL, Calcimycin; SUL, Sulindac; ART, Artemisinin; COR, Cortexolone.
-
Figure 2—figure supplement 1—source data 1
Compound effects on NTR activity.
- https://cdn.elifesciences.org/articles/57245/elife-57245-fig2-figsupp1-data1-v4.xlsx
Figure 2—figure supplement 2
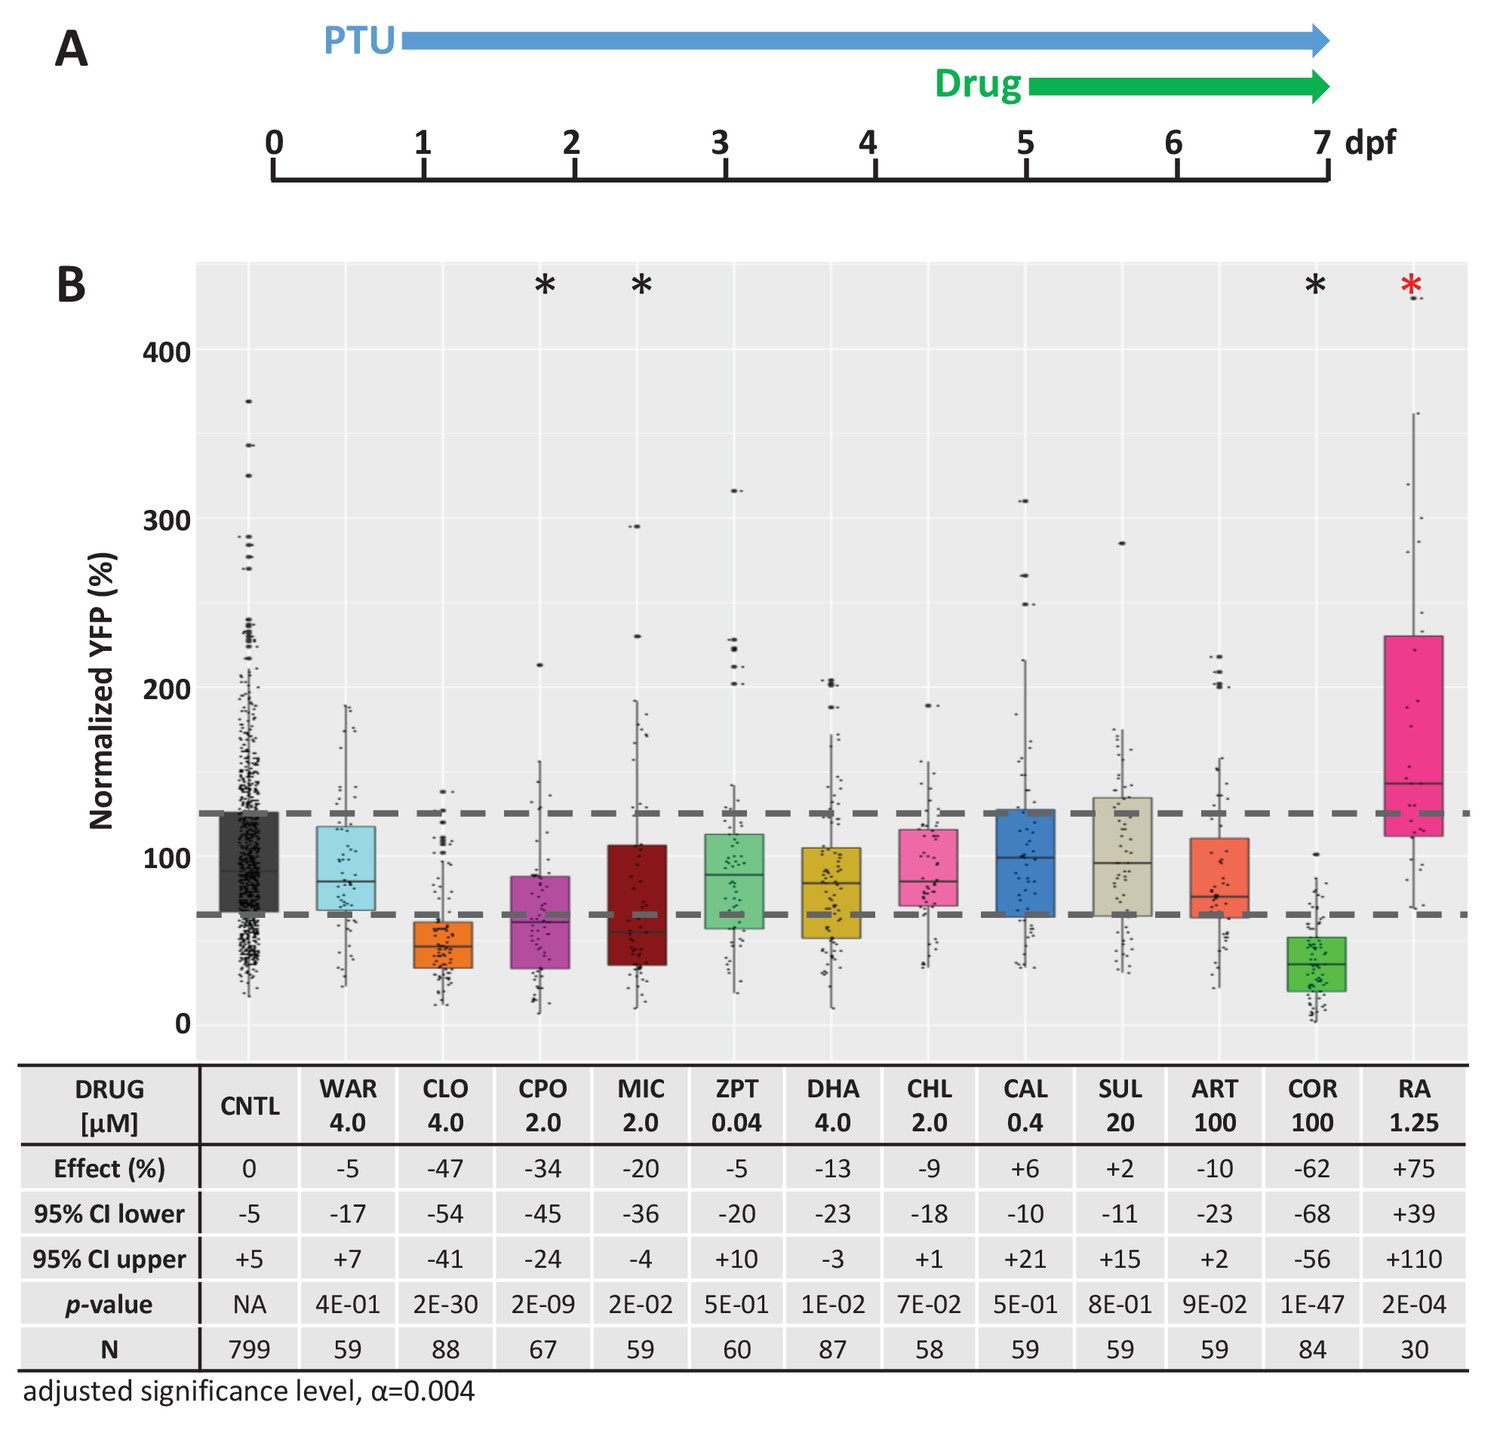
Test of lead compound effects on rod cell neogenesis during development.
(A) Diagram of rod cell neogenesis assay protocol. Transgenic rho:YFP-NTR larvae were treated with individual lead compounds from 5 to 7 dpf to test for effects on rod photoreceptor neogenesis; retinoic acid (RA) served as the positive control. YFP signals were quantified by microplate reader assay and normalized to DMSO-treated controls (CTL, set at 100%). (B) Box plots of lead compound and positive control (RA) effects on rod cell neogenesis. Effects on rod cell neogenesis (normalized % YFP), 95% confidence intervals, p values, and sample sizes (N) for each condition are shown in the table below. Student’s t test was used to calculate p values for each condition relative non-ablated controls. Bonferroni correction for multiple comparisons resulted in an adjusted alpha level of 0.004 (α=0.004 adjusted significance level). A minimum of three biological replicates was performed for each condition and data pooled across replicates (Figure 2—figure supplement 2—source data 1). No statistical differences in larval survival were observed for lead compounds relative to their respective +Mtz controls, except for CPO (74%; Fisher’s exact test, p<0.05). Lead compound abbreviations: WAR, Warfarin; CLO, Cloxyquin; CPO, Ciclopirox olamine; MIC, Miconazole; ZPT, Zinc pyrithione; DHA, Dihydroartemisinin; CHL, Chloroxine; CAL, Calcimycin; SUL, Sulindac; ART, Artemisinin; COR, Cortexolone. Other abbreviations: CI, confidence interval; Mtz, Metronidazole; PTU, N-phenylthiourea; RA, retinoic acid (positive control).
-
Figure 2—figure supplement 2—source data 1
Compound effects on rod cell neogenesis.
- https://cdn.elifesciences.org/articles/57245/elife-57245-fig2-figsupp2-data1-v4.xlsx
Figure 2—figure supplement 3
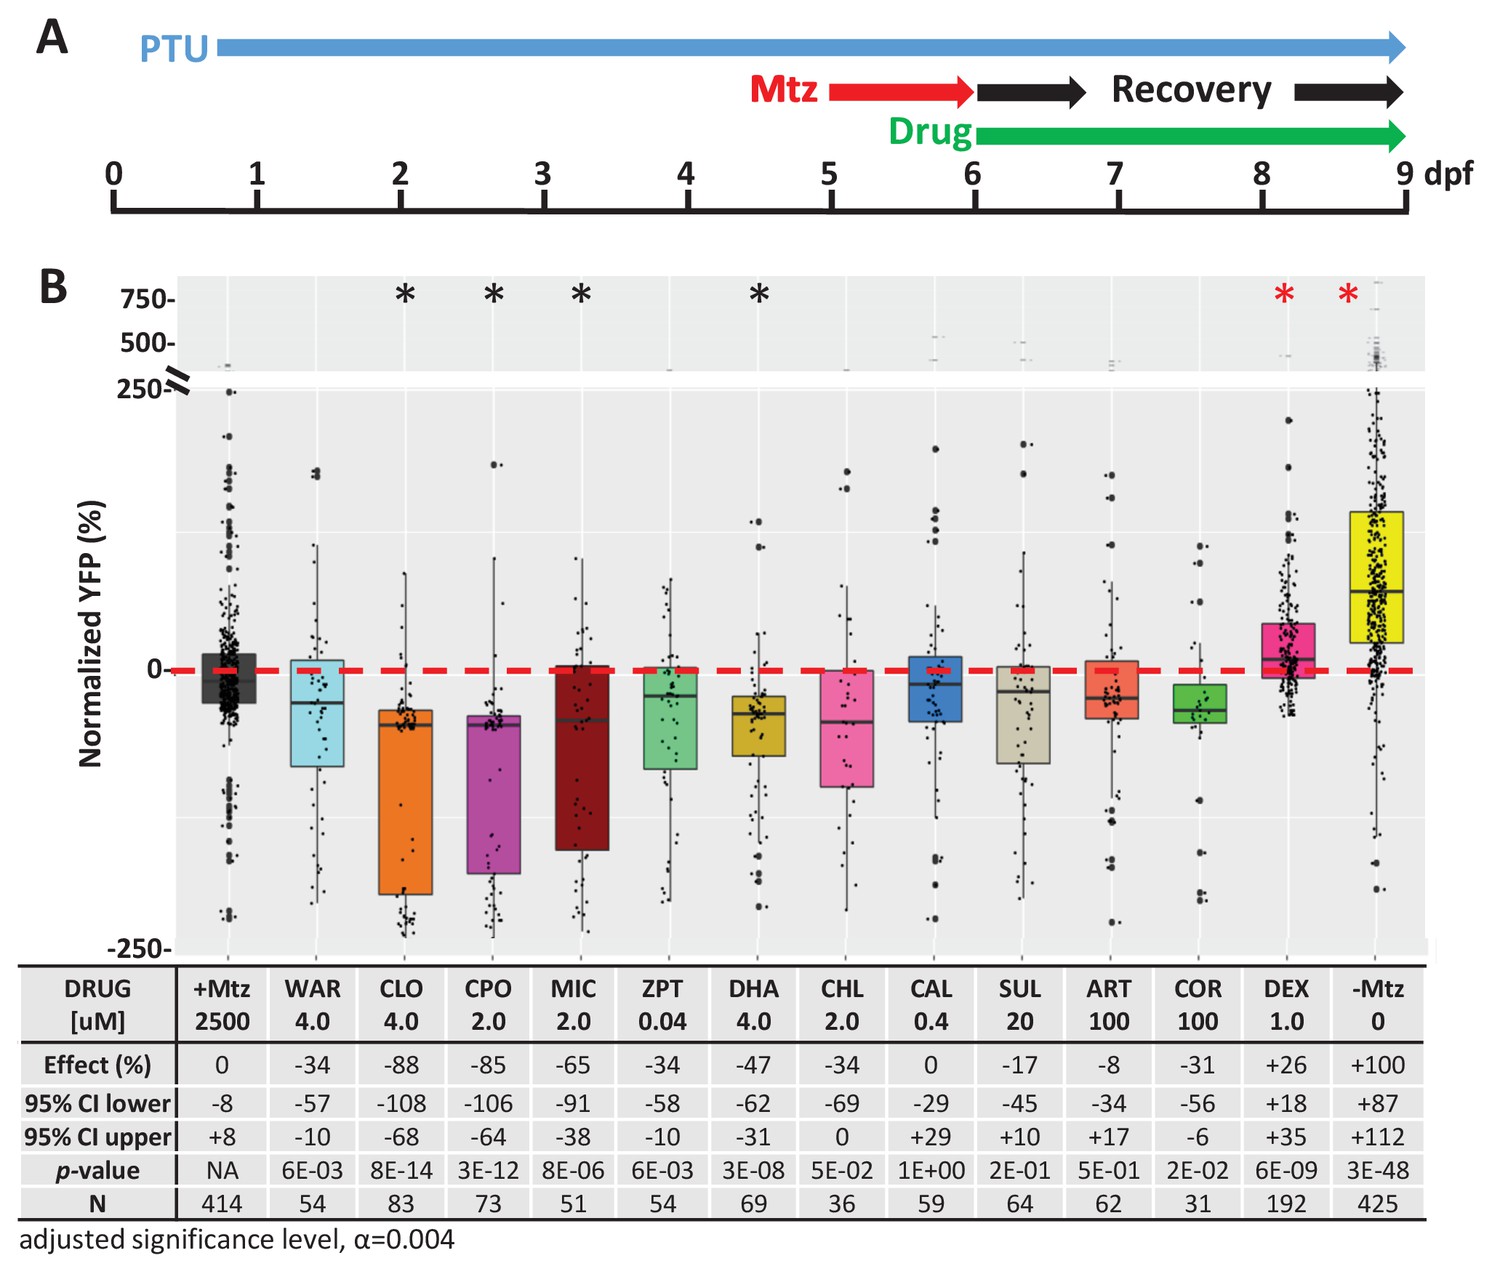
Test of lead compound effects on rod cell regeneration.
(A) Diagram of rod cell regeneration assay protocol. Transgenic rho:YFP-NTR were exposed to 10 mM Mtz from 5 to 6 dpf, then treated with individual lead compounds from 6 to 9 dpf. YFP signals were quantified by microplate reader assay and normalized to +Mtz controls (set at 0%). Data from at least two experimental repeats were pooled. (B) Box plots of lead compounds and positive control (DEX) effects on rod cell regeneration. Regenerative effects (normalized % YFP), 95% confidence intervals, p values, and sample sizes (N) for each condition are shown in the table below. Student’s t-test was used to calculate p values for each condition relative +Mtz ablated controls. Bonferroni correction for multiple comparisons resulted in an adjusted alpha level of 0.004 (α=0.004 adjusted significance level). A minimum of three biological replicates was performed for each condition (Figure 2—figure supplement 3—source data 1). No statistical differences in larval survival were observed for lead compounds relative to their respective +Mtz controls, except for CIC (76%), DHA (72%), CHL (56%) and COR (48%; Fisher’s exact test, p<0.05). Lead compound abbreviations: WAR, Warfarin; CLO, Cloxyquin; CPO, Ciclopirox olamine; MIC, Miconazole; ZPT, Zinc pyrithione; DHA, Dihydroartemisinin; CHL, Chloroxine; CAL, Calcimycin; SUL, Sulindac; ART, Artemisinin; COR, Cortexolone. Other abbreviations: CI, confidence interval; DEX, dexamethasone (positive control); Mtz, Metronidazole; PTU, N-phenylthiourea.
-
Figure 2—figure supplement 3—source data 1
Compound effects on rod cell regeneration.
- https://cdn.elifesciences.org/articles/57245/elife-57245-fig2-figsupp3-data1-v4.xlsx
Figure 3 with 2 supplements
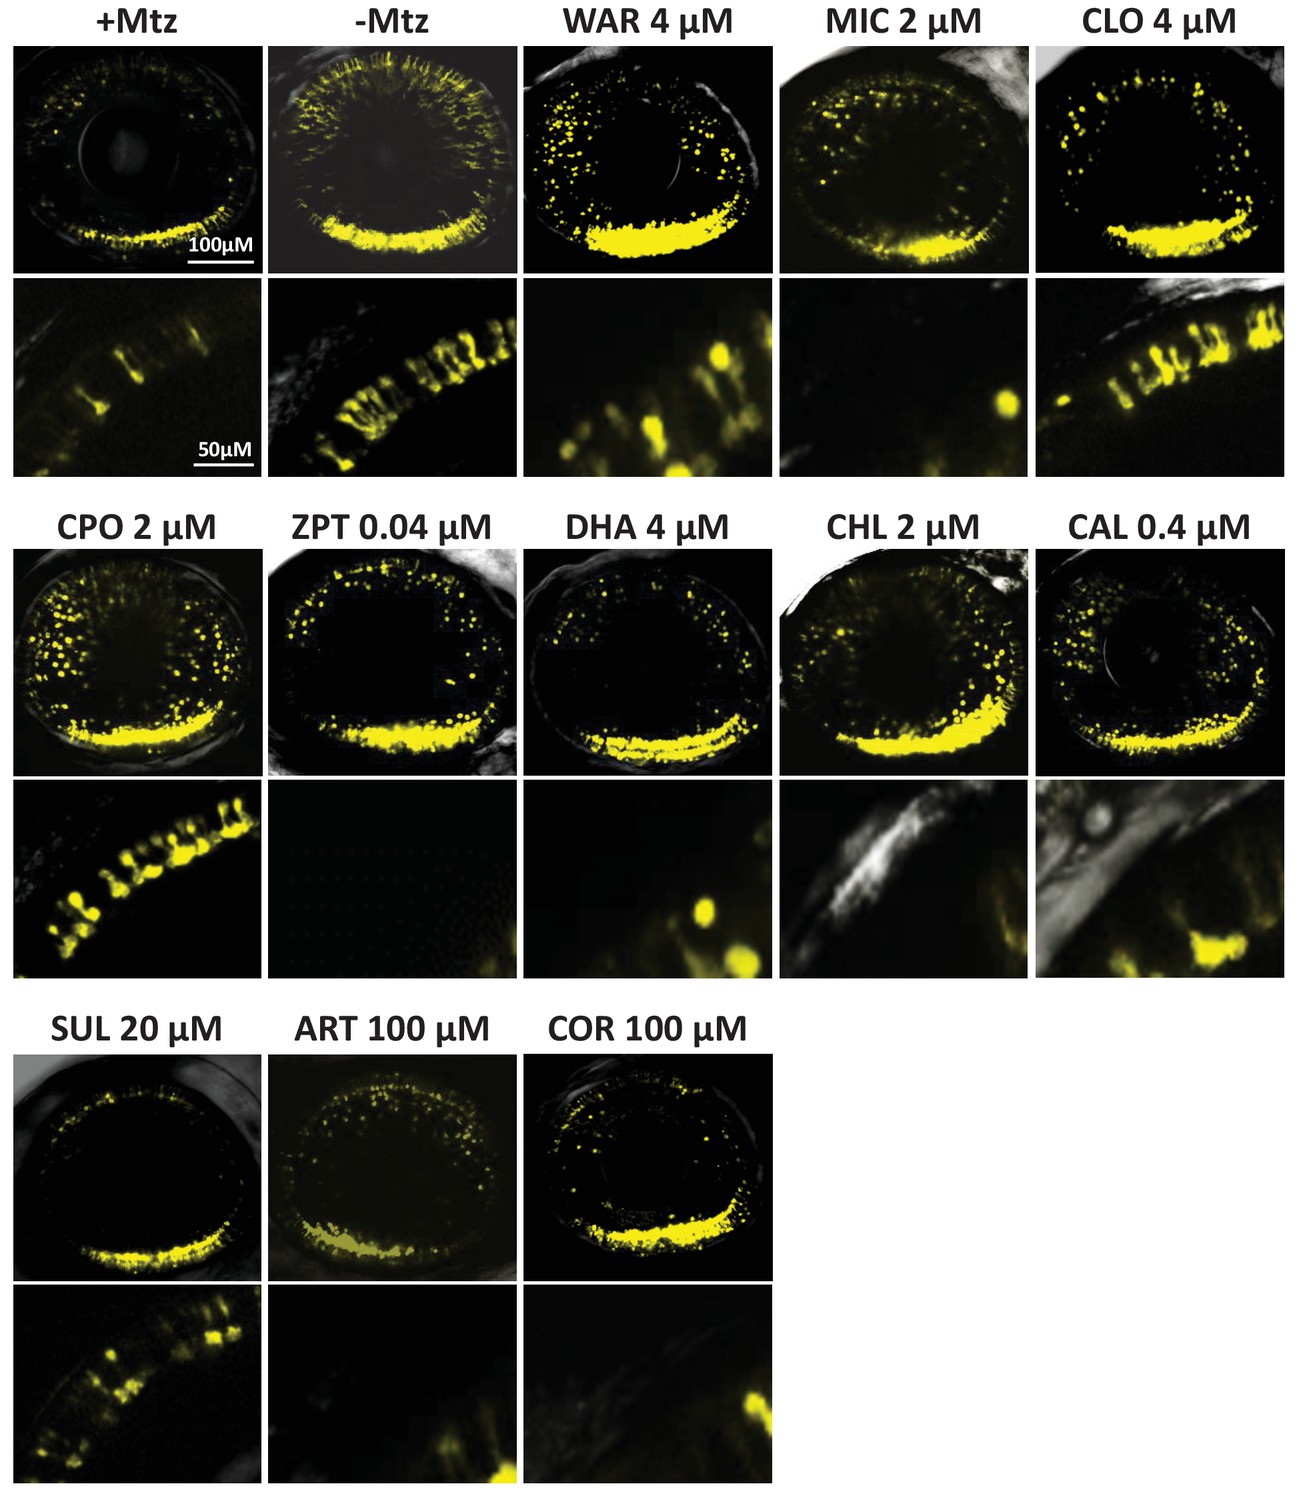
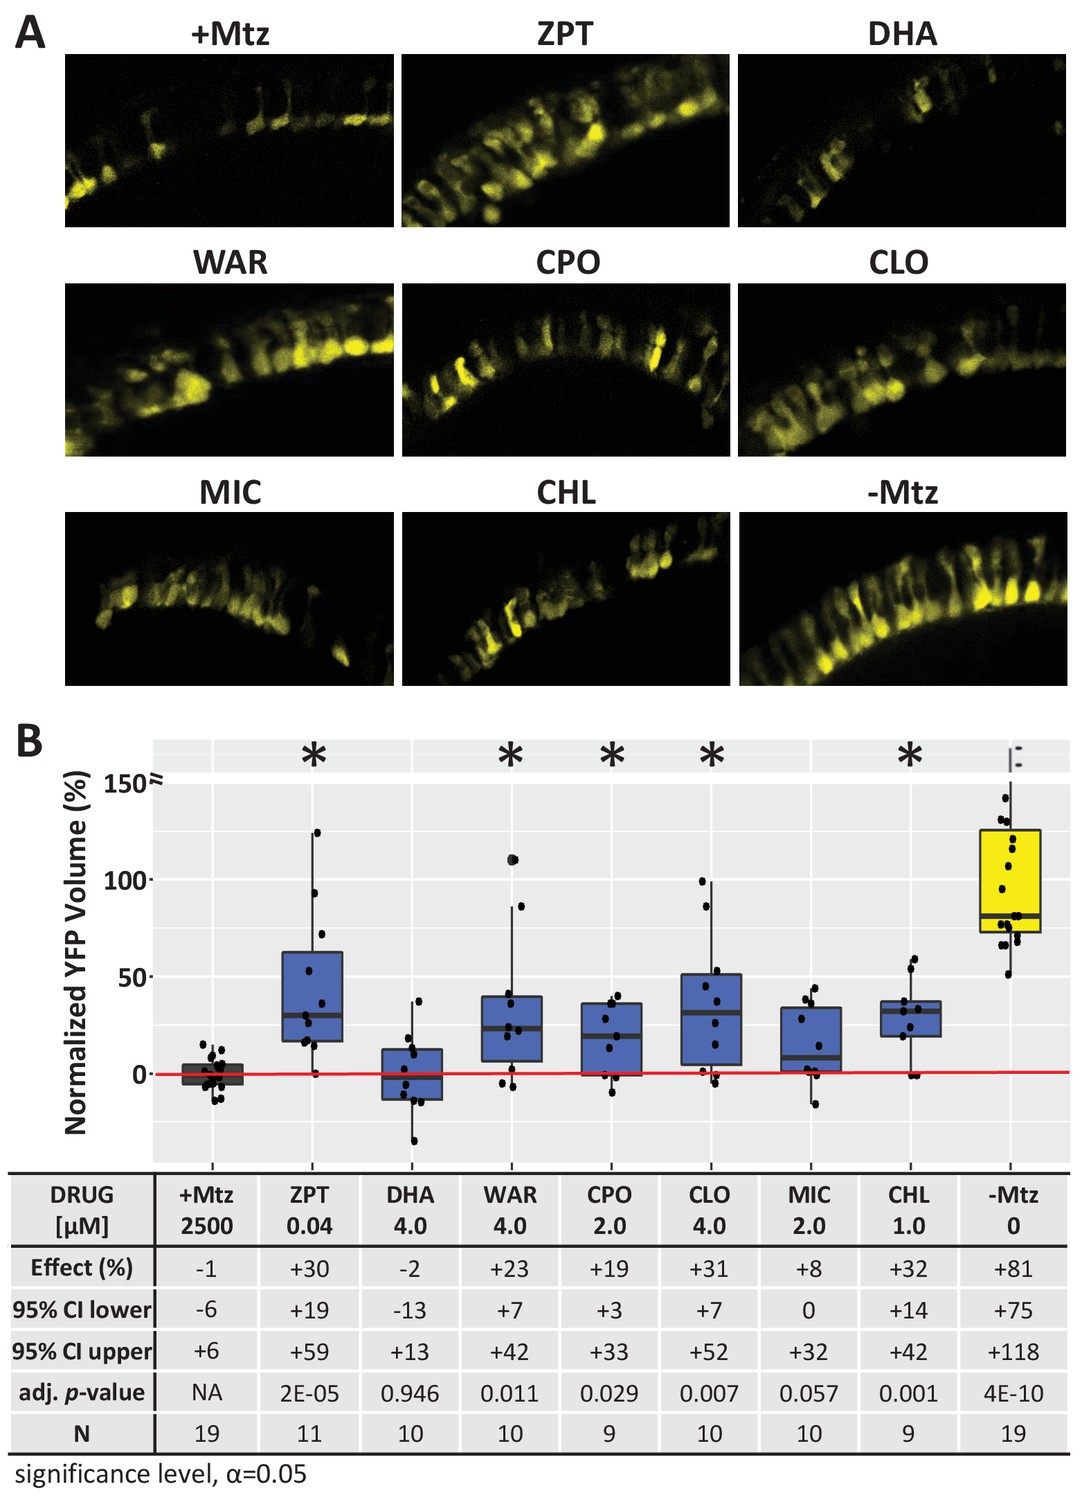
Confocal imaging of neuroprotective effects of confirmed lead drug compounds.
Representative 7 dpf in vivo confocal images of YFP-expressing rod cells in an ablated control (+Mtz), non-ablated control (-Mtz), and in Mtz-exposed retinas treated with lead compounds from 5 to 7 dpf. Whole retina 3D image stacks (~150 micron depth) show loss or preservation of YFP-expressing rod cells throughout the retina, zoomed images of a more limited stack in the dorsal-nasal quadrant (~12 micron depth) provide rod cell morphological detail. Lead compound abbreviations: WAR, Warfarin; CLO, Cloxyquin; CPO, Ciclopirox olamine; MIC, Miconazole; ZPT, Zinc pyrithione; DHA, Dihydroartemisinin; CHL, Chloroxine; CAL, Calcimycin; SUL, Sulindac; ART, Artemisinin; COR, Cortexolone; POS, positive control. Other abbreviations: CI, confidence interval; Mtz, Metronidazole; PTU, N-phenylthiourea.
Figure 3—figure supplement 1
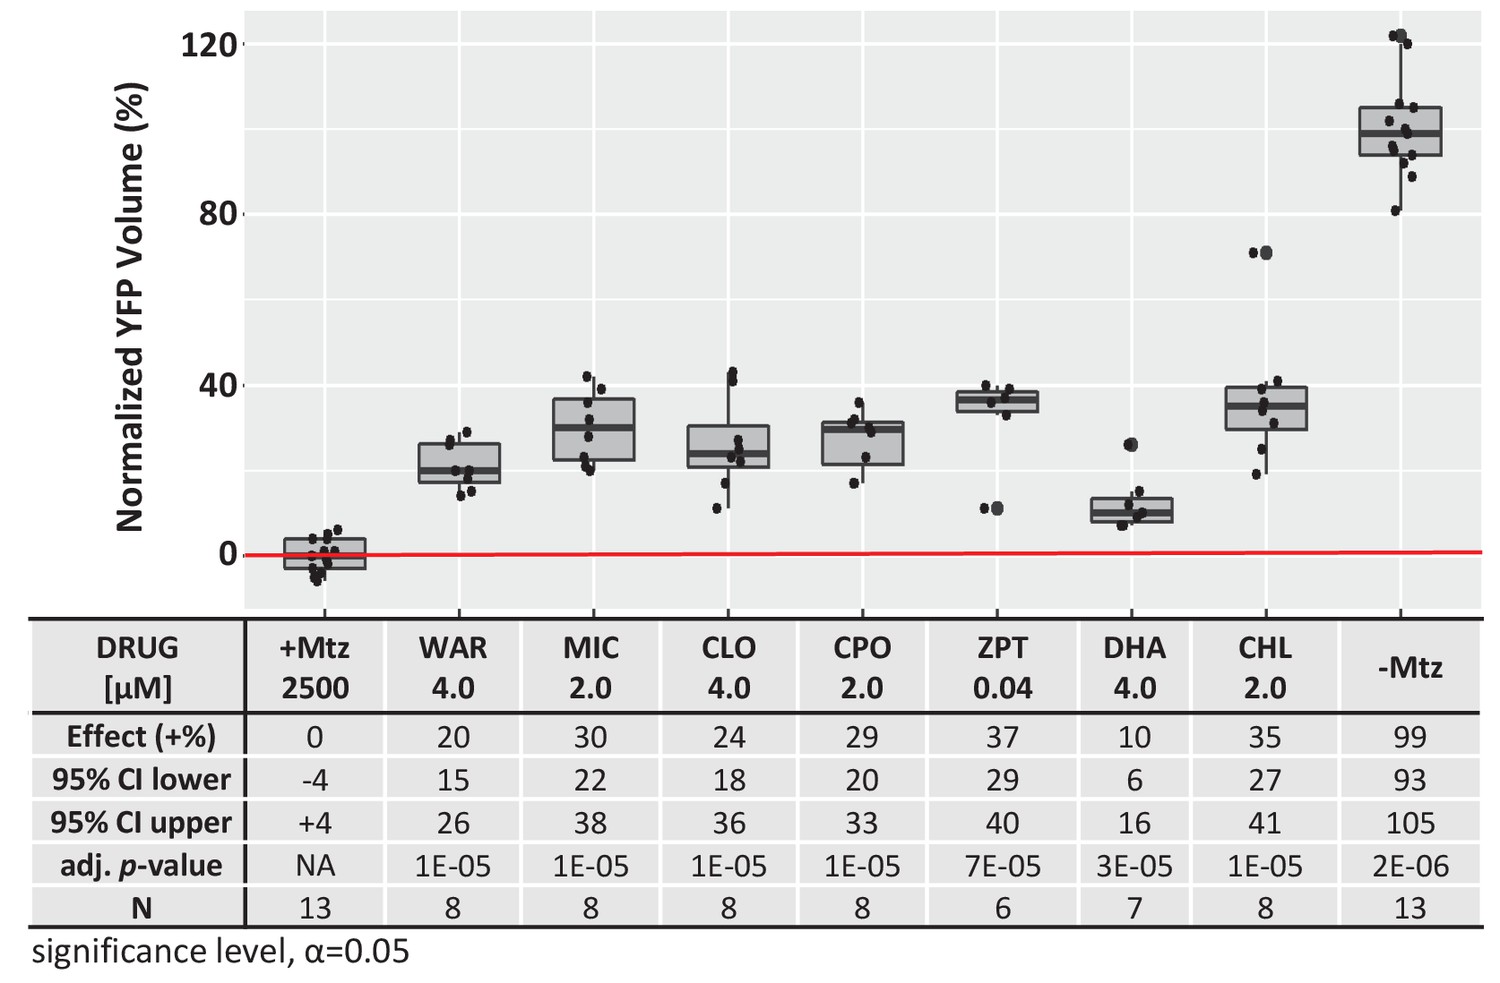
Quantification of YFP intensity in Figure 3 confocal images.
Box plots of lead compound effects on YFP volumes per image stack across conditions. All conditions resulted in a statistically significant increase in YFP volume relative to Mtz-ablated controls. Lead compound effects on YFP volume (normalized % relative to controls), 95% confidence intervals, adjusted p-values, and sample sizes (N) for each condition are shown in the table below (Figure 3―figure supplement 1—source data 1). Adjusted p values were calculated by performing Mann-Whitney U tests followed by false discovery rate (FDR) correction for multiple comparisons (significance level, α=0.05). Lead compound abbreviations: WAR, Warfarin; MIC, Miconazole; CLO, Cloxyquin; CPO, Ciclopirox olamine; ZPT, Zinc pyrithione; DHA, Dihydroartemisinin; CHL, Chloroxine; Other abbreviations: CI, confidence interval; Mtz, Metronidazole.
-
Figure 3—figure supplement 1—source data 1
YFP quantification - intensity.
- https://cdn.elifesciences.org/articles/57245/elife-57245-fig3-figsupp1-data1-v4.xlsx
Figure 3—figure supplement 2
Lead compound effects on outer segment morphology.
(A) Representative 7 dpf in vivo confocal images of YFP-expressing rod cells in an ablated control (+Mtz), non-ablated control (-Mtz), and in Mtz-exposed rho: YFP-NTR2.0 retinas treated with lead compounds from 5 to 7 dpf. Confocal image stacks from the dorsal-nasal quadrant (~12 micron depth) provide rod cell outer segment morphological detail. (B) Box plots of lead compound effects on rod cell volumes (total YFP volume divided by the number of cells per image stack) across conditions. Conditions resulting in a statistically significant increase in average rod cell volume relative to Mtz-ablated controls are marked with an asterisk. The table below shows average effects on YFP volume per cell (normalized % relative to controls), 95% confidence intervals, adjusted p-values, and sample sizes (N) for each condition (Figure 3―figure supplement 2—source data 1). Adjusted p values were calculated by performing Mann-Whitney U tests followed by false discovery rate (FDR) correction for multiple comparisons. Lead compound abbreviations: ZPT, Zinc pyrithione; DHA, Dihydroartemisinin; WAR, Warfarin; CPO, Ciclopirox olamine; CLO, Cloxyquin; MIC, Miconazole; CHL, Chloroxine; Other abbreviations: CI, confidence interval; Mtz, Metronidazole.
-
Figure 3—figure supplement 2—source data 1
YFP quantification - volume per cell.
- https://cdn.elifesciences.org/articles/57245/elife-57245-fig3-figsupp2-data1-v4.xlsx
Figure 4 with 2 supplements
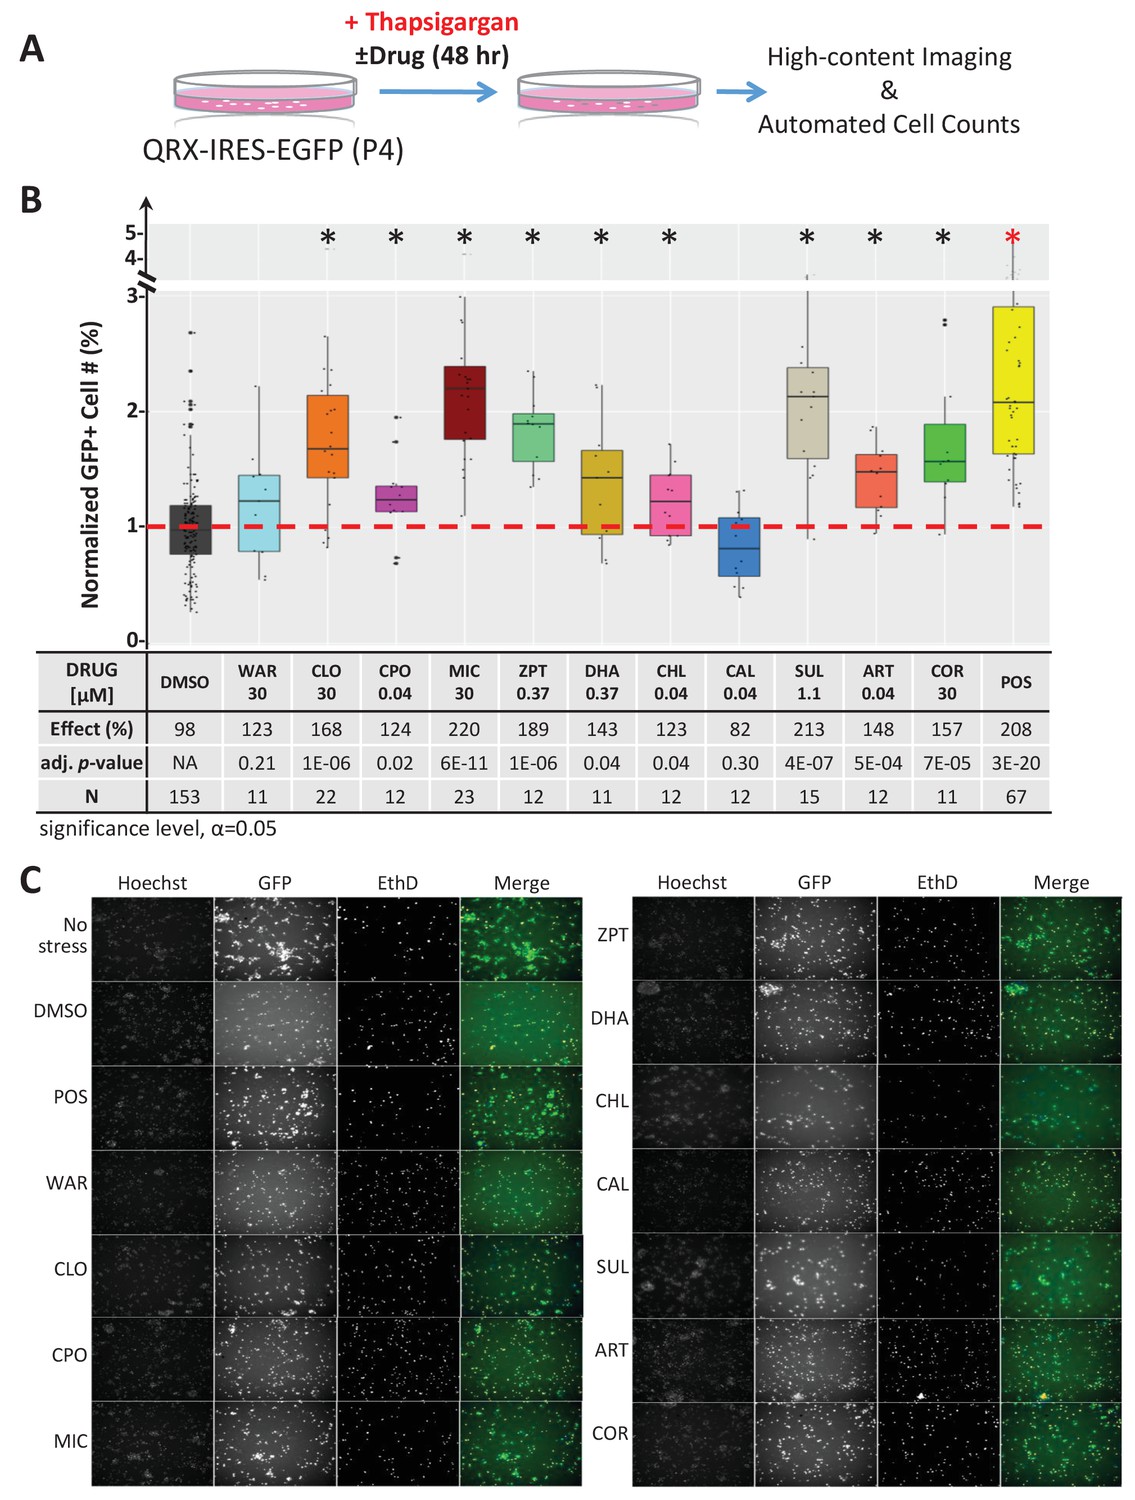
Lead effects pn mouse primary photoreceptor cells - thapsigargin-induced cell death.
(A) Primary photoreceptor survival assay protocol. (B) Box plots of photoreceptor survival effects of lead compounds and the positive control compound (POS). Statistically significant survival effects are marked with an asterisk. Survival effects, adjusted p-values, and sample sizes (N) for each condition are shown in the table below. Adjusted p-values were calculated by performing Mann-Whitney U tests followed by false discovery rate (FDR) correction for multiple comparisons. Each assay consisted of six biological replicates per condition and a minimum of two experimental repeats was performed across all conditions (Figure 4—source data 1). (C) Representative images from each condition. Lead compound abbreviations: as in prior figures. Others: EthD, Ethidium homodimer; GFP, green fluorescent protein.
-
Figure 4—source data 1
Compound tests of mouse photoreceptor culture - thapsigargin assay.
- https://cdn.elifesciences.org/articles/57245/elife-57245-fig4-data1-v4.xlsx
Figure 4—figure supplement 1
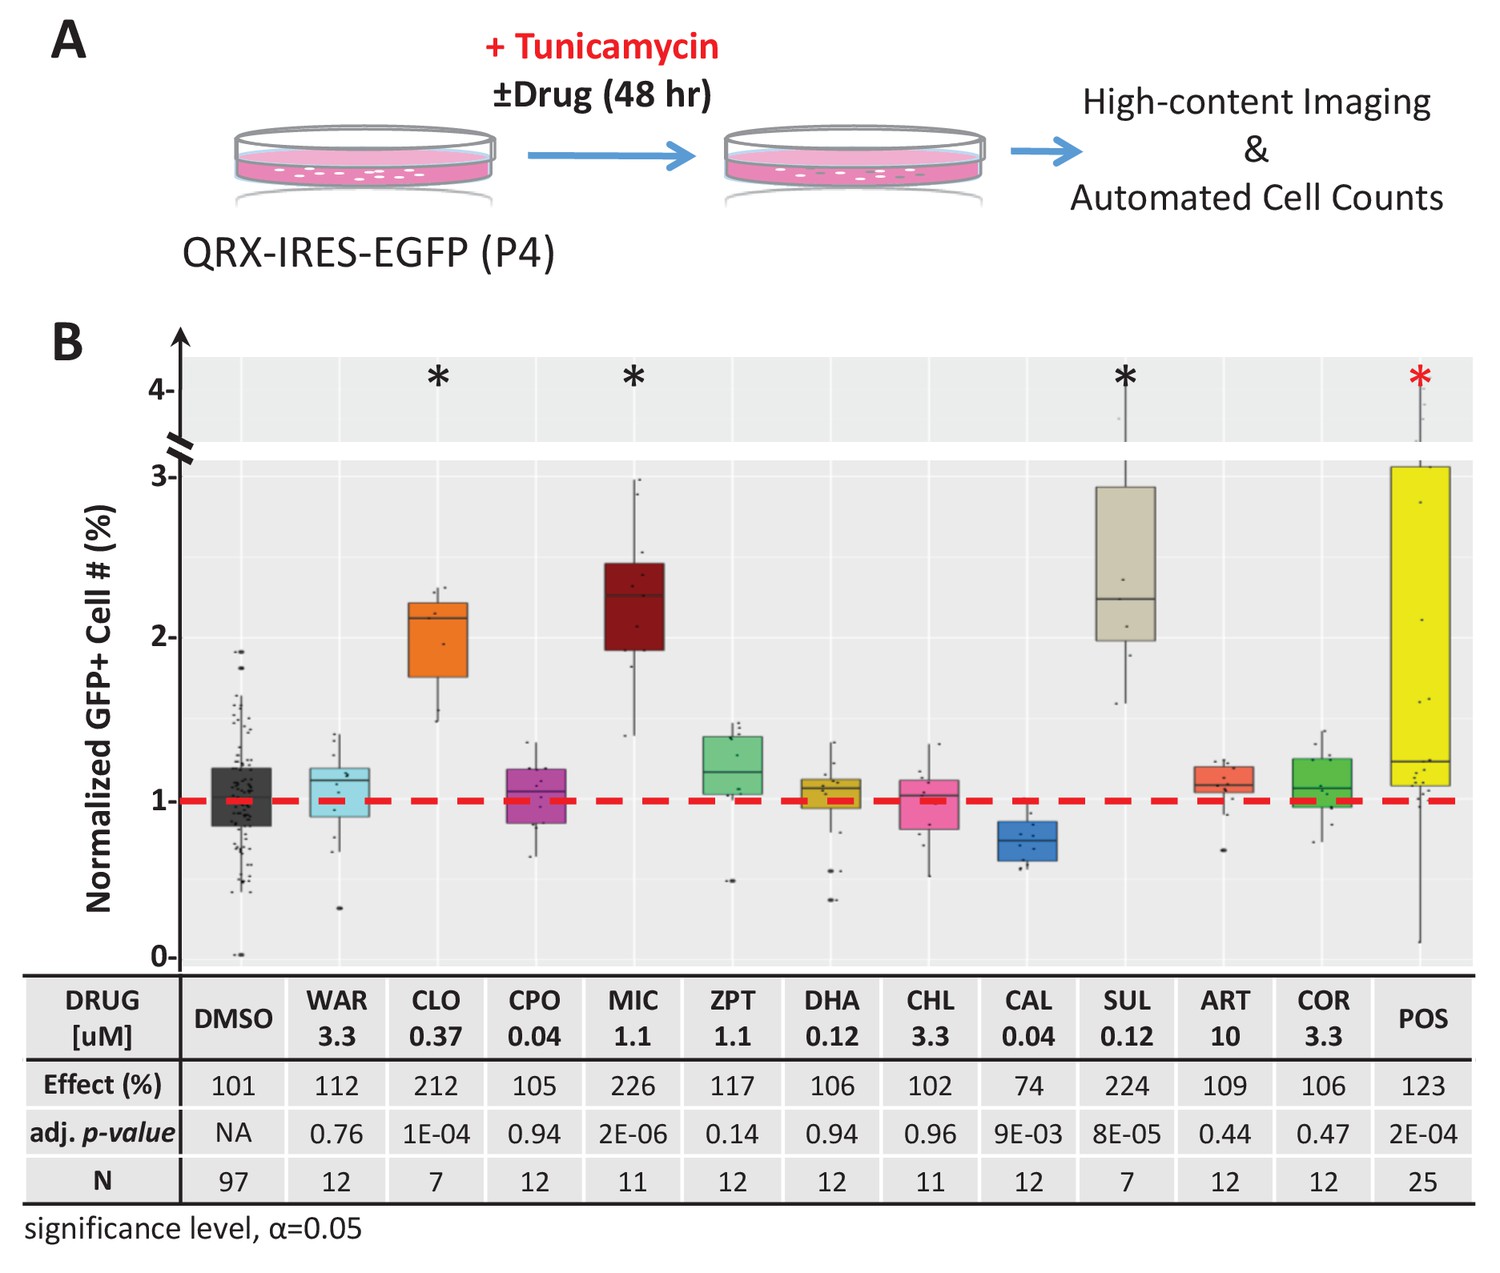
Lead effects on mouse photoreceptor cultures - tunicamycin-induced cell death.
A) Diagram of primary photoreceptor survival assay protocol. Primary retinal cells were isolated from QRX mice and cultured for 2 days in tunicamycin (an ER stressor that induces cell death) and lead compounds or DMSO (control). After 48 hr, cells were stained with Hoescht and ethidium homodimer followed by high-content imaging and automated cell counting to assess the survival effects of lead compounds on GFP-expressing photoreceptor cells. Cell counts for each condition were normalized to the DMSO controls on the same plate. (B) Box plots of photoreceptor survival effects of lead compounds and the positive control compound. Conditions resulting in statistically significant survival effects are marked with an asterisk. The table below shows survival effects (normalized % GFP-expressing cells), adjusted p values, and total sample sizes (N) for each condition. Each assay consisted of six biological replicates per condition and a minimum of two experimental repeats was performed across all conditions (Figure 4—figure supplement 1—source data 1). Adjusted p values were calculated by performing Mann-Whitney U tests followed by false discovery rate (FDR) correction for multiple comparisons. Lead compound abbreviations: WAR, Warfarin; CLO, Cloxyquin; CPO, Ciclopirox olamine; MIC, Miconazole; ZPT, Zinc pyrithione; DHA, Dihydroartemisinin; CHL, Chloroxine; CAL, Calcimycin; SUL, Sulindac; ART, Artemisinin; COR, Cortexolone. Other abbreviations: CI, confidence interval; DMSO, dimethylsulfoxide; POS (positive control).
-
Figure 4—figure supplement 1—source data 1
Quantification of mouse photoreceptor assay - tunicamycin-induced cell death.
- https://cdn.elifesciences.org/articles/57245/elife-57245-fig4-figsupp1-data1-v4.xlsx
Figure 4—figure supplement 2
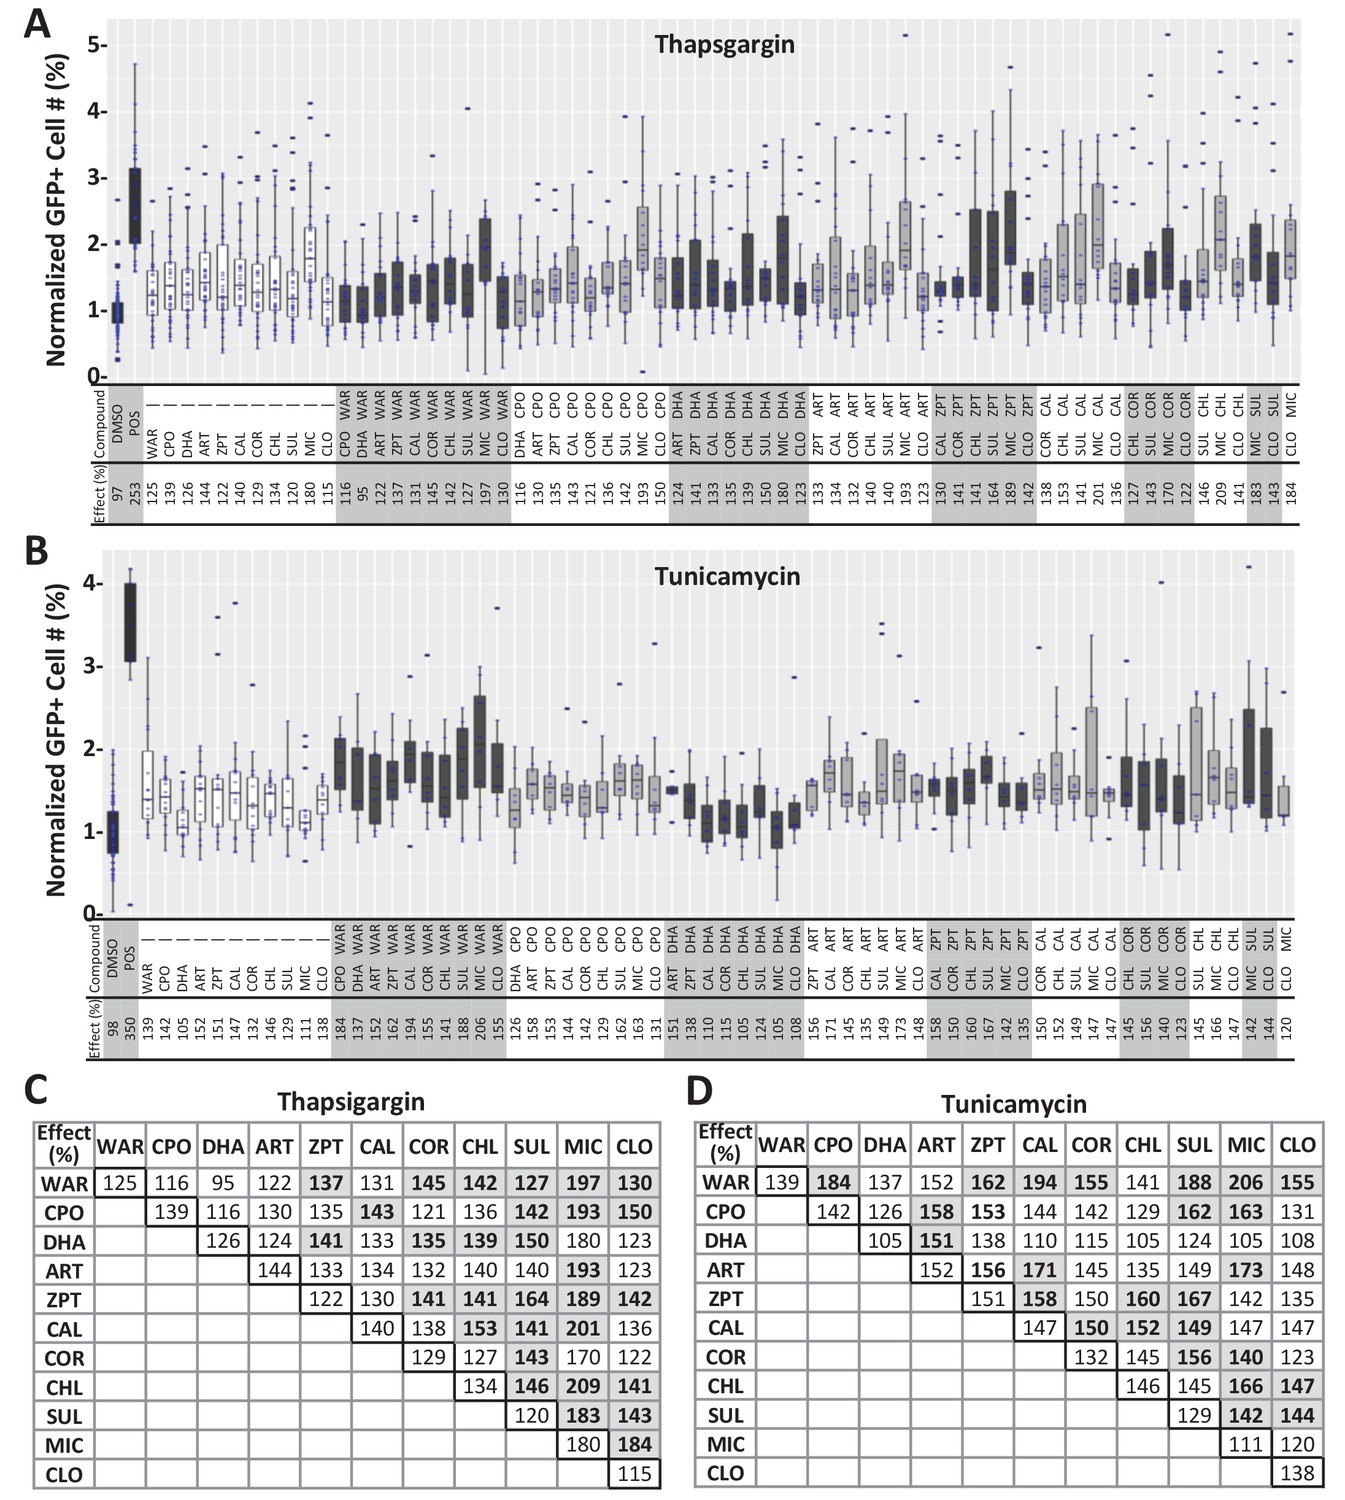
Paired lead compound survival effects in mouse photoreceptor cultures.
(A–B) Lead compounds were tested individually and in pairs for survival effects in primary photoreceptor cells isolated from QRX mice as per Figure 4. Box plots and summary tables (below plots) show relative survival effects in thapsigargin-treated (A) and tunicamycin-treated (B) cultures across all conditions. (C–D) Tables summarize survival effects of individual compounds (outlined boxes on diagonal) and paired compounds for thapsigargin-treated (C) and tunicamycin-treated (D) cultures, trend toward enhanced survival effects are indicated by bolded numbers, gray boxes (median effects). Mann-Whitney U tests followed by Bonferroni correction for multiple comparison (α=0.0006 adjusted significance level) showed that enhanced effects of paired conditions were not statistically significant relative to individual compound controls. (Figure 4—figure supplement 2—source data 1). Lead compound abbreviations: WAR, Warfarin; CLO, Cloxyquin; CPO, Ciclopirox olamine; MIC, Miconazole; ZPT, Zinc pyrithione; DHA, Dihydroartemisinin; CHL, Chloroxine; CAL, Calcimycin; SUL, Sulindac; ART, Artemisinin; COR, Cortexolone. Other abbreviations: DMSO, dimethylsulfoxide; POS (positive control).
-
Figure 4—figure supplement 2—source data 1
Paired drug tests - mouse photoreceptor cultures.
- https://cdn.elifesciences.org/articles/57245/elife-57245-fig4-figsupp2-data1-v4.xlsx
Figure 5
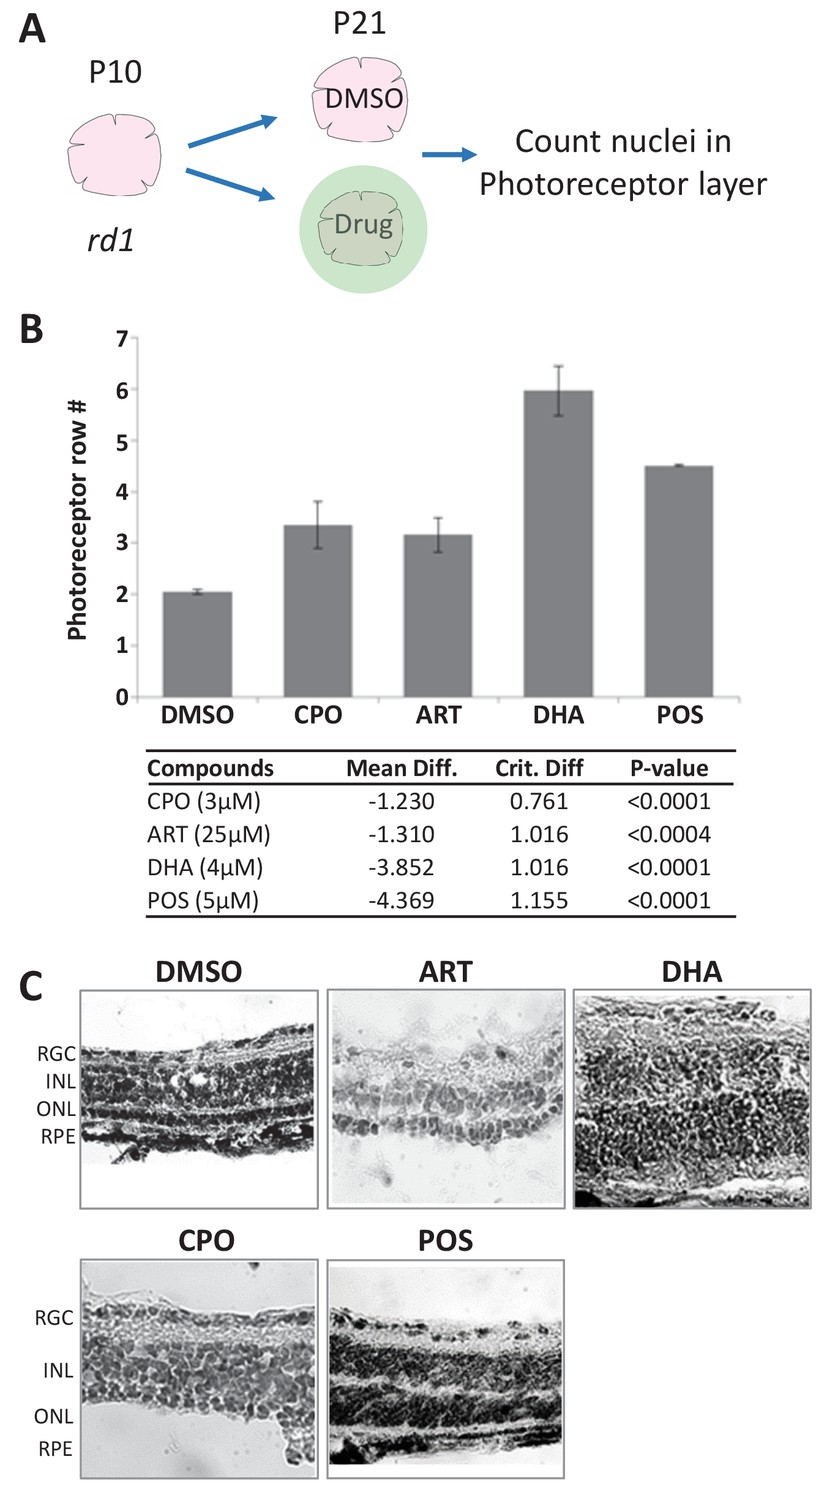
Lead effects on mouse rd1 retinal explant cultures.
(A) Diagram of rd1 explant photoreceptor survival assay protocol. Retinal explants were isolated at postnatal day 10 (P10) and cultured for eleven days in lead compounds at three different concentrations or DMSO. The number of surviving photoreceptor rows was then quantified. (B) Maximally effective dosage of ciclopirox olamine (CPO), artemisinin (ART), and dihydroartemisinin (DHA). Repeated measures ANOVA followed by Bonferroni/Dunn posthoc correction was used to assess statistical significance. (C) Represented images of retinal explants under conditions listed. INL, inner nuclear layer; ONL, outer nuclear layer; RGC, retinal ganglion cell layer; RPE, retinal pigment epithelium.
-
Figure 5—source data 1
Compound tests - rd1 mouse retinal explants.
- https://cdn.elifesciences.org/articles/57245/elife-57245-fig5-data1-v4.xlsx
Figure 6
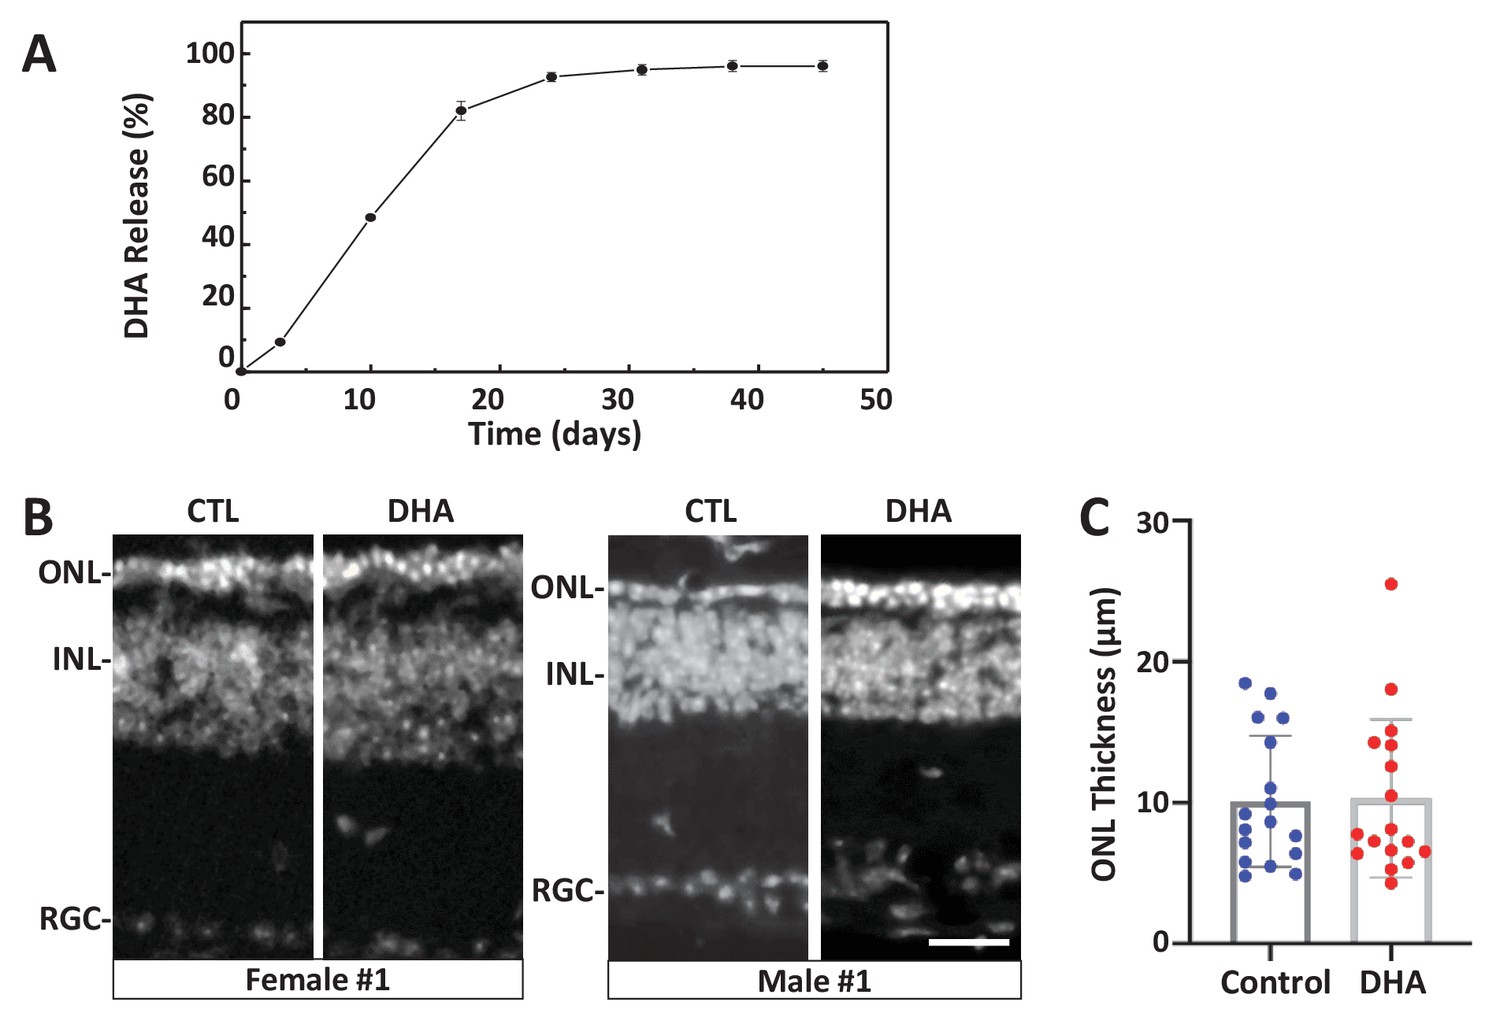
Test of long-release DHA formulation in the rd10 mouse model of RP.
(A) In vitro release kinetics of a long-release DHA formulation (DHA encapsulated in PLGA polymer microparticles, PLGA-DHA) in phosphate buffered saline containing 0.1% DMSO (pH 7.4) at 37°C (Figure 6—source data 1). (B) Representative images of DAPI-stained retinal sections from one female and one male rd10 retina injected with vehicle control (CTL) or PLGA-DHA (DHA; scale bar = 25 µm). (C) Quantification of ONL thickness of control and PLGA-DHA-treated retinas, no statistically significant differences were observed (p=0.5898, two-way ANOVA). The total sample size was 17 mice across three experimental replicates. Abbreviations: CTL, control; DHA, Dihydroartemisinin; ONL: outer nuclear layer; INL: inner nuclear layer; GCL: ganglion cell layer.
-
Figure 6—source data 1
PLGA-DHA in vitro release kinetics.
- https://cdn.elifesciences.org/articles/57245/elife-57245-fig6-data1-v4.csv
Figure 7 with 1 supplement
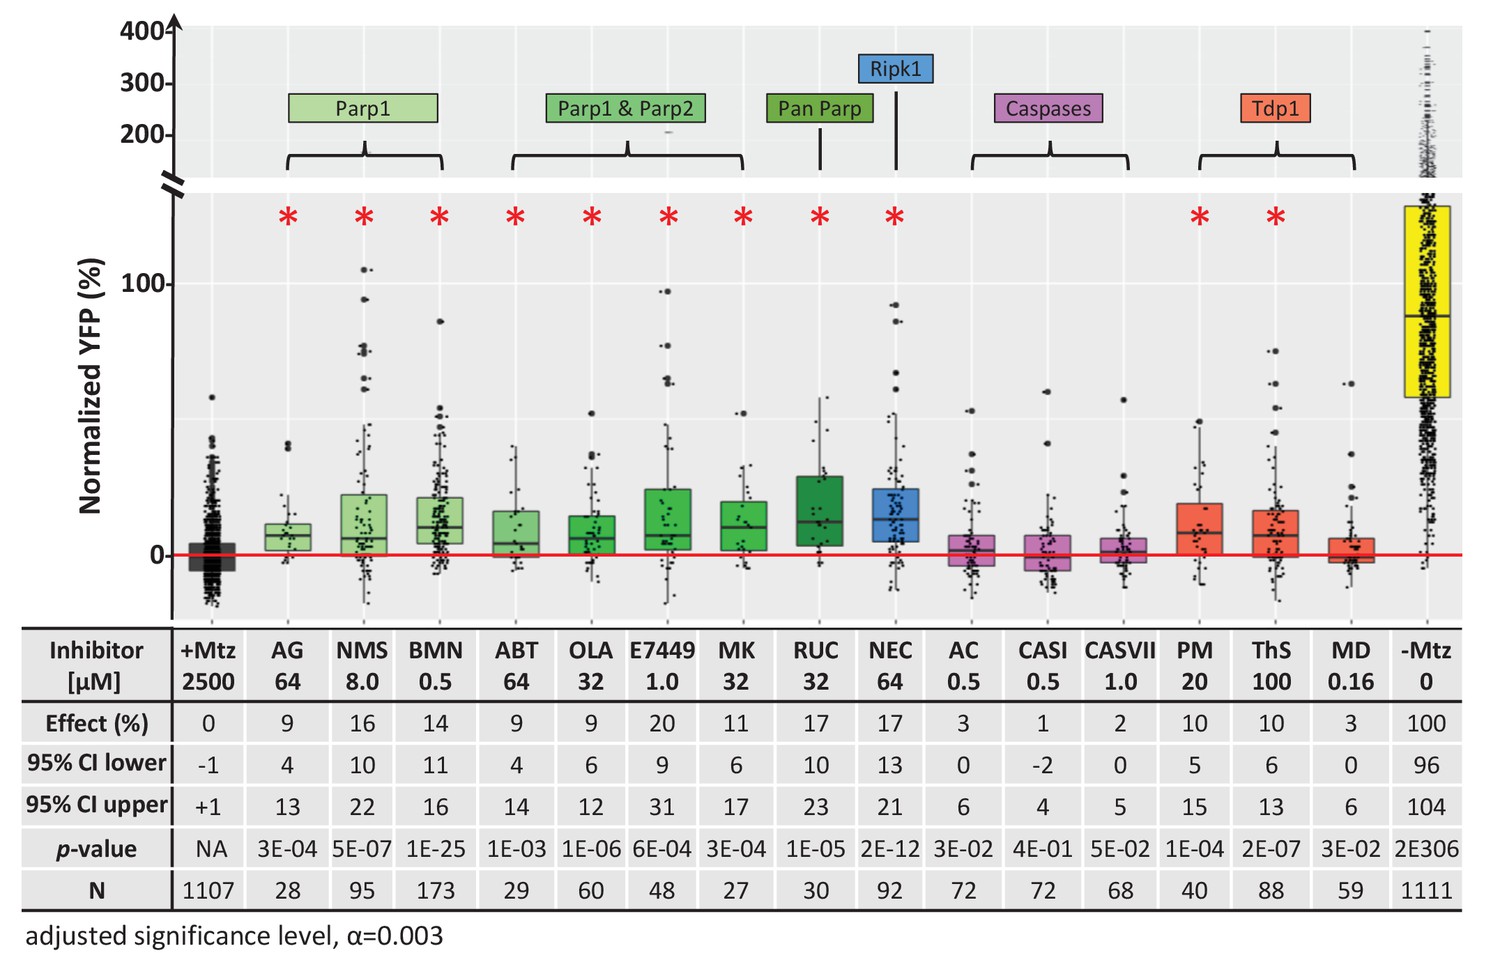
Chemical inhibitor analysis of NTR/Mtz-mediated rod cell death in zebrafish.
Box plots of rod cell survival effects of eight PARP inhibitors (green), a necroptosis inhibitor (blue), four apoptosis inhibitors (magenta), and three Tdp1 inhibitors (orange) in Mtz-treated rho:YFP-NTR zebrafish larvae (targets are listed above for each category). Assays performed as per confirmation tests (see Figure 2A) with all inhibitors tested across 10 concentrations using a twofold dilution series (see Methods for highest concentration tested per compound). Conditions resulting in a statistically significant increase in survival effects relative to +Mtz controls are marked with an asterisk. Survival effects (normalized YFP %), 95% confidence intervals, p-values, and sample sizes (N) for each condition are shown in the table below. Student’s t-test was used to calculate p-values for each condition relative non-ablated controls (0 mM Mtz). Bonferroni correction for multiple comparisons resulted in an adjusted significance level of 0.003 (α=0.003). A minimum of two experimental repeats was performed for each condition (Figure 7—source data 1). No statistical differences in larval survival were observed for tested compounds relative to their respective +Mtz controls, except for PM (67%; Fisher’s exact test, p<0.05). Target abbreviations: Parp, Poly (ADP)-ribose polymerase; Ripk1, Receptor-interacting serine/threonine-protein kinase (1); Tdp1, Tyrosyl-DNA phosphodiesterase 1; Mtz, metronidazole. Inhibitor abbreviations: AG, AG-14361; NMS, NMS-P118; BMN, talazoparib; ABT, veliparib; OLA, olaparib; MK, niraparib; RUC, rucaparib; NEC, necrostatin-1; AC, Ac-DEVD-CHO; CASI, caspase3/7 inhibitor I; CASVII, caspase three inhibitor VII; PM, paromomycin; ThS, thiostrepton; MD, methyl-3,4-dephostatin. Other abbreviations: CI, confidence interval; Mtz, Metronidazole.
-
Figure 7—source data 1
Cell death inhibitor assay.
- https://cdn.elifesciences.org/articles/57245/elife-57245-fig7-data1-v4.xlsx
Figure 7—figure supplement 1
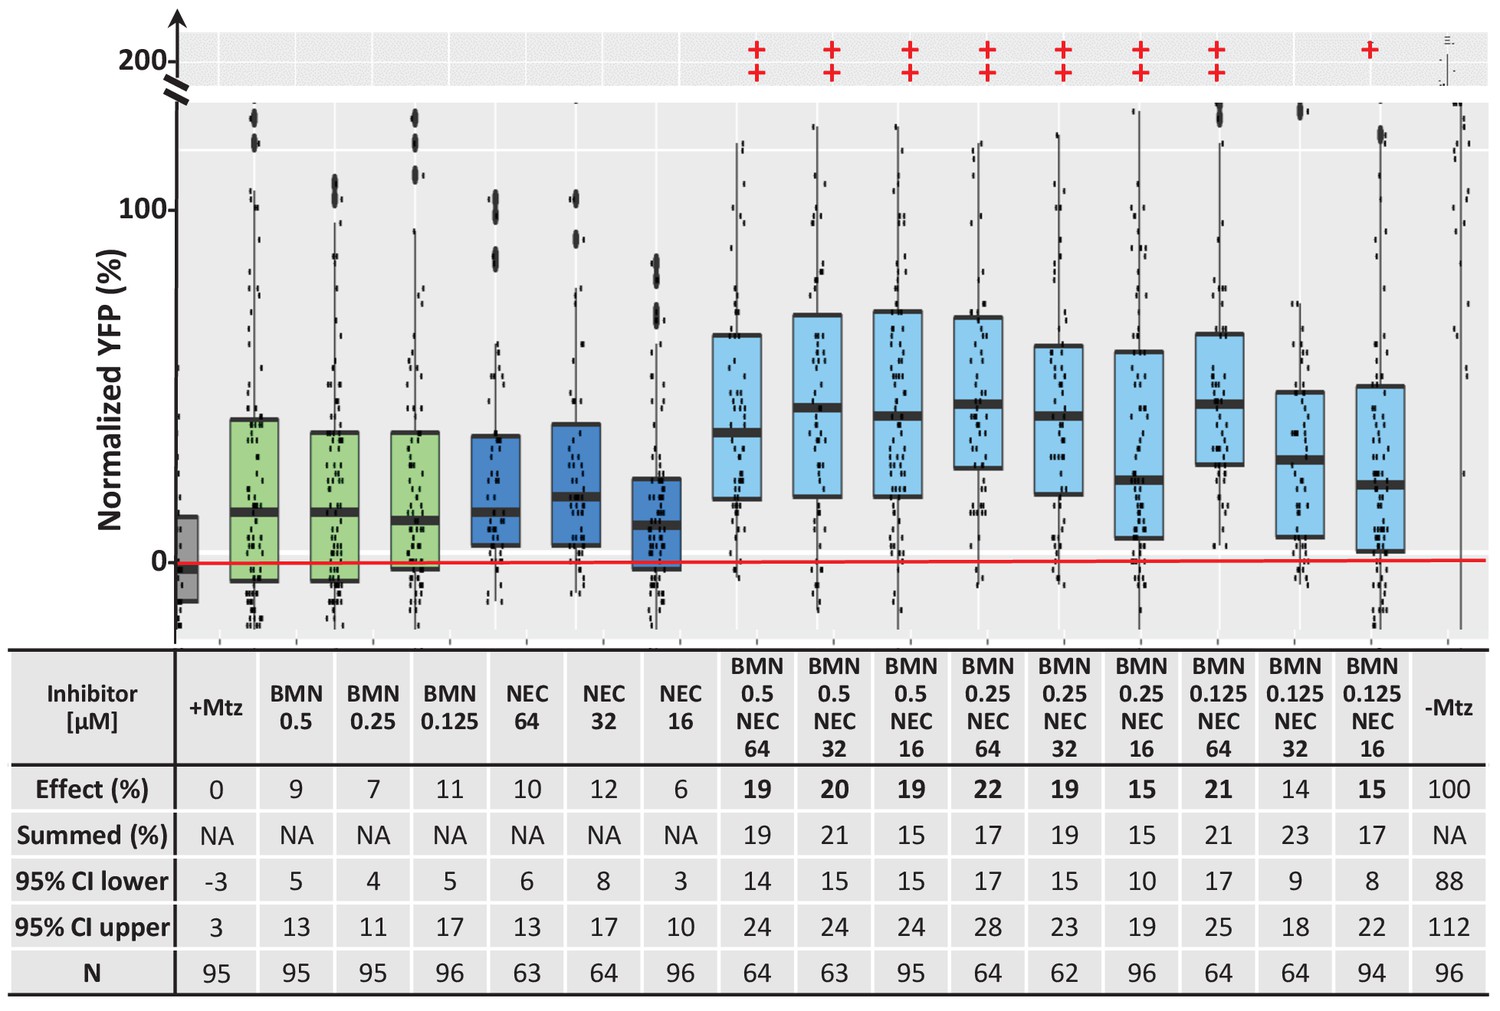
Additive survival effects of paired PARP and necroptosis inhibitors.
Box plots of rod cell survival effects of BMN (PARP inhibitor) and NEC (necroptosis inhibitor) tested alone and in pairs at three different concentrations in rho:YFP-NTR zebrafish larvae (assays performed as per confirmation tests, see Figure 2A). Seven of nine pairs promoted a statistically significant increase in survival relative to both individual compound controls (++), while one pair performed better than a single compound control (+). Survival effects (normalized YFP %), 95% confidence intervals, p-values, and sample sizes (N) for each condition are shown in the table below. For comparison, the survival effect of each pair (Effect %) and the summed effect of the respective individual compound controls (Sum %) are provided. Additive effects were defined as any pair that promoted survival at equal to or greater than the sum of the corresponding individual compound effects ±10%. By this criterion, eight pairs produced additive effects (bolded). A minimum of two experimental repeats were performed for each condition and data polled across replicates (Figure 7—figure supplement 1—source data 1). See also Supplementary file 1b for Student’s t-test calculated p-values for paired conditions relative to ablated controls (+Mtz) and to respective individual compound controls. Inhibitor abbreviations: BMN, talazoparib; NEC, necrostatin-1. Other abbreviations: CI, confidence interval; Mtz, Metronidazole; NA, not applicable.
-
Figure 7—figure supplement 1—source data 1
Paired cell death inhibitor assay.
- https://cdn.elifesciences.org/articles/57245/elife-57245-fig7-figsupp1-data1-v4.xlsx
Figure 8 with 1 supplement
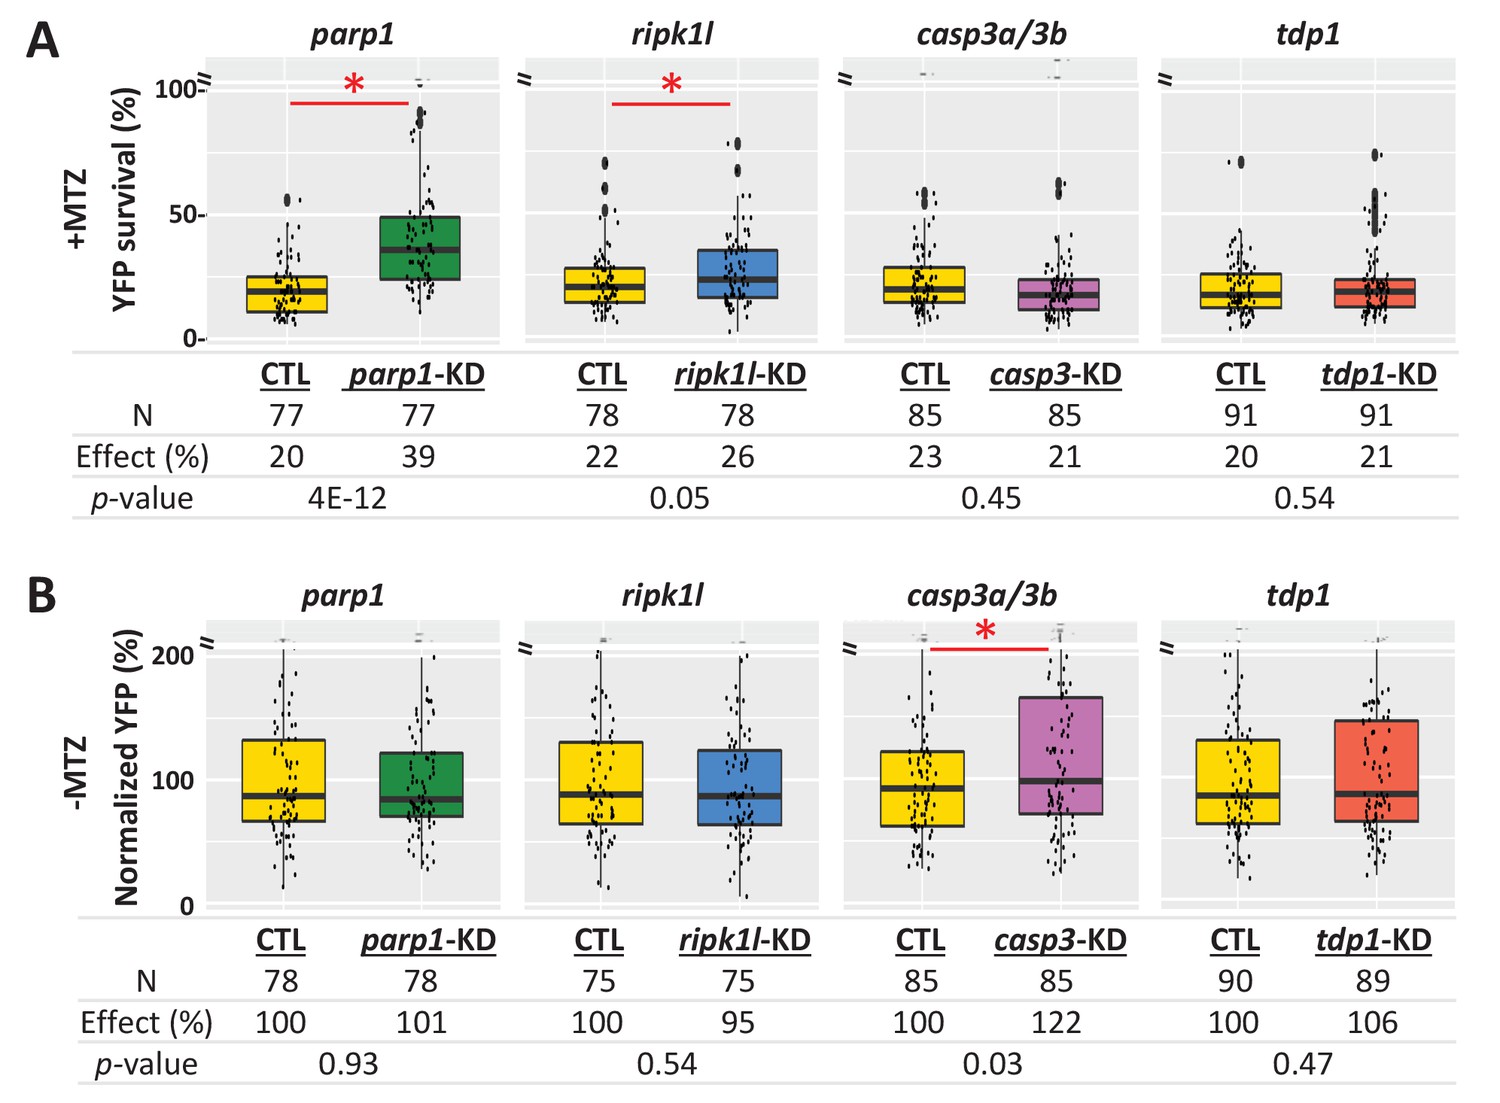
Genetic knockdown analysis of NTR-mediated rod cell death pathways in zebrafish.
(A) Box plots of rod cell survival effects of CRISPR/Cas9-based knockdown of key cell death pathway genes: parp1 (parthanatos), ripk1l (necroptosis), casp3a and casp3b (apoptosis), as well as tdp1 (as a DNA repair pathway control) in Mtz-treated rho:YFP-NTR zebrafish larvae. Cas9 protein and four gRNAs (for parp1, ripk1l and tdp1) or eight gRNAs (for casp3a with casp3b) were co-injected at the one-cell stage. Larvae were raised to 5 dpf and treated with Mtz (2.5 mM) to induce rod cell death. Rod cell survival was quantified at 6 dpf by fluorescence microplate reader assay. Conditions resulting in a statistically significant increase in survival effects relative to non-injected controls are marked with an asterisk. Sample sizes (N), survival effects (YFP % relative to non-ablated control) and p-values are provided in the table below. A minimum of three experimental repeats was performed and data pooled across replicates (Figure 8—source data 1). (B) Box plots of effects on rod cell development in non-ablated rho:YFP-NTR zebrafish larvae (-Mtz) following knockdown of the same genes as in (A). Rod cell numbers were estimated at 6 dpf by microplate reader-based quantification of YFP. Only casp3a/3b knockdown resulted in a statistically significant increase (22%) in rod cell numbers during development. Sample sizes (N), normalized survival effects (% relative to non-injected control) and p-values are provided in the table below. A minimum of three experimental repeats was performed and data pooled across replicates. Abbreviations: parp1, poly (ADP-ribose) polymerase 1; ripk1l, receptor (TNFRSF)-interacting serine-threonine kinase 1, like; casp3a: caspase 3, apoptosis-related cysteine peptidase a; casp3b: caspase 3, apoptosis-related cysteine peptidase b; tdp1, tyrosyl-DNA phosphodiesterase 1; CTL, control; KD, knockdown; PAR, Poly (ADP-ribose).
-
Figure 8—source data 1
Quantification of PAR accumulation.
- https://cdn.elifesciences.org/articles/57245/elife-57245-fig8-data1-v4.xlsx
Figure 8—figure supplement 1
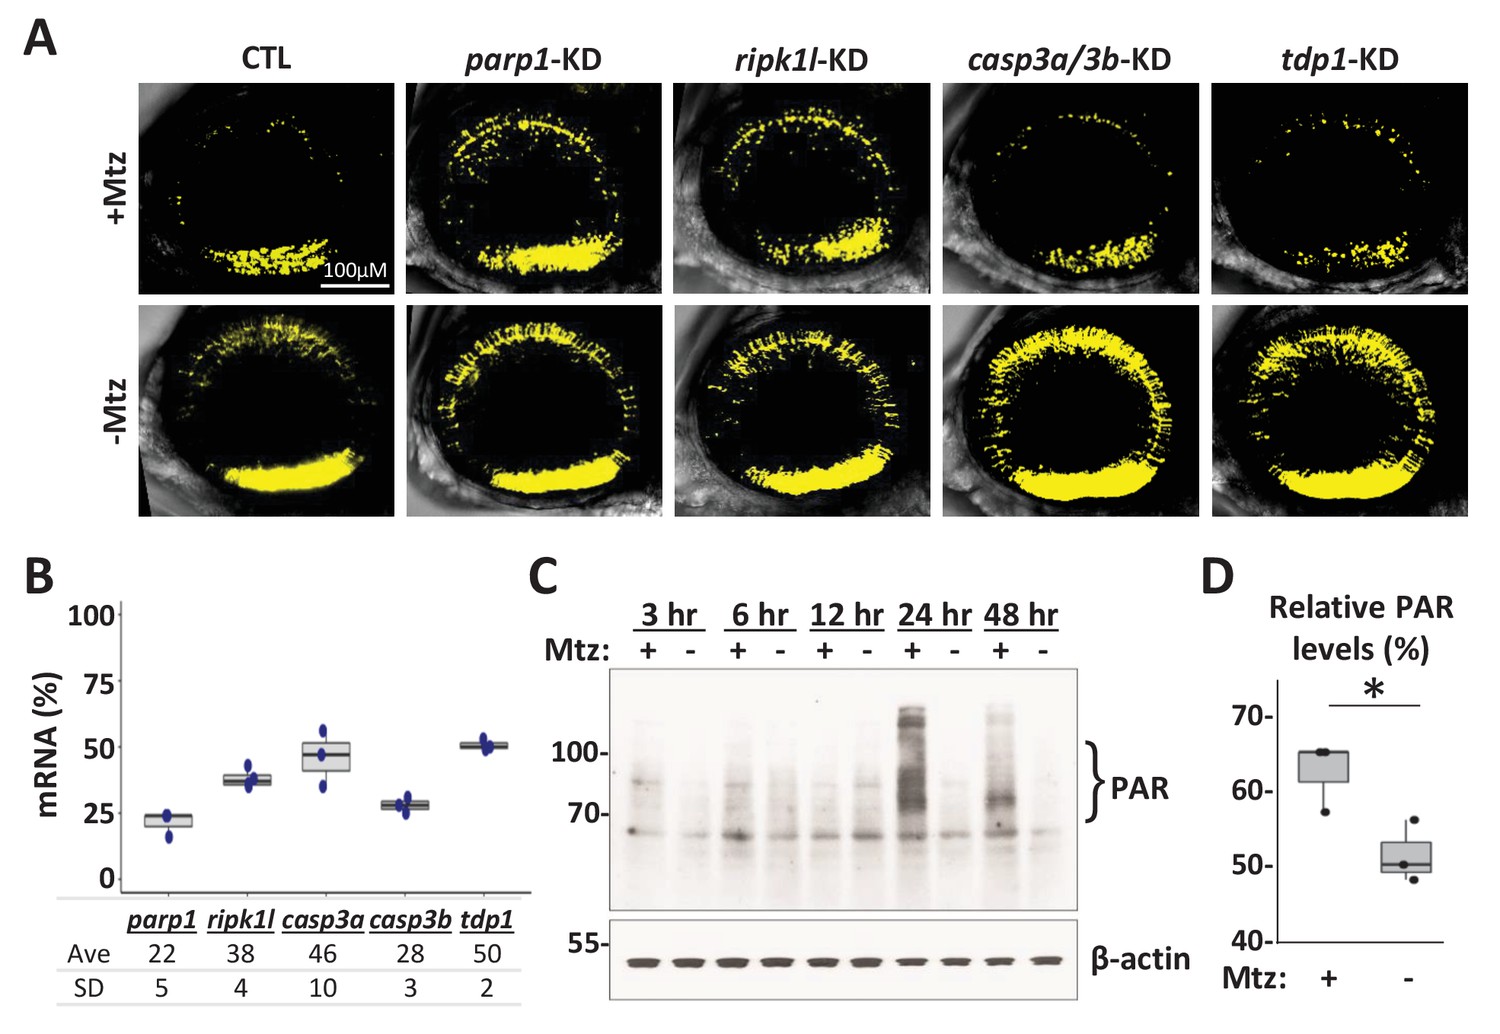
Genetic and biochemical analysis of NTR-mediated rod cell death in zebrafish.
(A) Representative intravital whole retina confocal image stacks of gene knockdown effects on YFP-expressing rod cell numbers in Mtz-treated fish (+Mtz, i.e. effects on NTR/Mtz-mediated cell death) and non-ablated controls (-Mtz, i.e. developmental effects) zebrafish at 6 dpf. (B) Quantification of CRISPR-based gene knockdown, 16–24 larvae (7 dpf) per condition were pooled as one sample for RNA extraction. qPCR results confirmed suppression of gene expression for each target (ranging from 22% to 50% of control). Data from 3 to 4 experimental repeats were pooled (Figure 8—figure supplement 1—source data 1). (C) Western blot of PAR accumulation in rho:YFP-NTR zebrafish larvae following 2.5 mM Mtz treatment at five dpf. Protein samples were collected from approximately 30 fish at 3, 6, 12, 24, and 48 hr post-Mtz treatment (hpt). PAR polymer detection with an anti-PAR antibody suggest increases in accumulation in Mtz-treated larvae at 24 and 48 hpt. (D) Quantification of PAR polymer bands showed a statistically significant increase at 24 hpt (p = 0.04, Student’s t test; Figure 8—figure supplement 1—source data 1). Abbreviations: parp1, poly (ADP-ribose) polymerase 1; ripk1l, receptor (TNFRSF)-interacting serine-threonine kinase 1, like; casp3a: caspase 3, apoptosis-related cysteine peptidase a; casp3b: caspase 3, apoptosis-related cysteine peptidase b; tdp1, tyrosyl-DNA phosphodiesterase 1; CTL, control; KD, knockdown; PAR, Poly (ADP-ribose).
-
Figure 8—figure supplement 1—source data 1
qPCR confirmation of gene knockdown.
- https://cdn.elifesciences.org/articles/57245/elife-57245-fig8-figsupp1-data1-v4.xlsx
Figure 9
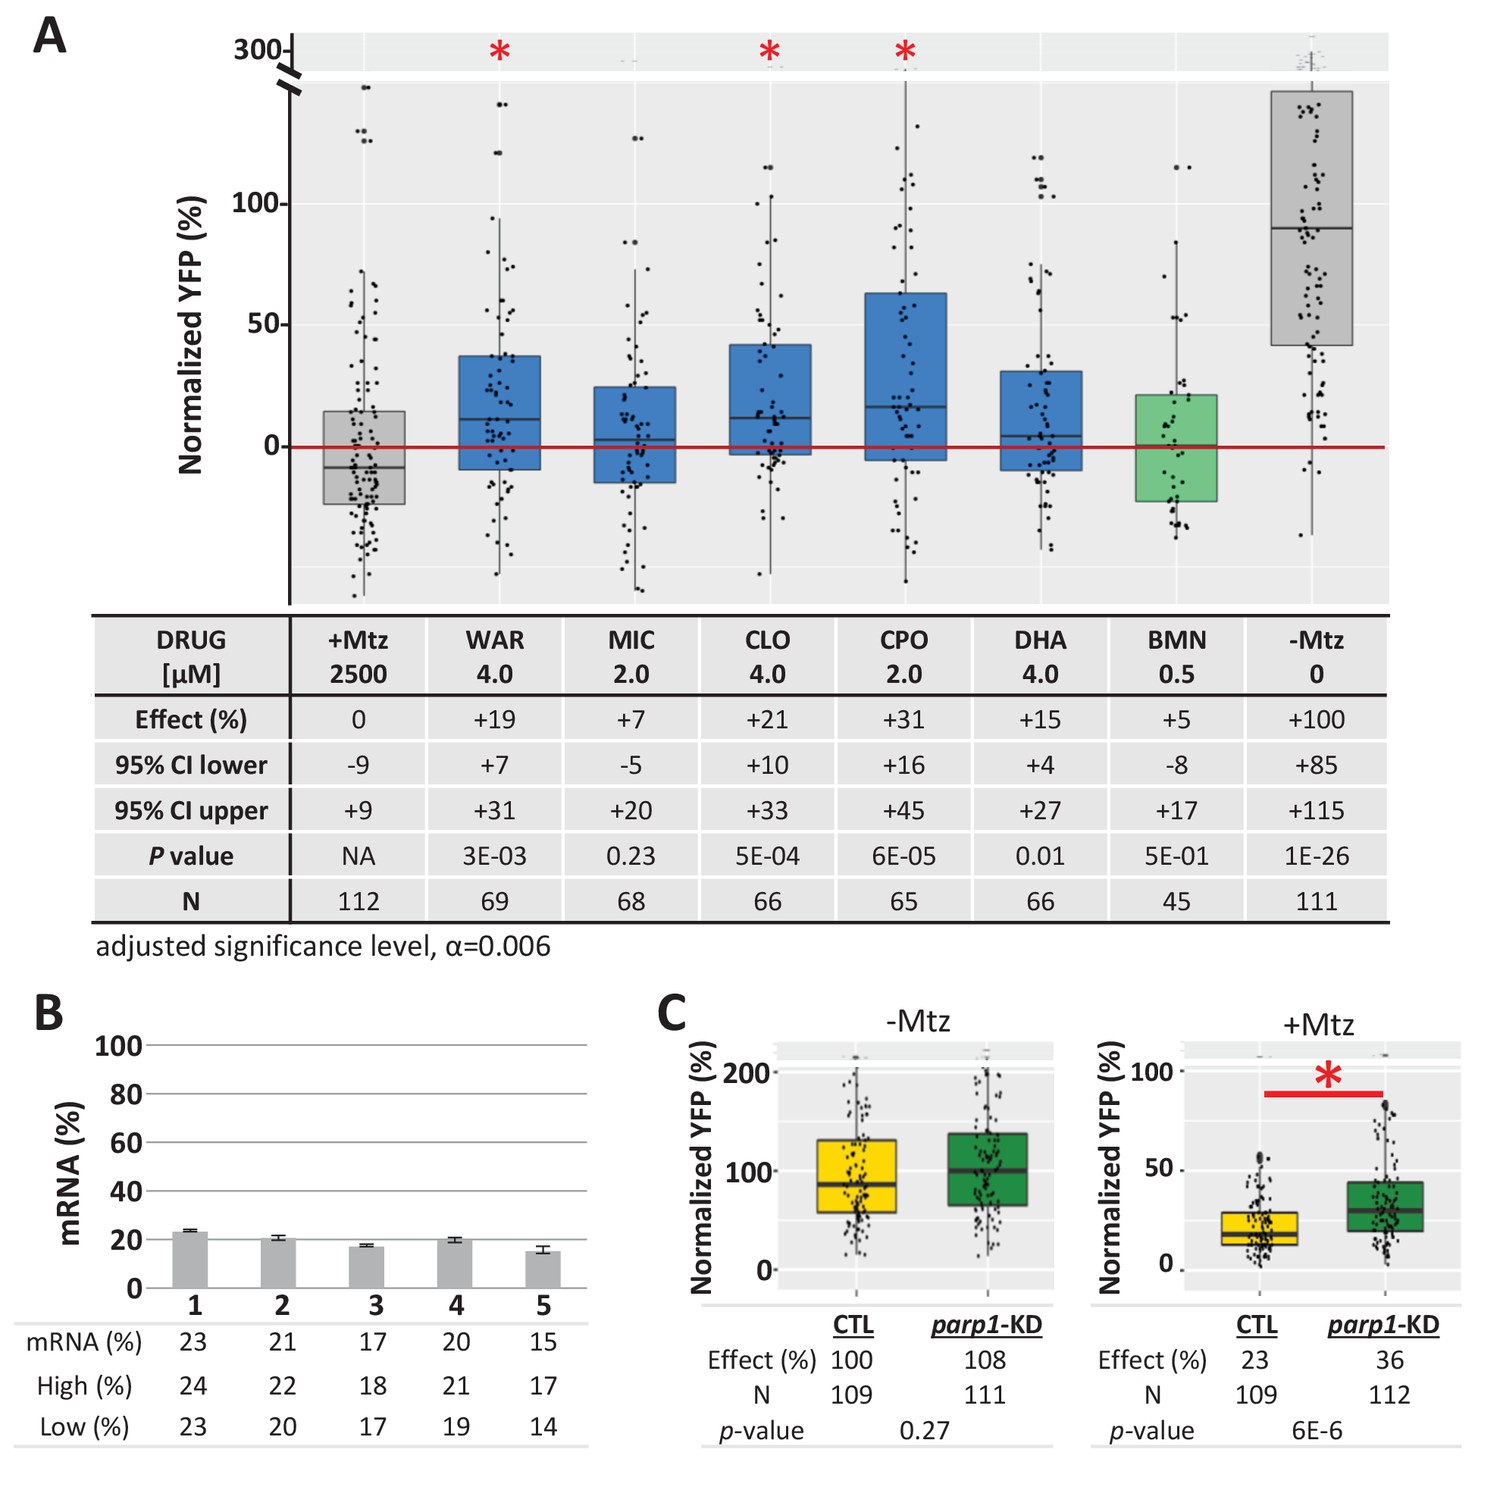
Test of lead compound survival effects in parp1 knockdown zebrafish larvae.
(A) Box plots of rod cell survival effects of five lead compounds and a PARP inhibitor control (BMN) in Mtz-treated rho:YFP-NTR zebrafish larvae in which parp1 expression was knocked down, assays performed as per confirmation tests (see Figure 2A). Larvae subjected to CRISPR-based knockdown of parp1 were raised to 5 dpf, exposed to lead compounds at the indicated concentrations, and treated with 2.5 mM Mtz to induce rod cell death. Rod cell survival was quantified at six dpf by fluorescence microplate reader assay. Conditions that promoted a statistically significant increase in rod cell survival are marked with an asterisk. Survival effects (normalized YFP %), 95% confidence intervals, p-values, and sample sizes (N) for each condition are shown in the table below. Student’s t-test was used to calculate p-values for each condition relative to ablated controls (+Mtz). Bonferroni correction for multiple comparisons resulted in an adjusted significance level of 0.006 (α=0.006). A minimum of three experimental repeats were performed for each condition and data polled across replicates (Figure 9—source data 1). (B) Quantification of CRISPR-based parp1 knockdown, 16–24 larvae per condition (seven dpf) were pooled as one sample for RNA extraction. qPCR results confirmed suppression of parp1 expression (ranging from 14% to 23% of uninjected controls). (C) Box plots of parp1 knockdown effects on rod cell neogenesis and rod cell survival, that is, -Mtz and +Mtz controls, respectively, for these experiments. Sample sizes (N), survival effects (normalized YFP %) and p-values are shown in the table below. Lead compound abbreviations: WAR, Warfarin; CLO, Cloxyquin; CPO, Ciclopirox olamine; MIC, Miconazole; DHA, Dihydroartemisinin; Other abbreviations: BMN, talazoparib (parp1-dependent control);, CI, confidence interval; Mtz, Metronidazole; parp, poly (ADP-ribose) polymerase 1.
-
Figure 9—source data 1
Compound effects following gene knockdown.
- https://cdn.elifesciences.org/articles/57245/elife-57245-fig9-data1-v4.xlsx
Figure 10
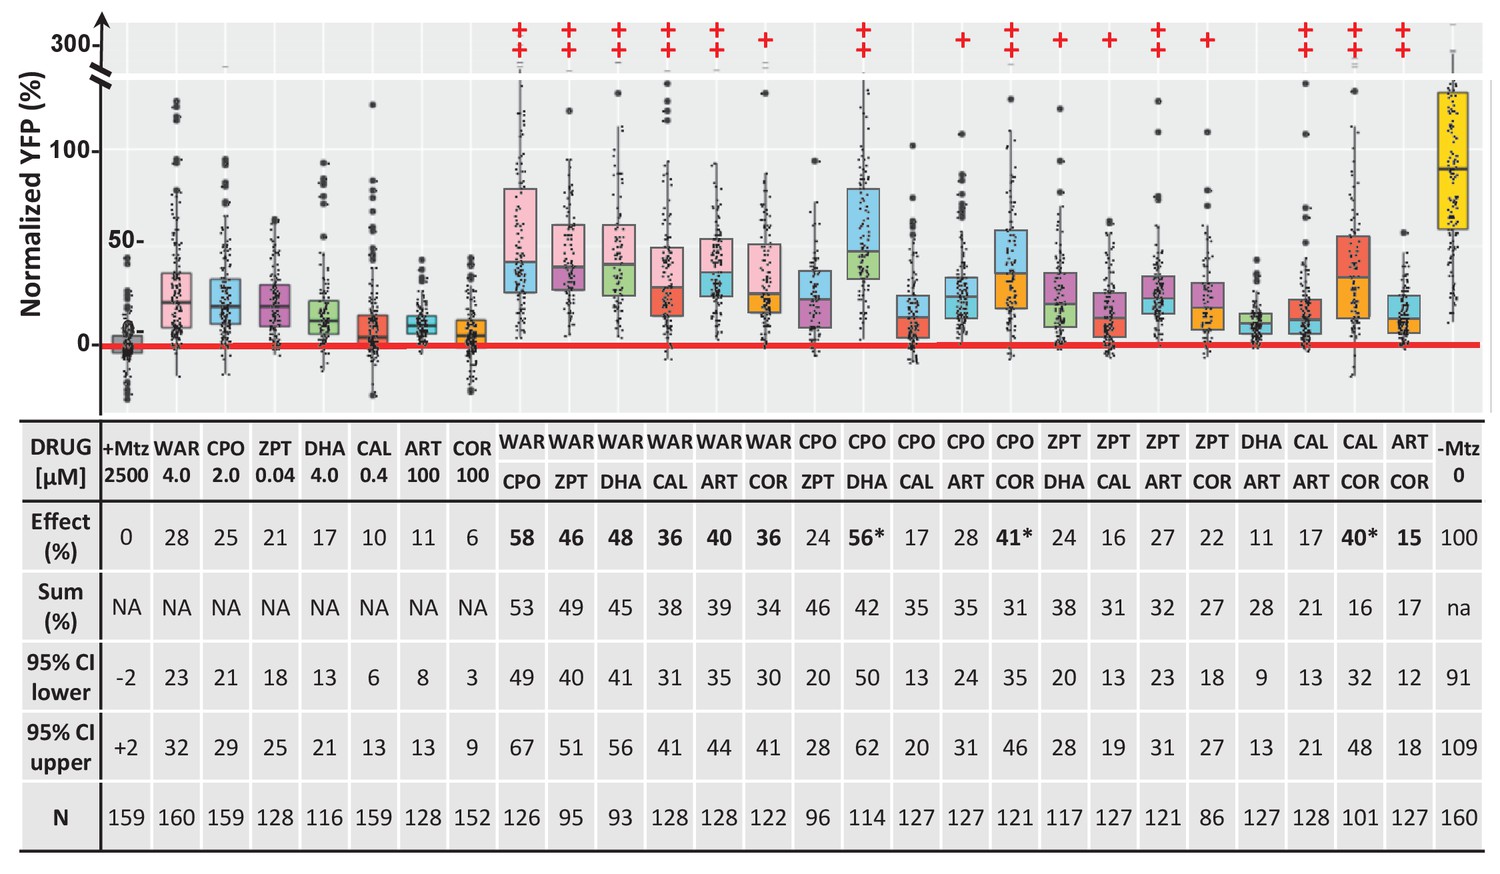
Additive survival effects of paired lead compounds in zebrafish RP model.
Box plots of rod cell survival effects of seven lead compounds tested alone and in pairs in rho:YFP-NTR zebrafish larvae (assays performed as per confirmation tests, see Figure 2A). To test for enhanced survival, all compounds were tested at maximal effective dosages. Eleven pairs promoted a statistically significant increase in survival relative to both individual compound controls (++), while five pairs performed better than a single compound control (+). Survival effects (normalized YFP %), 95% confidence intervals, p-values, and sample sizes (N) for each condition are shown in the table below. For comparison, the survival effect of each pair (Effect %) and the summed effect of the respective individual compound controls (Sum %) are provided. Additive effects were defined as any pair that promoted survival at equal to or greater than the sum of the corresponding individual compound effects ±10%. By this criterion, 10 pairs produced additive effects (bolded values). Three pairs produced effects greater than 25% above the summed effect and were considered potentially synergistic (asterisks). A minimum of three experimental repeats were performed for each condition and data pooled across replicates (Figure 10—source data 1). No statistical differences in larval survival were observed for lead compounds or compound pairs relative to their respective +Mtz controls, except for DHA (73%), WAR+DHA (73%), CIC+DHA (89%), ZPT+DHA (91%), ZPT+COR (90%) and CAL+COR (79%; Fisher’s exact test, p<0.05). Two pairs, DHA+CAL and DHA+COR resulted in total lethality and are not plotted. See Supplementary file 1c for survival effects (normalized YFP %), 95% confidence intervals and p-values relative to ablated controls (+Mtz) and to respective individual compound controls, and sample sizes (N) for all conditions. Lead compound abbreviations: WAR, Warfarin; CLO, Cloxyquin; CPO, Ciclopirox olamine; MIC, Miconazole; ZPT, Zinc pyrithione; DHA, Dihydroartemisinin; CHL, Chloroxine; CAL, Calcimycin; SUL, Sulindac; ART, Artemisinin; COR, Cortexolone; POS, positive control. Other abbreviations: CI, confidence interval; Mtz, Metronidazole.
-
Figure 10—source data 1
Paired compound tests.
- https://cdn.elifesciences.org/articles/57245/elife-57245-fig10-data1-v4.xlsx
Figure 11
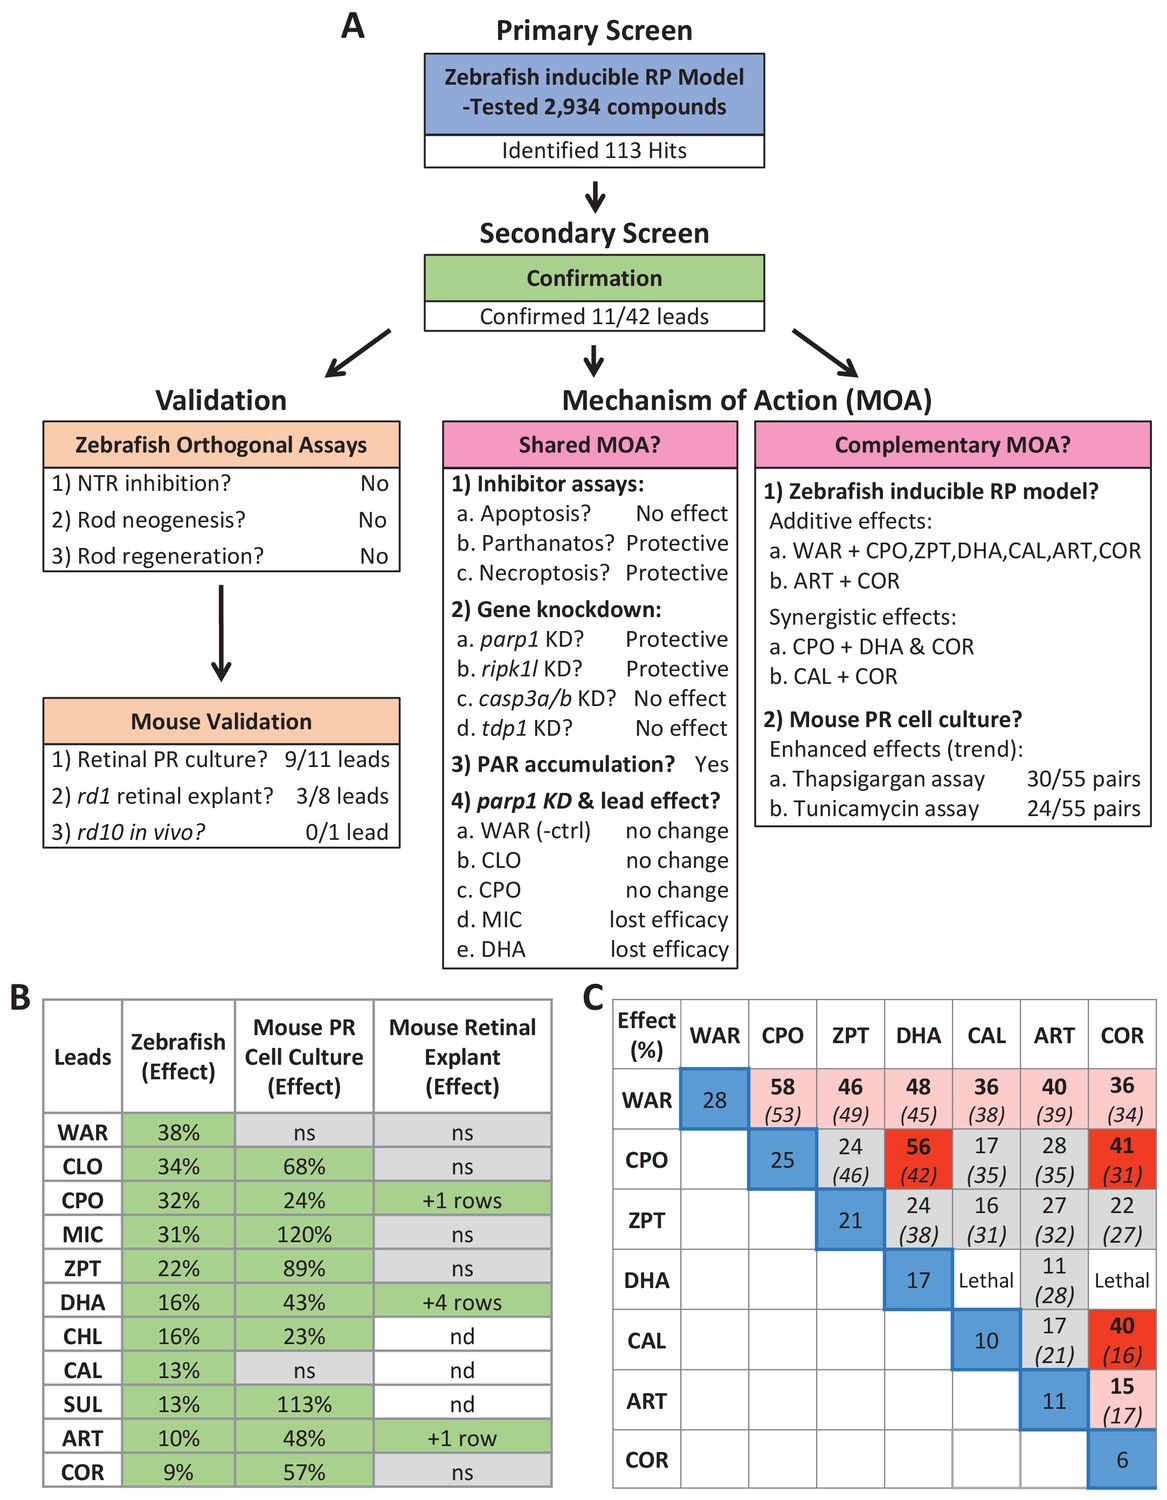
Summary.
(A) Flow chart of cross-species phenotypic drug discovery process showing results of the primary drug screen, secondary confirmation, orthogonal assays, mouse model tests, shared MOA and complementary MOA assays (i.e. paired drug tests). (B) Summary of survival effects of lead drug candidates across model systems. (C) Summary of survival effects of paired lead drug tests in the zebrafish-inducible RP model showing effects of single drug controls (blue boxes) and paired drug tests that resulted in no additive effects (gray boxes), additive effects (orange boxes) and synergistic effects (red boxes); mathematically summed effect of each pair of lead compounds (italics) are shown for comparison. Abbreviations: as in prior figures.
Tables
Table 1
Eleven confirmed lead compounds.
Common names, IUPAC names, abbreviations, PubChem CID, and chemical structures of confirmed lead compounds listed in order of efficacy.
| Common and IUPAC names | Abbr. | PubChem CID | Structure |
|---|---|---|---|
| Warfarin 4-hydroxy-3-(3-oxo-1-phenylbutyl)chromen-2-one | WAR | 54678486 | 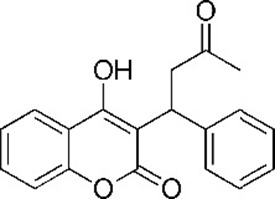 |
| Cloxyquin 5-Chloro-8-hydroxyquinoline | CLO | 2817 | 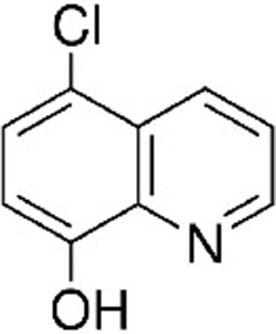 |
| Ciclopirox olamine 2-aminoethanol;6-cyclohexyl-1-hydroxy-4-methylpyridin-2-one | CPO | 38911 | 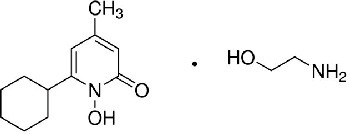 |
| Miconazole 1-[2-(2,4-dichlorophenyl)−2-[(2,4-dichlorophenyl)methoxy]ethyl]imidazole | MIC | 4189 | 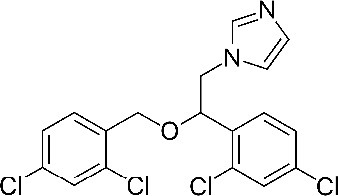 |
| Zinc pyrithione zinc;1-oxidopyridin-1-ium-2-thiolate | ZPT | 26041 | 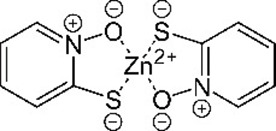 |
| Dihydroartemisinin (4S,5R,9R,10S,12R,13R)−1,5,9-trimethyl-11,14,15,16-tetraoxatetracyclo[10.3.1.04,13.08,13]hexadecan-10-ol | DHA | 456410 | 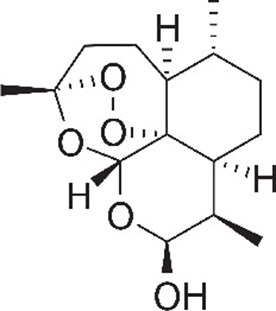 |
| Chloroxine 5,7-dichloroquinolin-8-ol | CHL | 2722 | 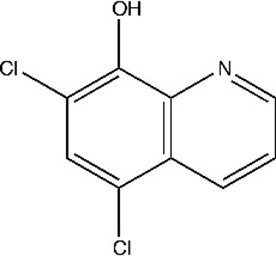 |
| Calcimycin 5-(methylamino)−2-[[(2S,3R,5R,8S,9S)−3,5,9-trimethyl-2-[1-oxo-1-(1H-pyrrol-2-yl)propan-2-yl]−1,7-dioxaspiro[5.5]undecan-8-yl]methyl]−1,3-benzoxazole-4-carboxylic acid | CAL | 40486 | 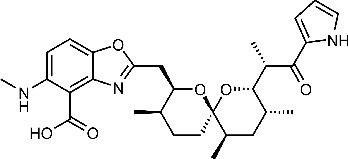 |
| Sulindac 2-[(3Z)−6-fluoro-2-methyl-3-[(4-methylsulfinylphenyl)methylidene]inden-1-yl]acetic acid | SUL | 1548887 | 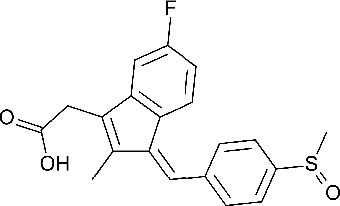 |
| Artemesinin (1R,4S,5R,8S,9R,12S,13R)−1,5,9-trimethyl-11,14,15,16-tetraoxatetracyclo[10.3.1.04,13.08,13]hexadecan-10-one | ART | 68827 | 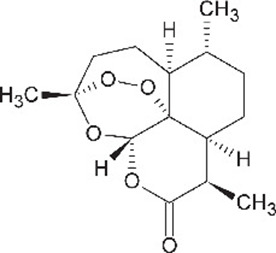 |
| Cortexolone (8R,9S,10R,13S,14S,17R)−17-hydroxy-17-(2-hydroxyacetyl)−10,13-dimethyl-2,6,7,8,9,11,12,14,15,16-decahydro-1H-cyclopenta[a]phenanthren-3-one | COR | 440707 |  |
Table 2
Summary of PubChem HTS and uHTS target-based screens of lead compound bioactivity.
Results of 13 target-based HTS screens, with '+' indicating inhibitory activity of lead compounds. Lead compound abbreviations: WAR, Warfarin; CLO, Cloxyquin; CPO, Ciclopirox olamine; MIC, Miconazole; ZPT, Zinc pyrithione; DHA, Dihydroartemisinin; CHL, Chloroxine; CAL, Calcimycin; SUL, Sulindac; ART, Artemisinin; COR, Cortexolone; POS, positive control. Other abbreviations: CI, confidence interval; Mtz, Metronidazole; PTU, N-phenylthiourea. Target abbreviations: Tdp1, Tyrosyl-DNA phosphodiesterase 1; Rorc, RAR-related orphan receptor gamma; AR, androgen receptor signaling pathway; TR, thyroid receptor signaling pathway; VDR, vitamin D receptor; ER, estrogen receptor alpha; AhR, aryl hydrocarbon receptor; GR, glucocorticoid receptor; Dopa, dopamine related; HIF1, Hypoxia-inducible factor 1-alpha; SHH, Sonic hedgehog; COX, cyclooxygenase.
| Drug\path | Tdp1 | Rorc | AR | TR | VDR | ER | AhR | GR | P53 | Dopa | HIF1 | SHH | COX |
|---|---|---|---|---|---|---|---|---|---|---|---|---|---|
| WAR | + | ||||||||||||
| MIC | + | + | + | + | + | ||||||||
| CLO | + | + | + | + | + | + | + | ||||||
| CPO | + | + | + | + | + | + | + | + | + | ||||
| ZPT | + | + | + | + | + | + | + | + | + | + | |||
| DHA | + | + | + | + | |||||||||
| CHL | + | + | + | + | + | + | + | + | + | ||||
| CAL | + | + | + | ||||||||||
| SUL | + | + | + | ||||||||||
| ART | + | + | |||||||||||
| COR | + | + |
Table 3
Chemical inhibitors of lead implicated targets and cell death pathways.
List of eight PARP inhibitors, one necroptosis inhibitor, three apoptosis inhibitors, and three TDP1 inhibitors tested for neuroprotective effects in rho:YFP-NTR larvae (see Figure 4 and Figure 4—source data 1). Target(s) and relative inhibitory activity against related targets in each cell death pathway are as reported by manufacturer, references provided by manufacturer, or references herein. Concentrations producing maximal survival effects and the percent increase in YFP levels are listed for each compound. Abbreviations: Parp (Poly (ADP)-ribose Polymerase), Ripk1 (Receptor-interacting serine/threonine-protein kinase 1), Tdp1 (Tyrosyl-DNA phosphodiesterase 1).
| Cell death Pathway | Compound name (abbrv.) | Target(s) and Relative Activity (+) | Conc. [µM] | Effect (%) |
|---|---|---|---|---|
| Parp-dependent (Parthantos or cGMP-dependent) | AG-14361 (AG) | Parp1+++ | 64 | 9 |
| NMS-P118 (NMS) | Parp1++ | 8 | 16 | |
| Talazoparib (BMN) | Parp1 ++++ | 0.5 | 14 | |
| Veliparib (ABT) | Parp1+++, 2+++ | 64 | 9 | |
| Olaparib (Ola) | Parp1+++, 2++++ | 32 | 9 | |
| E7449 | Parp1++++, 2++++ | 1 | 20 | |
| Niraparib (MK) | Parp1+++, 2+++ | 32 | 11 | |
| Rucaparib (RUC) | pan-Parp++++ | 32 | 17 | |
| Necroptosis | Necrostatin-1 (NEC) | Rip1k++ | 64 | 17 |
| Apoptosis | Ac-DEVD-CHO (AC) | Caspase 1+++, 2+, 3++++, 4++, 5++, 6+++, 7+++, 8++++, 9++, 10+++ | 0.5 | 3 |
| Caspase3/7 inhibitor I (CASI) | Caspase 3++, 7++, 9+ | 0.5 | 1 | |
| Caspase three inhibitor VII (CASVII) | Caspase 3+++ | 1 | 2 | |
| Tdp1 (DNA repair) | Paromomycin (PM) | Tdp1+ | 20 | 10 |
| Thiostrepton (ThS) | Tdp1+ | 100 | 10 | |
| Methyl-3,4-dephostatin (MD) | Tdp1++ | 0.16 | 3 |
Key resources table
| Reagent type (species) or resource | Designation | Source or reference |
|---|---|---|
| Transgenic zebrafish, Danio rerio (AB; roy) | Tg(rho:YFP-Eco.NfsB)gmc500; mpv17a9 (rho:YFP-NTR) | RRID # #:ZFIN_ZDB-GENO-190617–10 |
| Transgenic zebrafish Danio rerio (AB; roy) | Tg(rho:GAP-YFP-2A-nfsB_Vv F70A/F108Y)jh405; mpv17a9 (rho:YFP-NTR2.0) | ZFIN ID pending; Mumm lab |
| E. coli | BL21(DE3) Competent Cells | emdmillipore.com: 69450 |
| Mutant mouse Mus musculus | Pde6brd1 (rd1) | RRID #:MGI:5902961 |
| Mutant mouse Mus musculus (C57BL/6J) | Pde6brd10 (rd10) | RRID # #:IMSR_JAX:004297 |
| Transgenic mouse Mus musculus (SJL/J) | QRX-IRES-EGFP | Zack lab |
| Antibody | Anti-Arrestin3a (α-Arr3a; zpr-1) Mouse monoclonal (1:200 dilution) | RRID #:AB_10013803 |
| Antibody | Anti-Rhodopsin (α-Rho; 1d1) Mouse monoclonal - 1:100 dilution | ZDB-ATB-081229–13 |
| Antibody | Ab-4C12 (aka, 4C12) Mouse monoclonal - 1:50: dilution | ZDB-ATB-090506–2 |
| Antibody | Anti-Mouse IgG (H+L), Alexa 647 Goat polyclonal - 1:1000 dilution | RRID #:AB_2338902 |
| Antibody | Anti-Cone Arrestin (mouse) Rabbit polyclonal - 1:1000 dilution | RRID #:AB_1163387 |
| Antibody | Anti-Retinal S antigen (S128) Mouse monoclonal - 1:1000 dilution | RRID #:AB_2747776 |
| Antibody | Anti-PAR (human) Recombinant Antibody - 1:2000 dilution | PMID:30385548 |
| Antibody | Anti-Human IgG (Fab')2 (HRP) Goat polyclonal - 1:10000 dilution | RRID #:AB_1951105 |
| Antibody | Anti-beta-Actin-HRP Mouse monoclonal - 1:20000 dilution | RRID #:AB_262011 |
| Chemical compound | 17-(Allylamino)−17-demethoxygeldanamycin (17-AAG) | CAS #: 75747-14-7 |
| Chemical compound | 17β-Estradiol | CAS #: 50-28-2 |
| Chemical compound | 3-Hydroxybenzylhydrazine dihydrochloride | CAS #: 81012-99-9 |
| Chemical compound | 6,7-Dihydroxyflavone | CAS #: 38183-04-9 |
| Chemical compound | Acacetin | CAS #: 480-44-4 |
| Chemical compound | Ac-DEVD-CHO (AC) | CAS #: 169332-60-9 |
| Chemical compound | AG-14361 | CAS #: 328543-09-5 |
| Chemical compound | Alpha-lipoic acid | CAS #: 1077-28-7 |
| Chemical compound | Alpha-tochopherol | CAS #: 10191-41-0 |
| Chemical compound | Aluminum chloride hexahydrate | CAS #: 7784-13-6 |
| Chemical compound | Artemisinin (ART) | CAS #: 63968-64-9 |
| Chemical compound | Ascorbic acid | CAS #: 50-81-7 |
| Chemical compound | Calcimycin (CAL) | CAS #: 52665-69-7 |
| Chemical compound | Calpastatin peptide | sigmaaldrich.com: SCP0063 |
| Chemical compound | Calpeptin | CAS #: 117591-20-5 |
| Chemical compound | Caspase-3 Inhibitor VII (CASVII) | CAS #: 745046-84-8 |
| Chemical compound | Caspase-3/7 Inhibitor I (CASI) | CAS #: 1110670-49-9 |
| Chemical compound | Chloroxine (CHL) | CAS #: 773-76-2 |
| Chemical compound | Ciclopirox olamine (CPO) | CAS #: 41621-49-2 |
| Chemical compound | Clonidine | CAS #: 4205-90-7 |
| Chemical compound | Clopidogrel sulfate | CAS #: 120202-66-6 |
| Chemical compound | Cloxyquine (CLO) | CAS #: 130-16-5 |
| Chemical compound | Compactin | CAS #: 73573-88-3 |
| Chemical compound | Cortexolone (COR) | CAS #: 152-58-9 |
| Chemical compound | D-(-)-Norgestrel | CAS #: 797-63-7 |
| Chemical compound | Danthron | CAS #: 117-10-2 |
| Chemical compound | DAPI dihydrochloride | CAS #: 28718-90-3 |
| Chemical compound | Deltaline | CAS #: 6836-11-9 |
| Chemical compound | Dexamethasone | CAS #: 50-02-2 |
| Chemical compound | Diazepam | CAS #: 439-14-5 |
| Chemical compound | Digoxin | CAS #: 20830-75-5 |
| Chemical compound | Dihydroartemisinin | CAS #: 71939-50-9 |
| Chemical compound | E7449 | CAS #: 1140964-99-3 |
| Chemical compound | Entinostat | CAS #: 209783-80-2 |
| Chemical compound | Escitalopram oxalate | CAS #: 219861-08-2 |
| Chemical compound | Eupatorin | CAS #: 855-96-9 |
| Chemical compound | Hoechst 33342 | CAS #: 23491-52-3 |
| Chemical compound | Hydroquinone | CAS #: 123-31-9 |
| Chemical compound | Indomethacin | CAS #: 53-86-1 |
| Chemical compound | Isopropamide Iodide | CAS #: 71-81-8 |
| Chemical compound | Isoxsuprine hydrochloride | CAS #: 579-56-6 |
| Chemical compound | Lactulose | CAS #: 4618-18-2 |
| Chemical compound | Leucovorin Calcium | CAS #: 1492-18-8 |
| Chemical compound | Levobetaxolol | CAS #: 93221-48-8 |
| Chemical compound | Lobeline sulfate | CAS #: 134-64-5 |
| Chemical compound | Lovastatin | CAS #: 75330-75-5 |
| Chemical compound | Magnesium gluconate | CAS #: 3632-91-5 |
| Chemical compound | Menadione | CAS #: 58-27-5 |
| Chemical compound | Mercaptamine hydrochloride | CAS #: 156-57-0 |
| Chemical compound | Methyl-3,4-dephostatin (MD) | PubChem SID #: 24278575 |
| Chemical compound | Metronidazole (MTZ) | CAS #: 443-48-1 |
| Chemical compound | Miconazole (MIC) | CAS #: 22916-47-8 |
| Chemical compound | MnTBAP | CAS #: 55266-18-7 |
| Chemical compound | Myriocin | CAS #: 35891-70-4 |
| Chemical compound | Myrrh oil | UPC #: 640791683602 |
| Chemical compound | N-Acetyl-L-cysteine (NAC) | CAS #: 616-91-1 |
| Chemical compound | Nalidixic acid | CAS #: 389-08-2 |
| Chemical compound | NCS-382 | CAS #: 520505-01-5 |
| Chemical compound | Necrostatin-1 (NET) | CAS #: 4311-88-0 |
| Chemical compound | Niraparib (MK) | CAS #: 1038915-60-4 |
| Chemical compound | NMS-P118 | CAS #: 1262417-51-5 |
| Chemical compound | N-tert-Butyl-α-(2-sulfophenyl)nitrone | CAS #: 73475-11-3 |
| Chemical compound | Olaparib (OLA) | CAS #: 763113-22-0 |
| Chemical compound | Panobinostat | CAS #: 404950-80-7 |
| Chemical compound | Paromomycin (PM) | CAS #: 1263-89-4 |
| Chemical compound | PLGA | CAS #: 26780-50-7 |
| Chemical compound | Pseudoephedrine, (1S,2S)-(+)- | CAS #: 90-82-4 |
| Chemical compound | Retinoic acid (RA) | CAS #: 302-79-4 |
| Chemical compound | Rofecoxib | CAS #: 162011-90-7 |
| Chemical compound | Romidepsin | CAS #: 128517-07-7 |
| Chemical compound | Rosiglitazone | CAS #: 122320-73-4 |
| Chemical compound | Rucaparib (RUC) | CAS #: 283173-50-2 |
| Chemical compound | Streptomycin sulfate | CAS #: 3810-74-0 |
| Chemical compound | Sulindac (SUL) | CAS #: 38194-50-2 |
| Chemical compound | Sunitinib | CAS #: 557795-19-4 |
| Chemical compound | Talazoparib (BMN) | CAS #: 1207456-01-6 |
| Chemical compound | thapsigargin | CAS #: 67526-95-8 |
| Chemical compound | Thiostrepton (ThS) | CAS #: 1393-48-2 |
| Chemical compound | tunicamycin | CAS #: 11089-65-9 |
| Chemical compound | Veliparib (ABT) | CAS #: 912444-00-9 |
| Chemical compound | Vorinostat | CAS #: 149647-78-9 |
| Chemical compound | Warfarin (WAR) | CAS #: 81-81-2 |
| Chemical compound | Xanthurenic acid | CAS #: 59-00-7 |
| Chemical compound | Zinc pyrithione (ZPT) | CAS #: 13463-41-7 |
| Software, algorithm | Software for large-scale in vivo screen data processing (R v3.3.1, R Studio v0.99.903, and the ARQiv2 package) | https://github.com/mummlab/ARQiv2 |
| Software, algorithm | Thermo Scientific HCS Studio Cell Analysis Software | Customized for this project |
| Database | CRISPRScan | https://www.crisprscan.org/ |
Additional files
-
Supplementary file 1
Statistics of Mtz titration assay.
(a) Statistical summary of Mtz titration assay in rho:YFP-NTR zebrafish larvae - Figure 1B. Survival effects (normalized YFP, %), 95% confidence intervals, p-values, and sample sizes (N) for each condition at 7 dpf. Student’s t-test was used to calculate p-values for each condition relative non-ablated controls (0 mM Mtz). Bonferroni correction for multiple comparisons resulted in an adjusted alpha level of 0.01 (α=0.01). Two experimental repeats were performed for each condition and data pooled across replicates (Figure 1—source data 1). (b) Paired compound p-values relative to all control conditions in Figure 7—figure supplement 1. Student’s t-test was used to calculate p-values for each paired condition relative to ablated controls (+Mtz), BMN alone control and NEC alone control for all paired conditions. Bonferroni correction for multiple comparisons resulted in an adjusted significance level of 0.003 (α=0.003). Survival effects as shown in Figure 7—figure supplement 1 are provided for context (Figure 7—figure supplement 1—source data 1). Inhibitor abbreviations: BMN, talazoparib; NEC, necrostatin-1. Other abbreviations: CI, confidence interval; Mtz, Metronidazole; NA, not applicable. (c) Paired compound p-values relative to all control conditions in Figure 10. Student’s t-test was used to calculate p-values for each paired condition relative to ablated controls (+Mtz) and relevant individual compound controls (Cmpd A, top paired compound; Cmpd B, bottom paired compound). Bonferroni correction for multiple comparisons to +Mtz control resulted in an adjusted significance level of 0.002 (α=0.002); significance level for comparisons to individual compound controls was 0.05 (α=0.05). Survival effects as shown in Figure 10 are provided for context (Figure 10—source data 1). Lead compound abbreviations: WAR, Warfarin; CLO, Cloxyquin; CPO, Ciclopirox olamine; MIC, Miconazole; ZPT, Zinc pyrithione; DHA, Dihydroartemisinin; CHL, Chloroxine; CAL, Calcimycin; SUL, Sulindac; ART, Artemesinin; COR, Cortexolone; POS, positive control. Other abbreviations: CI, confidence interval; Mtz, Metronidazole.
- https://cdn.elifesciences.org/articles/57245/elife-57245-supp1-v4.xlsx
-
Supplementary file 2
Previously implicated neuroprotectants.
(a) Compounds tested as positive controls. List of 17 compounds previously reported as neuroprotectants in RP models tested for survival effects in rho:YFP-NTR zebrafish larvae using the primary screening protocol. (b) List of eliminated compounds. Compounds that were autofluorescent (precluding YFP signal detection) or lethal at the concentrations tested (10 mM to 0.625 mM). (c) List of 113 hit compounds. Hit compounds producing a SSMD score ≥1 in the primary screen ordered according to SSMD score. Drug names, concentrations producing SSMD ≥1, SSMD scores, SSMD effect types, and whether a dose-dependent trend was observed or not are shown. Yellow highlighted drugs were selected for confirmation testing. ‘'●” denotes confirmed lead compounds (source data). (d) On-label MOA for 113 hit compounds. Implicated MOA categories and subcategories are listed in order from most common to least common. The number of compounds per each category/subcategory are provided in the parentheses and compound names are listed.
- https://cdn.elifesciences.org/articles/57245/elife-57245-supp2-v4.docx
-
Supplementary file 3
Oligonucleotides used for sgRNA synthesis (gene knockdown) and qPCR primers.
Abbreviations: parp1, poly (ADP-ribose) polymerase 1; ripk1l, receptor (TNFRSF)-interacting serine-threonine kinase 1, like; casp3a: caspase 3, apoptosis-related cysteine peptidase a; casp3b: caspase 3, apoptosis-related cysteine peptidase b; tdp1, tyrosyl-DNA phosphodiesterase 1; actb1: actin, beta 1; rplp0: ribosomal protein, large, P0.
- https://cdn.elifesciences.org/articles/57245/elife-57245-supp3-v4.docx
Download links
A two-part list of links to download the article, or parts of the article, in various formats.
Downloads (link to download the article as PDF)
Open citations (links to open the citations from this article in various online reference manager services)
Cite this article (links to download the citations from this article in formats compatible with various reference manager tools)
Large-scale phenotypic drug screen identifies neuroprotectants in zebrafish and mouse models of retinitis pigmentosa
eLife 10:e57245.
https://doi.org/10.7554/eLife.57245


