Erasable labeling of neuronal activity using a reversible calcium marker
- Howard Hughes Medical Institute, Janelia Research Campus, United States
Figures
Figure 1 with 9 supplements
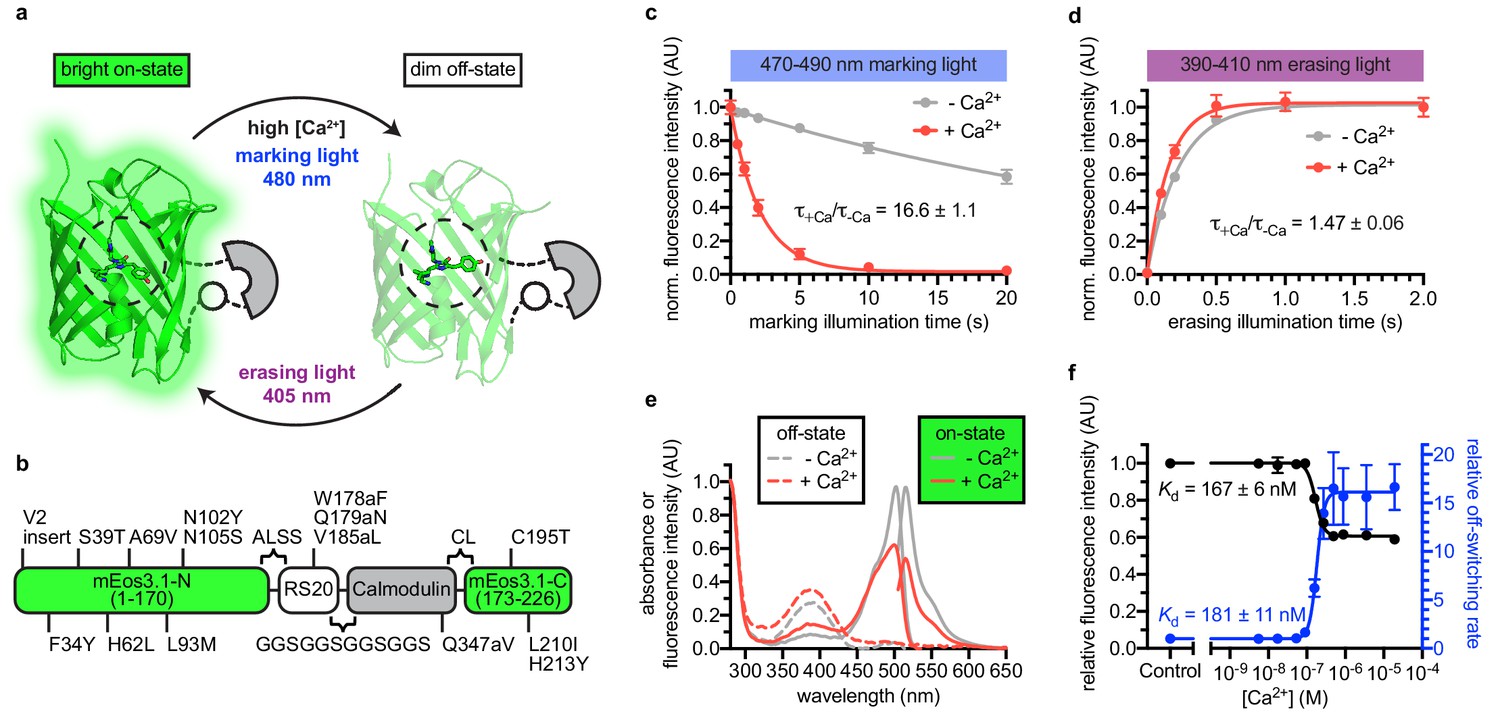
Engineering and in vitro characterization of rsCaMPARI.
(a) Schematic of rsCaMPARI function. (b) Primary structure of rsCaMPARI relative to mEos3.1. (c) Off-switching time-course of rsCaMPARI under marking light illumination (200 mW/cm2) in the presence or absence of calcium. Lines are single-exponential fits to data. Error bars are standard deviation, n = 4 replicate measurements. (d) On-switching time-course of rsCaMPARI under erasing light illumination (200 mW/cm2) in the presence or absence of calcium. Lines are single-exponential fits to data. Error bars are standard deviation, n = 4 replicate measurements. (e) Spectral properties of rsCaMPARI. Absorbance or fluorescence emission spectra of rsCaMPARI in the fluorescent on-state in the presence or absence of calcium shown with solid traces. Absorbance spectra of rsCaMPARI in the non-fluorescent off-state in the presence or absence of calcium shown with dashed traces. (f) Relative fluorescence intensity and relative off-switching rate of rsCaMPARI as a function of free [Ca2+]. Lines are sigmoidal fits to data. Error bars are standard deviation, n = 4 replicate measurements.
-
Figure 1—source data 1
Off-switching time-course of rsCaMPARI under marking light illumination in the presence or absence of calcium.
- https://cdn.elifesciences.org/articles/57249/elife-57249-fig1-data1-v1.xlsx
-
Figure 1—source data 2
On-switching time-course of rsCaMPARI under erasing light illumination in the presence or absence of calcium.
- https://cdn.elifesciences.org/articles/57249/elife-57249-fig1-data2-v1.xlsx
-
Figure 1—source data 3
Relative fluorescence intensity and relative off-switching rate of rsCaMPARI as a function of free [Ca2+].
- https://cdn.elifesciences.org/articles/57249/elife-57249-fig1-data3-v1.xlsx
Figure 1—figure supplement 1
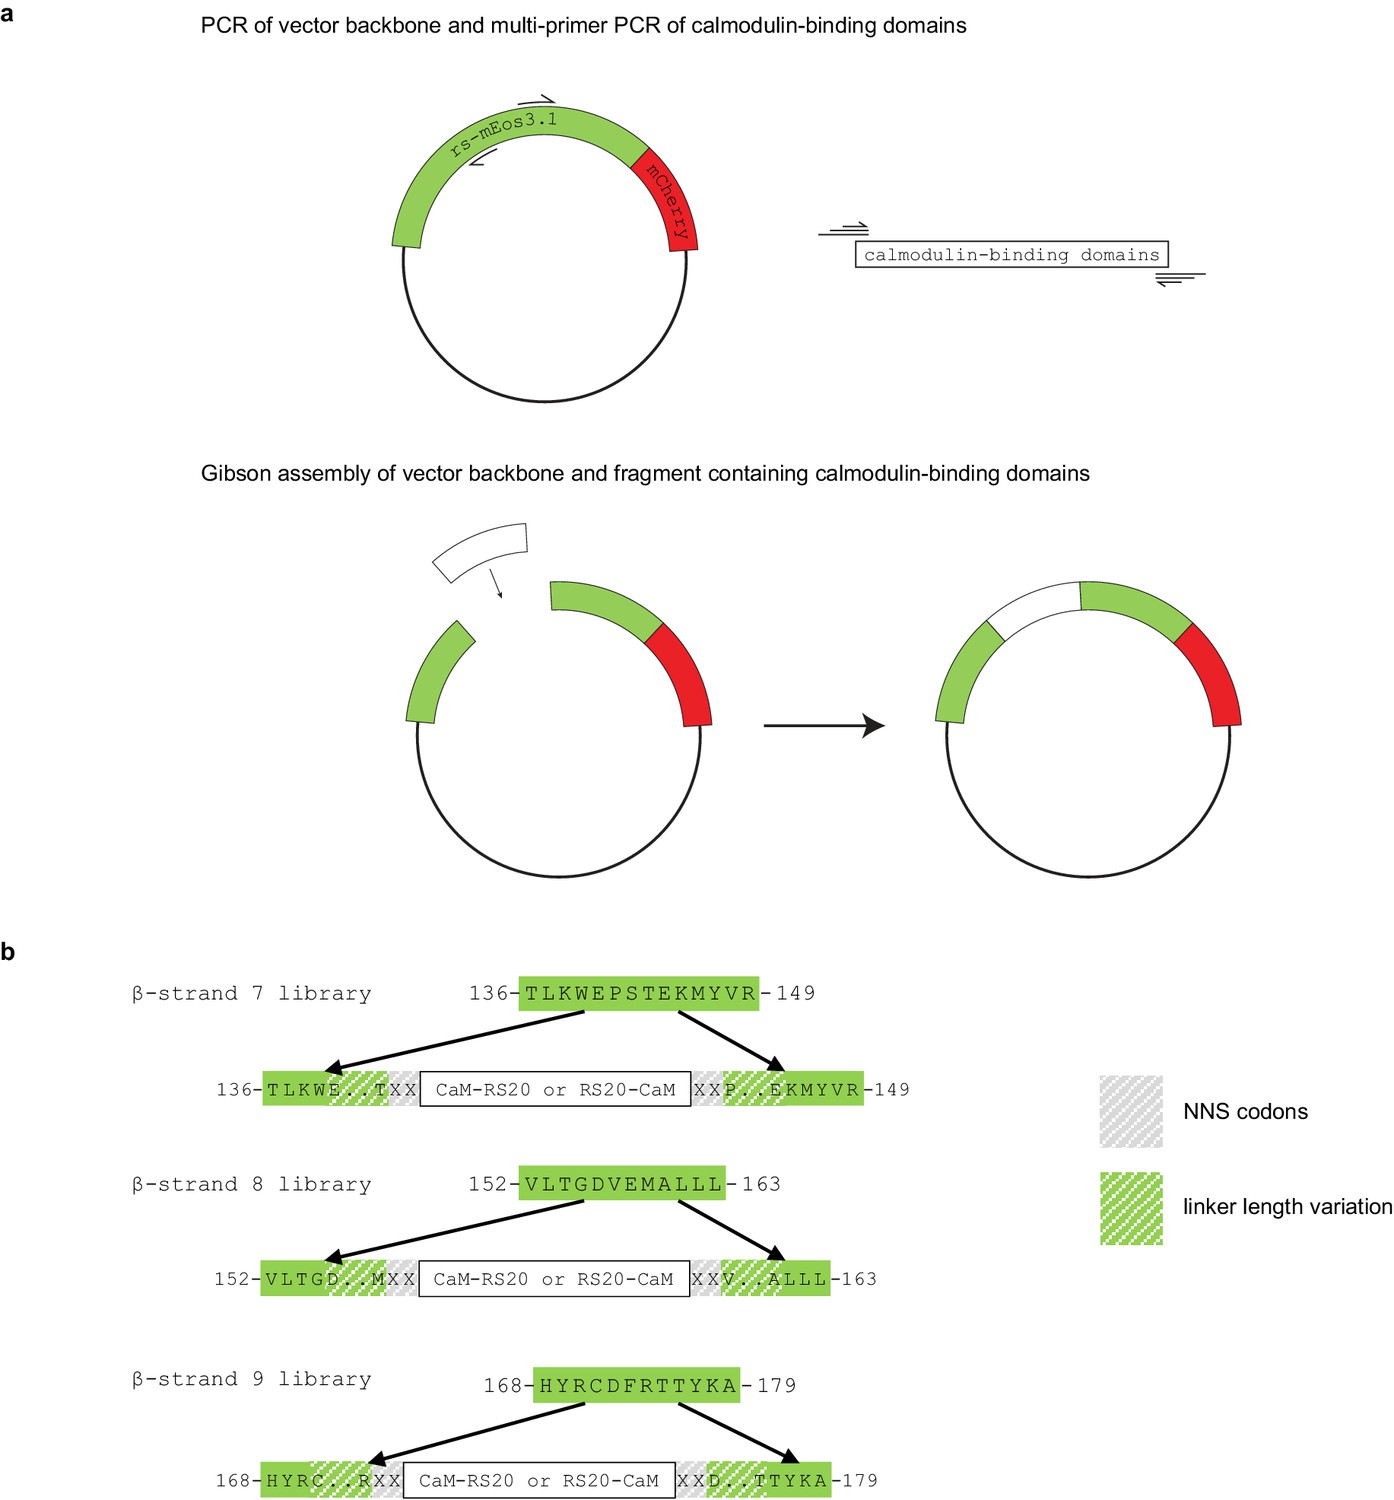
Design and construction of libraries to engineer an erasable calcium activity marker.
(a) Outline of Gibson assembly strategy for constructing insertion libraries of calmodulin-binding domains into a reversibly photoswitchable variant of mEos3.1 (rs-mEos3.1). (b) Theoretical amino acid composition of insertion variants for each β-strand library. Partially shaded grey boxes are randomized amino acids encoded by NNS codons and partial shaded green boxes are linker length variants from 0 to 4 amino acids extended from the native β-strand. For example, the N-terminal linker of the β-strand seven library could be XX, EXX, EPXX, EPSXX, or EPSTXX. Similarly, the C-terminal linker could be XX, XXE, XXTE, XXSTE, or XXPSTE. Theoretical diversity for each β-strand library is 8 × 10⁶.
Figure 1—figure supplement 2
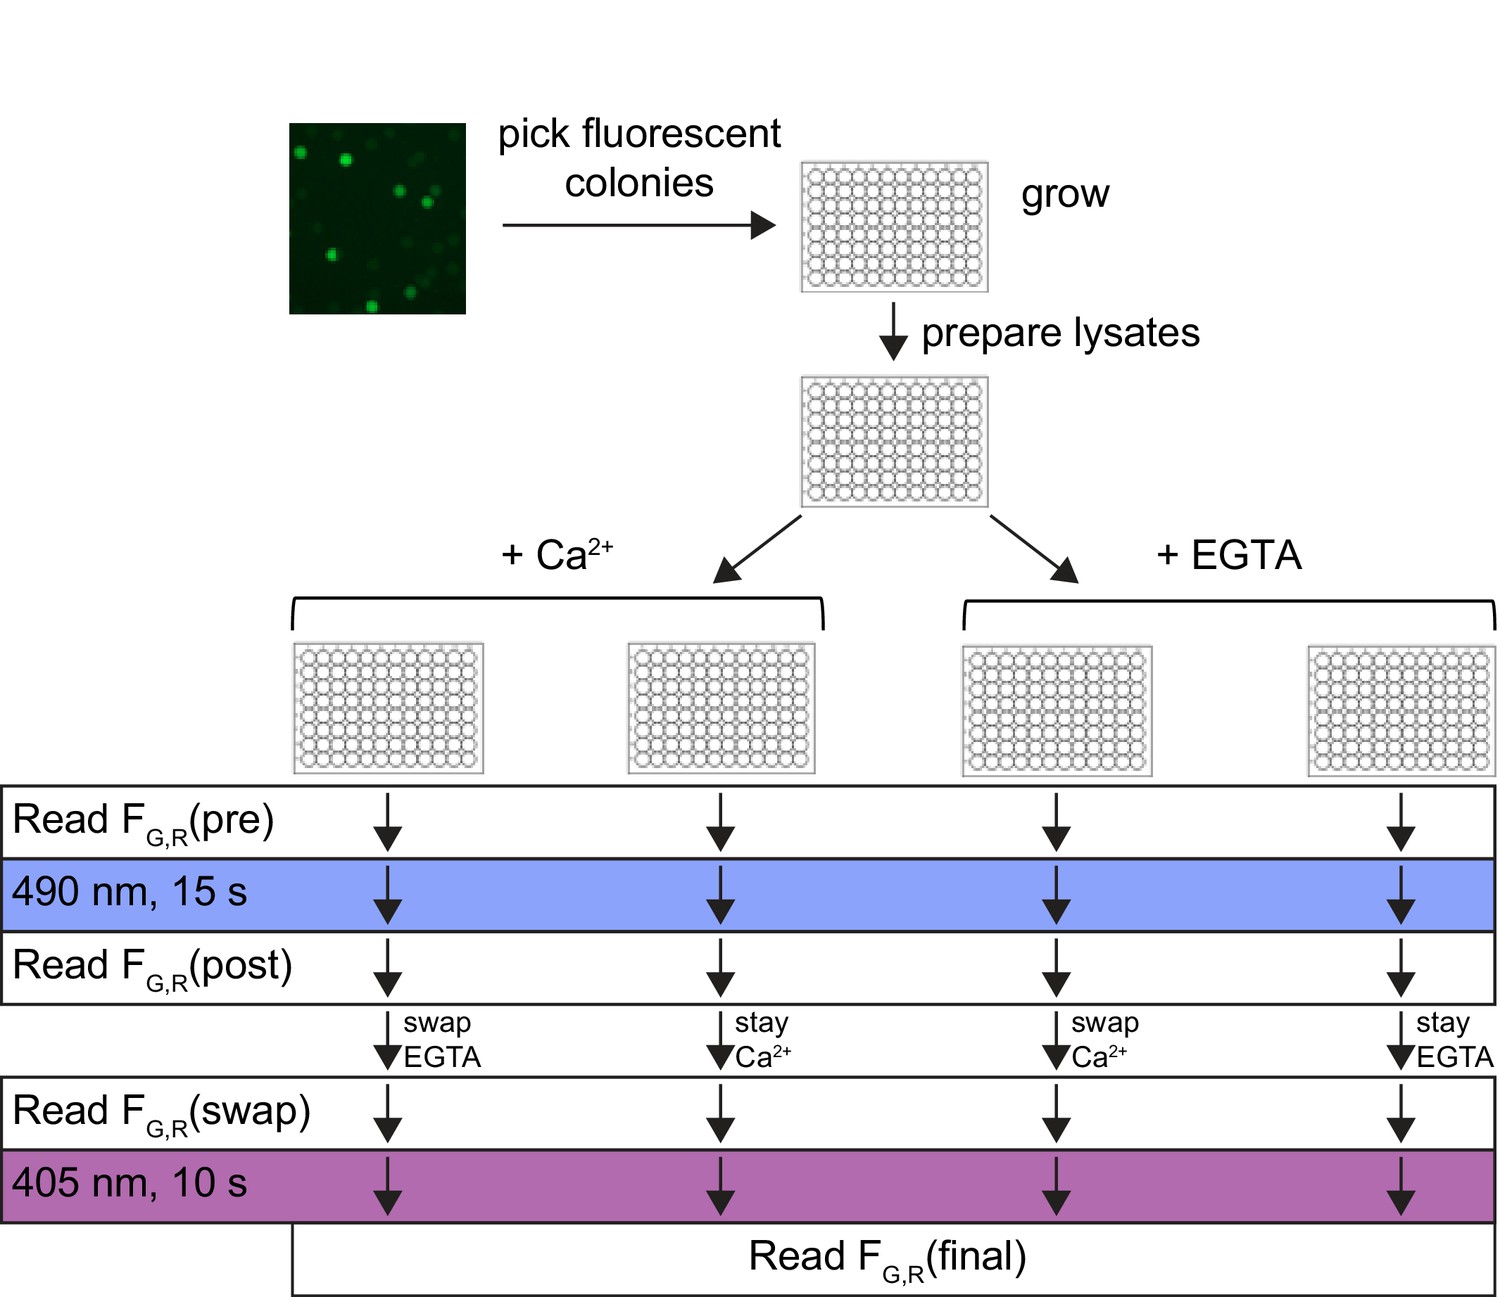
Outline of library screening to engineer rsCaMPARI.
Light intensities for 490 nm and 405 nm light illumination are 170 mW/cm2 and 200 mW/cm2, respectively. Initial concentration for Ca2+ and EGTA are 0.5 mM and 1 mM, respectively. Concentrations for swapped Ca2+ and EGTA are 5 mM and 10 mM, respectively.
Figure 1—figure supplement 3
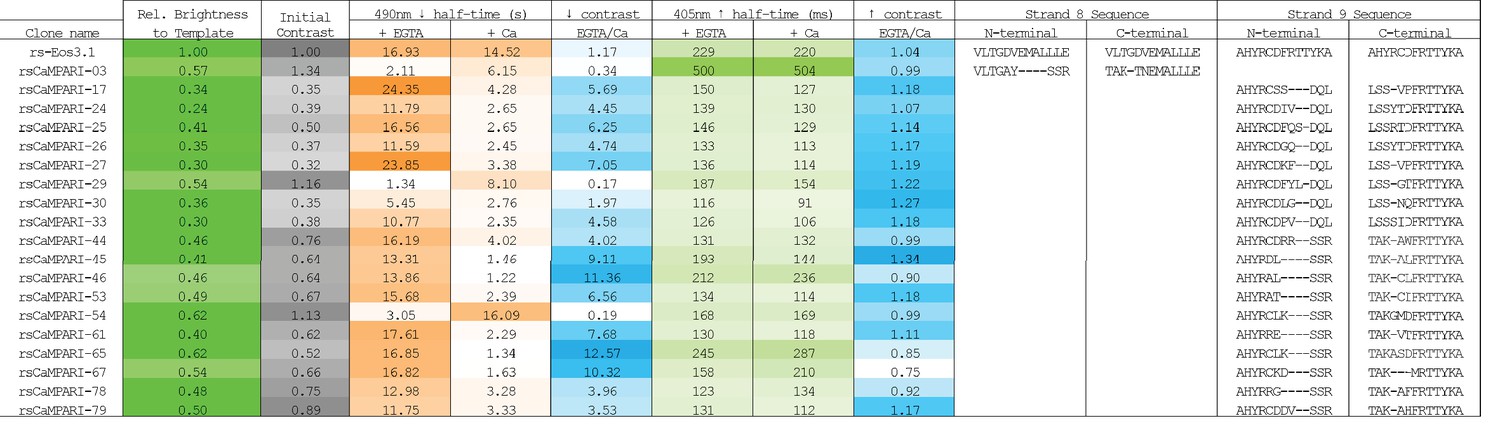
In vitro characterization of variants selected from library screening.
Nineteen selected variants from calcium-binding domain insertion screen are shown. Relative brightness is green fluorescence normalized to mCherry red fluorescence and the template rs-Eos3.1. Initial contrast is initial green fluorescence in Ca2+ (0.5 mM) divided by the initial green fluorescence in EGTA (1 mM). Tabulated half-times are extrapolated from single exponential fits to the photoswitching time-course when purified protein is illuminated by 490 nm (170 mW/cm2) or 405 nm (200 mW/cm2) light.
Figure 1—figure supplement 4
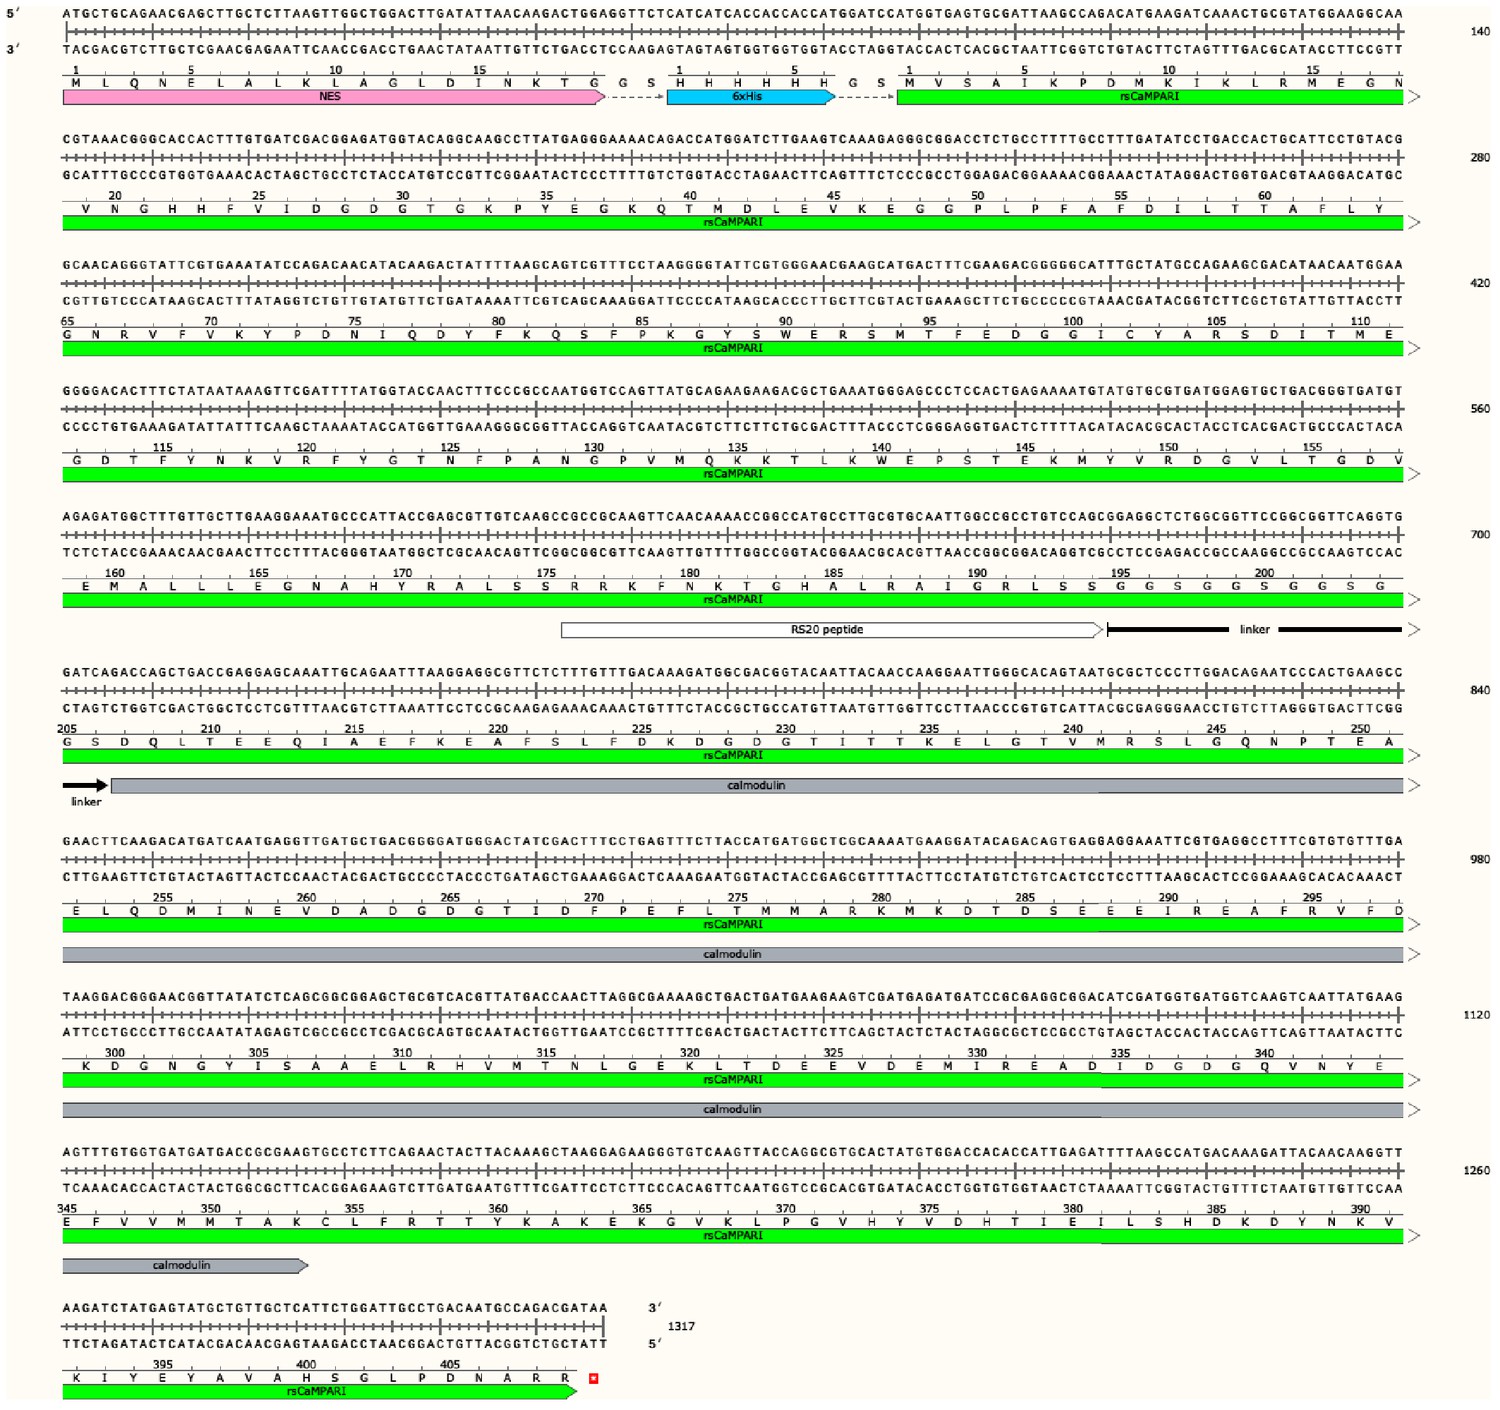
DNA and amino acid sequence of rsCaMPARI with sequence features annotated.
A nuclear export signal (NES) is added to the N-terminus for excluding rsCaMPARI from the nucleus when expressed in eukaryotic cells.
Figure 1—figure supplement 5
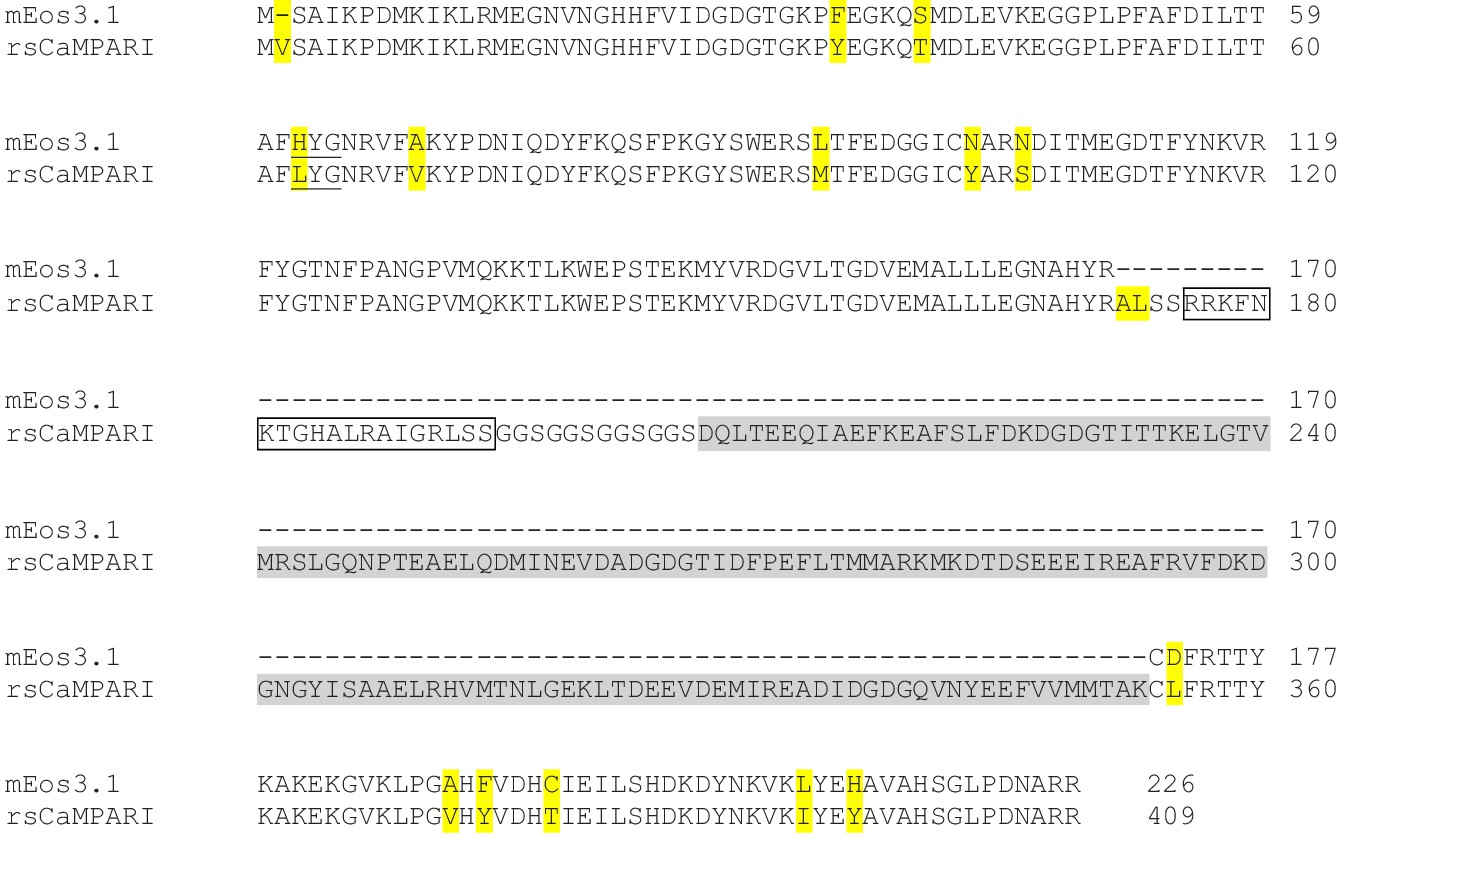
Amino acid sequence comparison of rsCaMPARI with mEos3.1.
Point mutations between rsCaMPARI and mEos3.1 outside of the calcium-binding domains are highlighted in yellow. The chromophore is underlined, the RS20 calmodulin-binding peptide is outlined with a box, and calmodulin is shaded in grey.
Figure 1—figure supplement 6
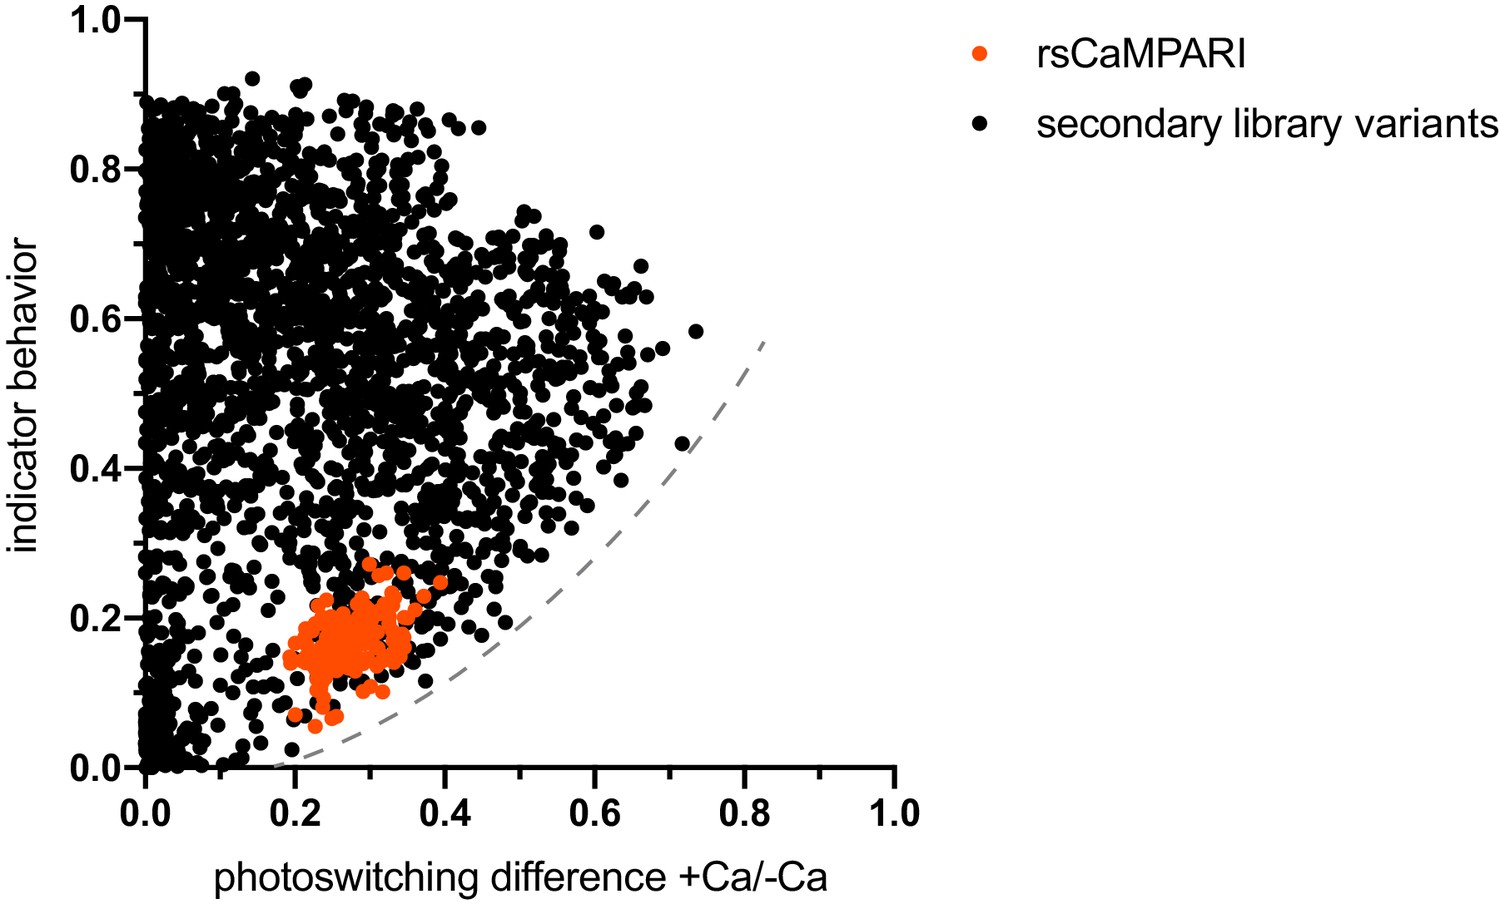
rsCaMPARI secondary library screen showing relationship between photoswitching contrast and indicator behavior.
rsCaMPARI controls are shown in red and secondary library variants are shown in black. A dashed grey line illustrates a boundary beyond which no variants with high photoswitching contrast and low indicator behavior were observed.
Figure 1—figure supplement 7
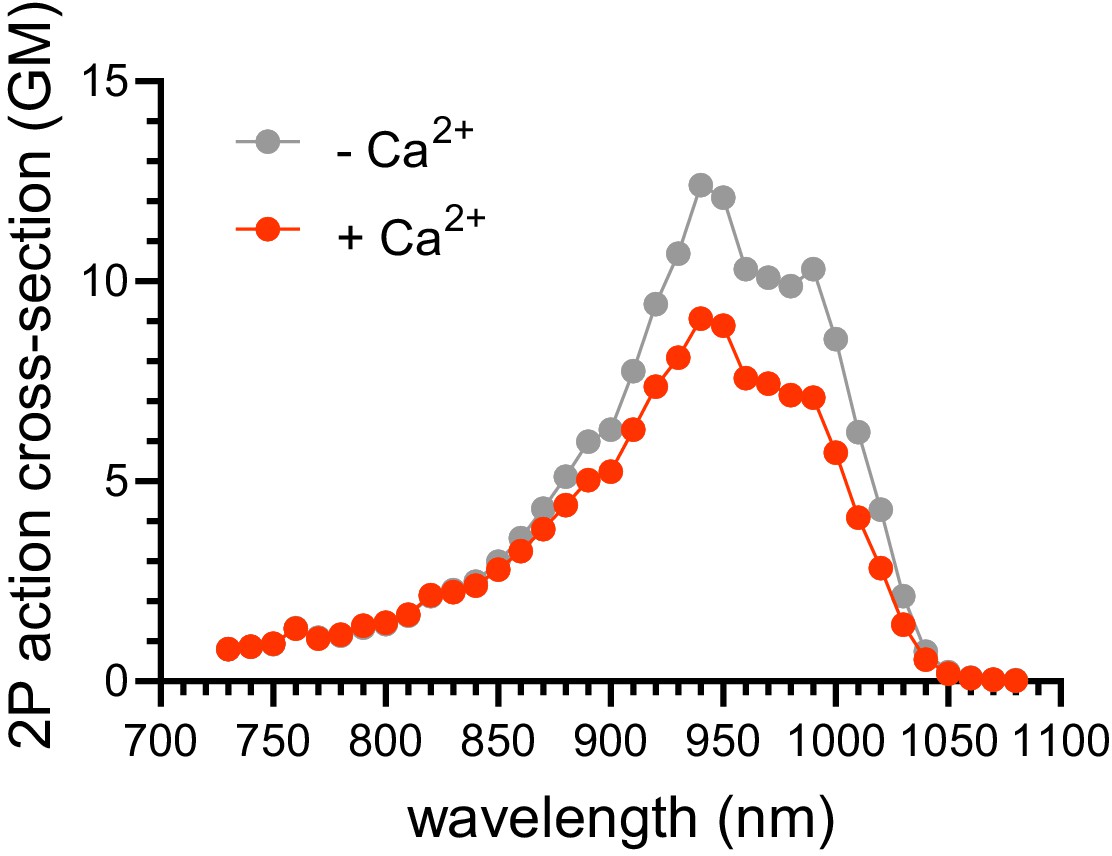
Two-photon action cross-section of rsCaMPARI in the presence and absence of Ca2+.
Figure 1—figure supplement 8
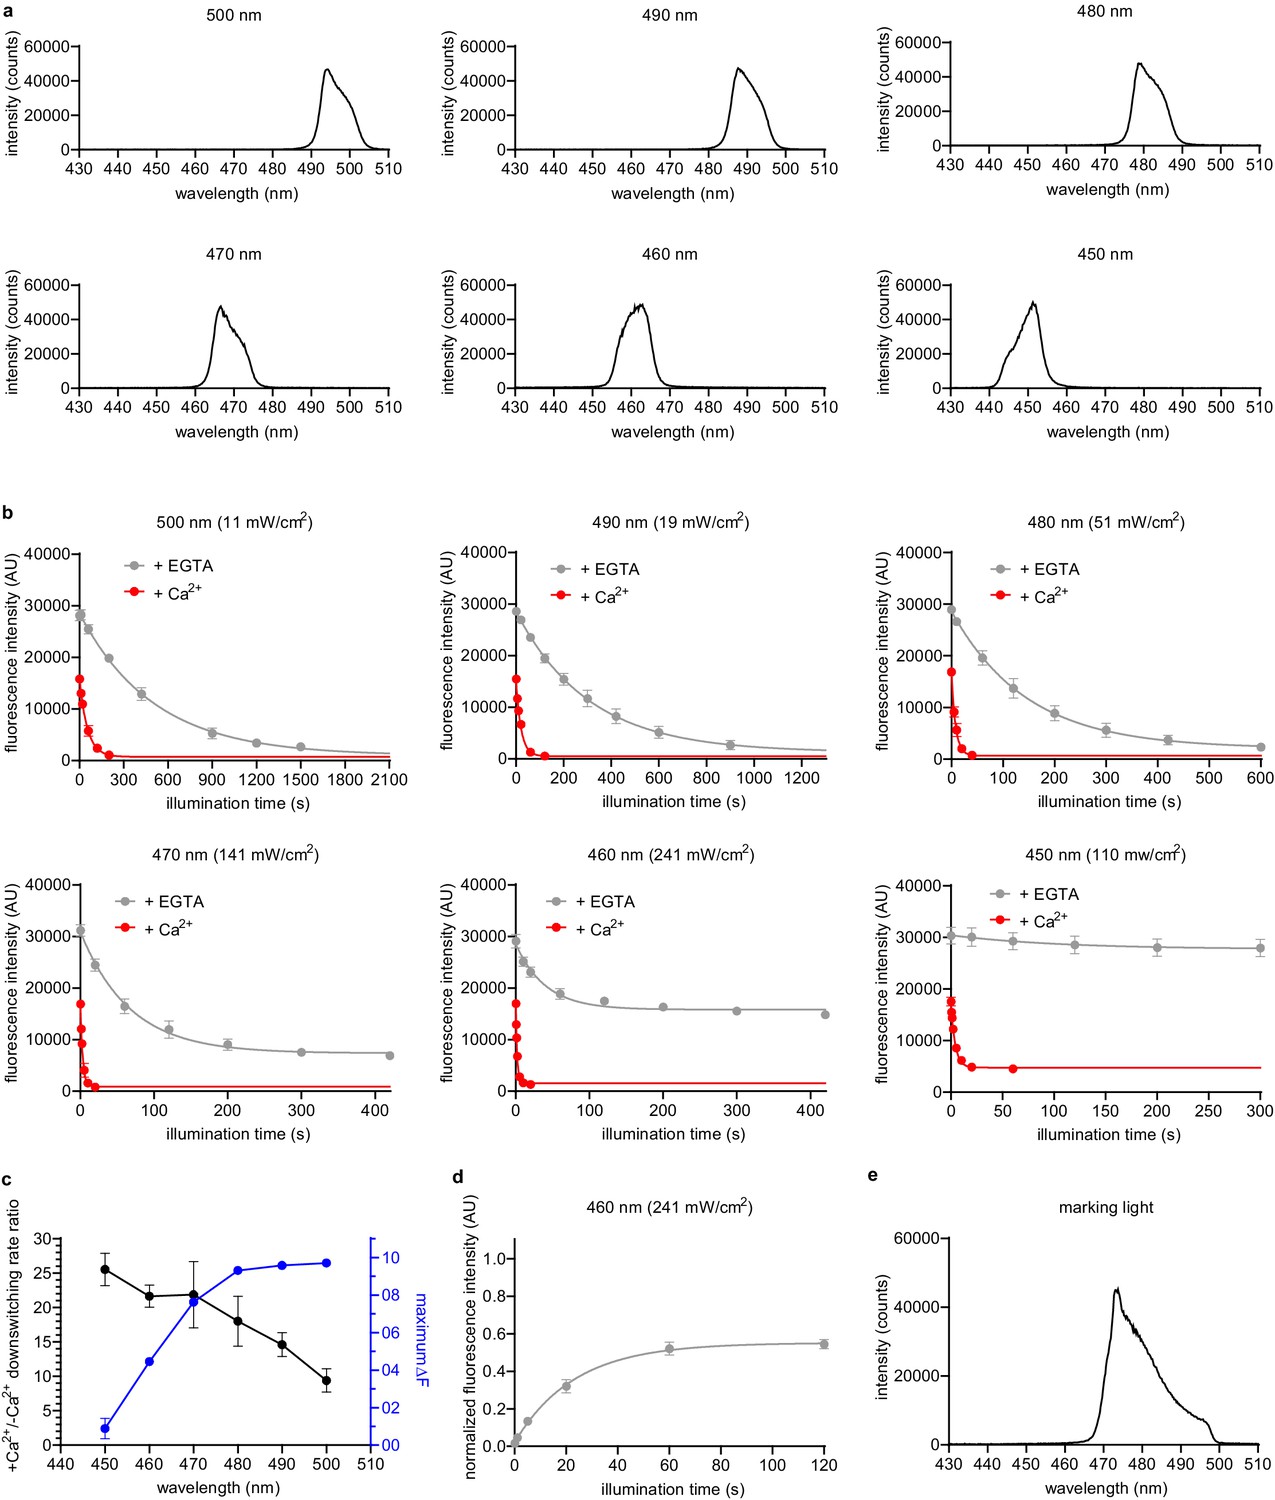
Optimization of blue light wavelengths for off-switching of rsCaMPARI.
(a) Spectra of bandpass filters tested. (b) Off-switching time-course of rsCaMPARI in the presence or absence of calcium under illumination of blue light with spectra shown in (a). Lines are single-exponential fits to data. Error bars are standard deviation, n = 4 replicate measurements. (c) Off-switching rate contrast and maximum fluorescence change (ΔF) as a function of wavelength. Error bars are standard deviation, n = 4 replicate measurements. (d) On-switching time-course of rsCaMPARI from dim off-state under illumination with 460 nm light. Line is single-exponential fit to data. Error bars are standard deviation, n = 4 replicate measurements. (e) Spectra of marking light from a Mightex 470 nm LED filtered through a Chroma 485/25x filter.
-
Figure 1—figure supplement 8—source data 1
Off-switching time-course of rsCaMPARI in the presence or absence of calcium under various wavelengths of light illumination.
- https://cdn.elifesciences.org/articles/57249/elife-57249-fig1-figsupp8-data1-v1.xlsx
-
Figure 1—figure supplement 8—source data 2
Off-switching rate contrast and maximum fluorescence change (ΔF) as a function of wavelength.
- https://cdn.elifesciences.org/articles/57249/elife-57249-fig1-figsupp8-data2-v1.xlsx
-
Figure 1—figure supplement 8—source data 3
On-switching time-course of rsCaMPARI from dim off-state under illumination with 460 nm light.
- https://cdn.elifesciences.org/articles/57249/elife-57249-fig1-figsupp8-data3-v1.xlsx
Figure 1—figure supplement 9
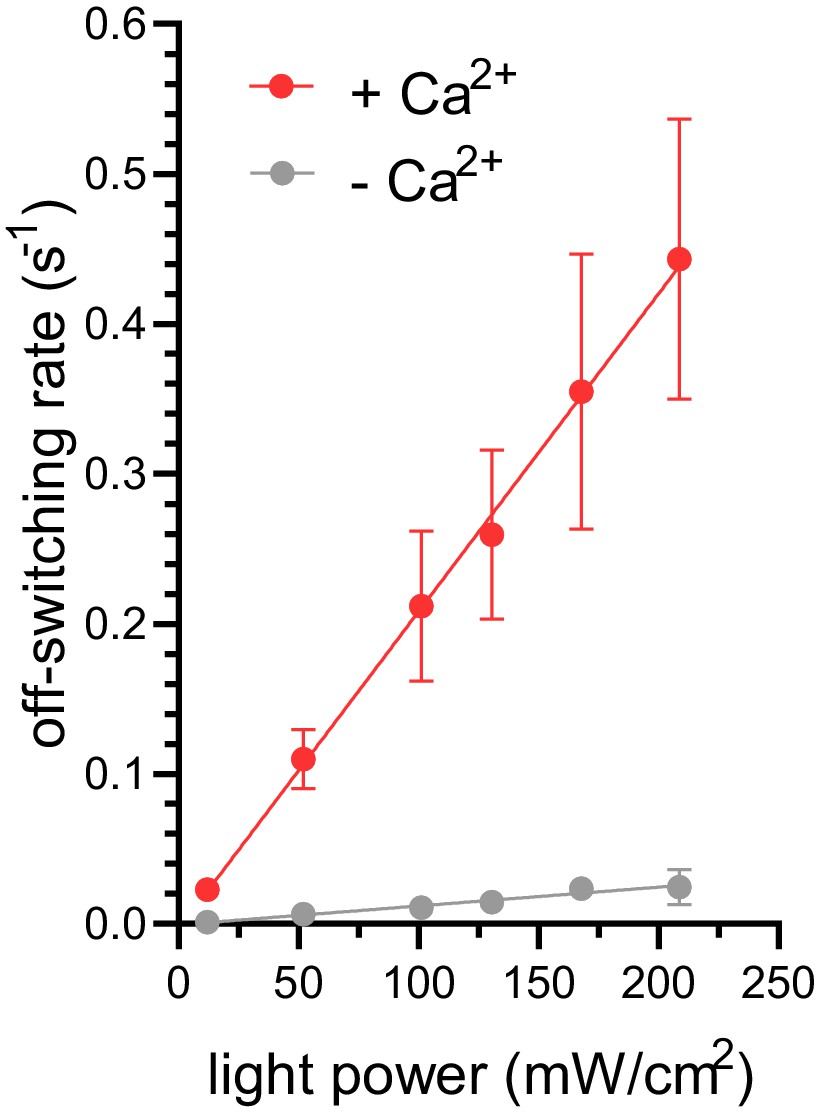
The relationship between rsCaMPARI off-switching rate and light power intensity.
Fitted lines are a simple linear regression to data. Error bars are standard deviation, n = 2 replicate measurements.
-
Figure 1—figure supplement 9—source data 1
The relationship between rsCaMPARI off-switching rate and light power intensity.
- https://cdn.elifesciences.org/articles/57249/elife-57249-fig1-figsupp9-data1-v1.xlsx
Figure 2 with 4 supplements
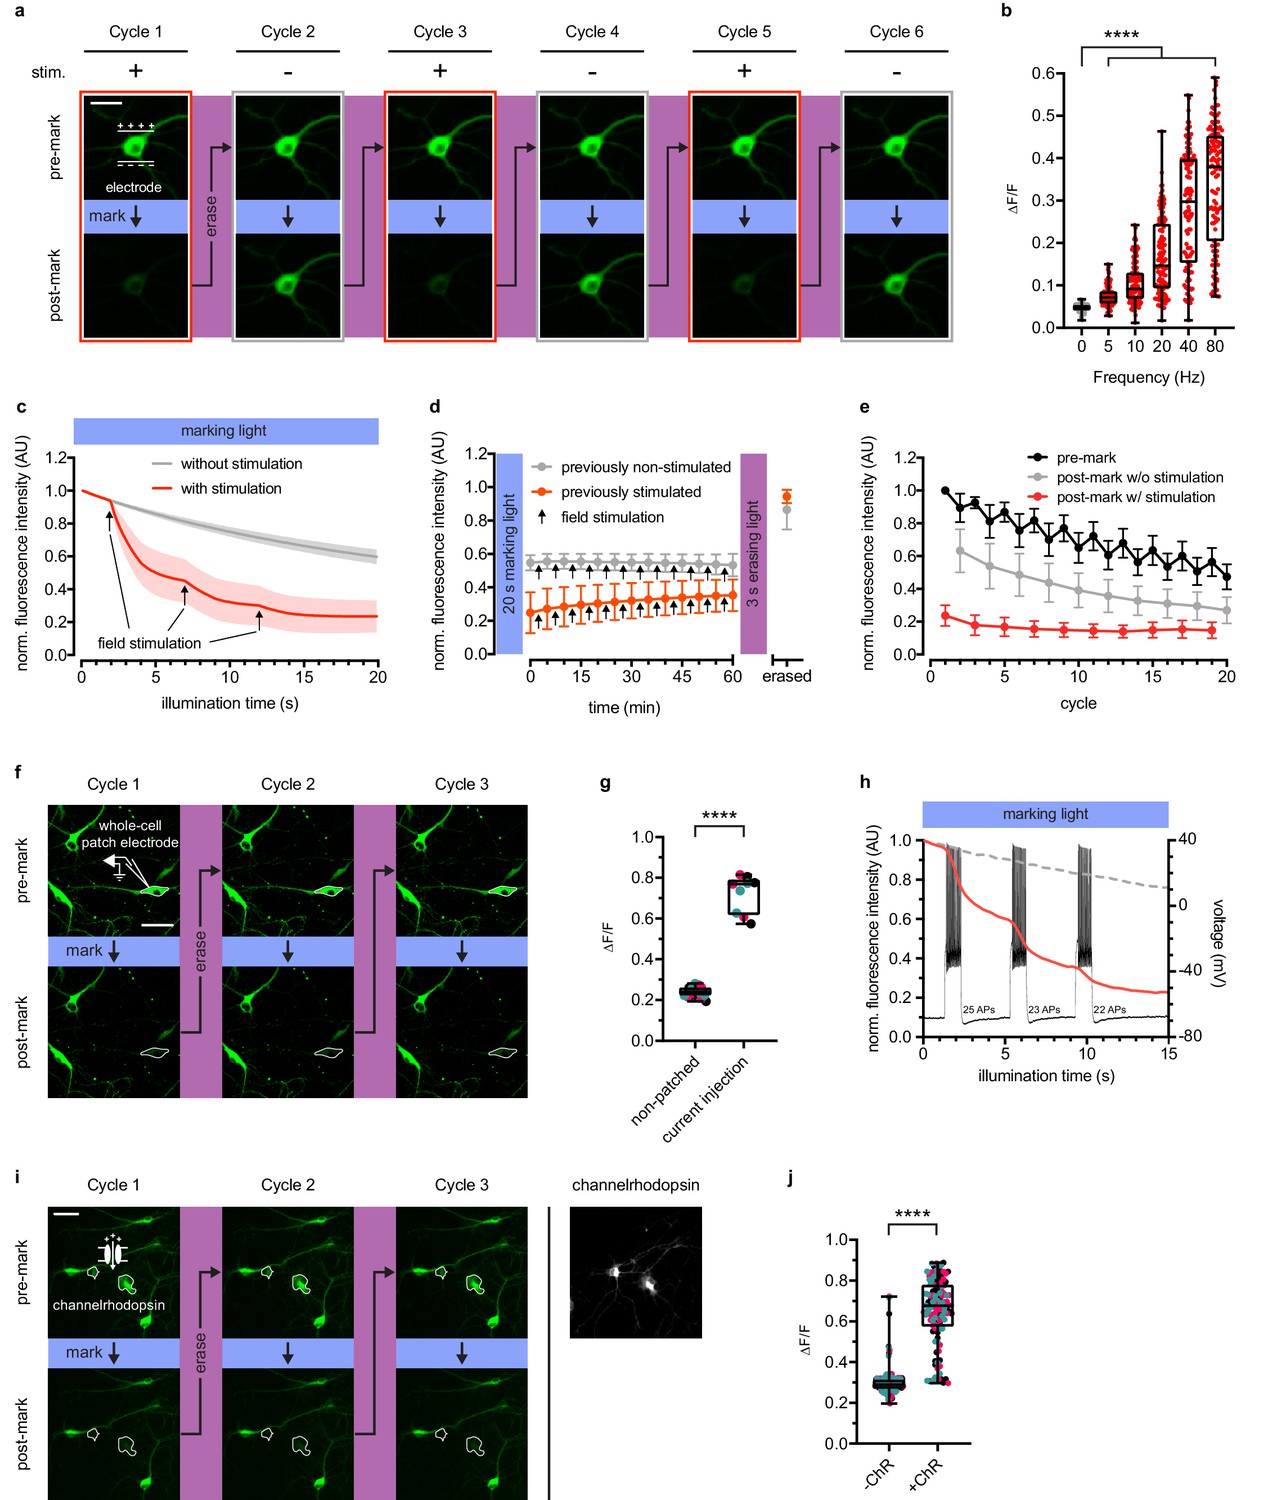
rsCaMPARI reversibly and selectively marks activity in primary neurons.
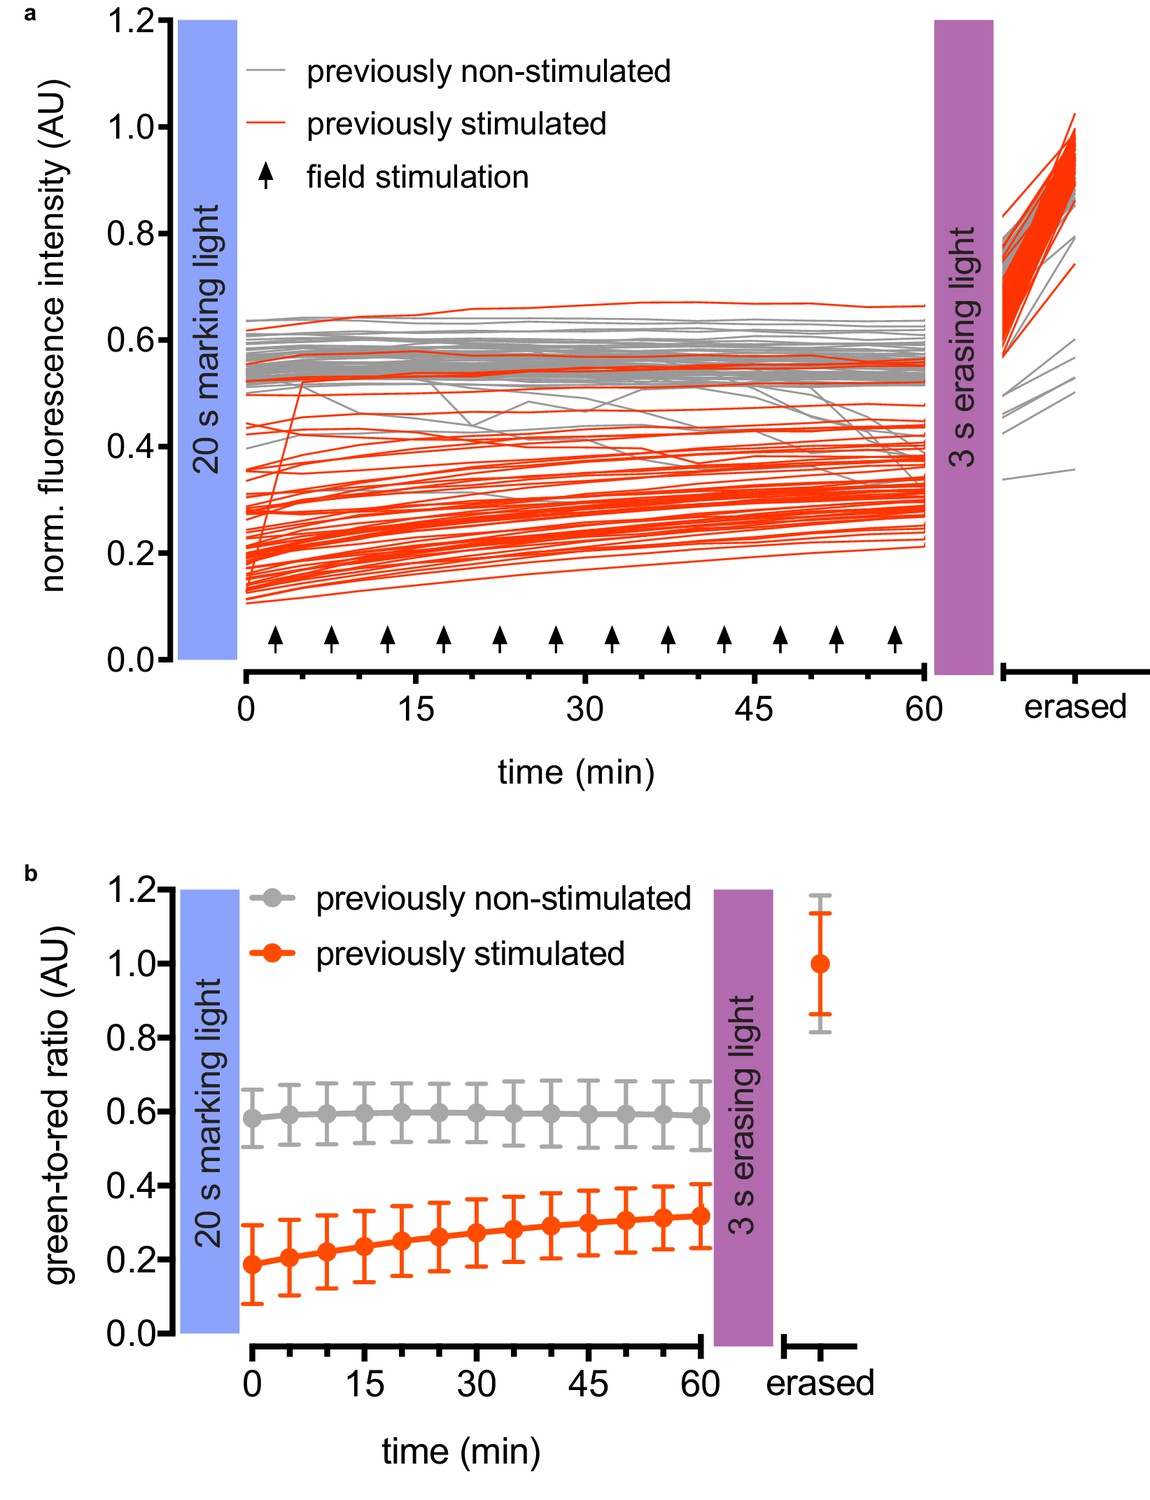
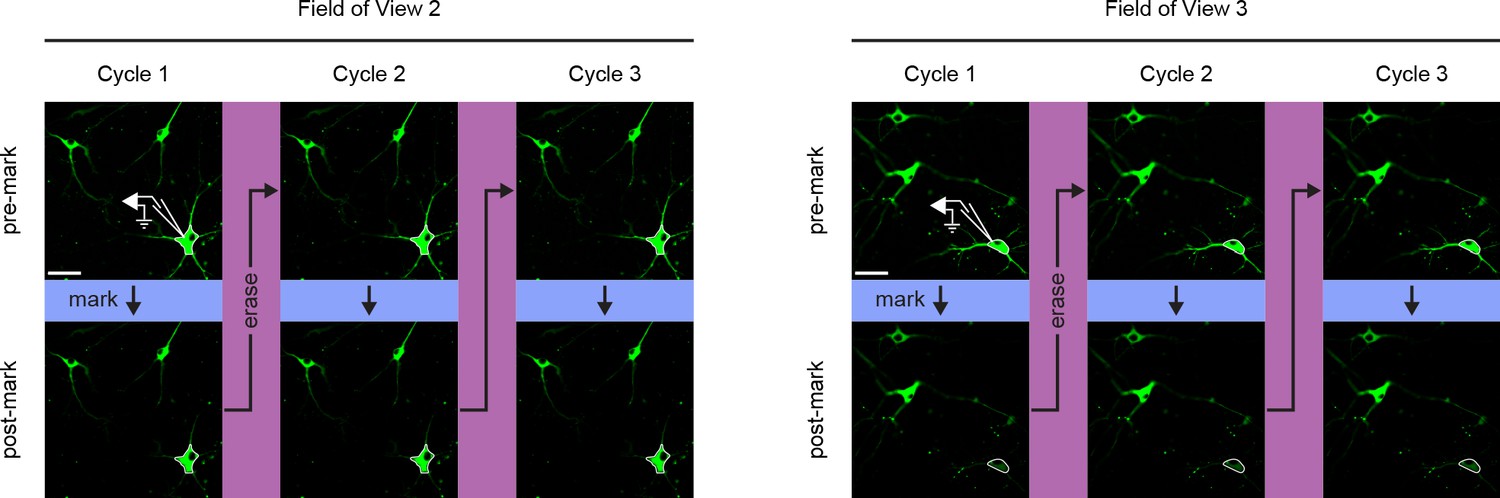
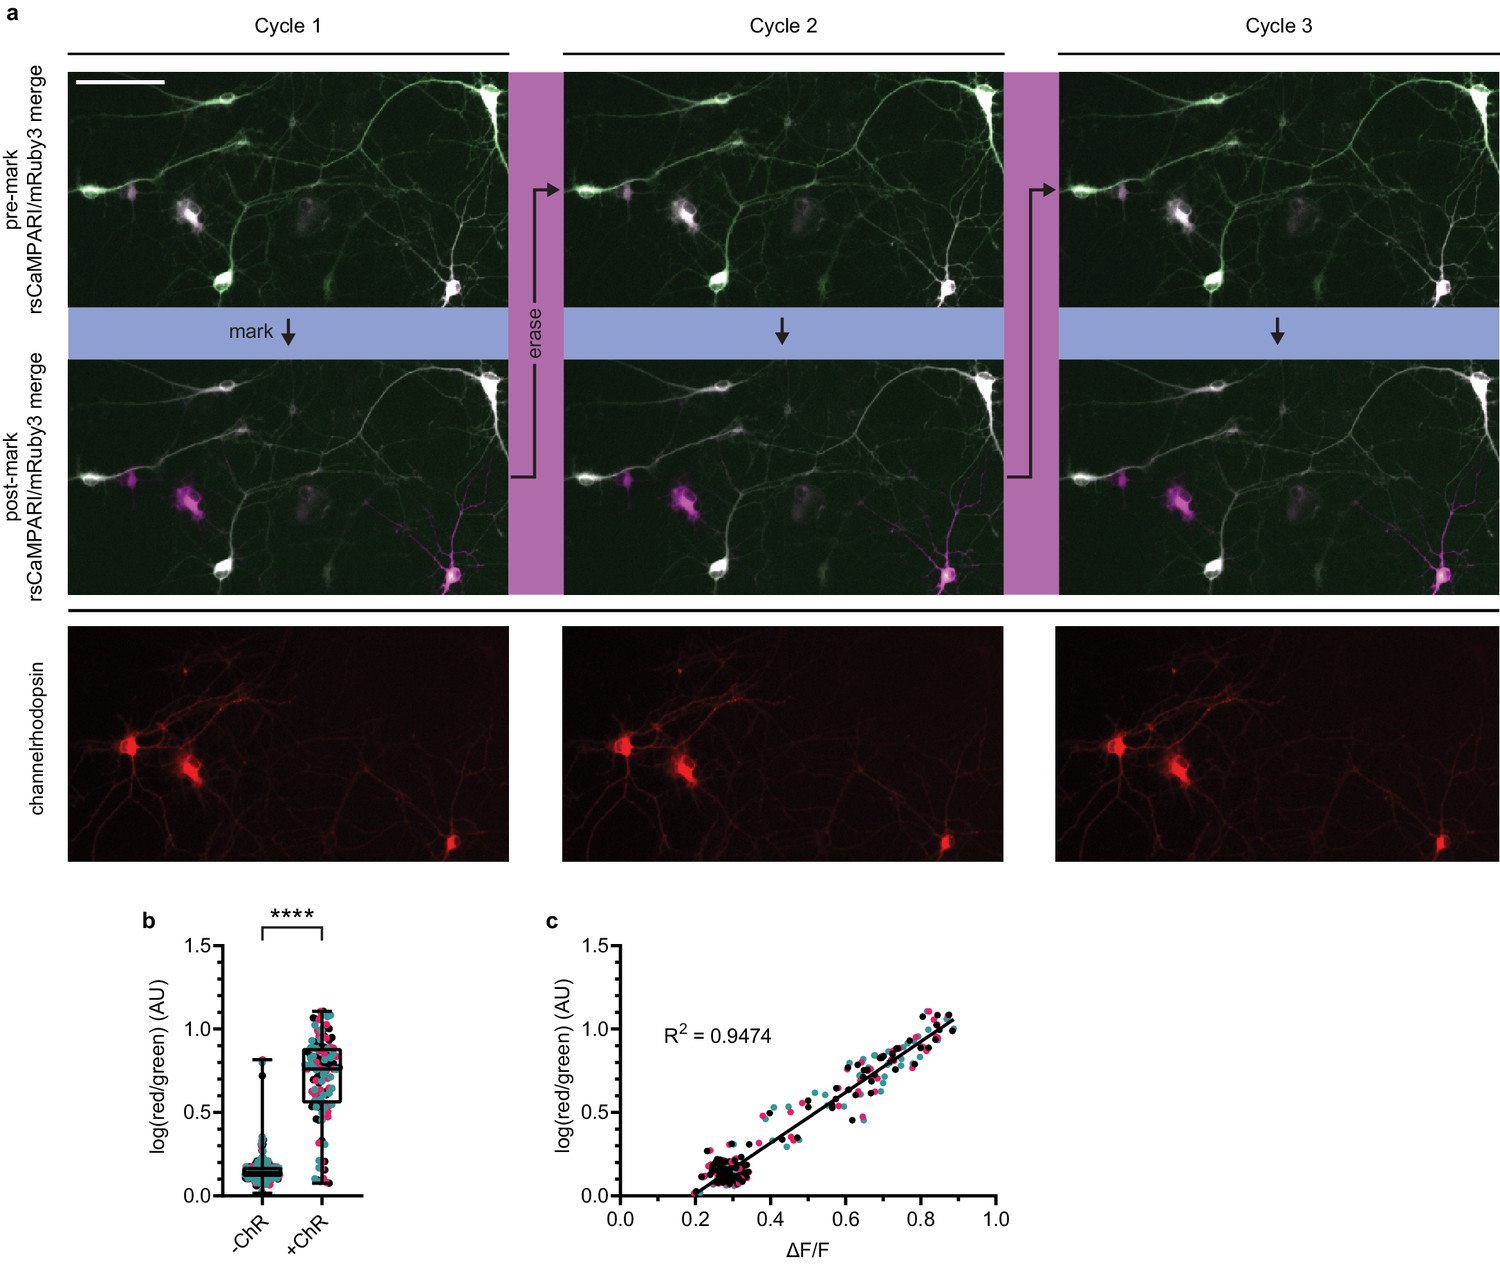
(a) Fluorescence images of a representative primary rat hippocampal neuron undergoing multiple cycles of exposure to a 10 s window of marking light (224 mW/cm2) ± field stimulation (2 × 160 stimulations at 80 Hz). Each cycle was reset with a 3-s pulse of erasing light (224 mW/cm2). Scale bar is 30 μm. (b) Quantification of ΔF/F of individual neurons (n = 119 neurons from four independent wells) ± field stimulations from 5 to 80 Hz during a 2-s pulse of marking light. Boxplot whiskers extend from minimum to maximum values and box extends from 25th to 75th percentile. Middle line in box is the median. ****p<0.0001, two-tailed Student’s t-test. (c) Fluorescence time-course traces of neurons undergoing one cycle of illumination ± stimulation (3 × 160 stims at 80 Hz). Arrows on time-course trace denote start of each stimulation. Error bars are standard deviation, n = 15 neurons from two independent wells. (d) Time-course of rsCaMPARI spontaneous recovery in the dark at 37°C following marking light illumination using previously non-stimulated or previously stimulated neurons prepared under similar conditions as (c). Arrows denote a bout of field stimulation between each imaging timepoint (160 stims at 80 Hz). After 1 hr, the neurons were reset with a 3-s pulse of erasing light. Error bars are standard deviation, n = 66 previously non-stimulated neurons and n = 59 previously stimulated neurons from two independent wells. (e) Photofatigue of rsCaMPARI over successive cycles of marking light illumination with or without field stimulation. Each cycle is followed by erasing light to reset the sensor. Error bars are standard deviation, n = 7 neurons from three independent wells. (f) Fluorescence images of rsCaMPARI before and after 15 s of marking light illumination (150 mW/cm2). A single cell, denoted by pipette drawing, was patched and stimulated to fire action potentials by injecting current during marking light illumination. Scale bar is 50 μm. (g) Quantification of ΔF/F of individual neurons across three marking cycles for patched (n = 3 neurons from three independent wells) and non-patched cells (n = 8 neurons from three independent wells). Cyan, red, and black data points are measurements from the first, second, and third cycles, respectively. ****p<0.0001, two-tailed Student’s t-test. (h) Single-trial recording of action potentials from current injection during the first cycle in patched neuron shown in (f) using fluorescence imaging (red trace) or electrophysiology to measure membrane potential (black trace). Average fluorescence traces of non-patched neurons are shown as dashed grey trace. (i) Fluorescence images of rsCaMPARI before and after 10 s of marking light illumination (285 mW/cm2) (left panels). Two neurons denoted by a white outline are positive for channelrhodopsin (ChR) expression. Right-most panel is a fluorescence image of channelrhodopsin expression. Scale bar is 100 μm. (j) Quantification of ΔF/F of individual neurons across three marking cycles for +ChR (n = 42 neurons from 17 independent wells) and -ChR (n = 79 neurons from 17 independent wells) cells. Cyan, red, and black data points are measurements from the first, second, and third cycles, respectively. ****p<0.0001, Wilcoxon rank-sum test.
-
Figure 2—source data 1
ΔF/F values of individual neurons ± field stimulations from 5 to 80 Hz during a 2-s pulse of marking light.
- https://cdn.elifesciences.org/articles/57249/elife-57249-fig2-data1-v1.xlsx
-
Figure 2—source data 2
Fluorescence time-course of neurons undergoing one cycle of illumination ± stimulation (3 × 160 stims at 80 Hz).
- https://cdn.elifesciences.org/articles/57249/elife-57249-fig2-data2-v1.xlsx
-
Figure 2—source data 3
Time-course of rsCaMPARI spontaneous recovery in the dark at 37°C following marking light illumination.
Previously stimulated neurons were stimulated (3 × 160 stims at 80 Hz) during 20 s marking light illumination. Previously non-stimulated neurons were not stimulated during 20 s marking light illumination.
- https://cdn.elifesciences.org/articles/57249/elife-57249-fig2-data3-v1.xlsx
-
Figure 2—source data 4
Photofatigue of rsCaMPARI over successive cycles of marking light illumination with or without field stimulation.
- https://cdn.elifesciences.org/articles/57249/elife-57249-fig2-data4-v1.xlsx
-
Figure 2—source data 5
Quantification of ΔF/F of individual neurons across three marking cycles for patched and non-patched cells.
- https://cdn.elifesciences.org/articles/57249/elife-57249-fig2-data5-v1.xlsx
-
Figure 2—source data 6
Fluorescence time-course of rsCaMPARI in patched and non-patched cells during marking light illumination.
The patched cell was stimulated to fire action potentials using current injection as described in Materials and methods.
- https://cdn.elifesciences.org/articles/57249/elife-57249-fig2-data6-v1.xlsx
-
Figure 2—source data 7
Quantification of ΔF/F of individual neurons across three marking cycles for +ChR and -ChR cells.
- https://cdn.elifesciences.org/articles/57249/elife-57249-fig2-data7-v1.xlsx
Figure 2—figure supplement 1
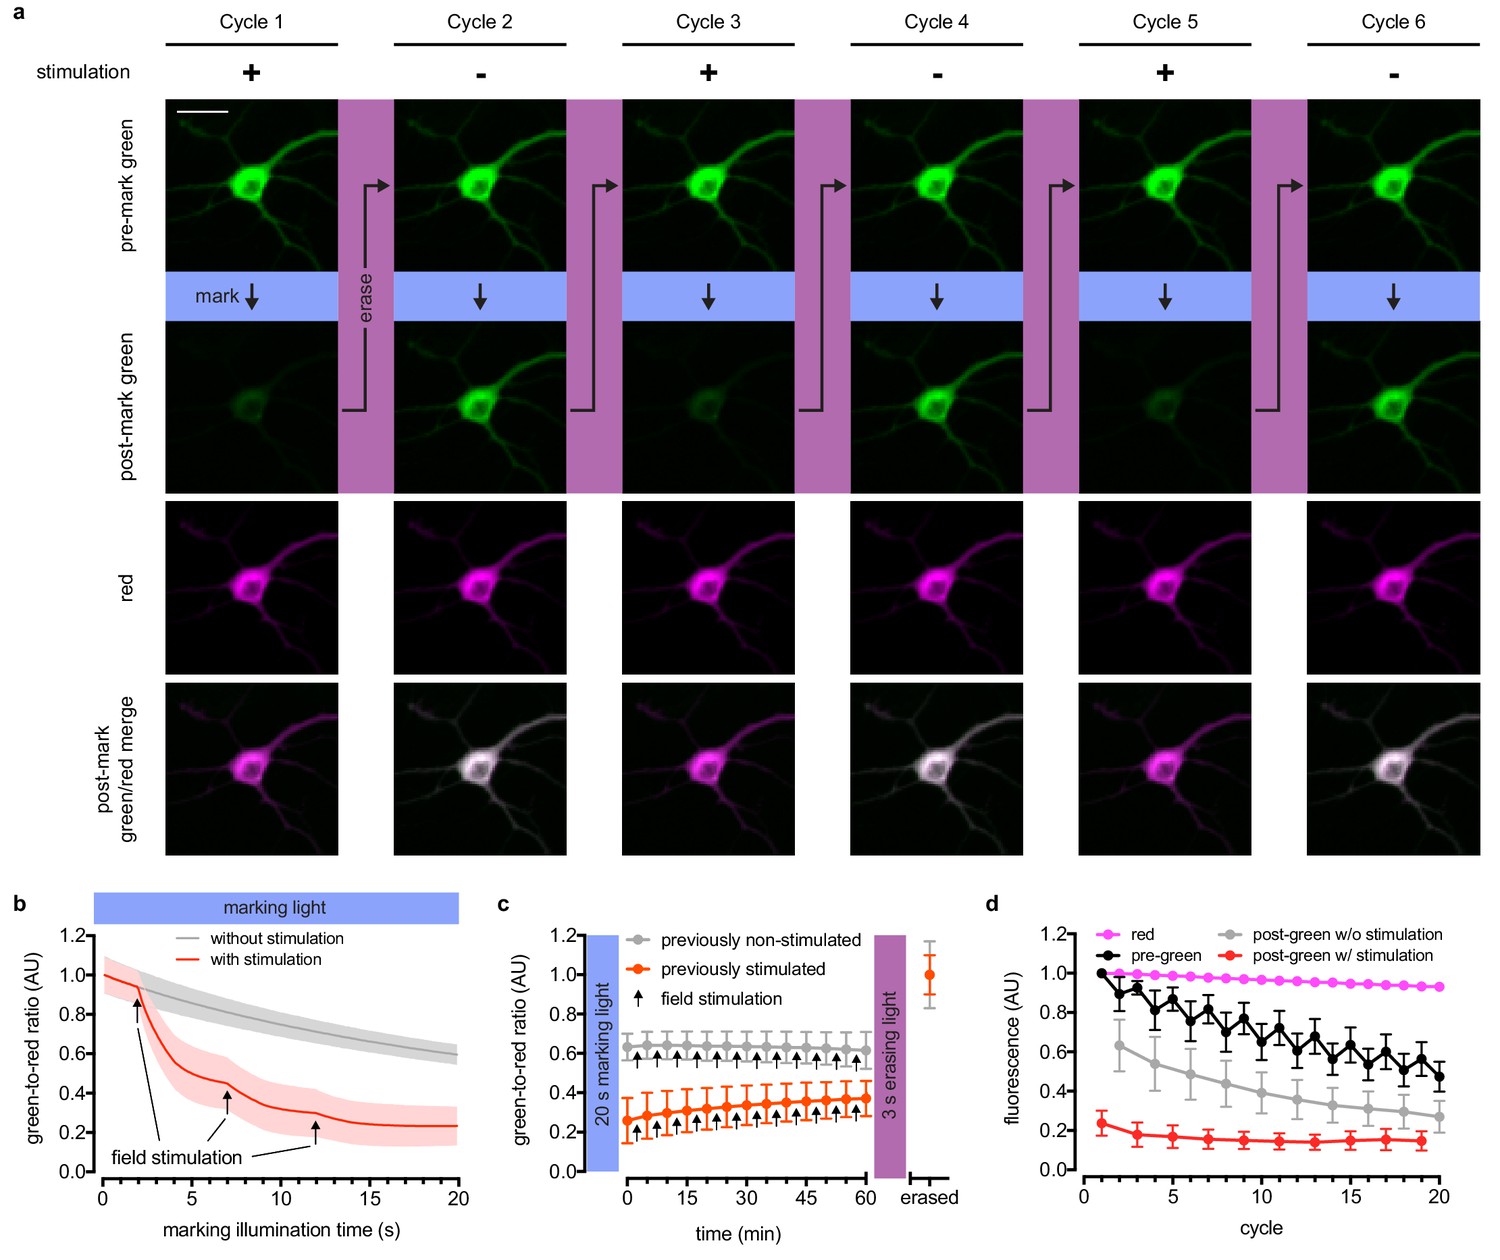
rsCaMPARI marks neurons stimulated by a field electrode (data from Figure 2a and c–e normalized using mRuby3).
(a) Fluorescence images of rsCaMPARI-mRuby3 in a representative neuron undergoing multiple cycles of exposure to a 10-s window of marking light (224 mW/cm2) ± stimulation (2 × 160 stims at 80 Hz). Each cycle was reset with a 3-s pulse of erasing light (224 mW/cm2). Scale bar is 30 μm. (b) Fluorescence time-course traces of neurons undergoing one cycle of illumination ± stimulation (3 × 160 stims at 80 Hz). Arrows on time-course trace denote start of each stimulation. Error bars are standard deviation, n = 15 neurons from two independent wells. (c) Time-course of rsCaMPARI spontaneous recovery in the dark at 37°C following marking light illumination of previously non-stimulated or previously stimulated neurons. Arrows denote a bout of field stimulation between each imaging timepoint (160 stims at 80 Hz). After 1 hr, the neurons were reset with a 3-s pulse of erasing light. Error bars are standard deviation, previously non-stimulated n = 66 neurons and previously stimulated n = 59 neurons from two independent wells. (d) Photofatigue of rsCaMPARI over successive cycles of marking light illumination with or without field stimulation. Each cycle is followed by erasing light to reset the sensor. Error bars are standard deviation, n = 7 neurons from three independent wells.
-
Figure 2—figure supplement 1—source data 1
Fluorescence time-course of neurons undergoing one cycle of illumination ± stimulation (3 × 160 stims at 80 Hz).
- https://cdn.elifesciences.org/articles/57249/elife-57249-fig2-figsupp1-data1-v1.xlsx
-
Figure 2—figure supplement 1—source data 2
Time-course of rsCaMPARI-mRuby3 spontaneous recovery in the dark at 37°C following marking light illumination.
Previously stimulated neurons were stimulated (3 × 160 stims at 80 Hz) during 20 s marking light illumination. Previously non-stimulated neurons were not stimulated during 20 s marking light illumination.
- https://cdn.elifesciences.org/articles/57249/elife-57249-fig2-figsupp1-data2-v1.xlsx
-
Figure 2—figure supplement 1—source data 3
Photofatigue of rsCaMPARI-mRuby3 over successive cycles of marking light illumination with or without field stimulation.
- https://cdn.elifesciences.org/articles/57249/elife-57249-fig2-figsupp1-data3-v1.xlsx
Figure 2—figure supplement 2
Spontaneous recovery of rsCaMPARI.
(a) Same data as shown in Figure 2d except individual traces are shown. (b), Time-course of rsCaMPARI spontaneous recovery in the dark at 37°C following blue light illumination of previously non-stimulated or previously stimulated neurons. No stimulations were delivered between each imaging timepoint. After 1 hr, the neurons were reset with a 3-s pulse of erasing light. Error bars are standard deviation, previously non-stimulated n = 66 neurons and previously stimulated n = 66 neurons from two independent wells.
-
Figure 2—figure supplement 2—source data 1
Time-course of rsCaMPARI-mRuby3 spontaneous recovery in the dark at 37°C following marking light illumination.
No stimulations were delivered between each timepoint.
- https://cdn.elifesciences.org/articles/57249/elife-57249-fig2-figsupp2-data1-v1.xlsx
Figure 2—figure supplement 3
rsCaMPARI selectively marks neurons stimulated by current injection through a patch pipette.
Fluorescence images of rsCaMPARI expressed in dissociated primary rat hippocampal neurons before and after 15 s of marking light illumination. A single cell, denoted by pipette drawing, is patched and stimulated during marking light illumination. Scale bar is 50 μm. Quantification of ΔF/F are shown in Figure 2G.
Figure 2—figure supplement 4
rsCaMPARI selectively marks neurons activated by a channelrhodopsin (data from Figure 2i–j normalized using mRuby3).
(a) Merged rsCaMPARI (green) and mRuby3 (magenta) fluorescence images pre- and post-marking light illumination (285 mW/cm2, 10 s) from three cycles. Neurons expressing ChrimsonR-HaloTag labeled with JF635 HaloTag ligand (red) are shown in bottom panels. Scale bar is 100 μm. (b) Logarithm of the red-to-green fluorescence ratios of -ChR and +ChR neurons post-marking light illumination. +ChR n = 42 neurons and -ChR n = 79 neurons from 17 independent wells. Cyan, red, and black data points are measurements from the first, second, and third cycles, respectively. ****p<0.0001, Wilcoxon rank-sum test. (c) Linear regression of the relationship between the logarithm of red-to-green ratio and ΔF/F.
-
Figure 2—figure supplement 4—source data 1
Logarithm values of the red-to-green fluorescence ratios of -ChR and +ChR neurons post-marking light illumination.
- https://cdn.elifesciences.org/articles/57249/elife-57249-fig2-figsupp4-data1-v1.xlsx
-
Figure 2—figure supplement 4—source data 2
The relationship between log(red/green) values and ΔF/F.
- https://cdn.elifesciences.org/articles/57249/elife-57249-fig2-figsupp4-data2-v1.xlsx
Figure 3 with 5 supplements
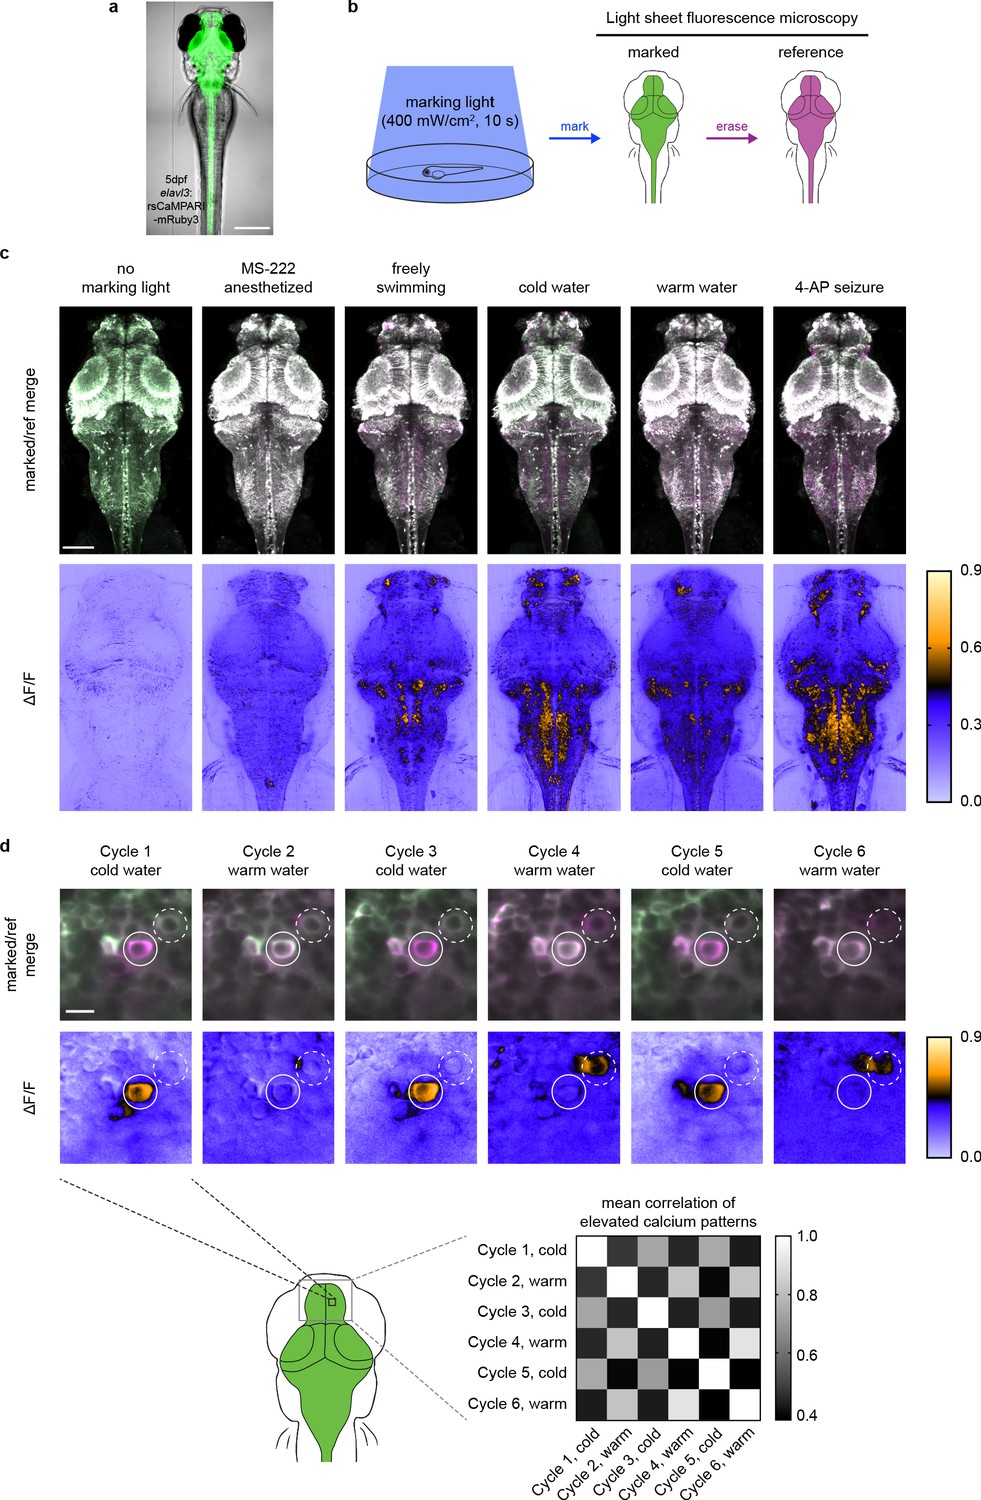
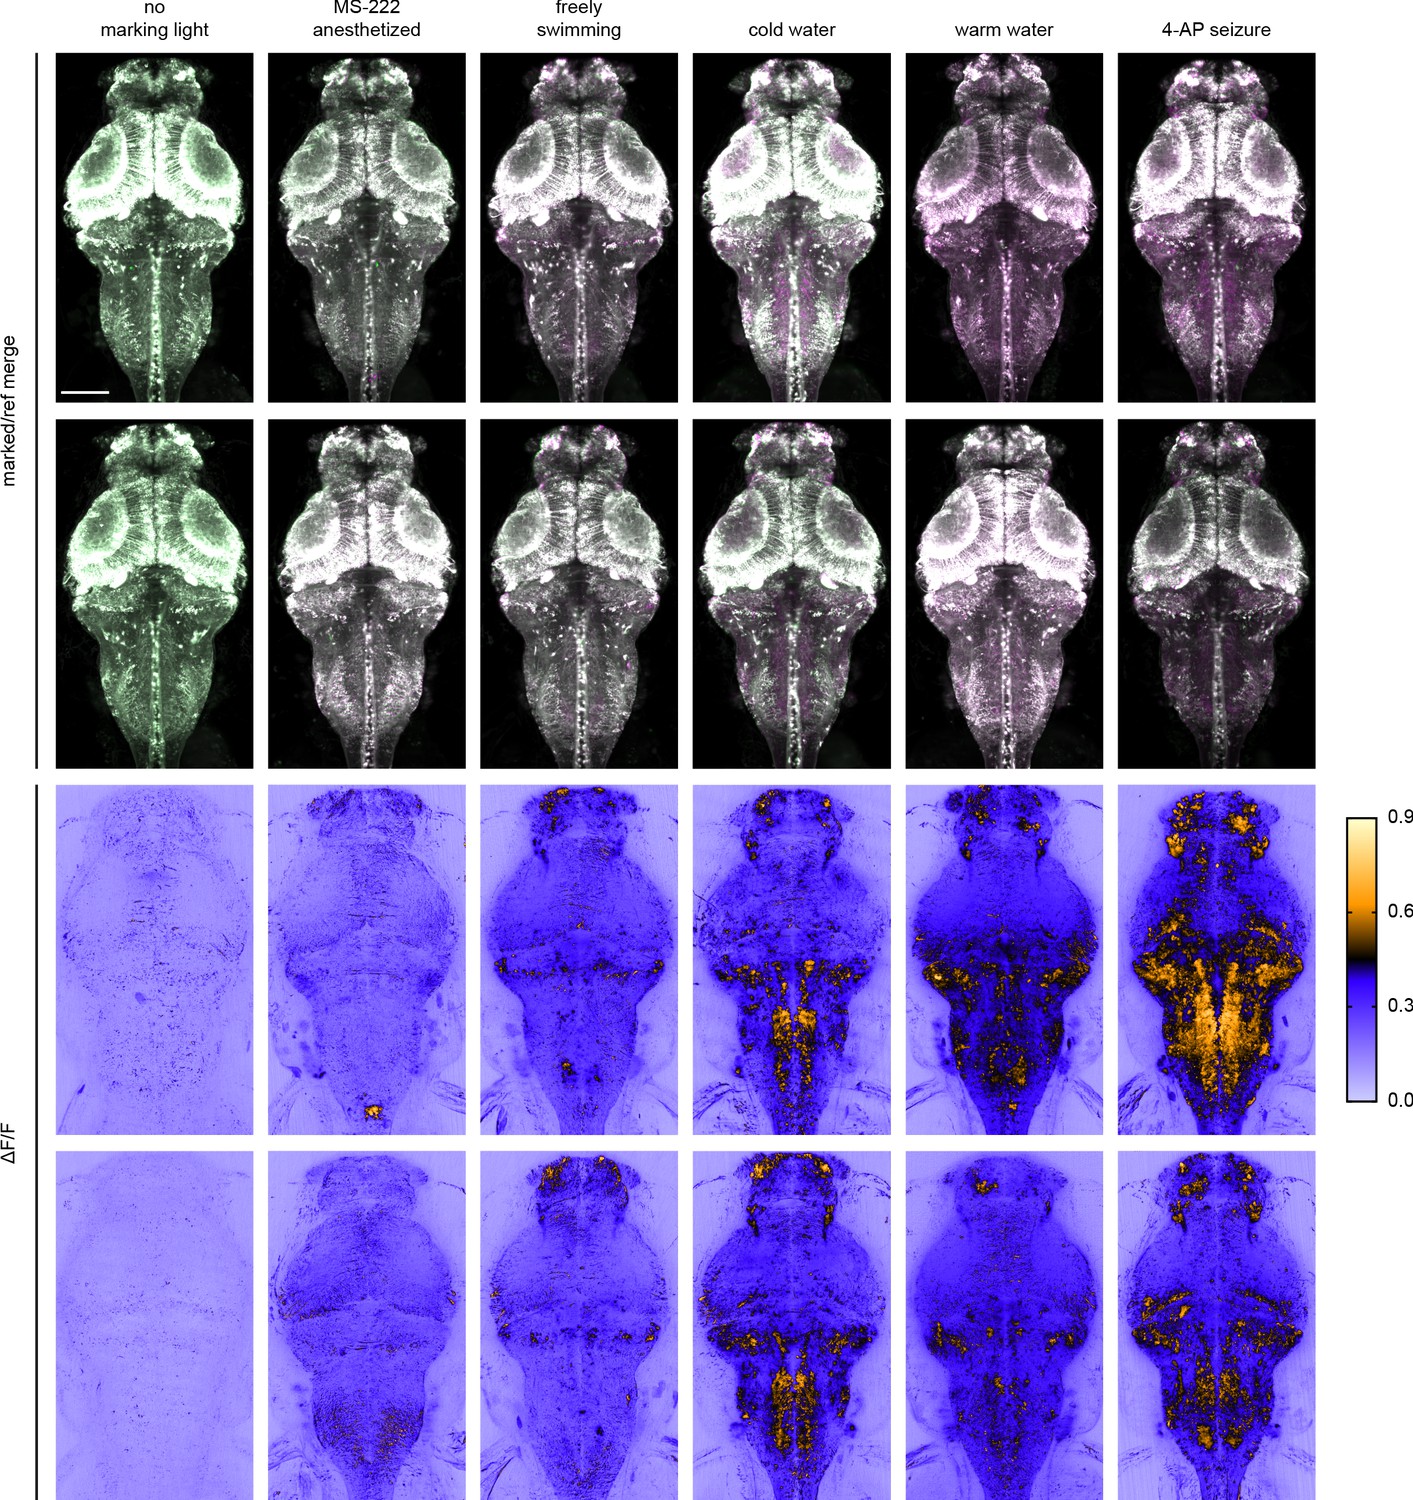
rsCaMPARI reversibly marks patterns of elevated calcium in the freely moving larval zebrafish.
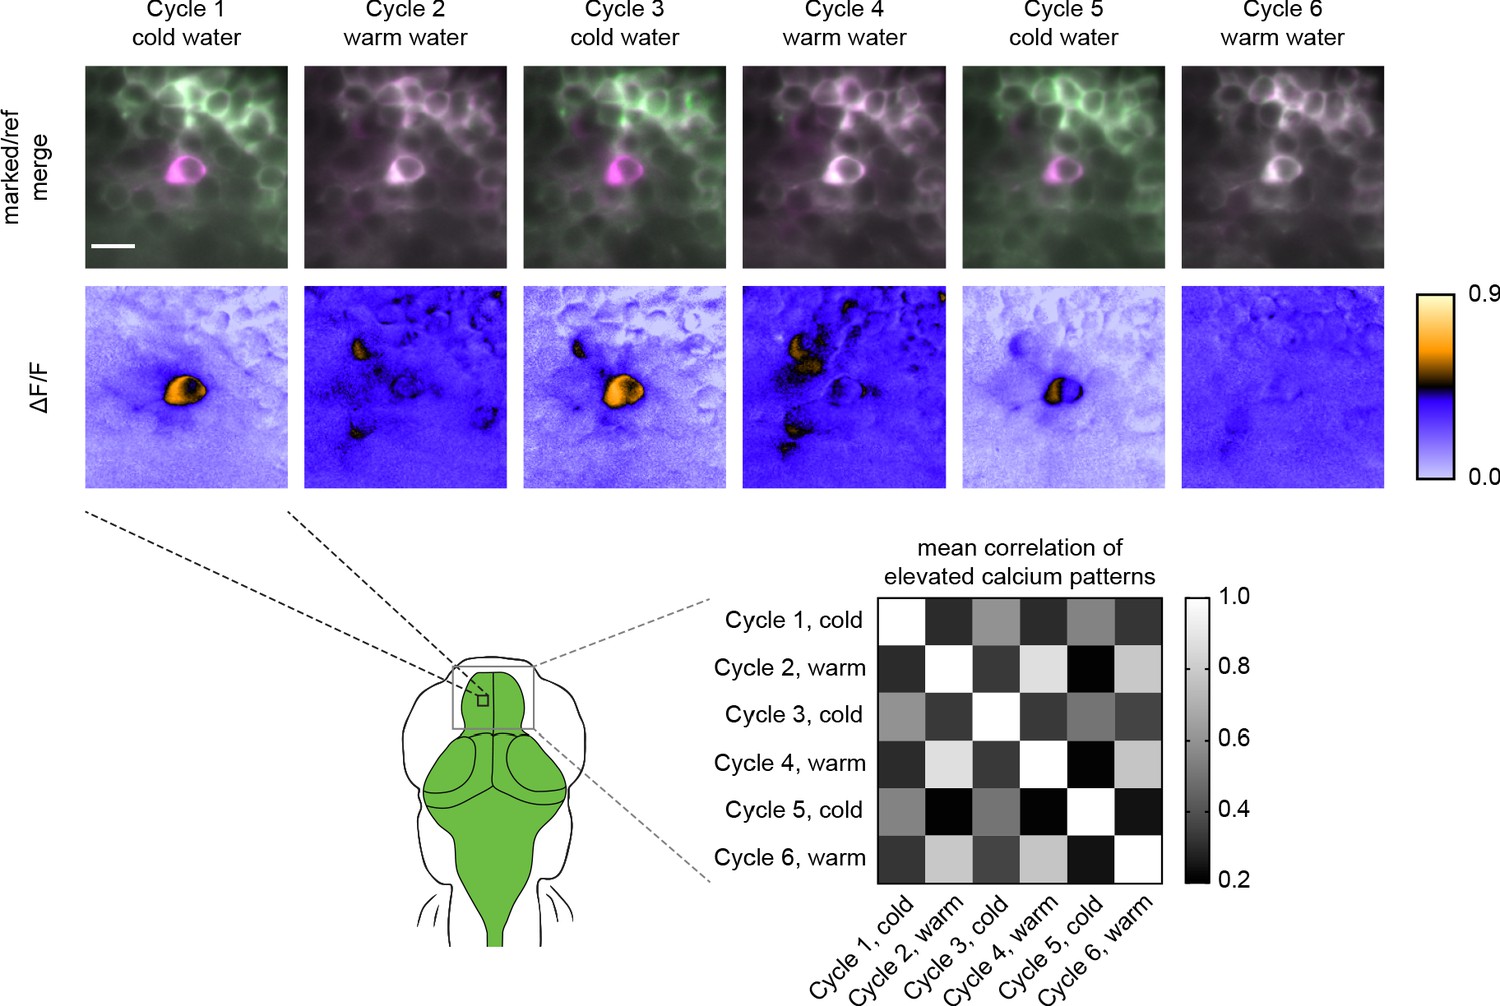
(a) rsCaMPARI expression in the Tg[elavl3:rsCaMPARI-mRuby3]jf93 zebrafish. Scale bar is 300 μm. (b) Cartoon schematic of experimental setup and image acquisition. (c) Maximum intensity Z projections of the entire brain from zebrafish larvae (4 to 5 dpf) after exposure to different stimuli: no marking light, anesthetized with tricaine methanesulfonate (MS-222), freely swimming in system water, cold water (4°C), warm water (45°C), or 4-aminopyridine (4-AP). Top panels are merged reference and erased images, pseudo-colored green and magenta, respectively. Bottom panels are ΔF/F images. Scale bar is 100 μm. (d) Multiple cycles of rsCaMPARI marking in the same zebrafish (5 dpf) exposed to either cold or warm water. Top panels are individual Z slices from the pallium of the same fish brain illustrating one neuron (solid white circle) that was only labeled during cold stimulus and another neuron (dashed white circle) that was variably labeled during warm stimulus. Scale bar is 10 μm. Bottom-right panel is a mean correlation matrix comparing patterns of elevated calcium in the upper pallium and habenula across multiple marking cycles in the same fish.
-
Figure 3—source data 1
Mean correlation matrix values of ΔF/F images across multiple cycles of rsCaMPARI marking in the same zebrafish pallium exposed to either cold or warm water.
- https://cdn.elifesciences.org/articles/57249/elife-57249-fig3-data1-v1.xlsx
Figure 3—figure supplement 1
Replicates of rsCaMPARI labeling in zebrafish brain after exposure to different stimuli (same experiment as Figure 3c, different fish).
Each image is a maximum intensity Z projection of the entire brain from zebrafish larvae (4 to 5 dpf). Top half of images are merged marked and reference erased images, pseudo-colored green and magenta, respectively. Bottom half of images are corresponding ΔF/F images. Imaging conditions and brightness/contrast are identical to images shown in Figure 3C. Scale bar is 100 μm.
Figure 3—figure supplement 2
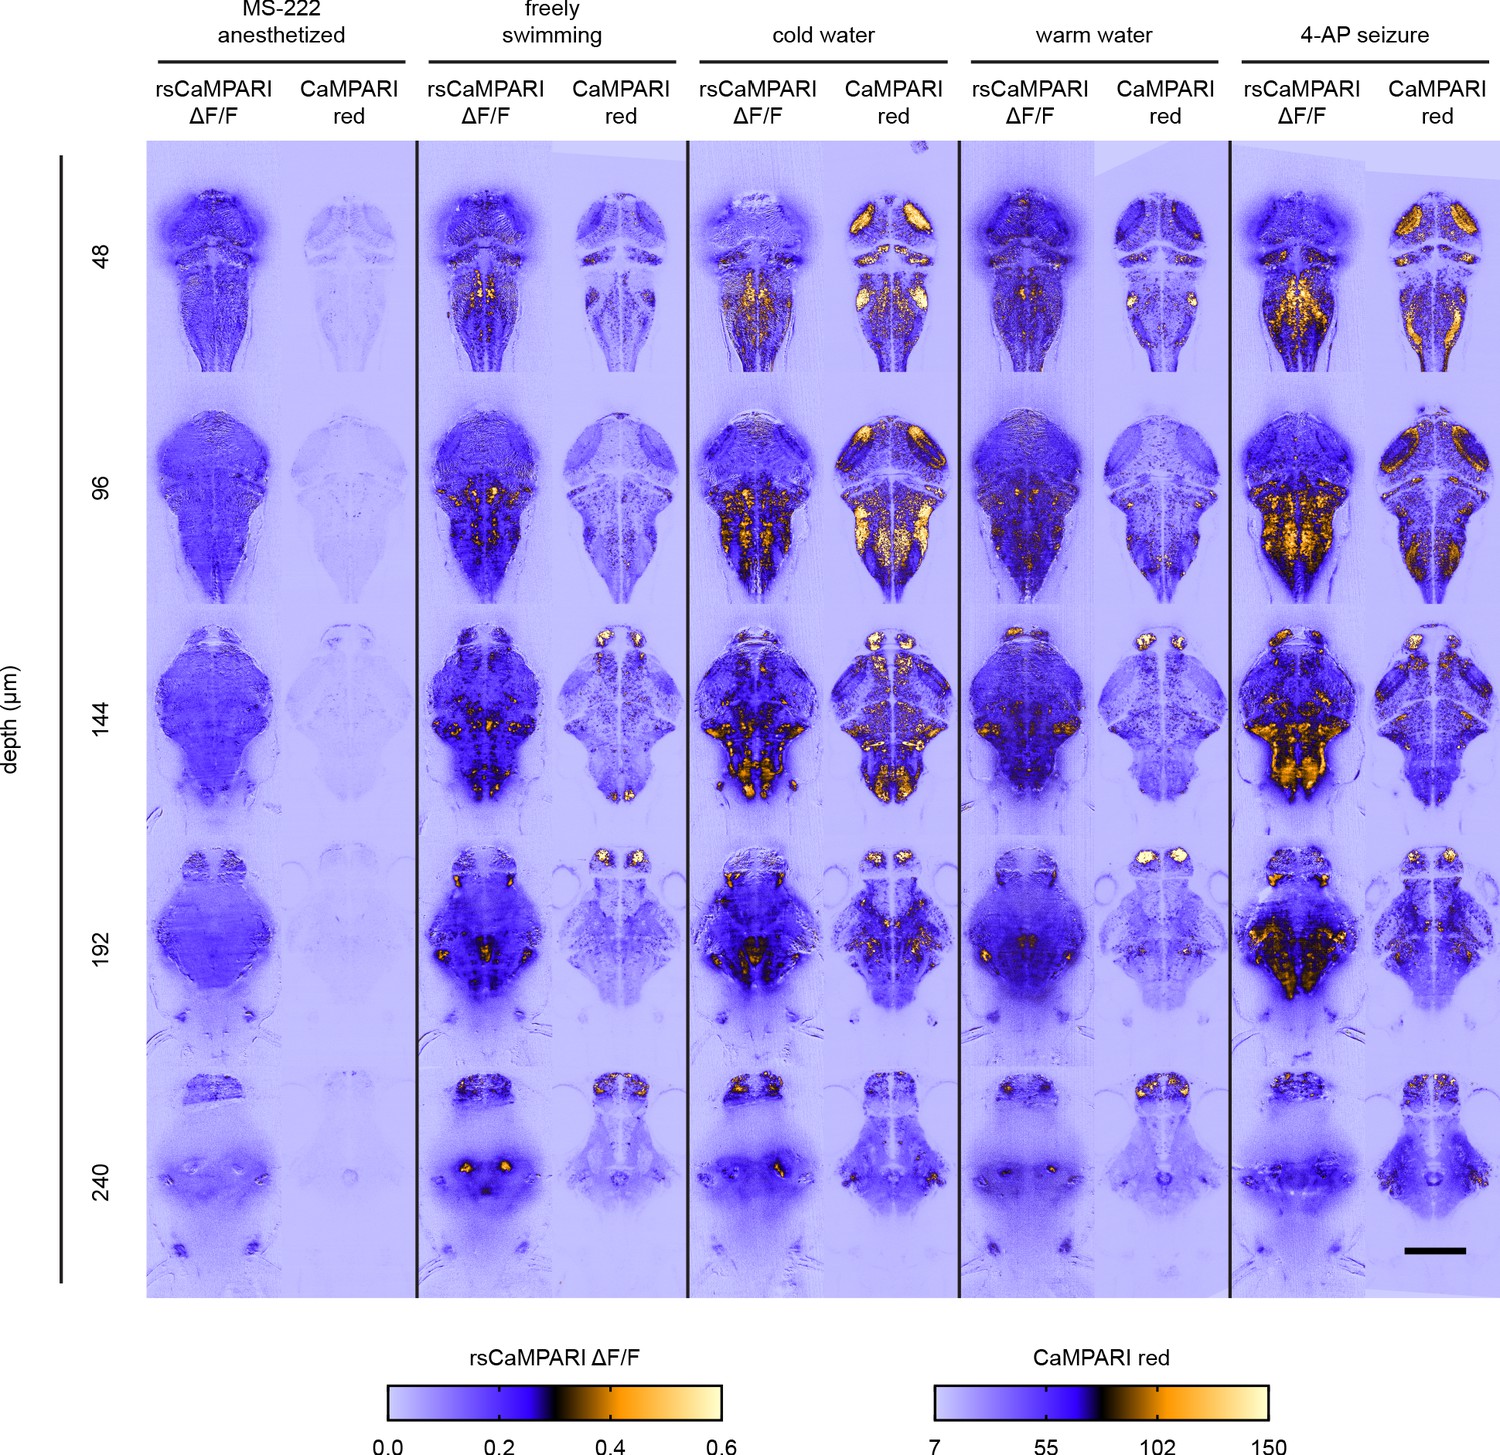
Comparison of rsCaMPARI and CaMPARI labeling in zebrafish brain after exposure to different stimuli.
Each image is an individual Z slice acquired at various depths from the brain of zebrafish larvae (4 to 5 dpf). Under each stimulus condition, images to the left are rsCaMPARI ΔF/F light sheet images from a fish expressing rsCaMPARI and images to the right are CaMPARI red confocal images from a different fish expressing CaMPARI. Scale bar is 200 μm.
Figure 3—figure supplement 3
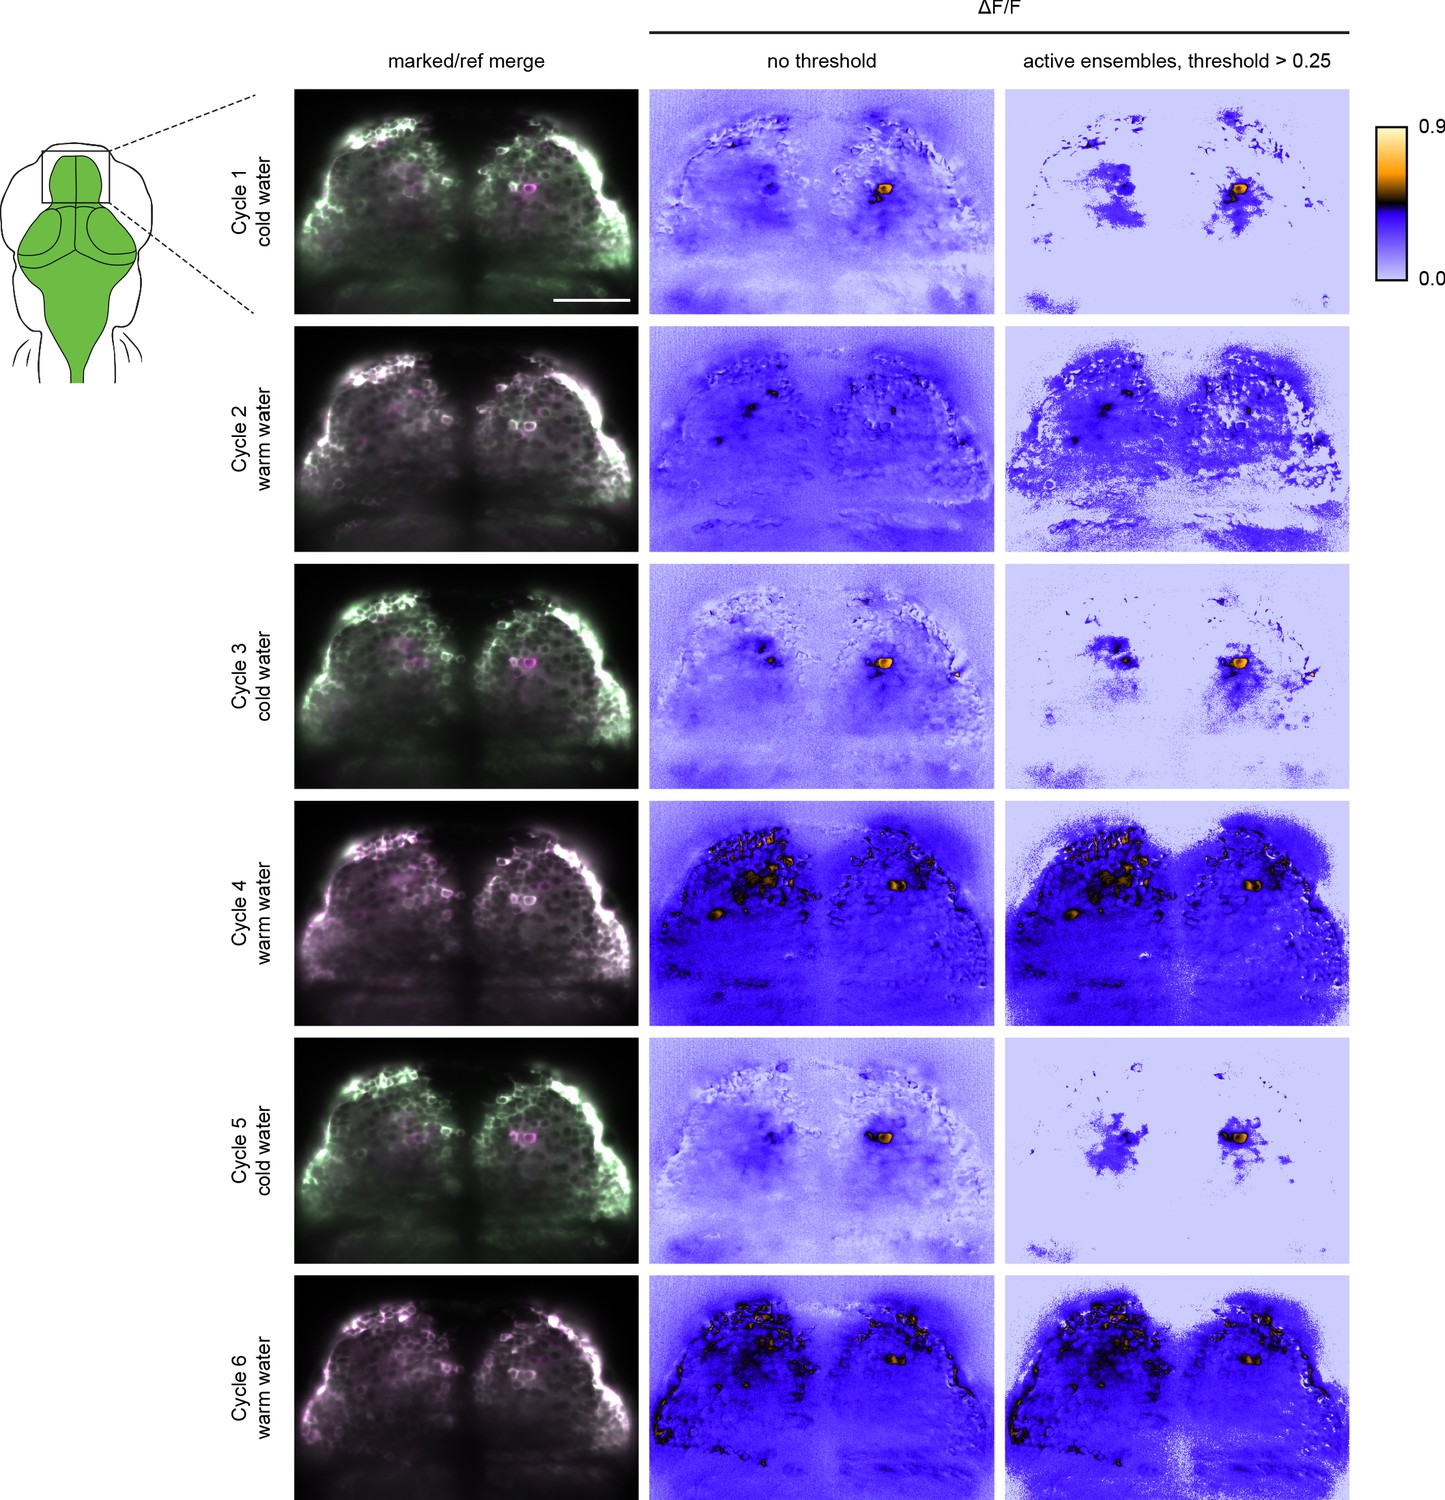
Replicate of multiple rsCaMPARI labeling cycles in the same zebrafish (same experiment as Figure 3d, different fish).
Top panels are individual Z slices from the pallium of the same fish (5 dpf) brain illustrating the same field of view from six marking cycles of alternating cold and warm water stimulus. Scale bar is 10 μm. Bottom-right panel is a normalized correlation matrix comparing labeling patterns in the upper pallium and habenula across multiple marking cycles in the same fish.
-
Figure 3—figure supplement 3—source data 1
Mean correlation matrix values of ΔF/F images across multiple cycles of rsCaMPARI marking in the same zebrafish pallium exposed to either cold or warm water.
- https://cdn.elifesciences.org/articles/57249/elife-57249-fig3-figsupp3-data1-v1.xlsx
Figure 3—figure supplement 4
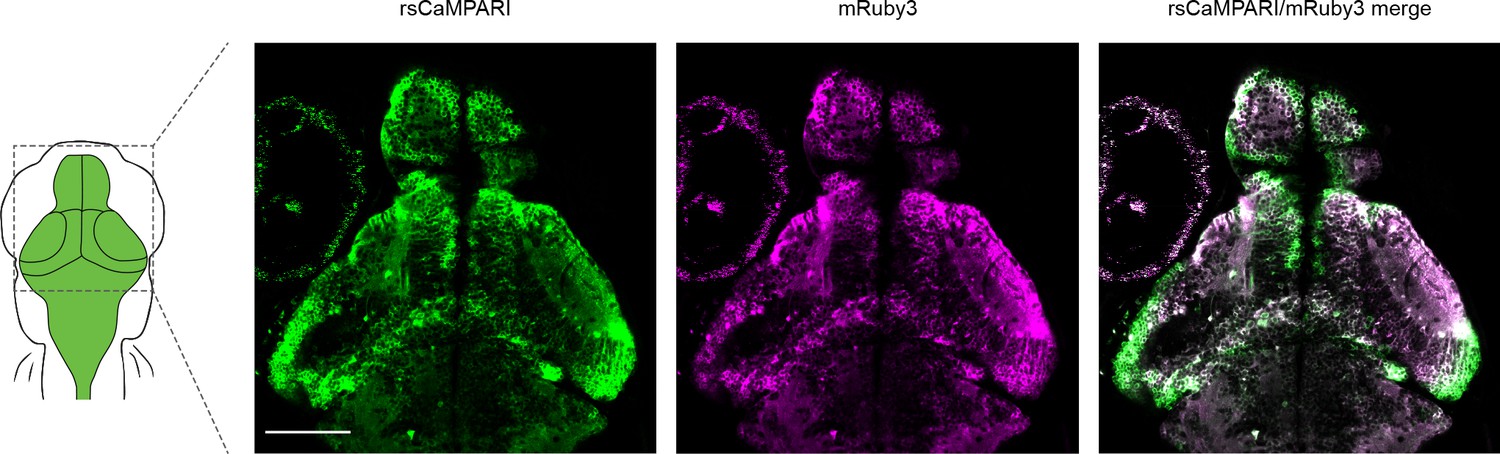
mRuby3 is poor for normalizing rsCaMPARI expression in larval zebrafish.
Two-photon image of rsCaMPARI-mRuby3 in five dpf zebrafish brain without prior exposure to marking light. Excitation wavelength is 960 nm with detection wavelength ranges of 490–534 nm and 570–695 nm for rsCaMPARI and mRuby3, respectively. Note the general lack of mRuby3 fluorescence in nascent neurons in the periphery of brain structures, presumably due to its long maturation time. Scale bar is 100 μm.
Figure 3—figure supplement 5
Representative Z slices of rsCaMPARI labeling from different marking cycles in the same fish.
Left image panels are merged marked (green) and reference erased (pseudo-colored magenta) images from the same Z position in the zebrafish pallium. Center image panels are the corresponding ΔF/F images. Right image panels are the corresponding images with threshold above 0.25 ΔF/F. Scale bar is 50 μm.
Tables
Table 1
Photophysical properties of rsCaMPARI.
| Ca2+ | λabs (nm) | λex (nm) | ϵ (M−1cm−1) | ΦF | Brightness* | ↓ rate† (s−1) | ↑ rate‡ (s−1) | Kd (nM) | Hill coefficient | |
|---|---|---|---|---|---|---|---|---|---|---|
| rsCaMPARI (on) | - | 502 | 515 | 60304 | 0.54 | 32.6 | 0.028 ± 0.002 | - | 167 ± 6 | 3.96 |
| + | 500 | 515 | 38234 | 0.46 | 17.6 | 0.467 ± 0.066 | - | |||
| rsCaMPARI (off) | - | 392 | - | - | - | - | - | 4.37 ± 0.24 | - | - |
| + | 389 | - | - | - | - | - | 6.40 ± 0.28 |
-
*Brightness = ϵ x ΦF / 1000.
†Measured during irradiation with 200 mW/cm2 of 484 nm light.
-
‡Measured during irradiation with 200 mW/cm2 of 405 nm light.
Key resources table
| Reagent type (species) or resource | Designation | Source or reference | Identifiers | Additional information |
|---|---|---|---|---|
| Gene (Lobophyllia hemprichii) | mEos3.1 | FPbase | FPbase:73GT1 | |
| Recombinant DNA reagent | pRSET_His-rsCaMPARI-mRuby3 (plasmid) | This paper | RRID:Addgene_120804 | Plasmid available at Addgene |
| Recombinant DNA reagent | pAAV-hsyn_NES-His-rsCaMPARI-mRuby3 (plasmid) | This paper | RRID:Addgene_120805 | Plasmid available at Addgene |
| Recombinant DNA reagent | pAAV-hsyn_NLS-His-rsCaMPARI-mRuby3 (plasmid) | This paper | RRID:Addgene_122092 | Plasmid available at Addgene |
| Recombinant DNA reagent | pTol2-elavl3_NES-rsCaMPARI-mRuby3 (plasmid) | This paper | RRID:Addgene_122129 | Plasmid available at Addgene |
| Recombinant DNA reagent | pAAV-hsyn_ChrimsonR-HaloTag (plasmid) | PMID:24509633 and PMID:18533659 | ||
| Strain, strain background (Escherichia coli) | T7 express | New England Biolabs | C2566 | Competent cells |
| Biological sample (Rattus norvegicus) | Primary rat hippocampal neurons | Janelia Research Campus | Freshly isolated from Rattus norvegicus | |
| Genetic reagent (Danio rerio) | Tg[elavl3:rsCaMPARI-mRuby3]jf93 | This paper | jf93Tg/+ | ZFIN ID: ZDB-FISH-191008–1 |
| Chemical compound, drug | Synaptic blockers | Tocris; PMID:24155972 | Cat# 0190, 0247, 1262, 0337 | |
| Chemical compound, drug | Janelia Fluor 635 dye, HaloTag ligand | PMID:28924668 | Luke Lavis’ lab | |
| Chemical compound, drug | Tricaine methanesulfonate (MS-222) | Sigma | E10521 | |
| Chemical compound, drug | 4-Aminopyridine | Sigma | 275875 | |
| Software, algorithm | CMTK | PMID:12670015 | RRID:SCR_002234 |
Additional files
-
Source code 1
Source code for all Fiji macro scripts used in image analysis are provided.
- https://cdn.elifesciences.org/articles/57249/elife-57249-code1-v1.docx.zip
-
Transparent reporting form
- https://cdn.elifesciences.org/articles/57249/elife-57249-transrepform-v1.docx
Download links
A two-part list of links to download the article, or parts of the article, in various formats.
Downloads (link to download the article as PDF)
Open citations (links to open the citations from this article in various online reference manager services)
Cite this article (links to download the citations from this article in formats compatible with various reference manager tools)
Erasable labeling of neuronal activity using a reversible calcium marker
eLife 9:e57249.
https://doi.org/10.7554/eLife.57249


