Tuning of olfactory cortex ventral tenia tecta neurons to distinct task elements of goal-directed behavior
- Laboratory of Neural Information, Graduate School of Brain Science, Doshisha University, Japan
- Research Fellow of the Japan Society for the Promotion of Science, Japan
- Division of Brain Structure and Function, Faculty of Medical Sciences, University of Fukui, Japan
Figures
Figure 1

vTT cell activity patterns during the odor presentation phase of the odor-guided go/no-go task.
(A) Schematic of the odor-guided go/no-go task. Behavioral epochs progressed temporally from left to right. (B) Nissl-stained frontal sections (arrow indicates recording track) and recording tracks (vertical thick lines) of the vTT in the odor-guided go/no-go task. The pink area shows layer II of the vTT. APC, anterior piriform cortex; AON, anterior olfactory nucleus. Scale bar: 500 μm. (C) Example firing patterns of vTT cells during the odor-guided go/no-go task. Each row contains spikes (black ticks) for one trial, aligned to the time of odor valve opening (corresponding to odor port entry, orange ticks). Purple and red ticks indicate times of odor valve closing and odor port exits, respectively. Correct trials are grouped by odor. Within each group, correct trials are sorted by the duration of the odor sampling epoch (the time from odor valve opening to odor port exit). Histograms are averaged across odors, calculated using a 20 ms bin width, and smoothed by convolving spike trains with a 60 ms-wide Gaussian filter. The vertical dashed line indicates the time of odor valve opening. (D) Upper panels: auROC values for cells with significantly higher firing rates than baseline (n = 68 cells) during the odor presentation phase (upper, go trials; lower, no-go trials). Each row corresponds to one cell, with cells in both graphs presented in the same order. auROC values (aligned by odor valve opening) were calculated by comparing go odor cue presentation and baseline (pre-cue odor period, 1.2 to 1 s before the odor port entry) or no-go odor cue presentation and baseline in sliding bins (width, 100 ms; step, 20 ms). Cells were sorted by peak value times of auROC values calculated by comparing go odor cue presentation and baseline for each cell. Vertical white lines indicate the time of odor valve opening. Color scale shows significant auROC values (p<0.01, permutation test). Black boxes indicate bins with non-significant auROC values (p>0.01, permutation test). Arrows indicate the same cell as that in (C). Lower panel: mean cell auROC values. Green line indicates go odor cue presentation versus baseline; pink dashed line indicates no-go odor cue presentation versus baseline. Shaded areas represent 95% confidence intervals. The vertical black dashed line indicates the time of odor valve opening. Note that across the population, mean auROC values did not differ significantly between go and no-go odor cue presentation at each time point (p<0.01, Welch’s t test). (E) Neural response similarity measures between go and no-go odor cue presentation. Upper panel: examples of auROC values during the go/no-go odor cue presentation phase for one cell (same cell as in (C)) and the correlation coefficient of auROC values during the go/no-go-cue odor presentation phase. Lower panel: comparison of the correlation coefficients and cell-shuffled data, calculated for different pairs of cells. Neuronal response profiles were more similar between odor cues for paired responses from the same neuron (red) than for responses of two different neurons (black) (p<10−13, two-sample Kolmogorov–Smirnov test).
Figure 2 with 4 supplements
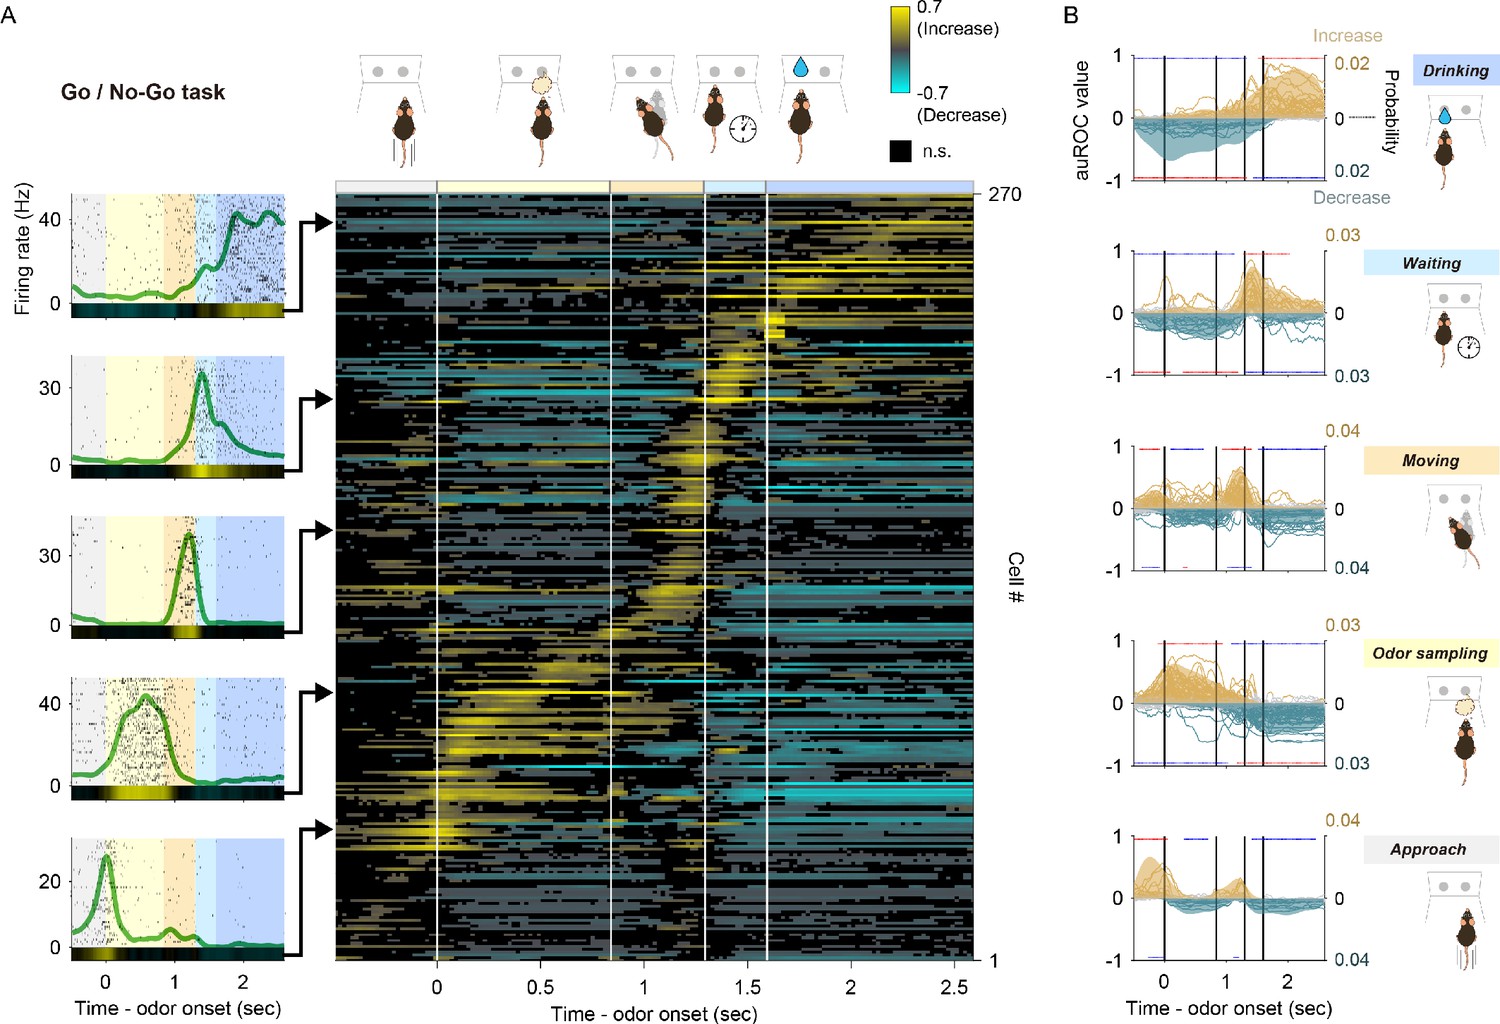
Tuning of vTT cells to distinct behaviors in the odor-guided go/no-go task.
(A) Left panel: examples of event-aligned spike data for five representative cells tuned to specific behaviors. Event-aligned spike histograms were calculated using a 20 ms bin width and smoothed by convolving spike trains with a 60 ms wide Gaussian filter. Gray shading indicates the approach epoch (500 ms before odor port entry), yellow shading indicates the odor-sampling epoch (from entry into the odor port to exiting the odor port), orange shading indicates the moving epoch (from exiting the odor port to entry into the water port), light blue shading indicates the waiting epoch (water reward delay, 300 ms before water valve was turned on), blue shading indicates the drinking epoch (1000 ms after the water valve was turned on). Right panel: auROC values were calculated from event-aligned spike data (aligned by odor valve opening) for all cells, sorted by the peak time for auROC values. Each row corresponds to one cell. auROC values were calculated by comparing go correct trials to baseline (pre-odor cue period, 1.2 to 1 s before odor port entry) in sliding bins (width, 100 ms; step, 20 ms). Vertical white lines indicate transitions between behavioral epochs, including odor port entry (corresponding to odor valve opening), odor port exit, water port entry, and water valve opening. The color scale for this figure is the same as that used in Figure 1D, with positive and negative values reflecting increased and decreased firing rates relative to baseline, respectively. (B) Relative distribution of significant auROC values (p<0.01, permutation test) per cell group tuned to a specific behavioral epoch in the odor-guided go/no-go task. Cell groups were tuned to the approach, odor-sampling, moving, waiting, and drinking epochs (from bottom to top graphs). Each line corresponds to one cell (left axes, auROC values). Yellow and blue indicate a significant increase and decrease from baseline, respectively. Gray indicates neither a significant increase nor decrease. Shaded regions show the relative distributions of significant auROC valves (right axes, probability, see Materials and methods). Red dots indicate that a time bin contained more cells with significant responses than in the distribution of 1000 resampling datasets. Blue dots indicate that a time bin contained fewer cells with significant responses than in the distribution of 1000 resampling datasets. The resampling datasets are provided in Figure 2—source data 1. Vertical black lines indicate the timing of odor port entry (corresponding to odor valve opening), odor port exit, water port entry, and water valve opening. Note that each cell group exhibited an excitatory response to a specific behavioral epoch, with suppressed responses relative to other epochs.
-
Figure 2—source data 1
Source data of the relative distributions of significant neural responses in odor-guided go/no-go task.
- https://cdn.elifesciences.org/articles/57268/elife-57268-fig2-data1-v2.zip
Figure 2—figure supplement 1
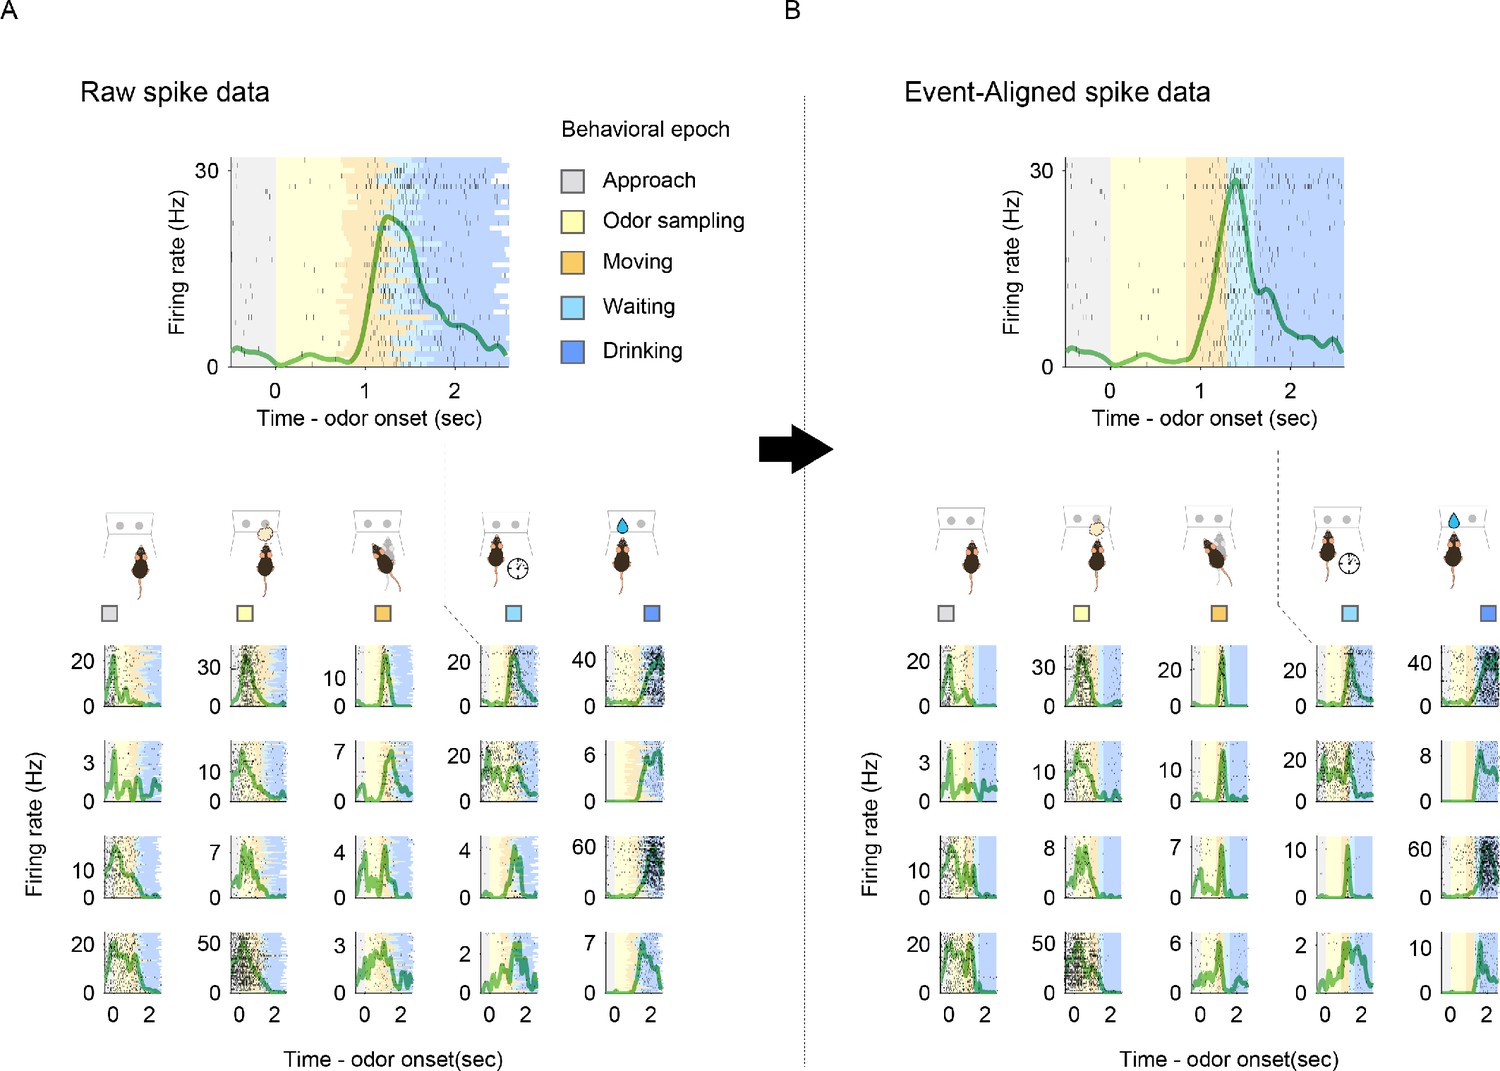
Representative activity patterns of behavior-specific active vTT cells in the odor-guided go/no-go task.
(A) Examples of spike data tuned to specific behaviors. Spike histograms (green line) were calculated using a 20 ms bin width and smoothed by convolving spike trains with a 60 ms wide Gaussian filter. Gray shading indicates the approach epoch (500 ms before odor port entry), yellow shading indicates the odor-sampling epoch (from entry into the odor port to exiting the odor port), orange shading indicates the moving epoch (from exiting the odor port to entry into the water port), light blue shading indicates the waiting epoch (water reward delay, 300 ms before water valve was turned on), and blue shading indicates the drinking epoch (1000 ms after the water valve was turned on). (B) Same as (A) for event-aligned spike data, derived by linearly scaling time intervals between behavioral epochs in each trial to the median interval across correct go trials. Numbers of spikes between epochs are preserved. Data presented are from the same cells and in the same order as those in (A).
Figure 2—figure supplement 2
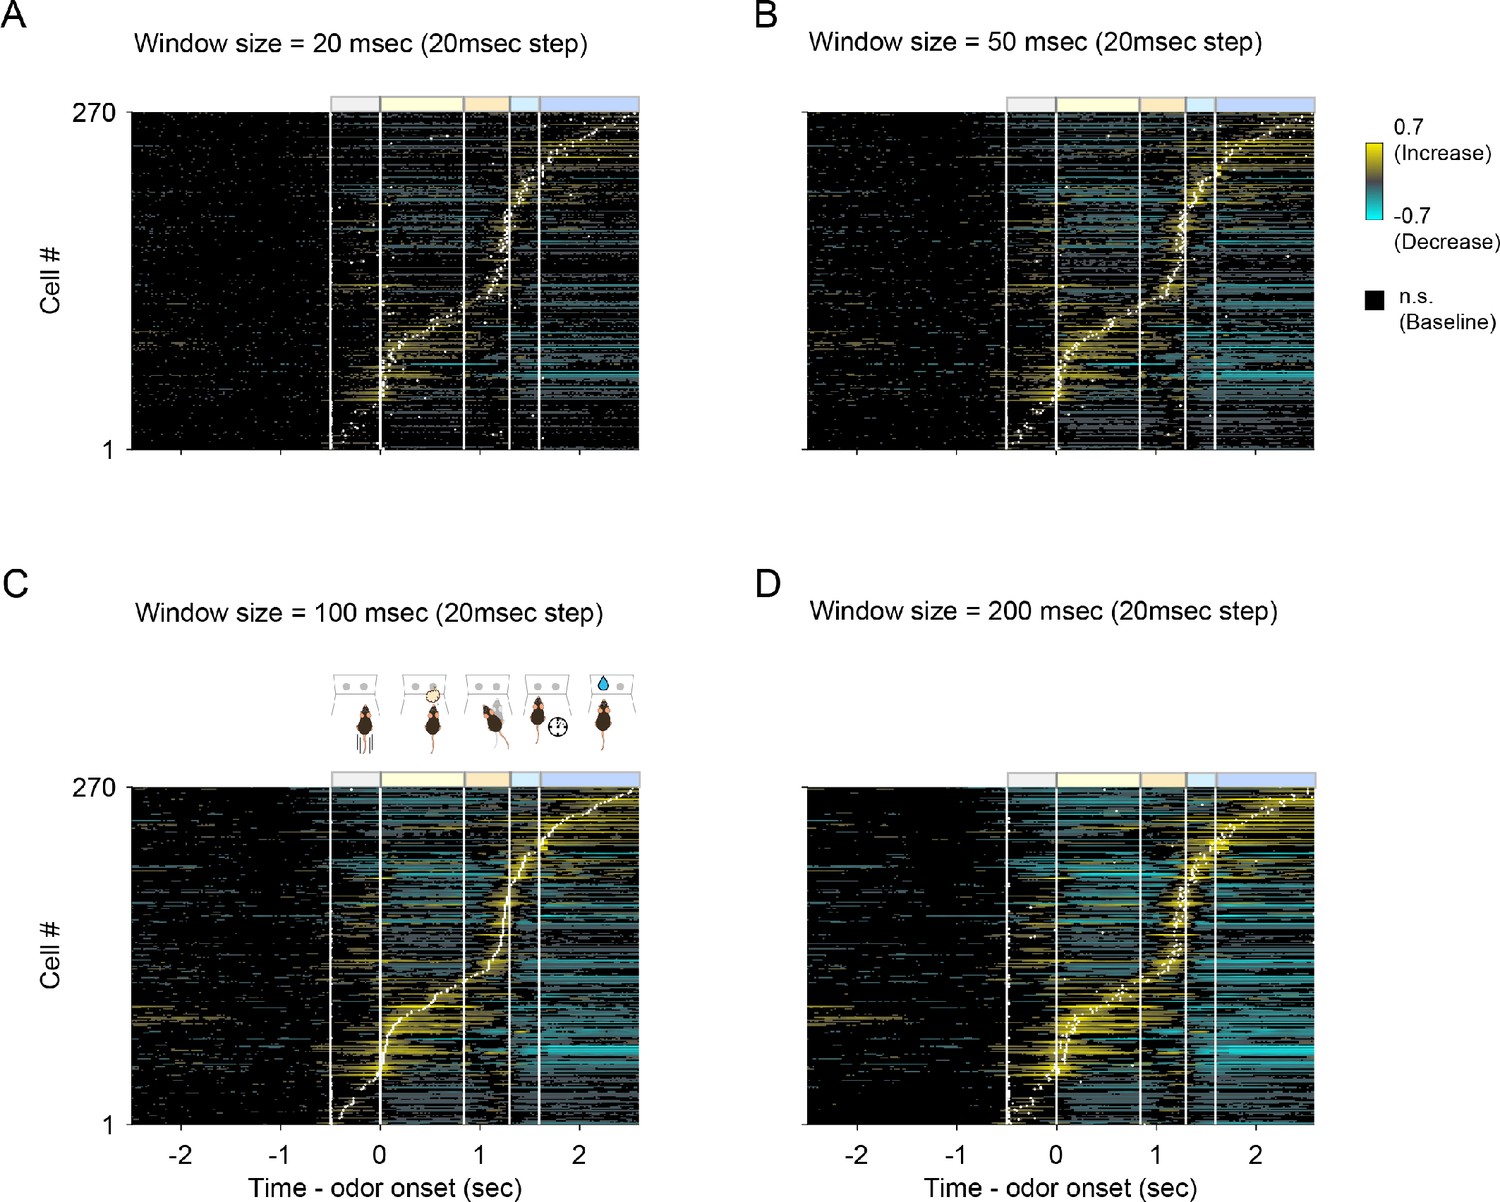
Dependence of auROC values on window size in the odor-guided go/no-go task.
auROC values calculated during the odor-guided go/no-go task in window sizes of (A) 20 ms, (B) 50 ms, (C) 100 ms (as in Figure 2A), and (D) 200 ms. White dots indicate peaks of auROC values. Vertical white lines indicate transitions between behavioral epochs.
Figure 2—figure supplement 3
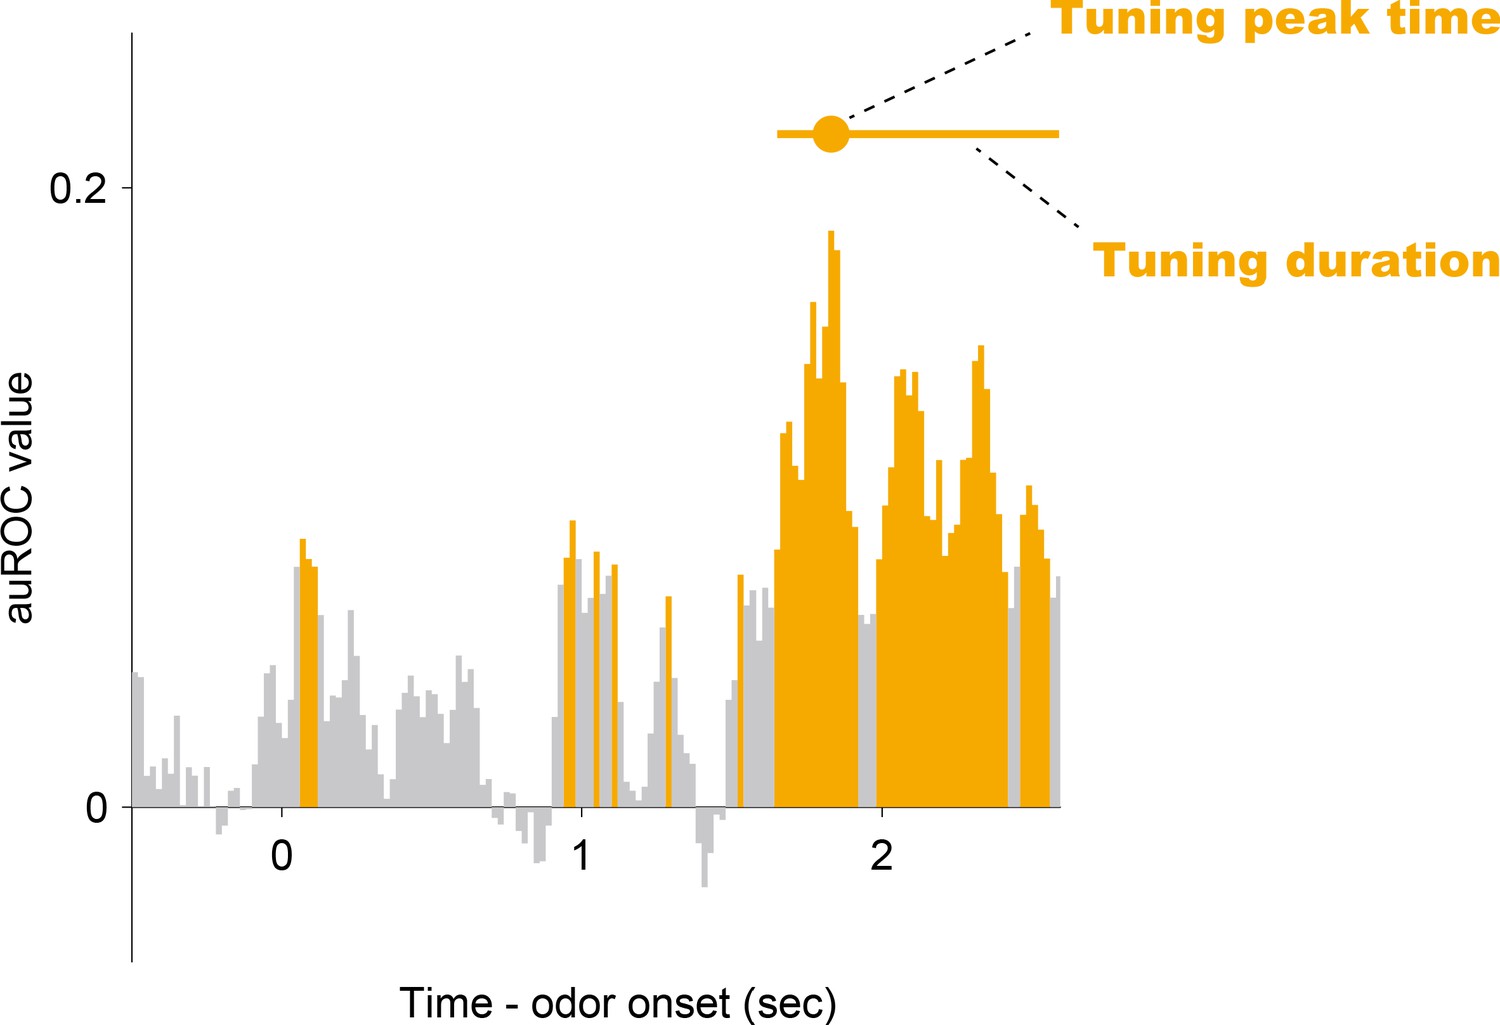
Tuning peak time and tuning duration.
To determine the timepoint at which a vTT cell increased its firing rate the most and the duration of this increased firing during the task, we calculated ‘tuning peak time’ (orange dot) and ‘tuning duration’ (orange horizontal line) from the auROC values (see Materials and methods). Orange bars indicate significant increases from baseline. Gray bars indicate neither significant increases nor decreases.
Figure 2—figure supplement 4
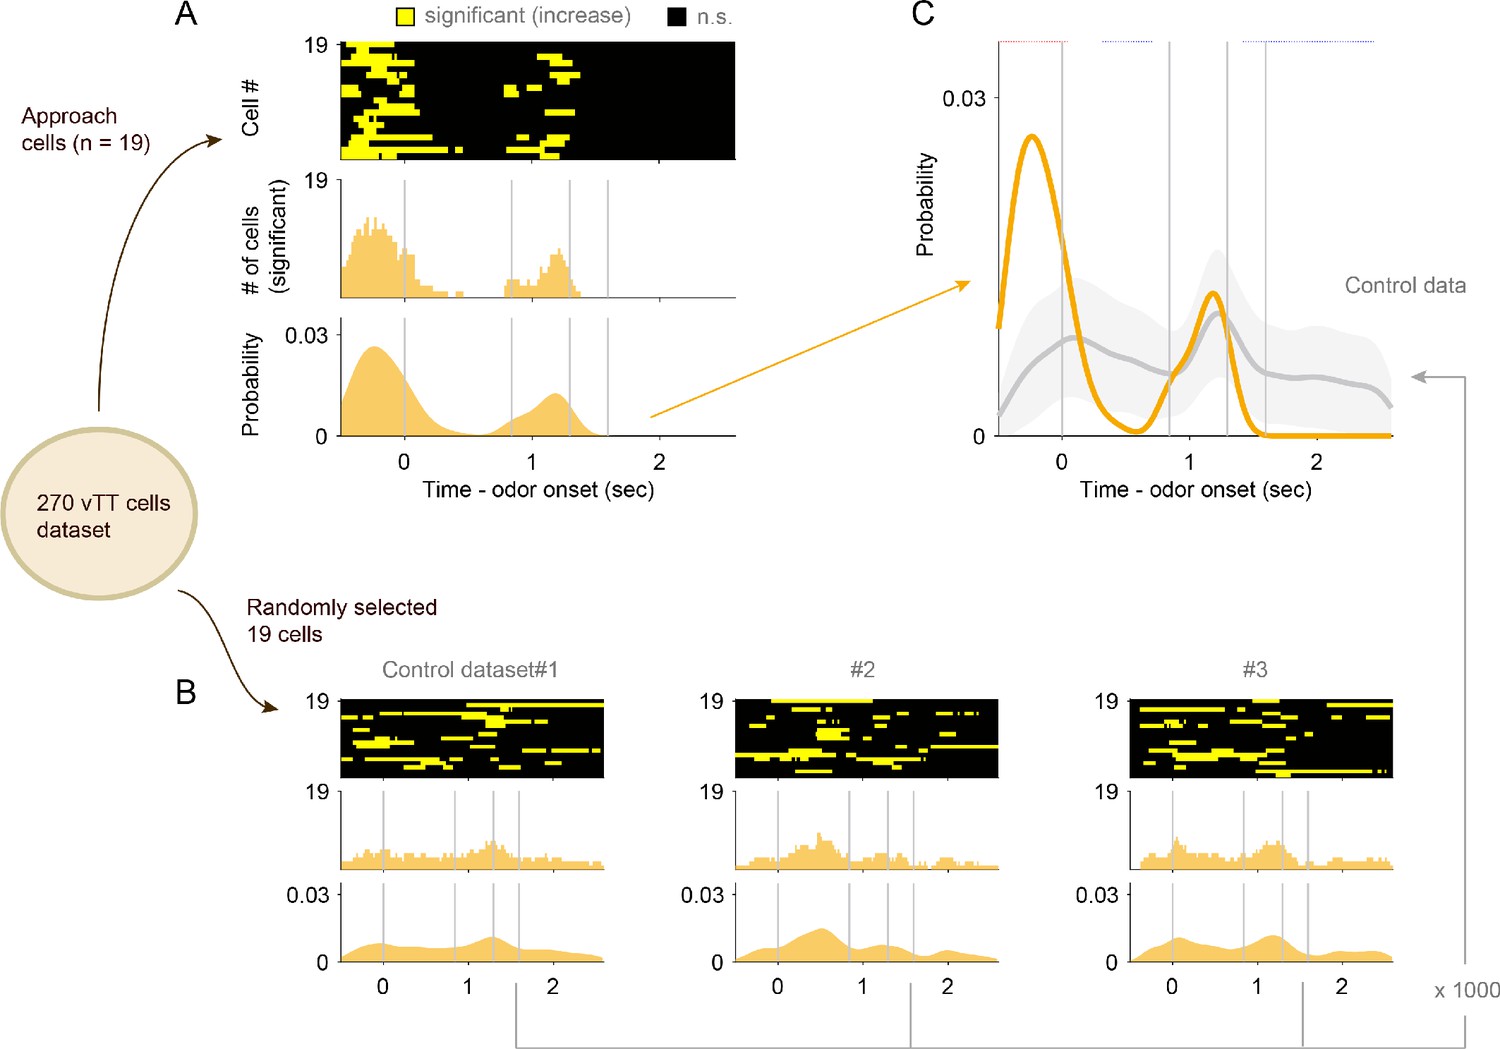
Relative distribution of significant responses.
(A) Relative distribution of significant excitatory firing of the cell group involved in approach. The number of cells with significant excitatory firing (top yellow boxes, significant increase from baseline; black boxes, not significant) during each time bin was quantified (middle histogram). Their distribution was estimated using Gaussian kernel smoothing (bottom-shaded area). (B) Comparison of (A) with the cell-shuffled data. We ran 1000 iterations in which cellular group identities were randomized and calculated the distribution of significant excitatory firing by each cell group, as in (A). (C) The significance of activity patterns for the cell group involved in approach (orange line) was determined by comparing the standard deviations of the data with those obtained from the cell-shuffled data (gray line and gray shaded area). Red dots indicate that a time bin contained more cells with significant responses than that in the distribution of the cell-shuffled data. Blue dots indicate that a time bin contained fewer cells with significant responses than that in the distribution of the cell-shuffled data. Vertical gray lines indicate transitions between behavioral epochs.
Figure 3 with 4 supplements

Tuning of vTT cells to distinct behaviors in the odor-guided eating/no-eating task.
(A) Schematic of the odor-guided eating/no-eating task, with behavioral epochs progressing from left to right. (B) Left panel: examples of event-aligned spike data for three representative cells tuned to specific behaviors. The event-aligned spike histograms were calculated using a 500 ms bin width and smoothed by convolving spike trains with a 500 ms wide Gaussian filter. Gray shading indicates the approach epoch (from the start of approach behavior to contacting the dish), pink shading indicates the eating epoch (from the start of consumption to food removal), and light green shading indicates the food removal epoch (2 s after food removal). Right panel: auROC values calculated from event-aligned spike data (aligned to contacting the dish) for all cells, sorted by the timing of the peak of auROC values. Each row corresponds to one cell. auROC values were calculated by comparing eating trials versus baseline (pre-approach period, 3 to 1 s before starting approach behavior) in the sliding bins (width, 500 ms; step, 100 ms). Vertical white lines indicate when the animal touched the dish (left) and when the food was removed (right). The color scale indicates positive values that reflect increases in firing rate relative to baseline, while negative values reflect firing rate decreases relative to baseline. (C) Relative distribution of the significant auROC values (p<0.01, permutation test) in each cell group tuned to a specific behavior in the odor-guided eating/no-eating task. The cell groups were tuned to approach epoch, eating epoch, and food removal epoch (from bottom to top of graph). Each line corresponds to one cell (left axes, auROC values). Yellow and blue indicate a significant increase and decrease from baseline, respectively; gray indicates a non-significant increase or decrease. Shaded regions indicate the relative distribution of significant auROC valves (right axes, probability, see Materials and methods). Red dots indicate that a time bin contained more cells with significant responses than that in the distribution of 1000 resampling datasets. Blue dots indicate that a time bin contained fewer cells with significant responses than that in the distribution of 1000 resampling datasets. The resampling datasets are provided in the Figure 3—source data 1. Vertical black lines indicate when mice contacted the dish (left) and when food was removed (right). Note that each cell group had an excitatory response to a specific behavioral epoch, with suppressed responses relative to other epochs.
-
Figure 3—source data 1
Source data of the relative distributions of significant neural responses in eating/no-eating task.
- https://cdn.elifesciences.org/articles/57268/elife-57268-fig3-data1-v2.zip
Figure 3—figure supplement 1
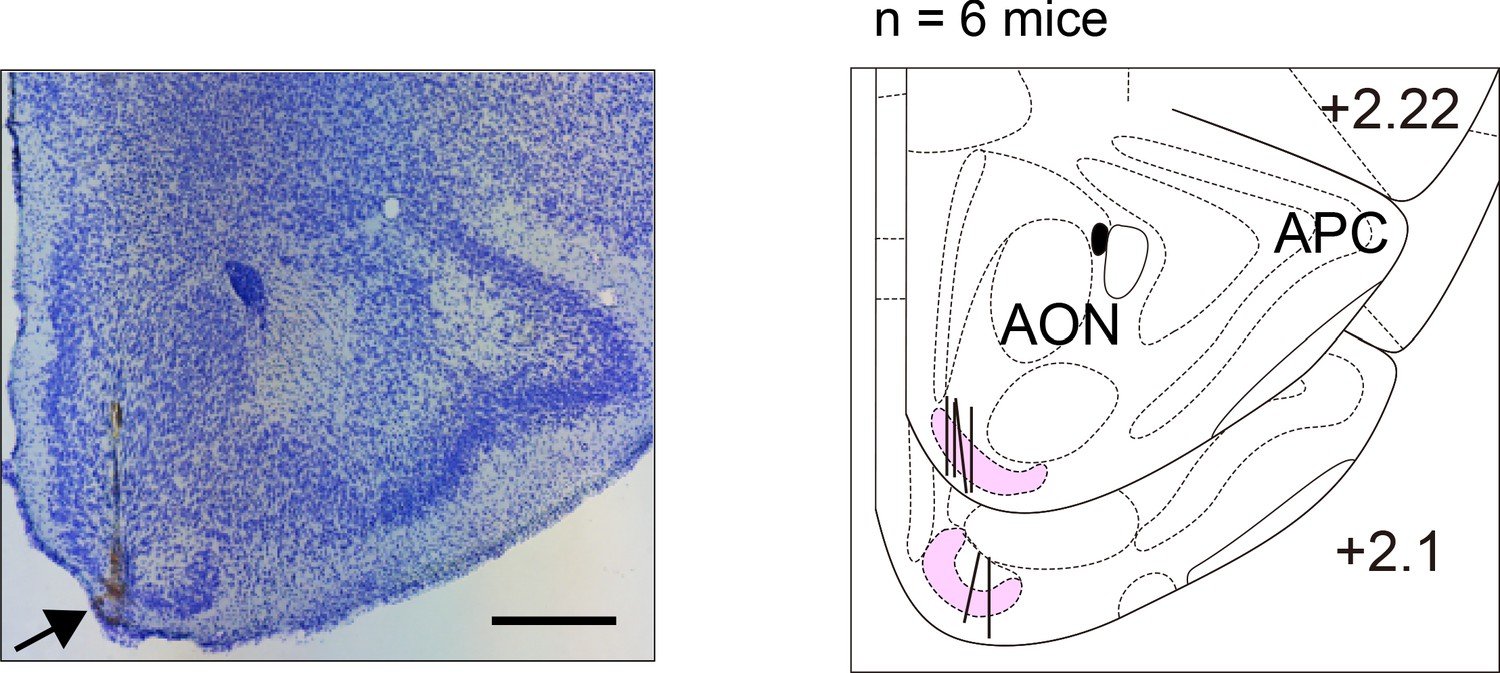
vTT recording sites across mice in the odor-guided eating/no-eating task.
Nissl-stained frontal section (arrow indicates recording track) and recording tracks (vertical thick lines) of the vTT in the odor-guided eating/no-eating task. The pink area shows layer II of the vTT. APC, anterior piriform cortex; AON, anterior olfactory nucleus. Scale bar, 500 μm.
Figure 3—figure supplement 2
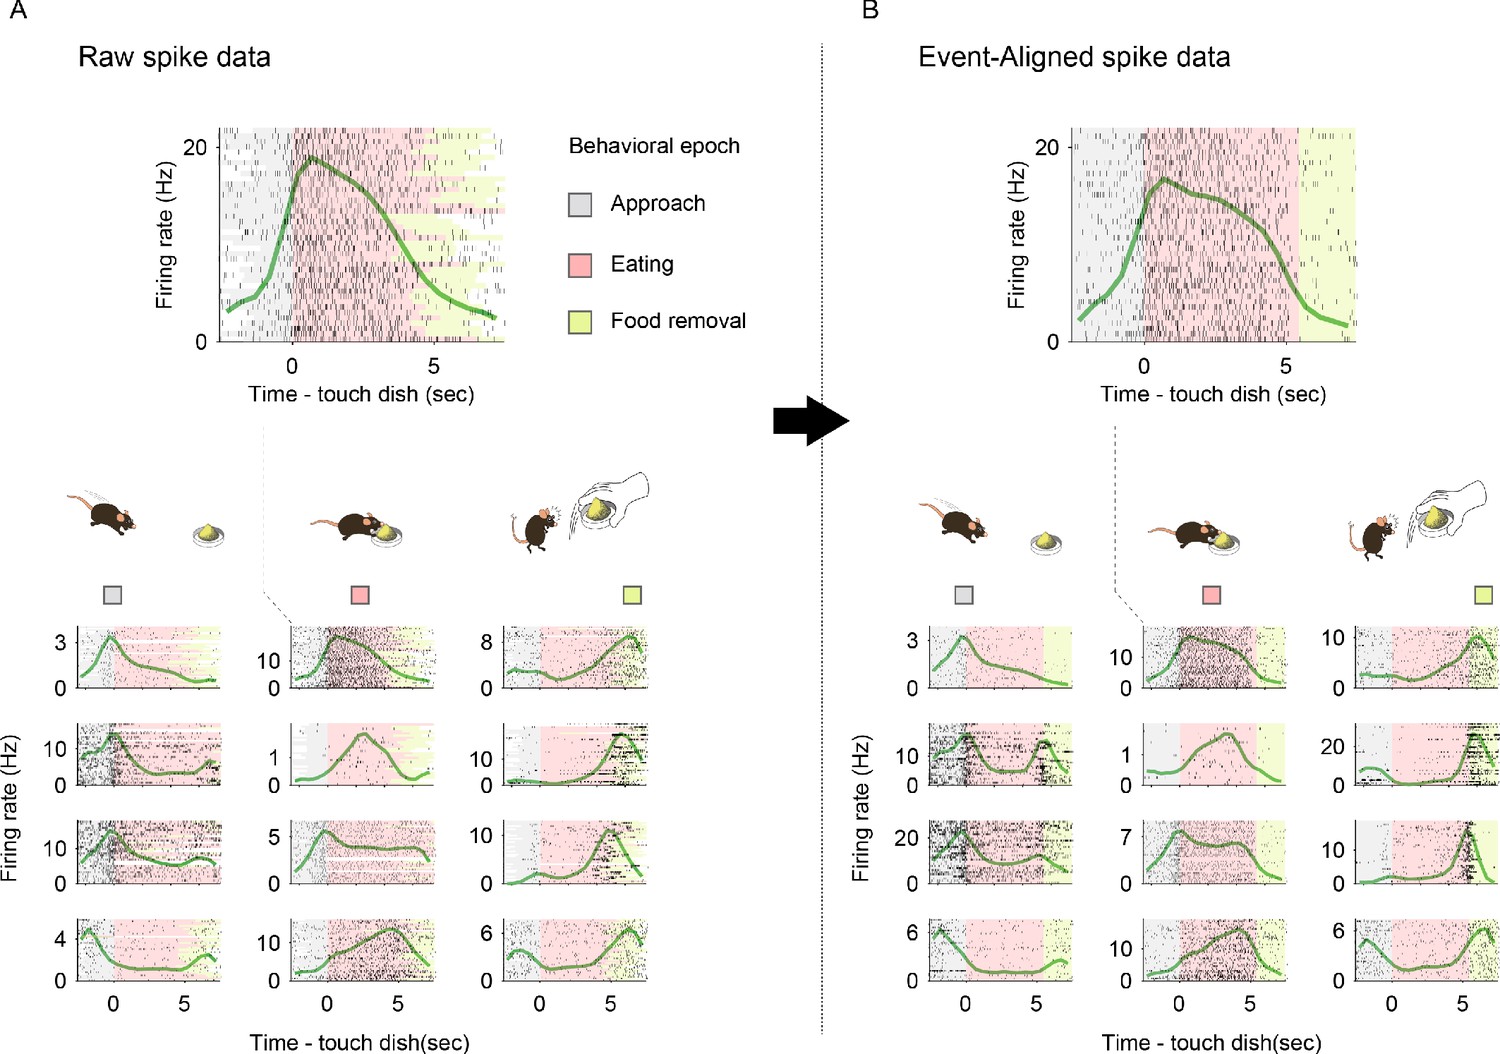
Representative activity patterns of behavior-specific active vTT cells in the odor-guided eating/no-eating task.
(A) Examples of spike data tuned to specific behaviors. Spike histograms (green line) were calculated using a 500 ms bin width and smoothed by convolving spike trains with a 500 ms wide Gaussian filter. Gray shading indicates the approach epoch (from the start of approach behavior to contacting the dish), pink shading indicates the eating epoch (from the start of eating behavior to food removal), light green shading indicates the food removal epoch (2 s after food removal). (B) Same as (A) for event-aligned spike data, derived by linearly scaling time intervals between behavioral epochs in each trial to the median interval across eating trials. Numbers of spikes between epochs are preserved. Data presented are from the same cells and in the same order as those in (A).
Figure 3—figure supplement 3
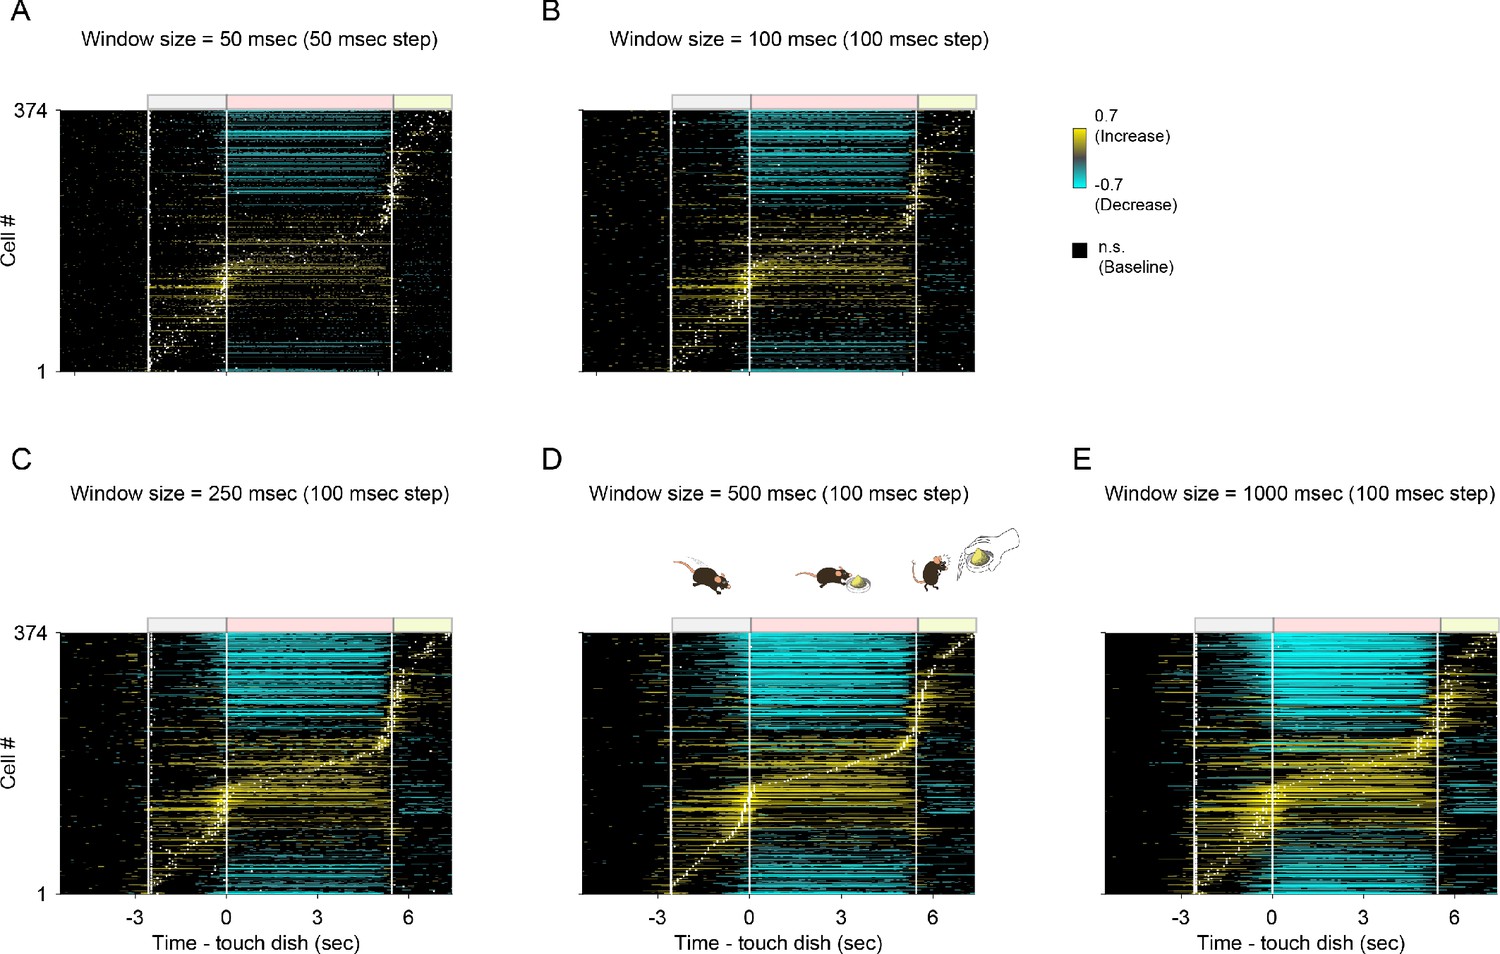
Dependence of auROC values on window size in the odor-guided eating/no-eating task.
auROC values calculated during the odor-guided eating/no-eating task in sliding bins of (A) width, 50 ms; step, 50 ms; (B) width, 100 ms; step, 100 ms; (C) width, 250 ms; step, 100 ms; (D) width, 500 ms; step, 100 ms (as in Figure 3B); and (E) width 1000 ms; step, 100 ms. White dots indicate peaks of auROC values. Vertical white lines indicate transitions between behavioral epochs.
Figure 3—figure supplement 4
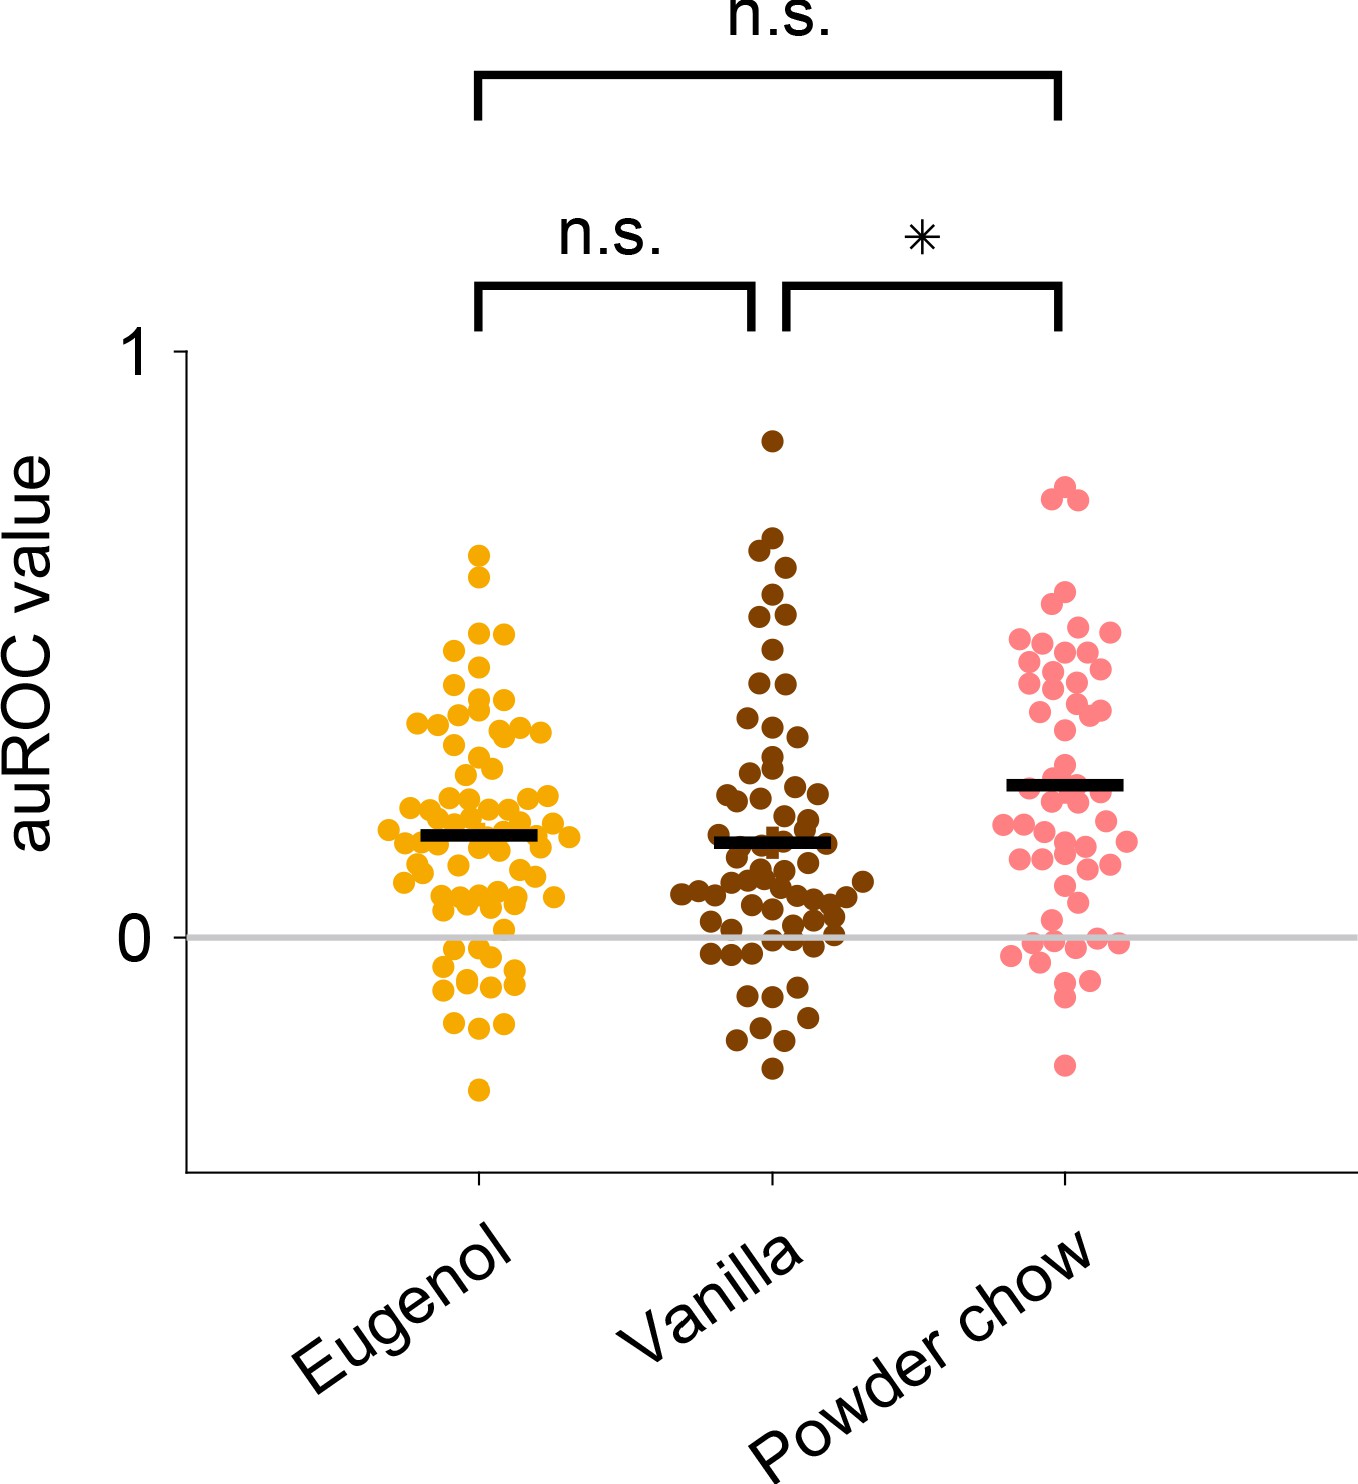
Eating epoch activity during eugenol, vanilla essence, and powder chow presentation in the odor-guided eating/no-eating task.
Mean auROC values during the eating epoch for each cell which had a tuning peak time during the eating epoch (eugenol presentation, n = 76 cells; vanilla essence presentation, n = 67 cells; powder chow presentation, n = 55 cells). Only cells with a minimum number of 10 trials for each condition were included in these data. Statistical significance among three groups (*p<0.05) was assessed using one-way analysis of variance (ANOVA).
Figure 4 with 4 supplements
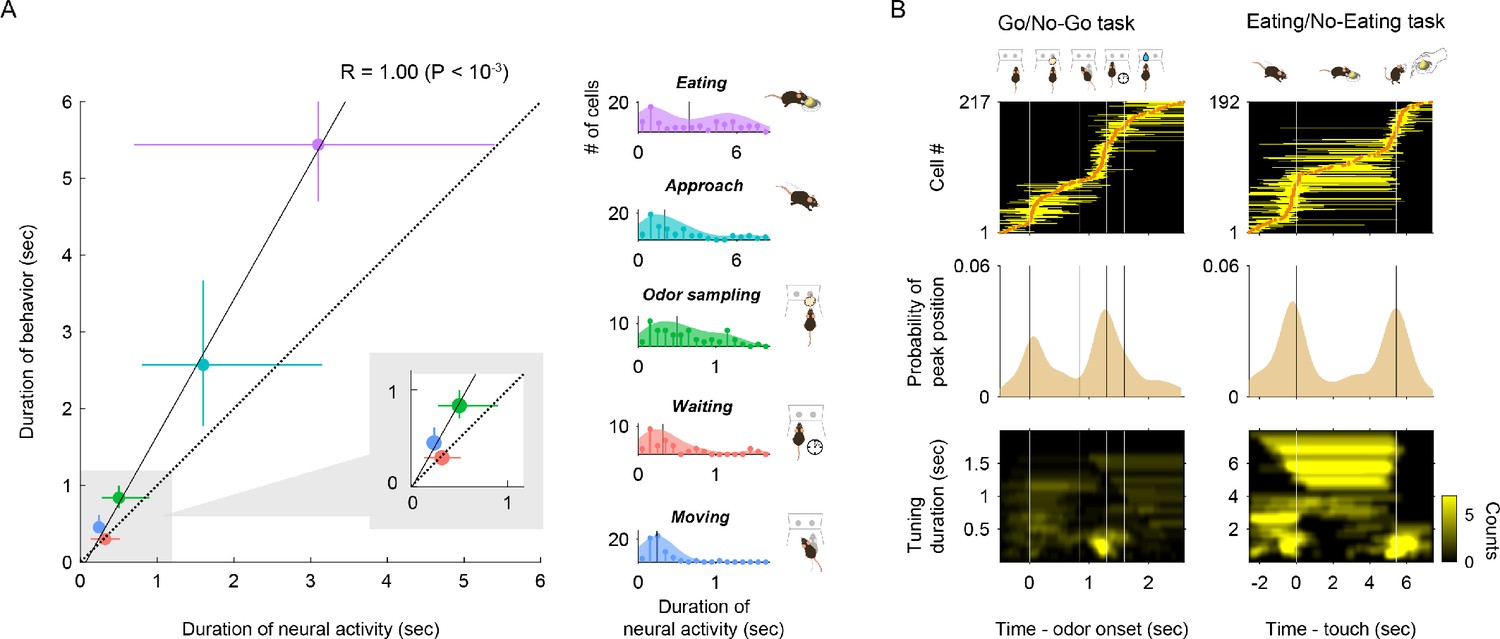
Tuning durations and tuning peak time of vTT cells in different tasks.
(A) Correlation between the median of neural tuning durations and that of behavioral epoch durations (r = 1.00, p<10−3, error bars show interquartile ranges). Right histograms show the distribution of neural tuning durations for each behavioral epoch (light blue, cell group tuned to approach epoch; purple, cell group tuned to eating epoch; green, odor sampling epoch; blue, moving epoch; red, waiting epoch). Vertical black lines in right graphs show the median tuning duration for each epoch. (B) Response profiles for tuning peak time and tuning duration across cells with tuning peak times (odor-guided go/no-go task, 217 cells; odor-guided eating/no-eating task, 192 cells). Top panel: tuning peak times (orange dots) and tuning durations (yellow horizontal lines) in the odor-guided go/no-go task and odor-guided eating/no-eating task. Vertical white lines indicate transitions between the behavioral epochs. Center panel: distributions of tuning peak times along the task time course. Shades show tuning peak time distributions. Vertical black lines show transitions between the behavioral epochs. Bottom panel: distributions of excitatory tuning durations, which were defined as the duration of consecutive significant bins (p<0.01, permutation test) with a 2-D Gaussian smoothing kernel. Vertical white lines indicate transitions between behavioral epochs. The color scale indicates the number of cells with each tuning duration in the tasks.
Figure 4—figure supplement 1
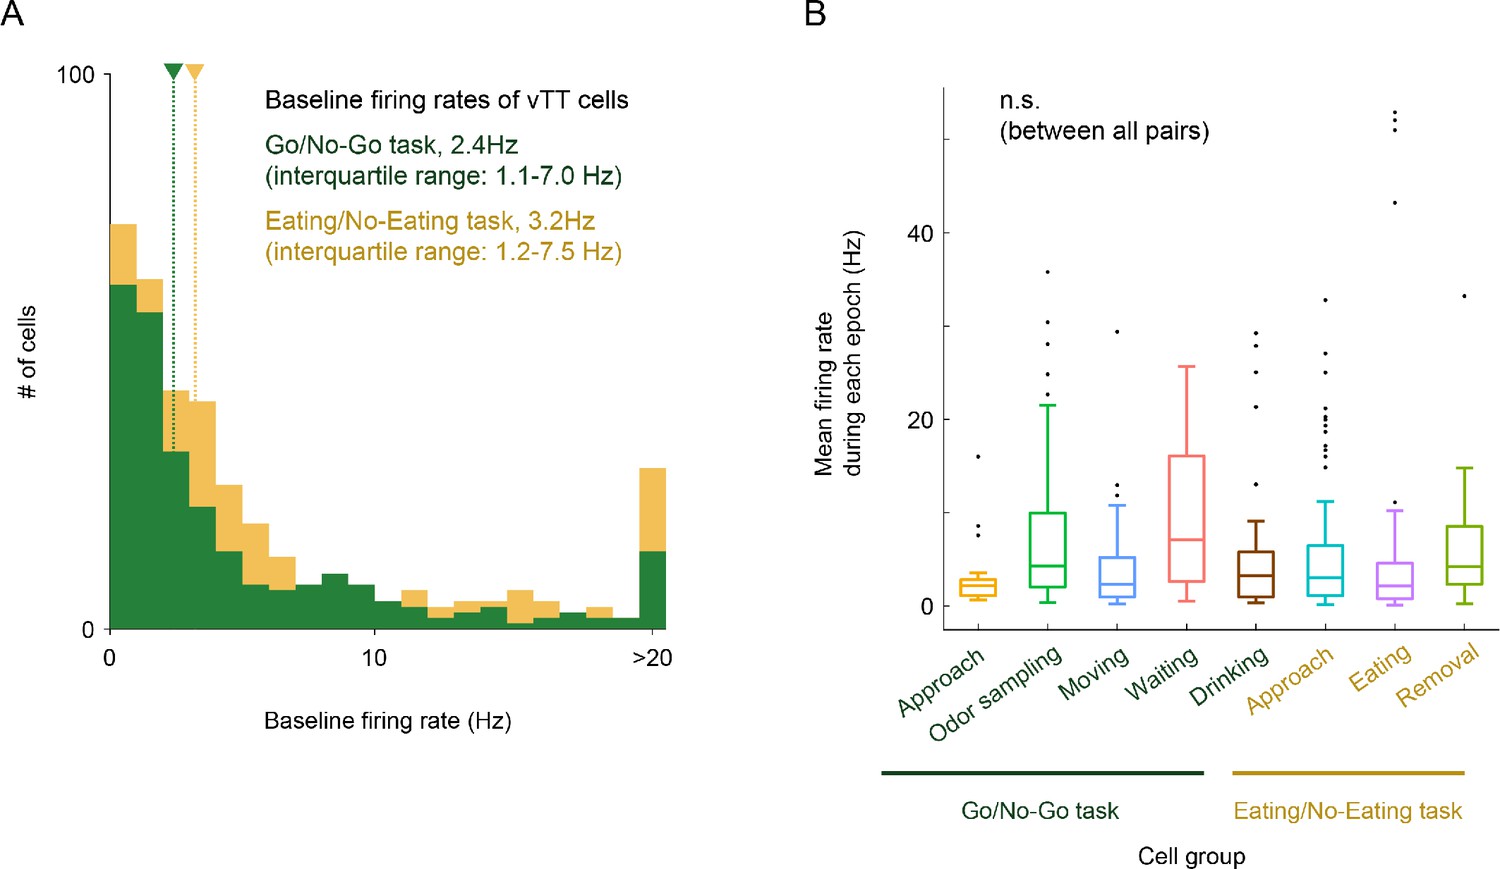
Comparison of baseline and mean firing rates of each classified group between tasks.
(A) Distribution of baseline firing rates between tasks. The median baseline firing rates (for the odor-guided go/no-go task, pre-odor cue period, 1.2 to 1 s before odor port entry; odor-guided eating/no-eating task, pre-approach period, 3 to 1 s before the onset of approach behavior) were 2.4 Hz (interquartile range: 1.1–7.0 Hz) (green dashed line) in the go/no-go task (n = 270 cells), and 3.2 Hz (interquartile range: 1.2–7.5 Hz) (yellow dashed line) in the eating/no-eating task (n = 374 cells). Note that baseline firing rates were not significantly different between tasks (p>0.05, Wilcoxon rank-sum test). (B) Comparison of the mean firing rates across epochs. No significant differences in the mean firing rates of the classified cell populations between all-pairs were noted (p>0.05, Tukey’s test).
Figure 4—figure supplement 2
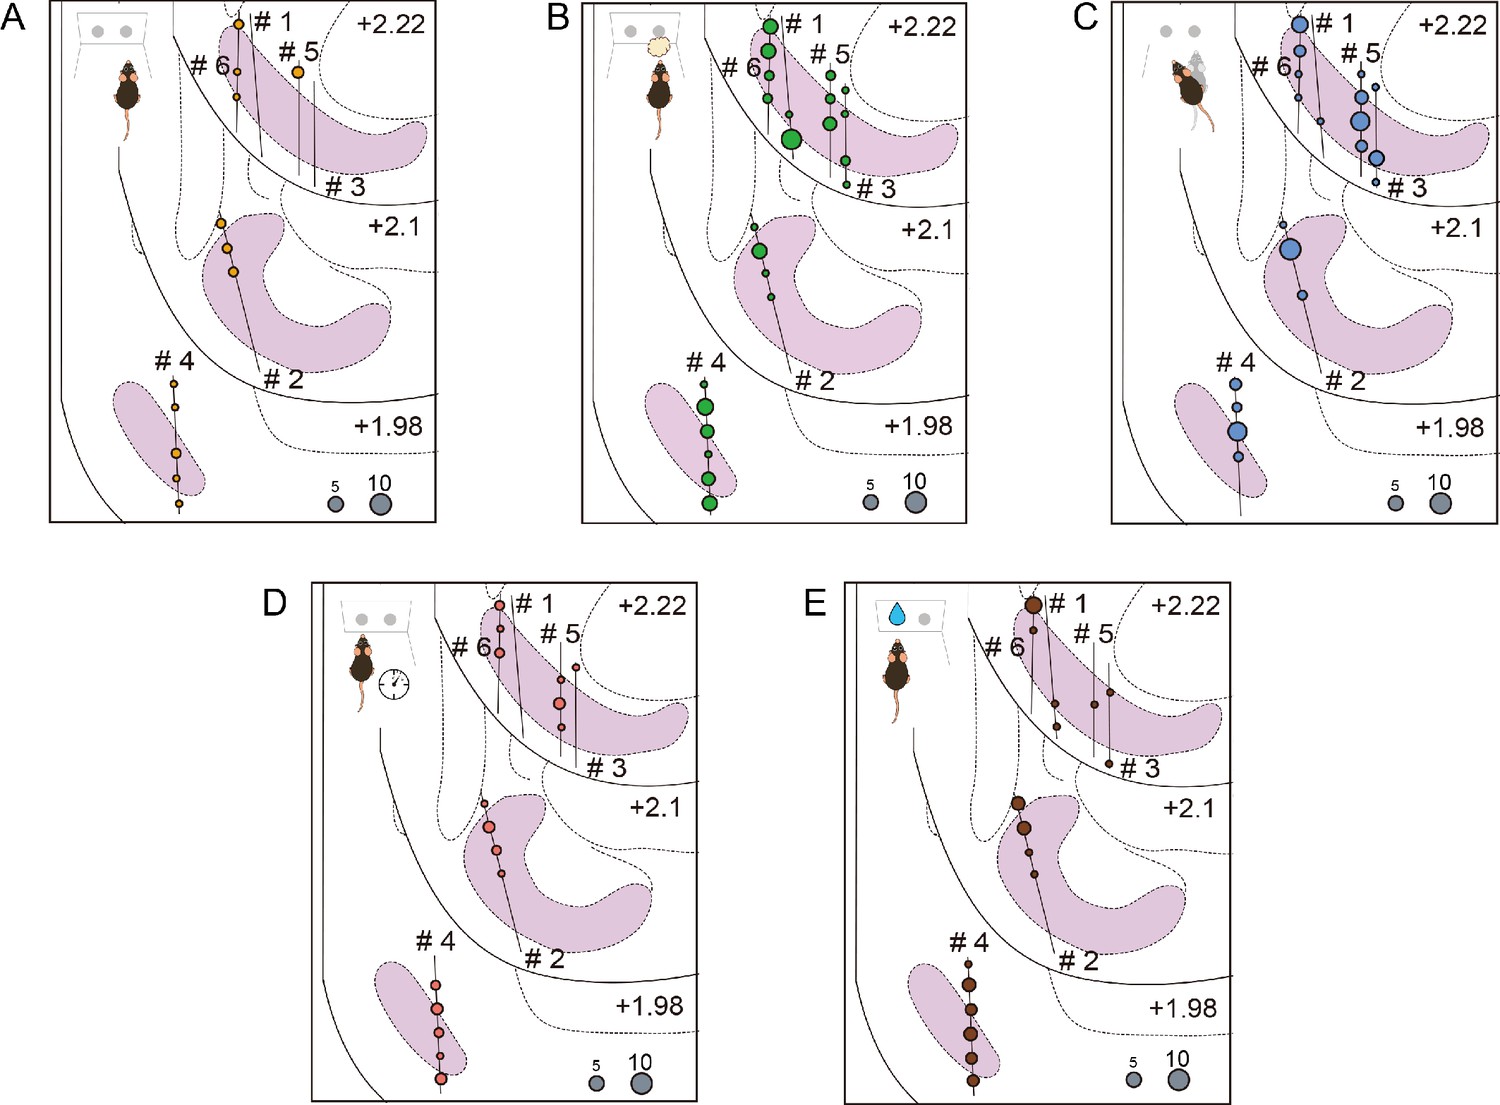
Anatomical distribution of classified vTT cells in the odor-guided go/no-go task.
Each circle indicates the number of classified cells based on the position of tuning peak times. The cells were classified into (A) approach epoch, (B) odor-sampling epoch, (C) moving epoch, (D) waiting epoch, and (E) drinking epoch in the odor-guided go/no-go task. Each gray circle indicates the number of cells. Numbers correspond to individual mouse numbers in Table 1.
Figure 4—figure supplement 3
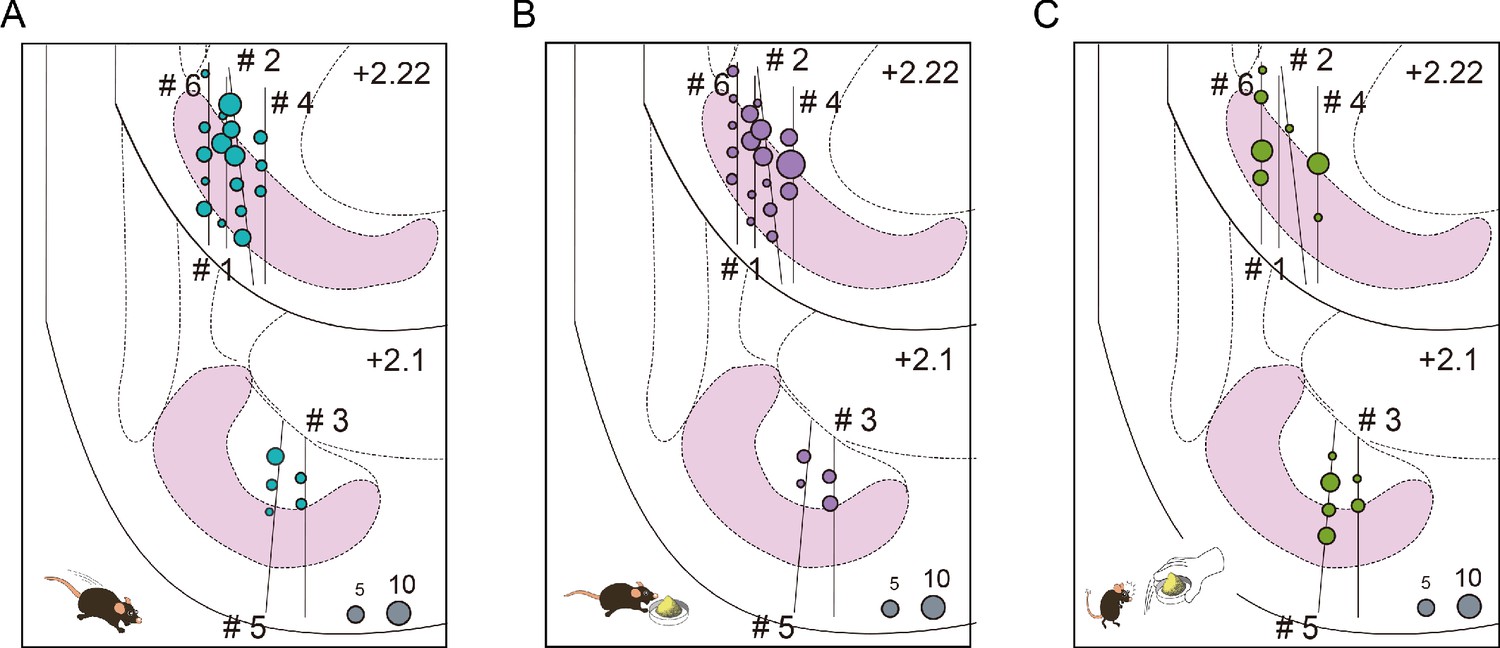
Anatomical distribution of classified vTT cells in the odor-guided eating/no-eating task.
Each circle indicates the number of classified cells based on the position of tuning peak times. The cells were classified into (A) approach epoch, (B) eating epoch, and (C) removal epoch in the odor-guided eating/no-eating task. Gray circles indicate the number of cells. The numbers correspond to individual mouse numbers in Table 2.
Figure 4—figure supplement 4
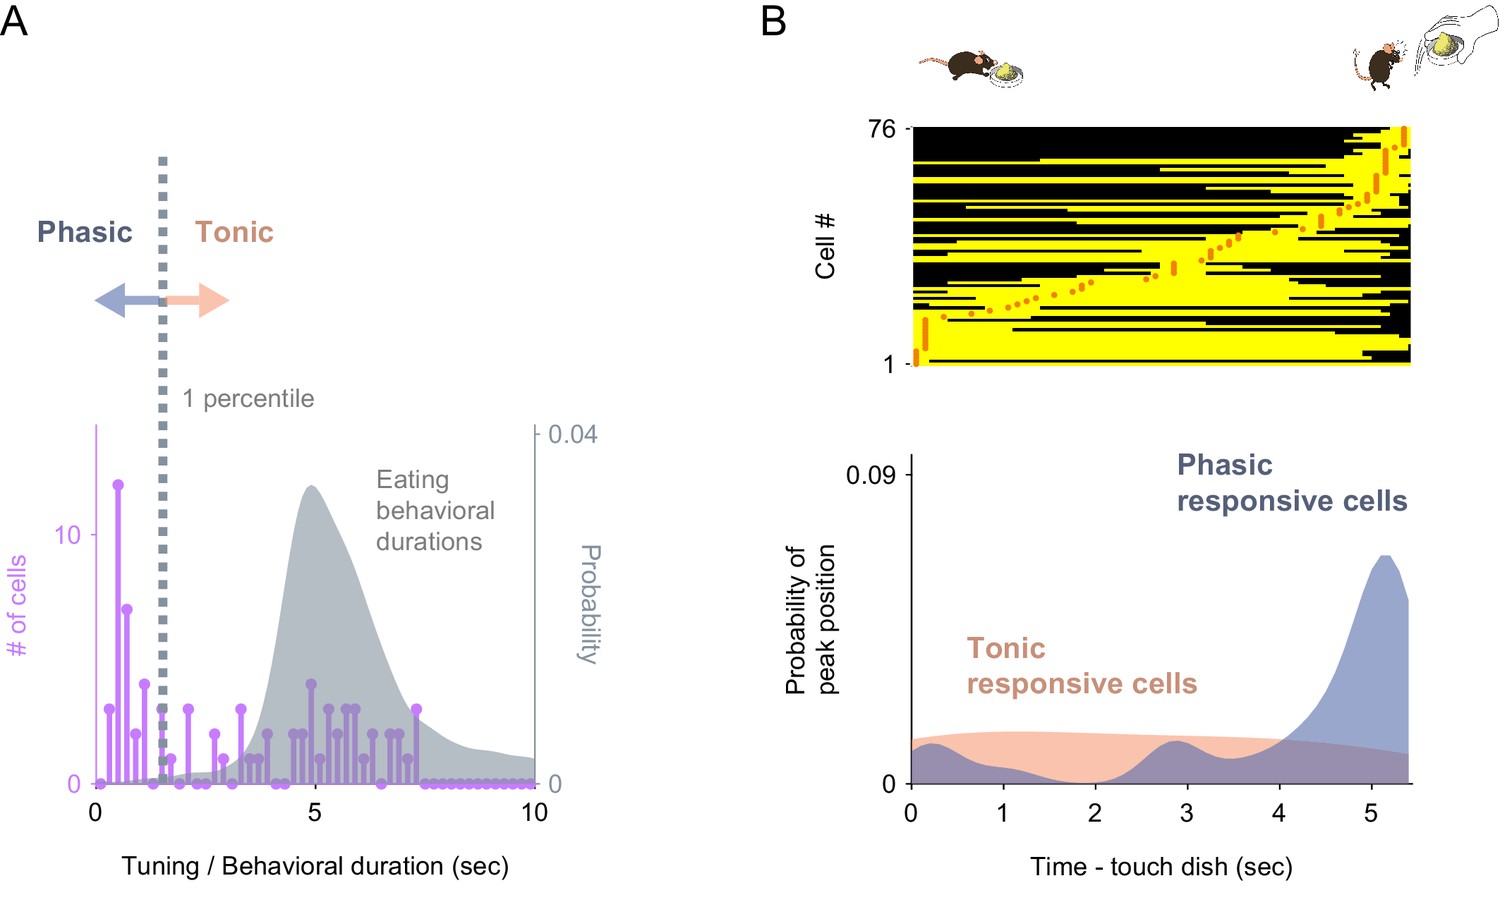
vTT cells with tuning peak times in the eating epoch consisted of phasic and tonic responsive cells.
(A) We classified vTT cells with tuning peak times in the eating epoch (n = 76) into two types based on tuning duration. Cells with tuning durations shorter than one percentile of the eating duration (gray histogram) were defined as phasic responsive cells (n = 31); others were defined as tonic-responsive cells (n = 45). (B) There was a significant difference in the distributions of tuning peak times (orange dots) during eating behaviors between phasic and tonic-responsive cells (p<10−4, two-sample Kolmogorov–Smirnov test). Note that the phasic-responsive cells were mainly distributed before dish removal, and the tonic-responsive cells tended to be uniformly distributed.
Figure 5
Behavioral context-specific activity of vTT cells.
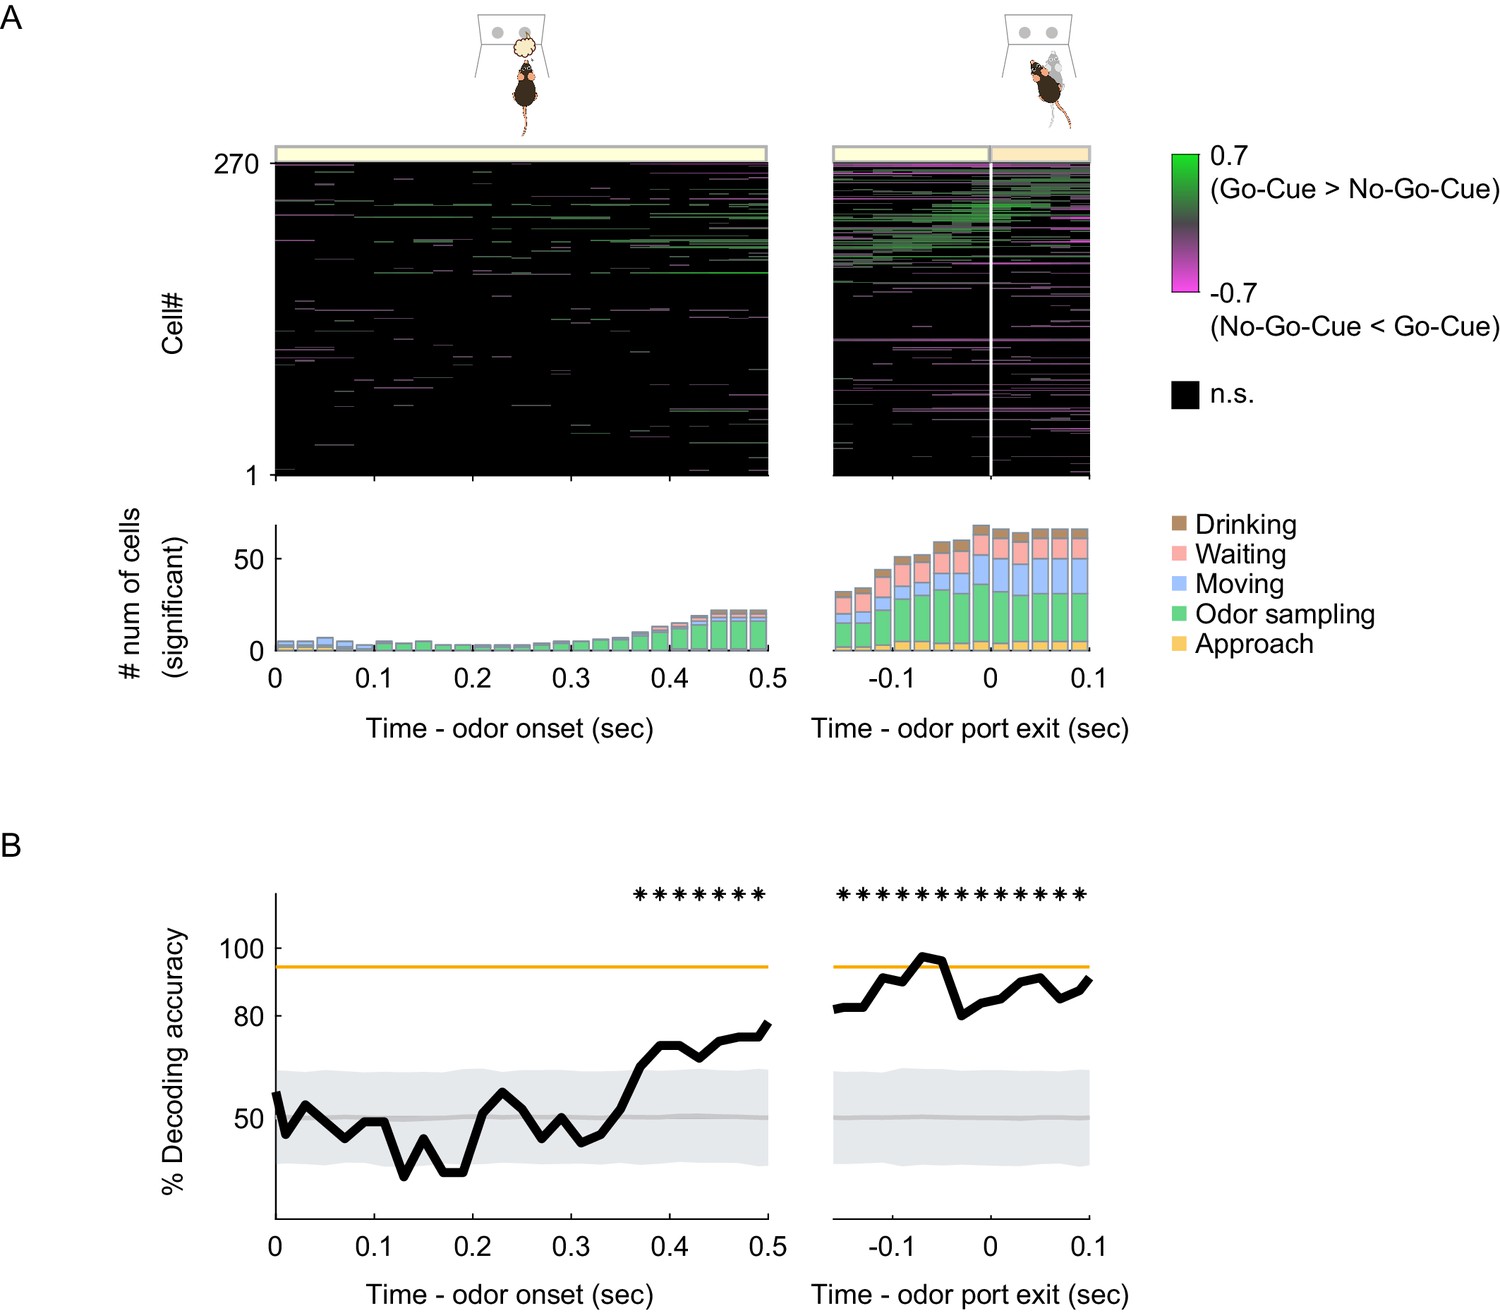
(A) Upper panel: auROC values for all cells around the odor sampling epoch in the odor-guided go/no-go task. Each row corresponds to one cell. auROC values (left, aligned to the odor valve opening; right, aligned to the odor port exit) were calculated for correct go trials versus correct no-go trials in sliding bins (width, 100 ms; step, 20 ms). These values were sorted based on the time of peak auROC values in the right graph. The vertical white line indicates the time of odor port exit. The color scale indicates significant auROC values (p<0.01, permutation test). The black boxes indicate bins with non-significant auROC values. Lower panel: the number of cells that exhibited significant auROC values (p<0.01, permutation test) for each time bin (orange, cell group tuned to the approach epoch; green, odor sampling epoch; blue, moving epoch; red, waiting epoch; brown, drinking epoch). (B) The time course of odor decoding accuracy in the odor-guided go/no-go task. A vector consisting of instantaneous spike counts for 270 neurons in a sliding window (width, 100 ms; step, 20 ms) was used as input for the classifier. Training of the classifier and testing were performed at every time point. The orange line indicates the level of behavioral performance. The gray line and shaded area indicate the mean ± 2 SD of control decoding accuracies calculated from 1000 trial-label-shuffled datasets. The shuffled datasets are provided in the Figure 5—source data 1. Top asterisks indicate accuracies greater than the mean + 2SD.
-
Figure 5—source data 1
Source data of the time course of odor decoding accuracy.
- https://cdn.elifesciences.org/articles/57268/elife-57268-fig5-data1-v2.zip
Figure 6
Cell types and connectivity patterns of vTT cells.
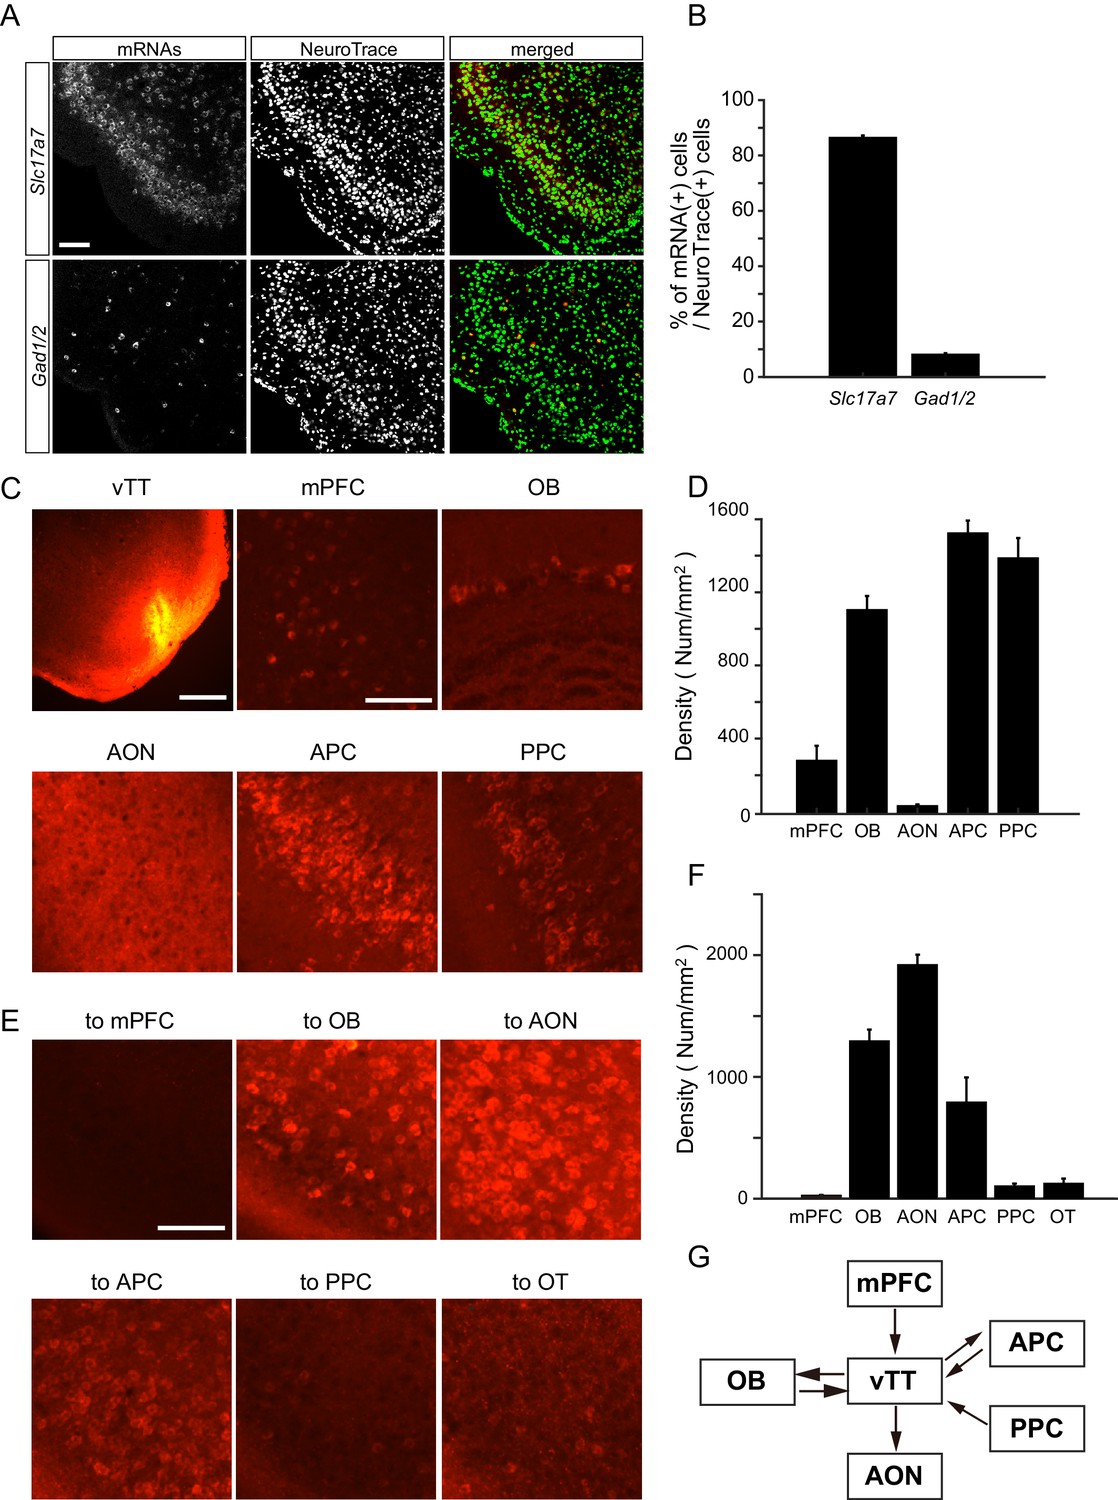
(A) In situ hybridization of Slc17a7 (upper panels) and Gad1/2 (lower panels) mRNAs with Neurotrace staining of vTT cells. Scale bar, 100 μm. (B) Average percentages of Slc17a7-positive cells (left column) and Gad1/2-positive cells (right column) among Neurotrace-positive cells in the vTT (n = 3 mice). Error bars indicate SEM. (C) Upper left: Coronal section of the vTT after injection of Alexa 555-conjugated cholera toxin subunit B (CTB, red). Scale bar, 500 μm. The five other panels show CTB-labeled cells after CTB injections in the vTT. mPFC, medial prefrontal cortex; OB, olfactory bulb; AON, anterior olfactory nucleus; APC, anterior piriform cortex; PPC, posterior piriform cortex. Scale bar, 100 μm. (D) Average density of CTB-labeled cell bodies in each area (mPFC, n = 5 from three mice; OB, n = 5 from three mice; AON, n = 3 from two mice; APC, n = 5 from three mice; PPC, n = 5 from three mice). Error bars indicate SEM. (E) CTB-labeled vTT cells after injection of CTB into the mPFC (upper left), OB (upper middle), AON (upper right), olfactory tubercle (OT, lower left), APC (lower middle), and PPC (lower right). Scale bar, 100 μm. (F) Average density of retrogradely labeled CTB-positive cells in the vTT (n = 3 from two mice). Error bars indicate SEM. (G) Schematic diagram of vTT connectivity patterns. Arrows indicate axonal projections.
-
Figure 6—source data 1
Source data of the percentages of Slc17a7-positive cells and Gad1/2-positive cells in each animal.
- https://cdn.elifesciences.org/articles/57268/elife-57268-fig6-data1-v2.xlsx
-
Figure 6—source data 2
Source data of the density of CTB-labeled cells in each area (D) and in the vTT (F).
- https://cdn.elifesciences.org/articles/57268/elife-57268-fig6-data2-v2.xlsx
Tables
Table 1
Basic information in the odor-guided go/no-go task.
| Mouse | Recording sessions | Trials/session | Go trials/session | No-Go trials/session | Recorded cells/session |
|---|---|---|---|---|---|
| #1 | 5 | 380 ± 31 | 190 ± 16 | 190 ± 15 | 3 ± 1 |
| #2 | 8 | 453 ± 27 | 227 ± 14 | 226 ± 13 | 6 ± 2 |
| #3 | 5 | 435 ± 44 | 217 ± 22 | 217 ± 22 | 4 ± 1 |
| #4 | 14 | 464 ± 21 | 233 ± 10 | 231 ± 10 | 7 ± 1 |
| #5 | 13 | 321 ± 24 | 161 ± 12 | 160 ± 12 | 3 ± 0 |
| #6 | 10 | 443 ± 24 | 222 ± 12 | 222 ± 12 | 5 ± 1 |
Table 2
The distribution of the vTT cell groups in the odor-guided go/no-go task.
| Mouse | Approach cells | Odor sampling cells | Moving cells | Waiting cells | Drinking cells | Others | (Total) |
|---|---|---|---|---|---|---|---|
| #1 | 0 | 10 | 1 | 0 | 2 | 0 | 13 |
| #2 | 6 | 8 | 13 | 7 | 10 | 4 | 48 |
| #3 | 0 | 5 | 7 | 1 | 2 | 3 | 18 |
| #4 | 6 | 21 | 15 | 11 | 18 | 32 | 103 |
| #5 | 3 | 8 | 16 | 5 | 1 | 7 | 40 |
| #6 | 4 | 14 | 11 | 5 | 7 | 7 | 48 |
| (Total) | 19 | 66 | 63 | 29 | 40 | 53 | 270 |
Table 3
Basic information in the odor-guided eating/no-eating task.
| Mouse | Recording sessions | Trials/session | Eating trials/session | No-Eating trials/session | Recorded cells/session |
|---|---|---|---|---|---|
| #1 | 6 | 48 ± 2 | 36 ± 2 | 12 ± 0 | 6 ± 2 |
| #2 | 10 | 44 ± 1 | 33 ± 1 | 11 ± 0 | 7 ± 1 |
| #3 | 6 | 55 ± 2 | 44 ± 2 | 11 ± 0 | 6 ± 1 |
| #4 | 12 | 59 ± 1 | 48 ± 1 | 12 ± 0 | 8 ± 1 |
| #5 | 10 | 55 ± 2 | 45 ± 2 | 11 ± 0 | 5 ± 1 |
| #6 | 18 | 58 ± 0 | 48 ± 0 | 11 ± 0 | 5 ± 1 |
Table 4
The distribution of the vTT cell groups in the odor-guided eating/no-eating task.
| Mouse | Approach cells | Eating cells | Removal cells | Others | (Total) |
|---|---|---|---|---|---|
| #1 | 9 | 13 | 0 | 13 | 35 |
| #2 | 31 | 20 | 1 | 17 | 69 |
| #3 | 4 | 7 | 4 | 19 | 34 |
| #4 | 7 | 24 | 9 | 51 | 91 |
| #5 | 8 | 4 | 15 | 21 | 48 |
| #6 | 12 | 8 | 16 | 61 | 97 |
| (Total) | 71 | 76 | 45 | 182 | 374 |
Key resources table
| Reagent type (species) or resource | Designation | Source or reference | Identifiers | Additional information |
|---|---|---|---|---|
| Gene Mus musculus | Slc17a7 (vglut1) | NCBI Reference Sequence | NM_182993.2 | |
| Gene Mus musculus | Gad2 (Gad65) | NCBI Gene | 14417 | |
| Gene Mus musculus | Gad1 (Gad67) | NCBI Gene | 14415 | |
| Strain, strain background (Mus musculus) | Male C57BL/6 | Shimizu Laboratory Supplies Co., LTD and SLC Japan | RRID:MGI:5658686 | Wild-type mouse |
| Commercial assay, kit | DIG RNA Labeling Kit (SP6/T7) | Roche | Cat# 11175025910 | |
| Antibody | Anti-Digoxigenin-AP, Fab fragments (Sheep polyclonal) | Roche | Cat# 11093274910 RRID:AB_2734716 | (1:1,000) |
| Peptide, recombinant protein | CTB (Alexa FluorTM 555 Conjugate) | Thermo Fisher Scientific | Cat# C34776 | |
| Chemical compound, drug | HNPP fluorescence detection set | Roche | Cat# 11758888001 | |
| Chemical compound, drug | Eugenol | TOKYO CHEMICAL INDUSTRY Co., LTD. | Cat# A0021; CAS: 628-63-7 | |
| Chemical compound, drug | Vanilla essence | NARIZUKA Corporation | Cat# 100869 | |
| Chemical compound, drug | Almond essence | NARIZUKA Corporation | Cat# 100835 | |
| Chemical compound, drug | Amyl acetate | TOKYO CHEMICAL INDUSTRY Co., LTD. | Cat# A0021; CAS: 628-63-7 | |
| Software, algorithm | MATLAB_R2019a | The Mathworks, Inc | RRID:SCR_001622 | |
| Software, algorithm | KlustaKwik | PMID:25149694 | RRID:SCR_01448 | |
| Software, algorithm | Mclust-3.5 | AD Redish | http://redishlab.neuroscience.umn.edu/MClust/MClust.html | |
| Other | Bpod r0.5 | Sanworks | RRID:SCR_015943 | Open-source control device designed for behavioral tasks. |
| Other | NeuroTrace 500/525 Green Fluorescent Nissl Stain | Thermo Fisher Scientific | Cat# N21480 | |
| Other | DiI | Molecular Probes | Cat# D3911 | 1 mM |
| Other | PermaFluor | Thermo Fisher Scientific | Cat# TA-030-FM | |
| Other | Polyimide-coated tungsten wire | California Fine Wire | diameter 12.5 μm |
Additional files
Download links
A two-part list of links to download the article, or parts of the article, in various formats.
Downloads (link to download the article as PDF)
Open citations (links to open the citations from this article in various online reference manager services)
Cite this article (links to download the citations from this article in formats compatible with various reference manager tools)
Tuning of olfactory cortex ventral tenia tecta neurons to distinct task elements of goal-directed behavior
eLife 9:e57268.
https://doi.org/10.7554/eLife.57268


