PreBötzinger complex neurons drive respiratory modulation of blood pressure and heart rate
- Department of Physiology, University of Melbourne, Australia
- Institut de Neurobiologie de la Méditerranée, INMED UMR1249, INSERM, Aix-Marseille Université, France
- Faculty of Medicine & Health Sciences, Macquarie University, Australia
- Department of Pharmacology, School of Medical Sciences, University of New South Wales, Australia
- Florey Institute of Neuroscience and Mental Health, University of Melbourne, Australia
Figures
Figure 1
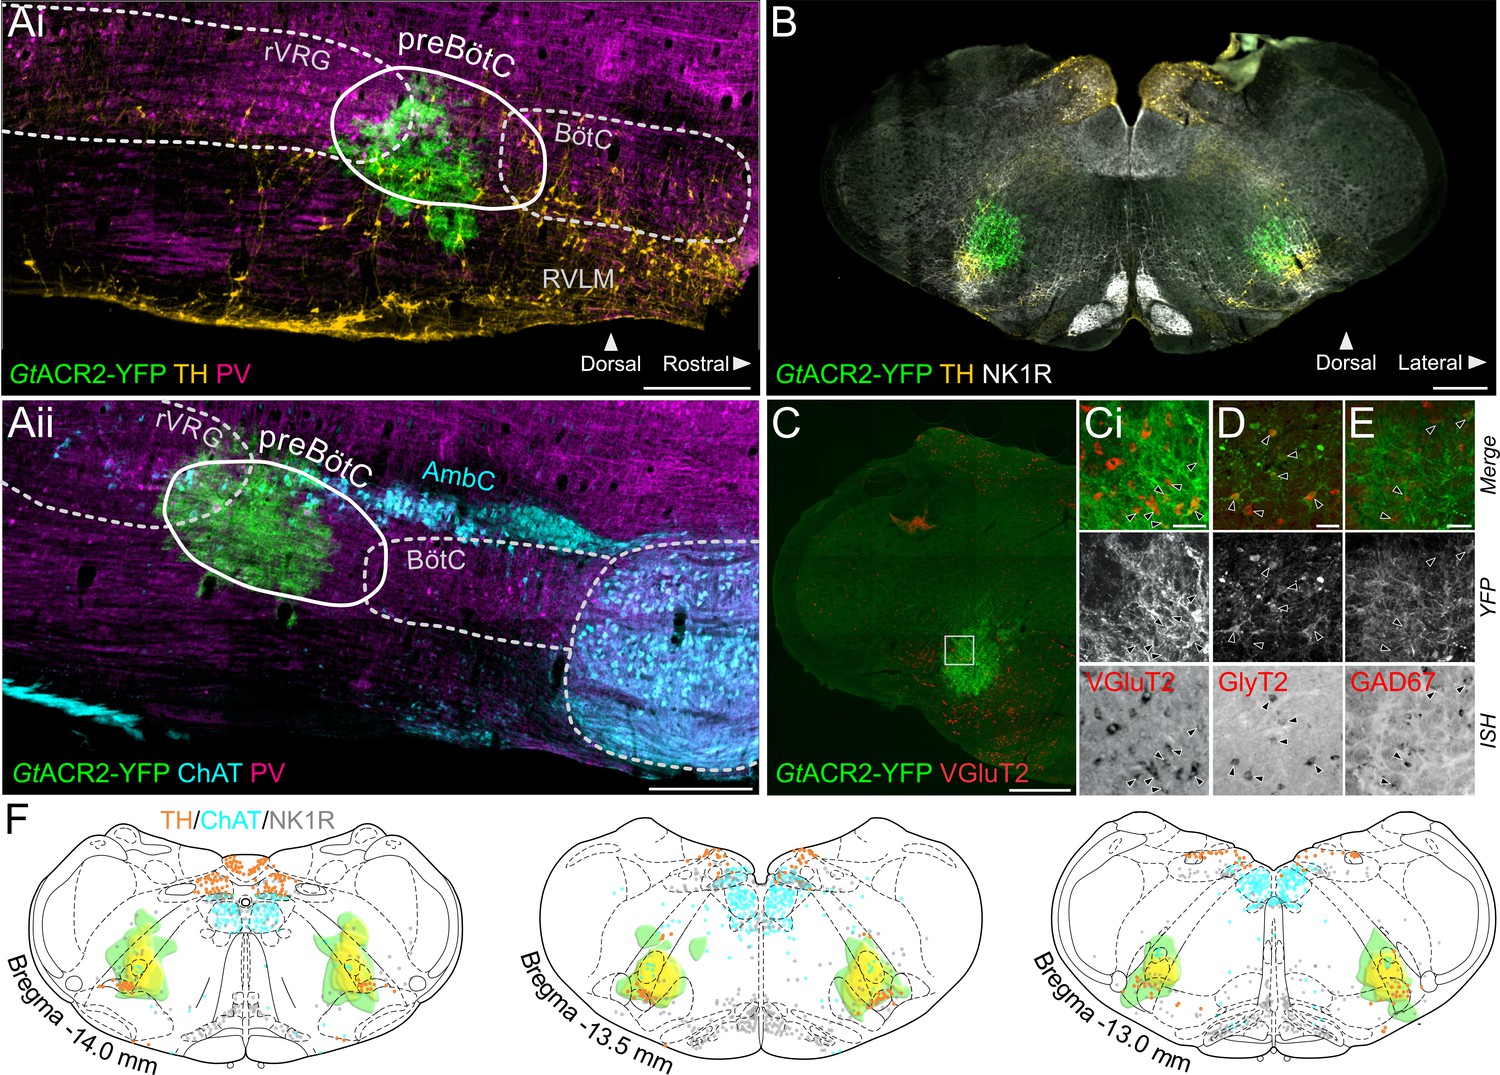
Expression of GtACR2, in the preBötC.
(A) Sagittal and (B) coronal sections showing expression of GtACR2-yellow fluorescent protein (YFP) and parvalbumin (PV), tyrosine hydroxylase (TH), choline acetyltransferase (ChAT) and neurokinin type 1 receptor (NK1R) immunoreactivity. (C) In situ hybridization showing GtACR2-YFP expression in glutamatergic (Ci), glycinergic (D) and GABAergic (E) neurons in the preBötC, as indicated by black arrows. (F) Schematic coronal maps, based on atlas of Paxinos and Watson, 2004, showing the distribution of GtACR2-YFP from all rats (n = 12) used in Working Heart-Brainstem Preparation experiments relative to TH, ChAT and NK1R expression. Each rat is depicted in green with the gradation to yellow indicating increasing overlap in expression between animals, and indicating that the common expression area overlies the preBötC. Scale bars are 500 µm (Ai, Aii, B, C) or 50 µm (Ci, D, E).
Figure 2 with 1 supplement
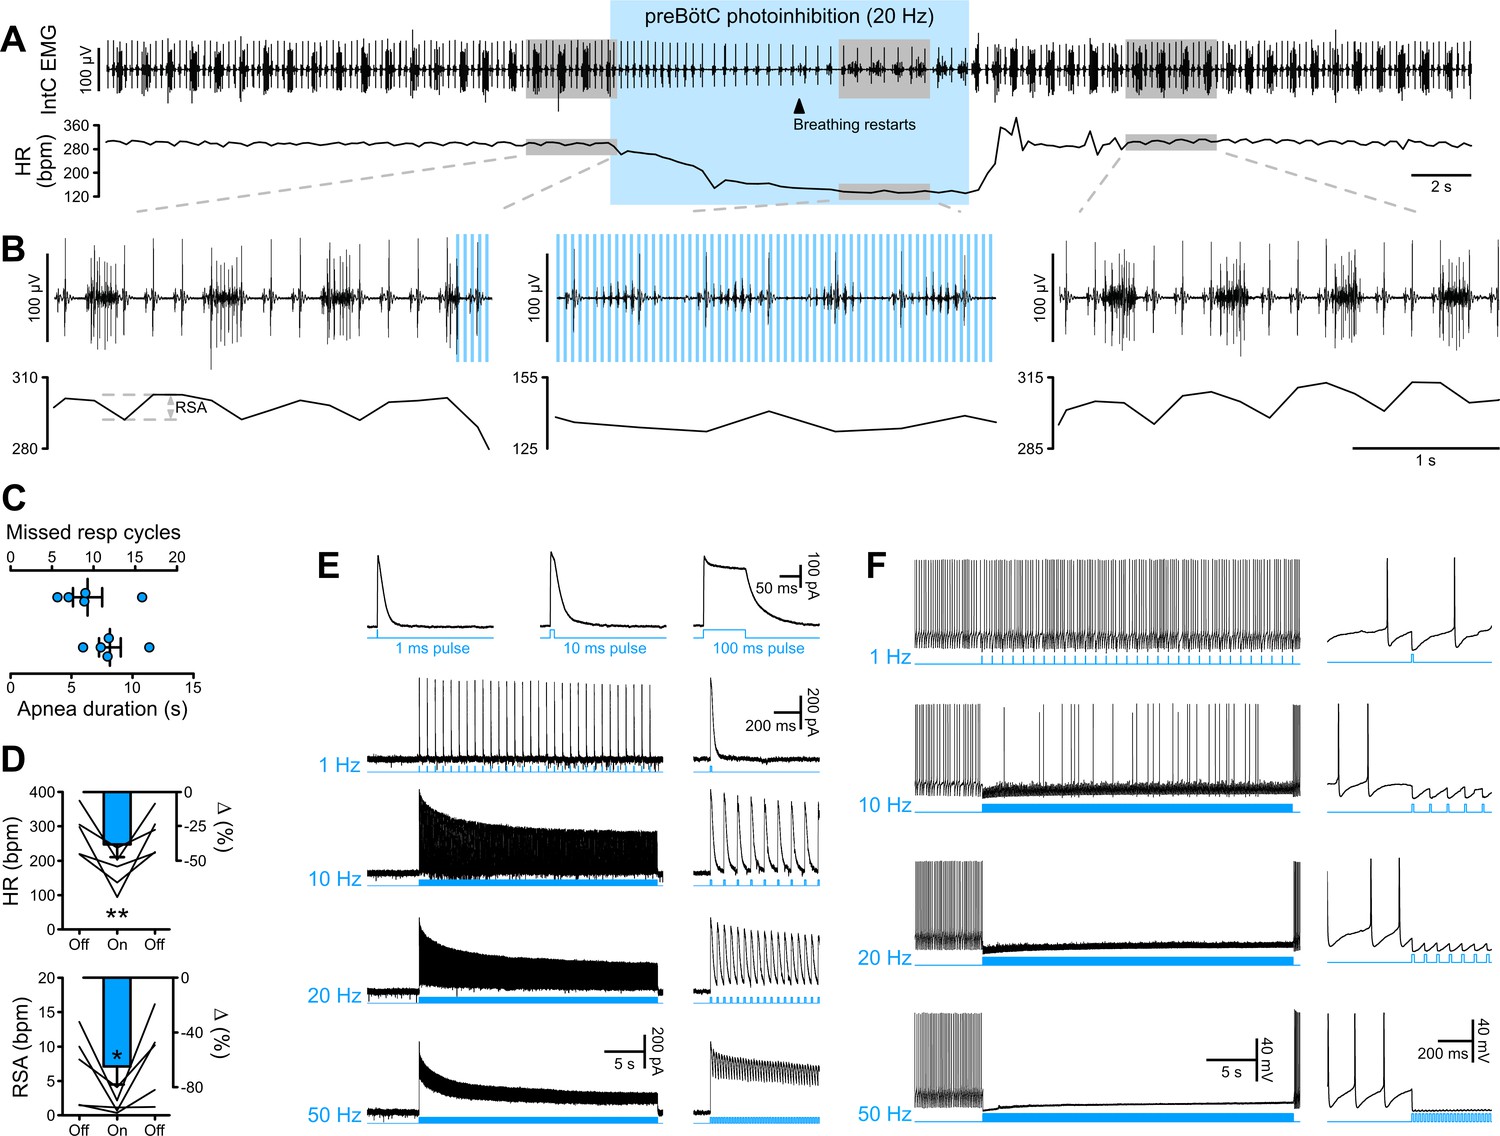
PreBötC photoinhibition in vivo induces respiratory cessation, bradycardia, and suppresses RSA, and GtACR2 photoactivation in vitro causes strong neuronal inhibition.
(A) Intercostal (intC) electromyograph (EMG) recording in an anesthetized P31 rat with bilateral GtACR2 expression in the preBötC, showing bursts of inspiratory activity with the electrocardiogram superimposed, from which heart rate (HR) is derived. Prolonged (20 Hz, 10 ms pulses, 300 pulses) preBötC photoinhibition, starting during inspiration, immediately stopped the inspiratory burst and induced a long apnea, before respiratory activity resumed even though preBötC photoinhibition continued. PreBötC photoinhibition also induced a profound bradycardia, and a decrease in arterial pressure as shown on Figure 2—figure supplement 1 on a separate animal cohort (n = 3). (B) Enlargements of the shaded areas in (A), showing that the first pulse of light immediately stops the intC EMG inspiratory burst, and that when breathing activity resumes during preBötC photoinhibition the intC EMG inspiratory bursts are crenelated with periodic cessations of intC EMG activity after each light pulse. Note that the overall intC EMG ramping discharge pattern is maintained. Respiratory sinus arrhythmia (RSA), the oscillations in HR in phase with respiratory activity, is abolished during preBötC photoinhibition, even when breathing activity resumes. (C–D) PreBötC photoinhibition induced a prolonged cessation of breathing activity, bradycardia and suppression of RSA in all animals tested (n = 5, mean ± SEM for group values; one-way repeated measures ANOVA followed with post hoc Holm-Sidak multiple-comparison test performed on raw data, as shown on the associated source data and detailed statistics; *p<0.05, **p<0.01, photoinhibition vs. control and recovery conditions). (E–F) Whole-cell recordings (low Cl- internal solution, ECl-=−68.8 mV) of GtACR2-positive solitary tract nucleus neurons in brainstem slices in voltage clamp ((E), holding voltage −40 mV) and current clamp (F) modes. (E) GtACR2 photostimulation induced large inhibitory conductances that showed fast activation and deactivation kinetics, and little inactivation, as previously shown (Govorunova et al., 2015). The photocurrents persisted throughout the prolonged photostimulation protocols. (F) In a spontaneously active cell, GtACR2 photostimulation prevented action potential firing when the light pulse was delivered at the appropriate timing, resulting in complete firing cessation during prolonged high frequency photostimulations including and above 20 Hz.
-
Figure 2—source data 1
Source data and statistics for Figure 2.
- https://cdn.elifesciences.org/articles/57288/elife-57288-fig2-data1-v2.xlsx
Figure 2—figure supplement 1
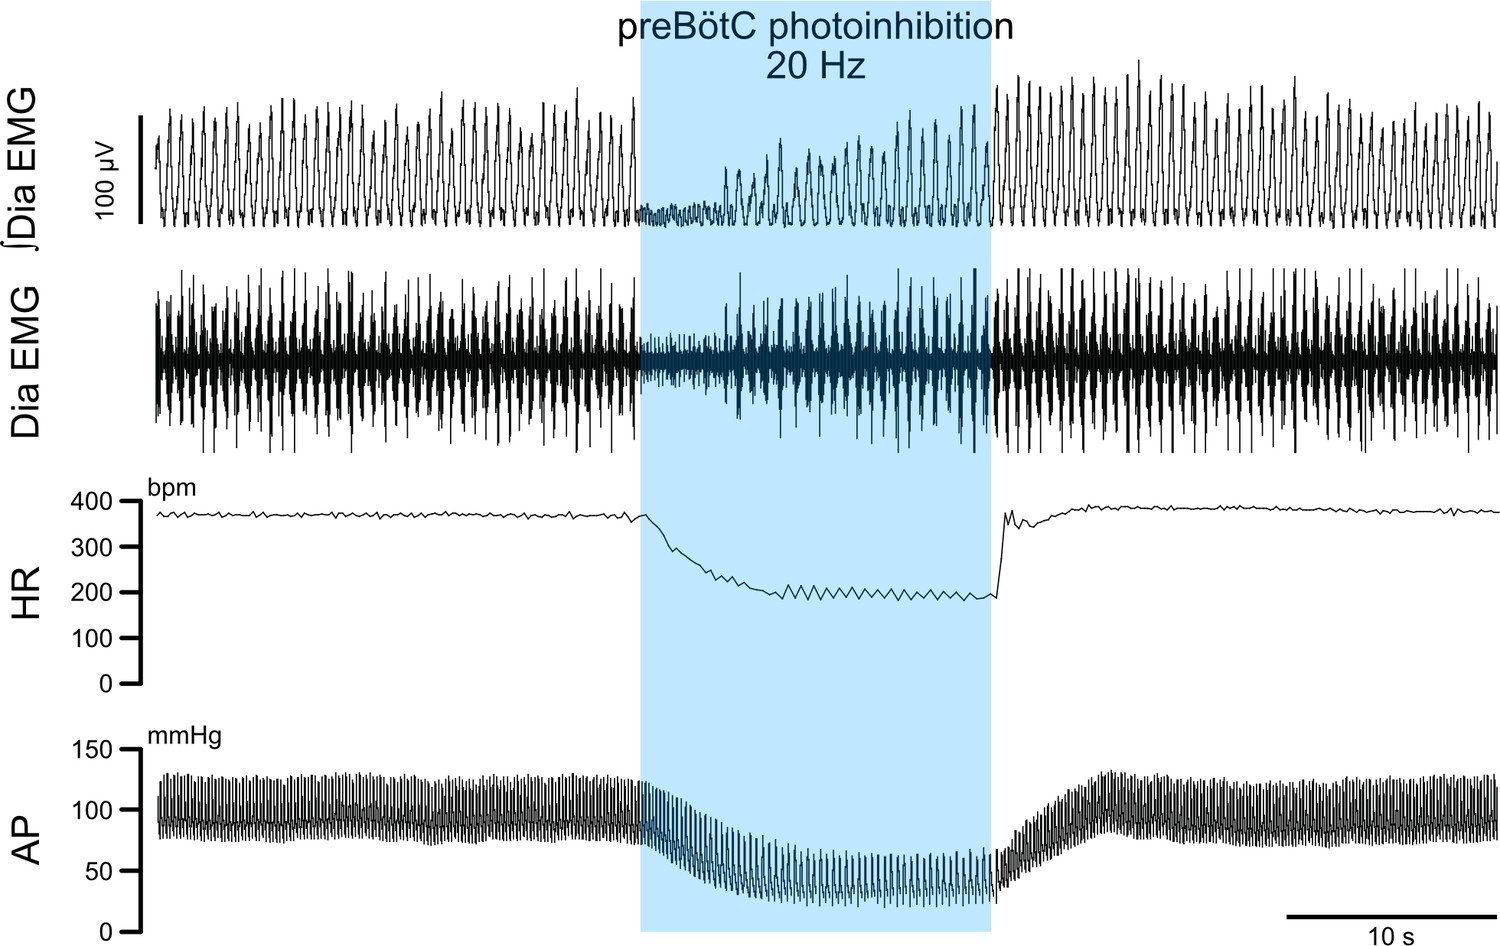
PreBötC photoinhibition in vivo induces respiratory cessation, bradycardia, and decreases arterial pressure.
In a separate cohort (n = 3) from the one shown on Figure 2, we recorded diaphragm (Dia) electromyograph (EMG) activity, heart rate (HR) and arterial pressure (AP) in anesthetized P31 rats with bilateral GtACR2 expression in the preBötC. Prolonged preBötC photoinhibition induced a long apnea, before respiratory activity resumed even though preBötC photoinhibition continued. PreBötC photoinhibition also induced a profound bradycardia and decreased AP.
Figure 3 with 2 supplements
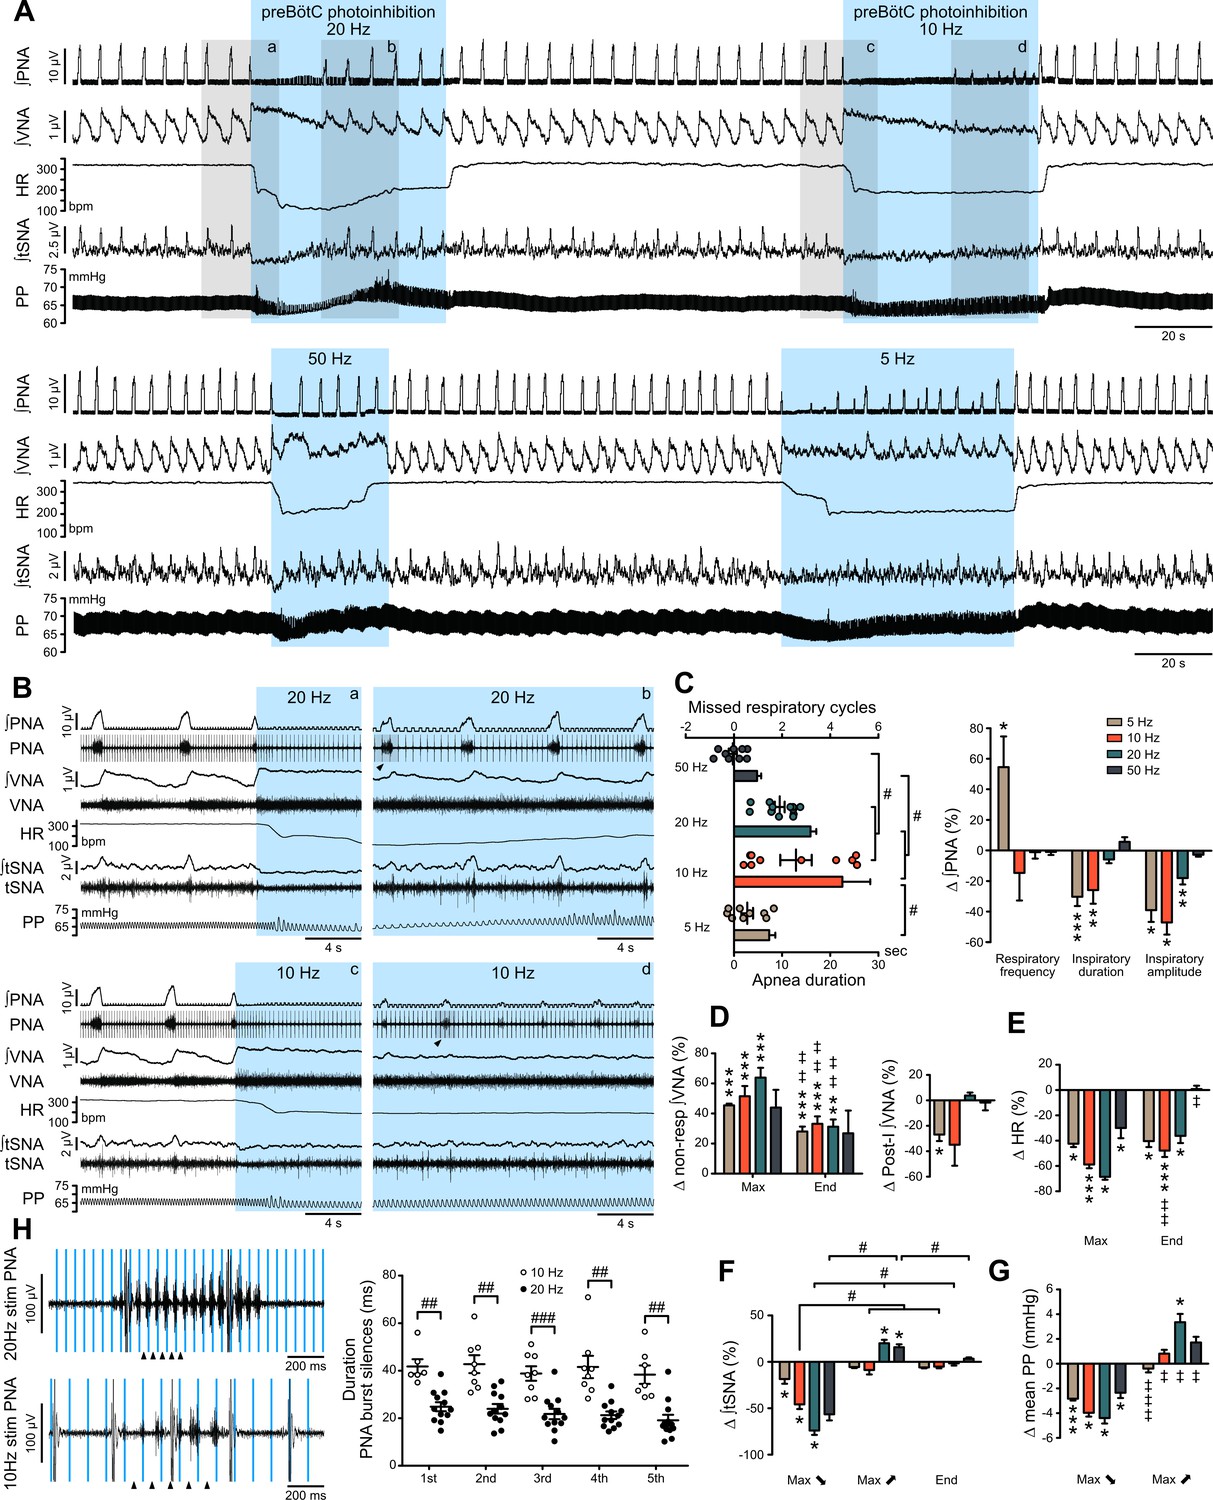
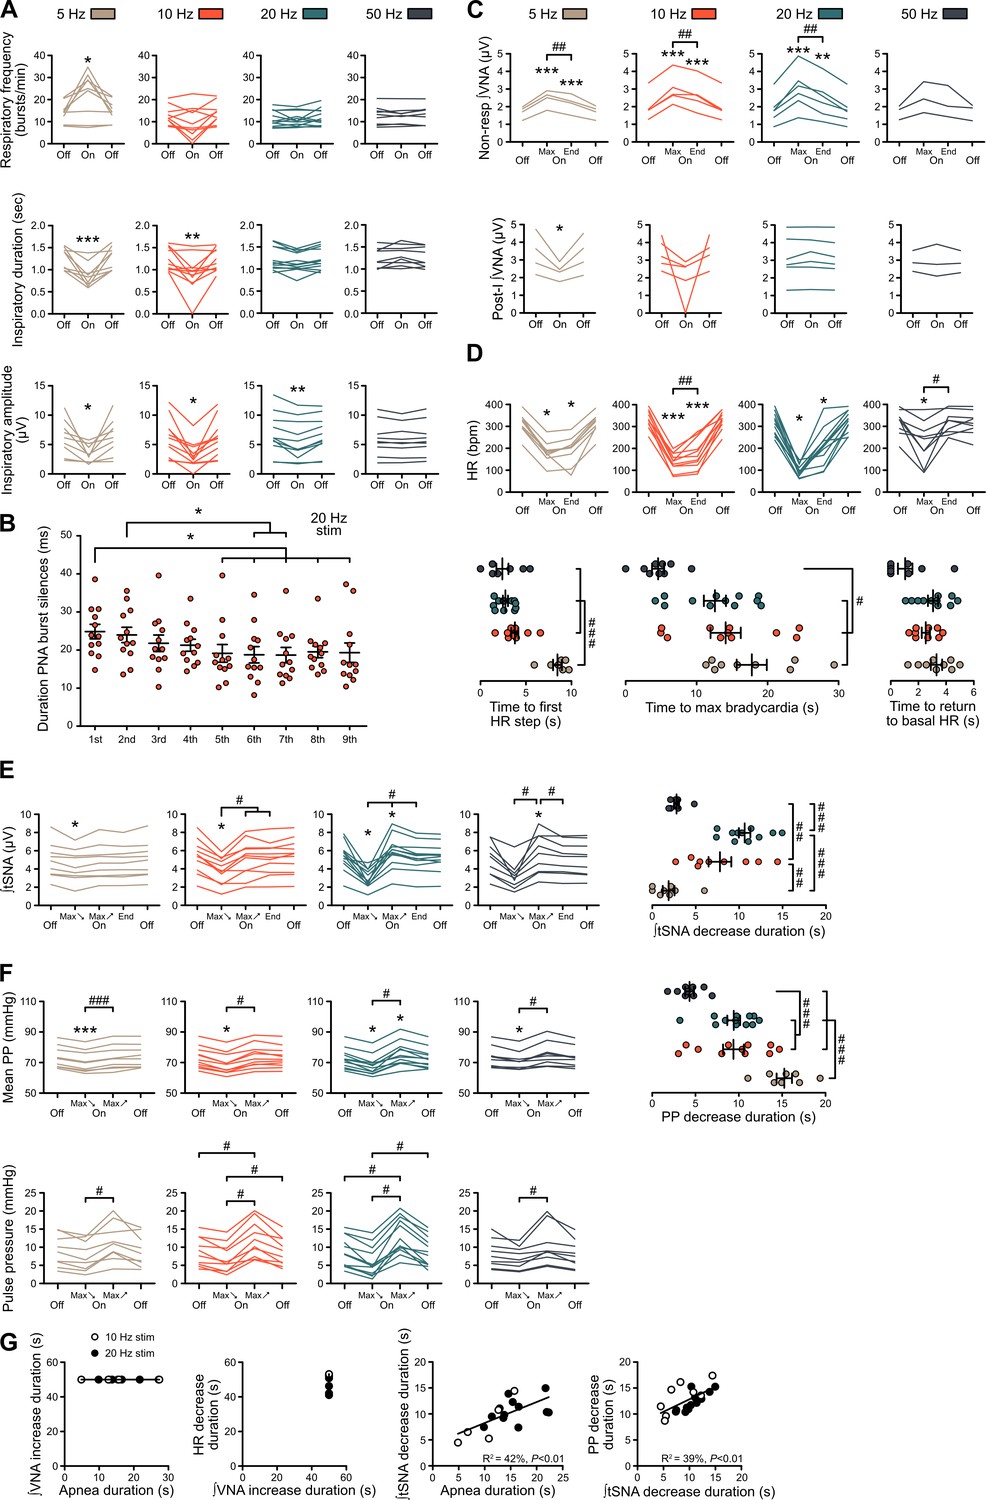
Effect of prolonged preBötC photoinhibition in situ on cardio-respiratory function.
(A) Recording of phrenic nerve activity (PNA), vagus nerve activity (VNA) and thoracic sympathetic nerve activity (tSNA), heart rate (HR) and perfusion pressure (PP), in an in situ Working Heart-Brainstem Preparation (WHBP) with bilateral photoinhibition of the preBötC at 5, 10, 20 and 50 Hz. Following the initial apnea, PNA resumed despite continued preBötC photoinhibition. VNA increased and HR decreased for the entire photoinhibition period. A transient decrease in tSNA and PP, concomittent with the apnea, was followed by increases in tSNA and PP with the return of PNA. (B) Higher resolution recordings of the shaded areas in (A) showing the strongest physiological effects occurred with 20 Hz and 10 Hz photoinhibition. (C–G) Group data (n = 12), expressed as change relative to the pre-photoinhibition control period, examining changes in respiratory parameters, including PNA characteristics following resumption of activity during continued photoinhibition (C); VNA measured outside of inspiratory/post-inspiratory activities (non-resp) and in the post-inspiratory period (D); HR (E) tSNA (F) and PP (G). Details regarding VNA and tSNA analysis are shown on Figure 3—figure supplement 2. (H) Higher temporal resolution recordings of the periods denoted by arrowheads in (B), showing the crenelated PNA burst shape, yet with maintained ramping discharge pattern. Analysis of the first five PNA burst silence periods, denoted by arrowheads in (H), showed the 20 Hz photoinhibition induced shorter silence durations. Group data are presented as mean ± SEM; Friedman repeated measures analysis of variance on ranks followed with pairwise multiple comparison Tukey test, one-way repeated measures ANOVA followed with post hoc Holm-Sidak multiple-comparison test, paired student’s t-test or Wilcoxon signed rank test, performed on raw data, as shown on Figure 3—figure supplement 1 and associated source data and detailed statistics; *p<0.05, **p<0.01, ***p<0.001, photoinhibition vs. control and recovery conditions; # p<0.05, ## p<0.01, ### p<0.001, between compared data; ‡ p<0.05, ‡‡ p<0.01, ‡‡‡ p<0.001, intra-photostimulation frequency vs. max change.
-
Figure 3—source data 1
Source data and statistics for Figure 3.
- https://cdn.elifesciences.org/articles/57288/elife-57288-fig3-data1-v2.xlsx
Figure 3—figure supplement 1
Individual data showing alterations of respiratory, sympathetic vasomotor and cardiac parasympathetic activities during prolonged GtACR2-mediated preBötC photoinhibition in situ.
(A–F) Individual data for the in situ WHBP of P31 rats with bilateral GtACR2 expression in the preBötC, presented as group data in Figure 3. (A) Individual data for respiratory frequency, and PNA burst inspiratory duration and amplitude, presented as group data in Figure 3C. During prolonged 20 Hz preBötC photoinhibition, PNA bursts were transiently silenced after each light pulse as shown on Figure 3H. (B) The duration of PNA burst silences during an individual burst decreased with continued photoinhibitory pulses. The abscissae shows successive PNA bursts with the duration of silences on the ordinate, starting from the first pulse of light that impacted the analysed PNA burst. (C) Individual data for VNA measured outside (non-resp) the inspiratory/post-inspiratory activities, and for the post-inspiratory component of VNA, presented as group data in Figure 3D. (D) Individual data for HR, presented as group data in Figure 3E. HR decreased in steps at the beginning of preBötC photoinhibition, the first step being reached earlier in the high-frequency preBötC photoinhibitions. Similarly, the time to reach maximum bradycardia from the beginning of preBötC photoinhibition trials was shorter with high-frequency preBötC photoinhibition. The time to return to basal HR, during the recovery period, was only shorter for the 50 Hz photoinhibition compared to other frequencies. (E) Individual data for mean tSNA, presented as group data in Figure 3F. The mean tSNA decrease was more pronounced for 10 Hz and 20 Hz preBötC photoinhibition, both in amplitude and duration. (F) Individual data for mean PP, presented as group data in Figure 3G, and for pulse pressure. PP decrease duration for 10 Hz, 20 Hz and 50 Hz preBötC photoinhibitions followed the same timing as mean tSNA decrease, but not for 5 Hz preBötC photoinhibition, likely due to the decreased RespSNA and Traube-Hering waves that lasted the entire 5 Hz preBötC photoinhibition period. (G) Linear regression analysis of data, showing that the overall cardiac parasympathetic drive elicited by preBötC photoinhibition is unrelated to the presence of respiratory activity. In contrast, the vasomotor sympathetic tone is directly related to it, suggesting different mechanisms of action. Group data are presented as mean ± SEM; Friedman repeated measures analysis of variance on ranks followed with pairwise multiple comparison Tukey test, one-way repeated measures ANOVA followed with post hoc Holm-Sidak multiple-comparison test, paired student’s t-test or Wilcoxon signed rank test, performed on raw data, as shown on the associated source data and detailed statistics; *p<0.05, **p<0.01, ***p<0.001, photoinhibition vs. control and recovery conditions; # p<0.05, ## p<0.01, ### p<0.001, between photostimulation frequencies; ‡ p<0.05, ‡‡ p<0.01, ‡‡‡ p<0.001, intra-photostimulation frequency vs. max change.
Figure 3—figure supplement 2
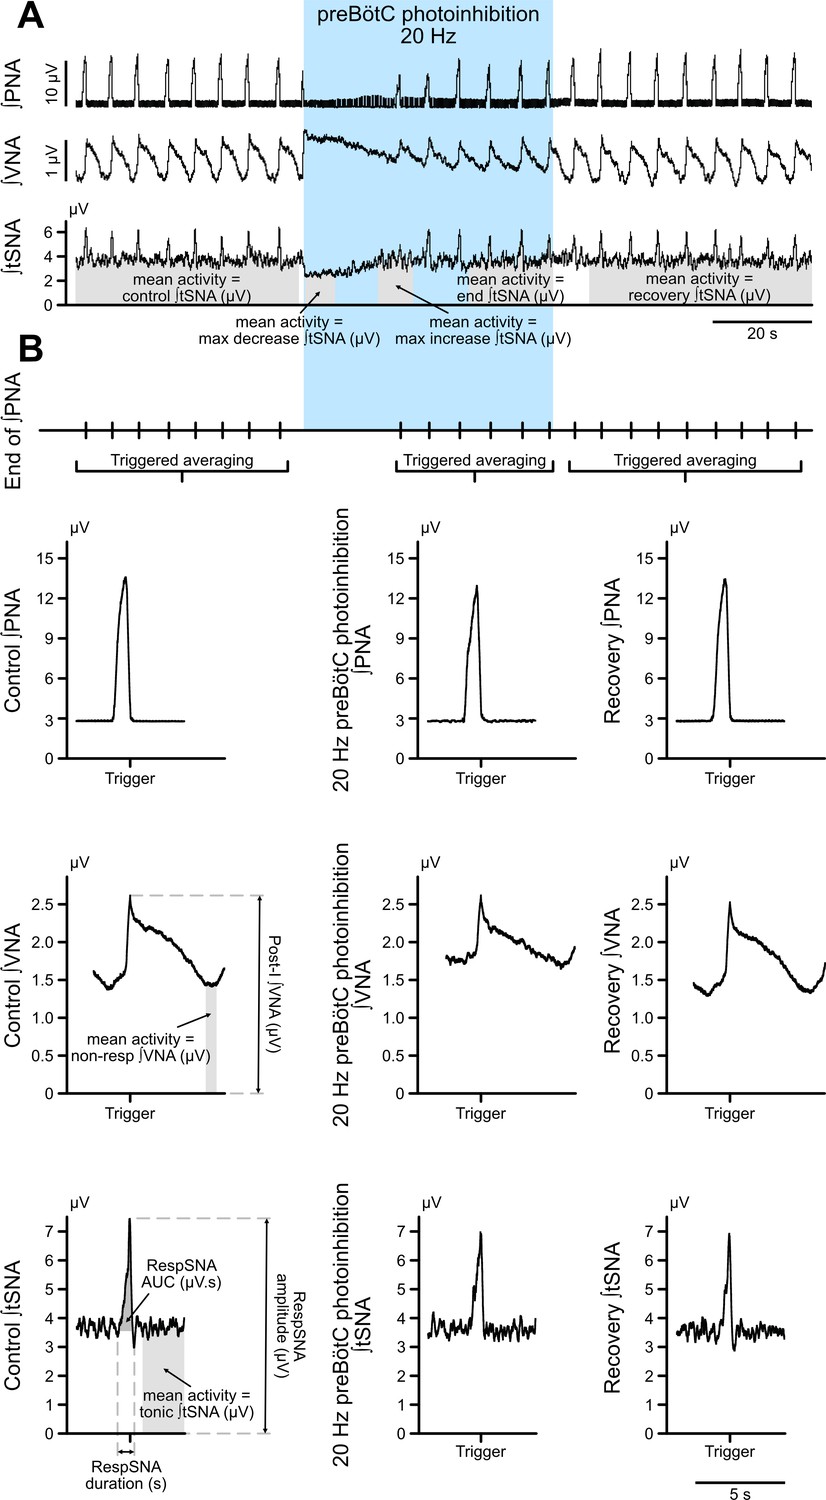
Method for analysis of the different components of VNA and tSNA.
(A) Prolonged photoinhibition of the preBötC induced three different effects on total tSNA, depending on the respiratory status. To demonstrate this, we analyzed, as a repeated measures comparison, the mean integrated tSNA during a pre-photoinhibition control period; the initial photoinhibition period with the maximal tSNA decrease during the apneic period; the photoinhibition period where PNA restarted and there was a maximal tSNA increase; the end of the photostimulation period; and in the recovery post-photoinhibition period. These periods are shown in grey on the integrated tSNA trace in A. Analysis of total tSNA is shown on Figure 3F and Figure 3—figure supplement 1E. (B) To assess whether preBötC prolonged photoinhibition could have specific effects on the phasic respiratory-associated and tonic non-respiratory-associated components of tSNA and VNA, we performed respiratory (end of PNA) triggered averaging of integrated tSNA and VNA. The phasic burst of respiratory modulation of tSNA, called here RespSNA, was analyzed for its duration, amplitude, and AUC above tonic tSNA. Non-respiratory-modulated tSNA was called tonic tSNA, and analyzed as the mean activity outside the burst of RespSNA. RespSNA analysis is presented on Figure 6B and Figure 6—figure supplement 1A, tonic tSNA analysis is presented on Figure 6B and Figure 6—figure supplement 1B. Both respiratory and non-respiratory components of integrated VNA were also quantified. Efferent VNA was measured from the cervical level, where it contains activities going to multiple targets, including respiratory activity going to the upper airways, and parasympathetic activity going to the heart. The peak of post-inspiratory activity was quantified and called Post-I VNA. Mean VNA activity during the late-expiratory phase, which does not contain respiratory-related activity on this nerve, was quantified and called non-resp VNA, as shown on Figure 3D and Figure 3—figure supplement 1C. The same analysis was performed for preBötC prolonged photoexcitation.
Figure 4
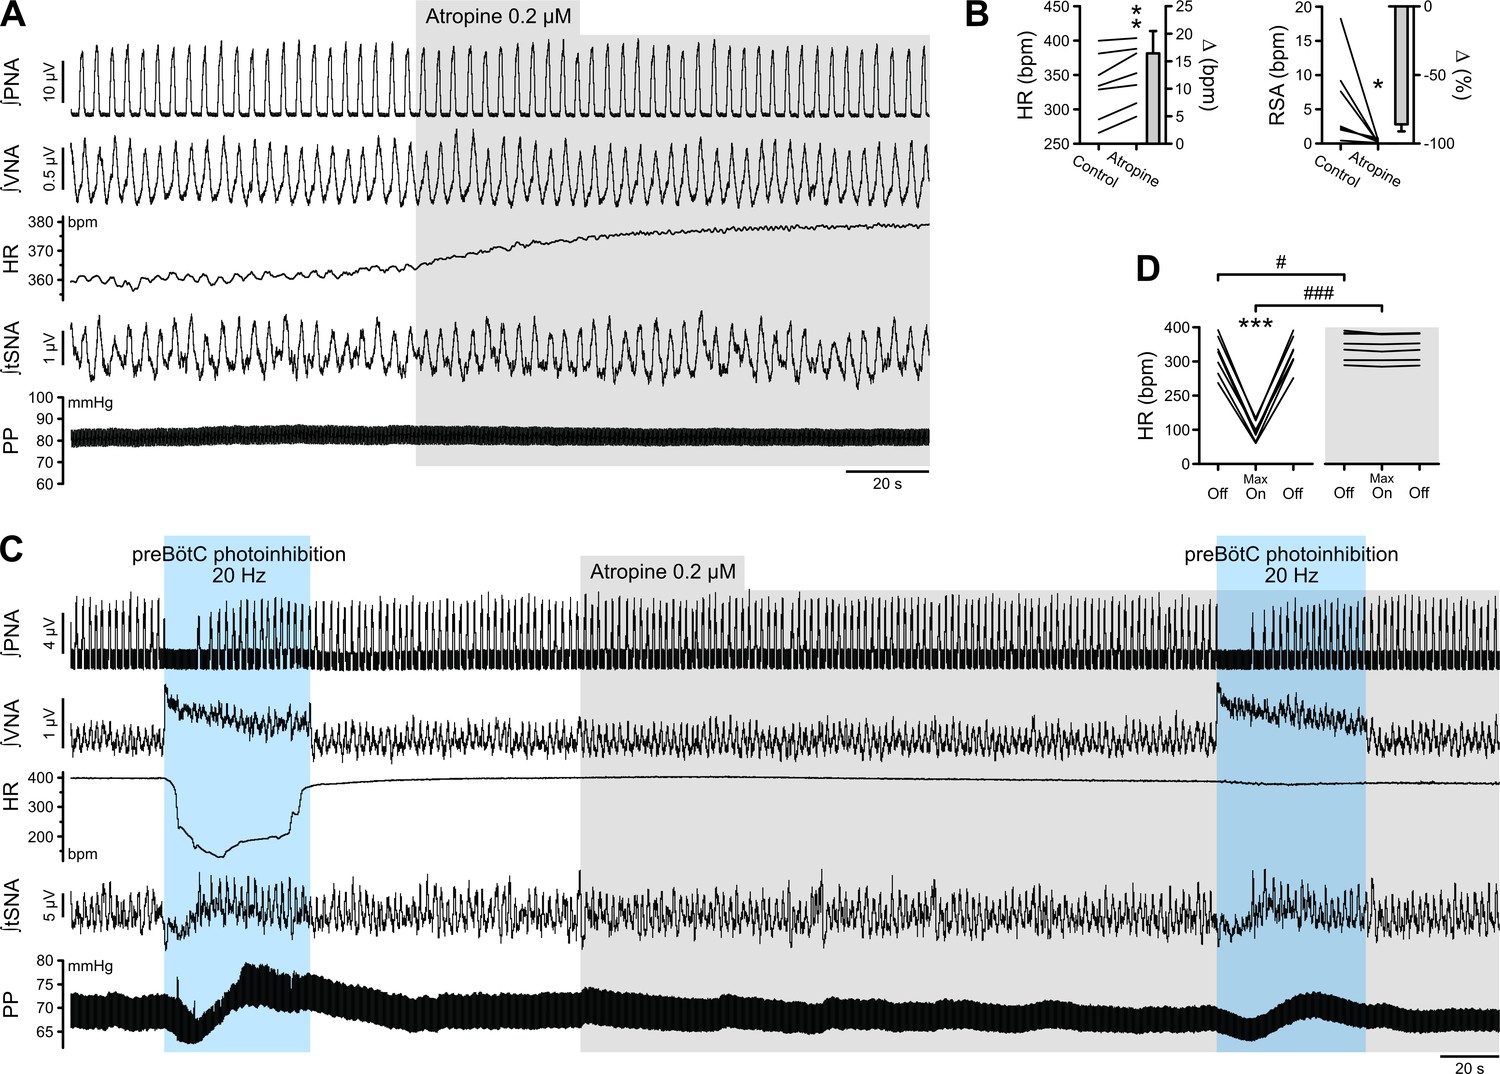
The bradycardia induced by preBötC photoinhibition is mediated by increased cardiac parasympathetic drive.
(A) The effect of bath application of the muscarinic antagonist, atropine, in the in situ WHBP of a P31 rat. (B) Group data (n = 7) showing that atropine induced an increase in HR and abolished RSA, confirming its effective blockade of cardiac parasympathetic modulation. (C) Prolonged 20 Hz preBötC photoinhibition before, and after, bath application of atropine. (D) Atropine did not affect the increase in VNA induced by preBötC photoinhibition, but totally blocked the decrease in HR, showing that preBötC photoinhibition induces increased cardiac parasympathetic drive. The sympathetic vasomotor effects induced by preBötC photoinhibition were not altered by atropine, showing that they are not mediated by baroreflex afferents. Group data are presented as mean ± SEM; paired student’s t test, Wilcoxon signed rank test or two-way repeated measures ANOVA followed with post hoc Holm-Sidak multiple-comparison test performed on raw data, as shown on the associated source data and detailed statistics; *p<0.05, **p<0.01, ***p<0.001, photoinhibition vs. control condition (B), or vs. control and recovery conditions (D); # p<0.05, ### p<0.001, between photostimulation conditions.
-
Figure 4—source data 1
Source data and statistics for Figure 4.
- https://cdn.elifesciences.org/articles/57288/elife-57288-fig4-data1-v2.xlsx
Figure 5 with 1 supplement
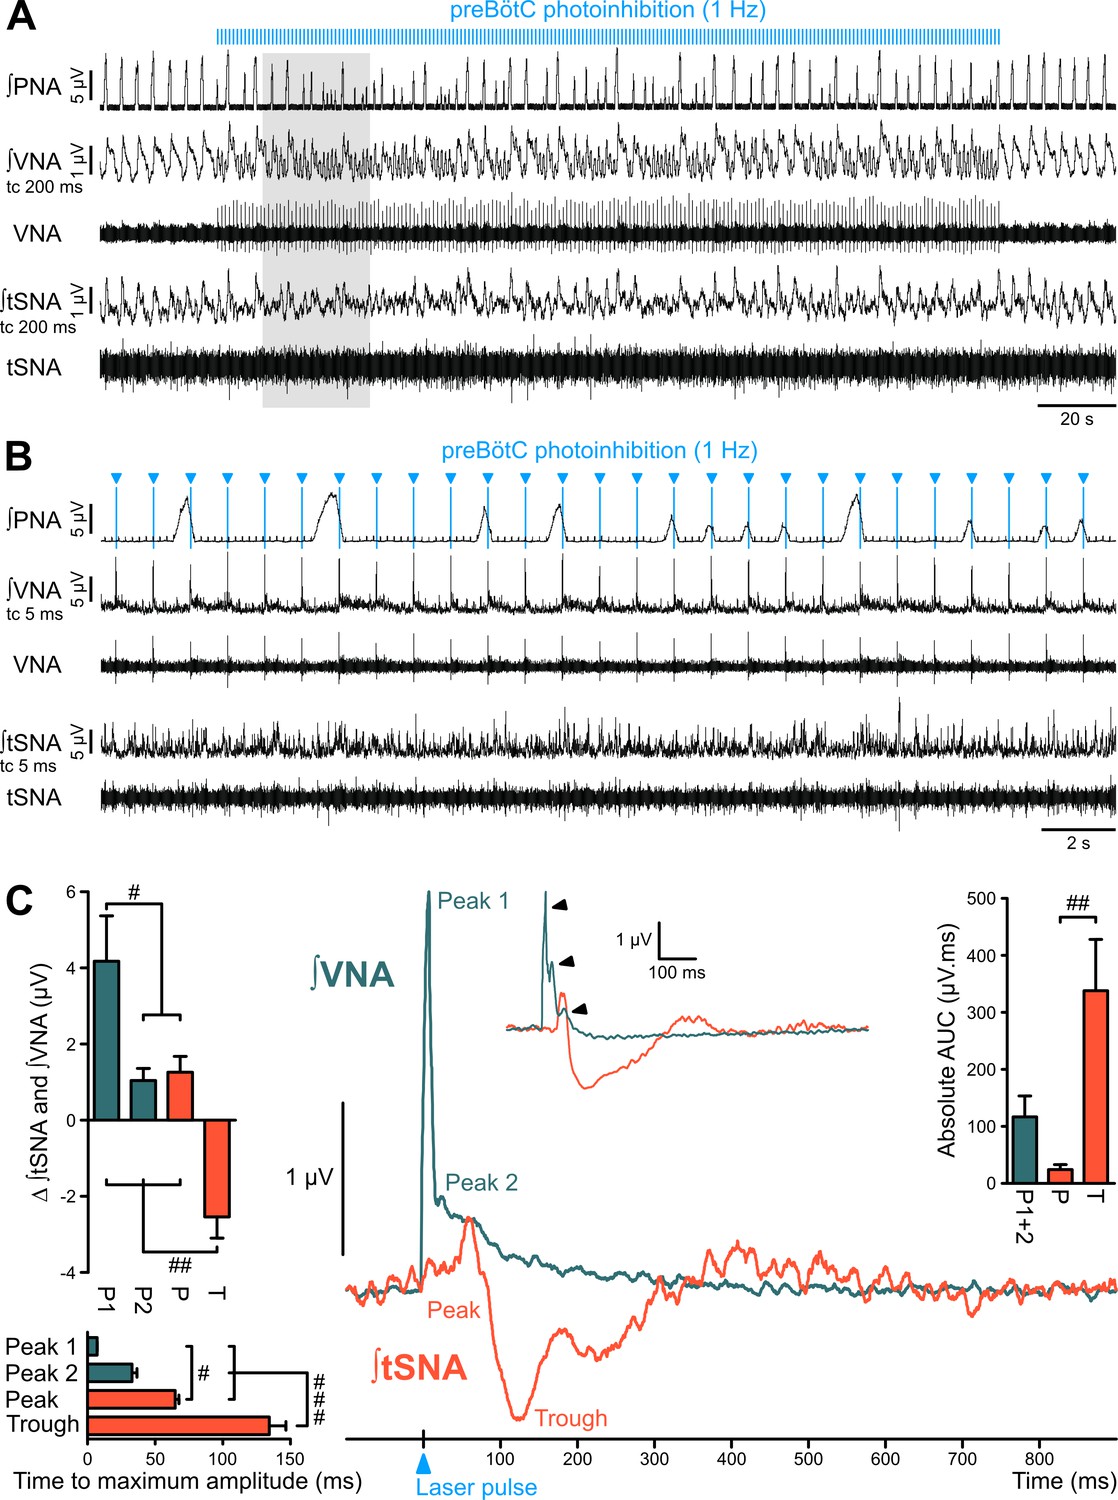
The preBötC is sympatho-excitatory and parasympatho-inhibitory.
Traces of activity in the WHBP at low (A) and higher (B) time resolution, showing that preBötC photoinhibition at 1 Hz disrupts PNA, VNA and tSNA. (C) Laser triggered averages of integrated VNA and tSNA (tc 5 ms, 300 pulses), show that preBötC photoinhibition induced: a rapid excitation of VNA at short latency, sometimes accompanied by a second or third peak (arrowheads in inset); and an initial small tSNA peak and a subsequent larger tSNA trough of longer latency. These effects were found irrespective of the respiratory phase at which the light pulse was delivered. Group data are presented as mean ± SEM; one-way repeated measures ANOVA followed with post hoc Holm-Sidak multiple-comparison test performed on raw data, as shown on Figure 5—figure supplement 1 and associated source data and detailed statistics; # p<0.05, ## p<0.01, ### p<0.001, between respective effects.
-
Figure 5—source data 1
Source data and statistics for Figure 5.
- https://cdn.elifesciences.org/articles/57288/elife-57288-fig5-data1-v2.xlsx
Figure 5—figure supplement 1

Individual data showing sympathetic and parasympathetic effects of 1 Hz preBötC photoinhibition.
Individual data for the laser triggered averaging of integrated VNA and tSNA (tc 5 ms, 300 pulses) presented in Figure 5C. Group data are presented as mean ± SEM; one-way repeated measures ANOVA followed with post hoc Holm-Sidak multiple-comparison test performed on raw data, as shown on the associated source data and detailed statistics; # p<0.05, ## p<0.01, ### p<0.001, between respective effects.
Figure 6 with 1 supplement
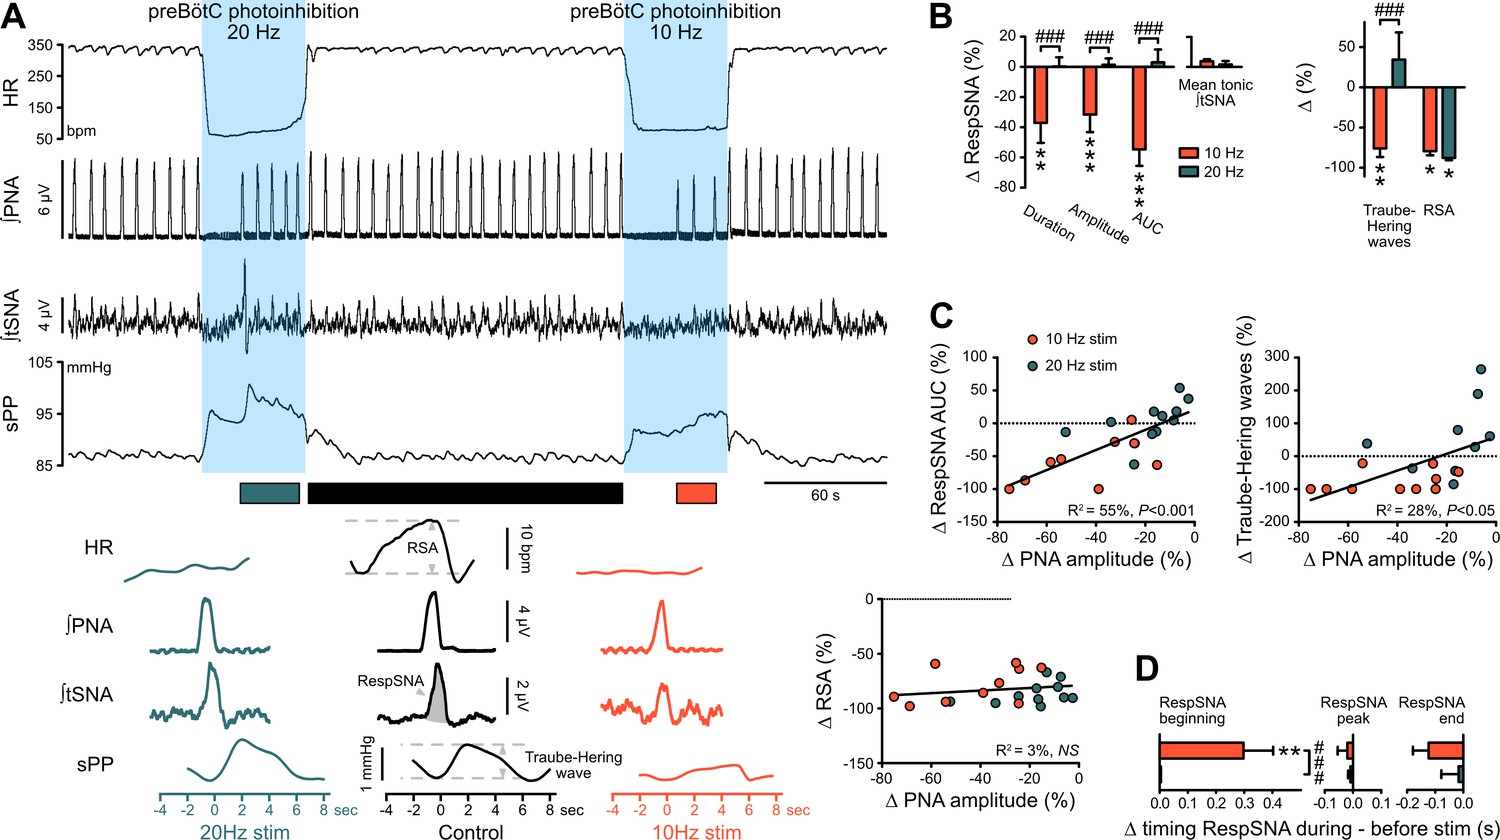
The preBötC drives RespSNA, Traube-Hering waves and RSA.
(A) Traces from one rat and group analysis of the PNA-related oscillations in HR (RSA), tSNA (RespSNA) and systolic PP (Traube-Hering waves). PNA burst-triggered averaging (bottom traces) was performed during control conditions (pre- and post-photoinhibition), and during 10 Hz and 20 Hz photoinhibition when PNA had returned. (B) Quantification of the group data showing the effect of preBötC photoinhibition on RespSNA duration, amplitude and area under the curve (AUC), mean tonic tSNA (baseline tSNA outside of RespSNA), Traube-Hering wave amplitude, and RSA. (C) Correlation analysis indicates that the PNA amplitude is correlated with RespSNA AUC and Traube-Hering wave amplitude, but not RSA amplitude. The latter indicates that the preBötC generates RSA by a mechanism unrelated to the generation of the PNA inspiratory bursts. The incidence of preBötC photoinhibition on the timing of the onset, peak and end of the RespSNA burst is shown in (D). Group data are presented as mean ± SEM; two-way repeated measures ANOVA followed with post hoc Holm-Sidak multiple-comparison test performed on raw data, as shown on Figure 6—figure supplement 1 and associated source data and detailed statistics; **p<0.01, ***p<0.001, photoinhibition vs. control and recovery conditions; ### p<0.001, between photostimulation frequencies.
-
Figure 6—source data 1
Source data and statistics for Figure 6; Figure 6—figure supplement 1.
- https://cdn.elifesciences.org/articles/57288/elife-57288-fig6-data1-v2.xlsx
Figure 6—figure supplement 1
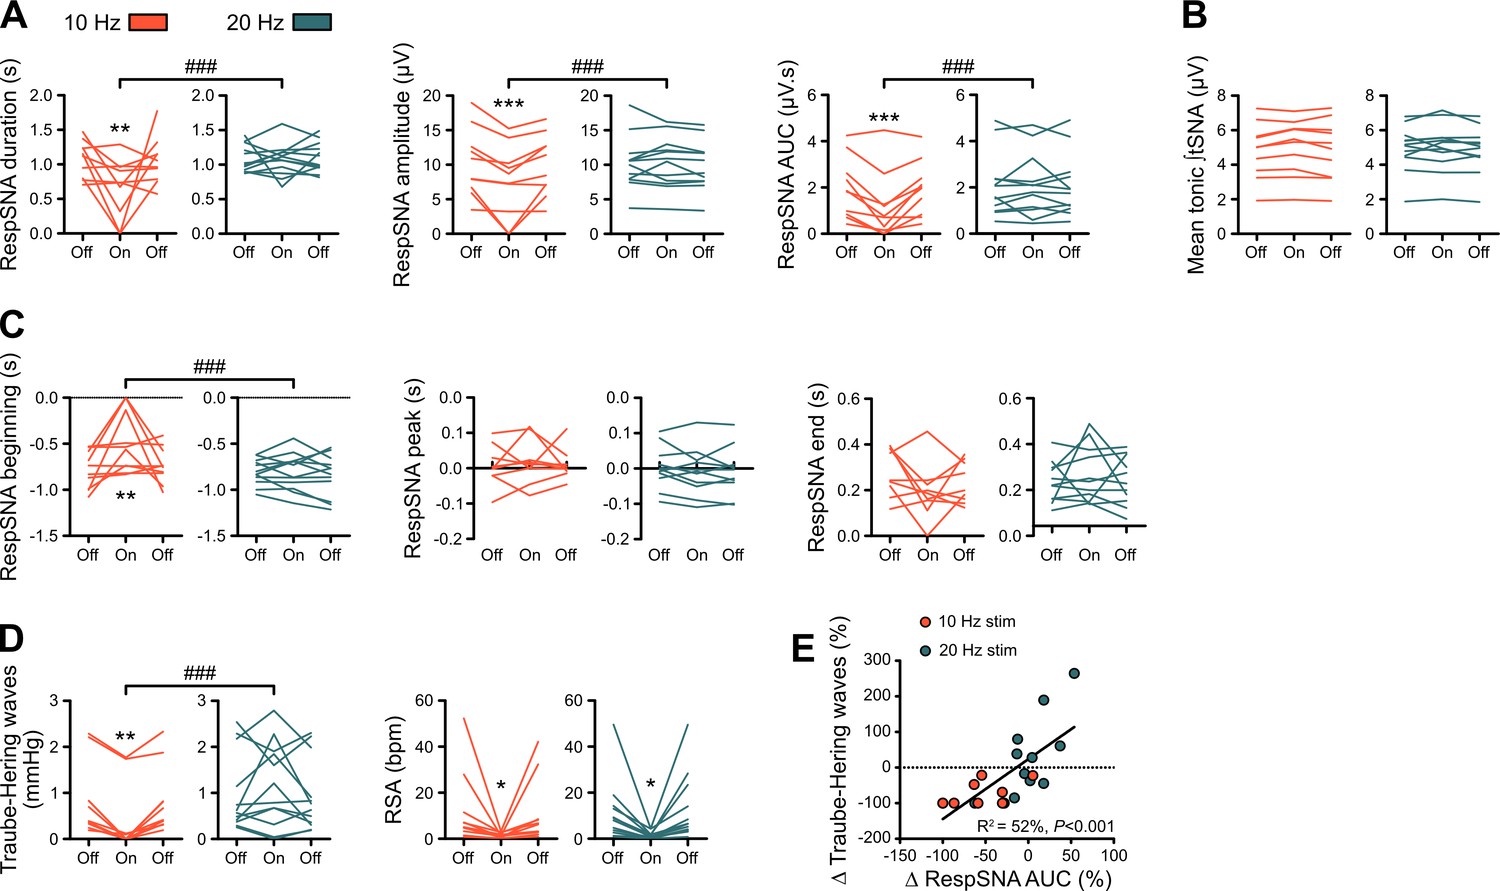
Individual data showing alterations in RespSNA, Traube-Hering waves and RSA during prolonged GtACR2-mediated preBötC photoinhibition in situ.
(A–D) Individual data for the RespSNA, tonic tSNA, Traube-Hering wave and RSA group data presented in Figure 6B. (E) The amplitude of Traube-Hering waves during 10 Hz and 20 Hz preBötC photoinhibition is correlated to RespSNA AUC. Two-way repeated measures ANOVA followed with post hoc Holm-Sidak multiple-comparison test, as shown on the associated source data and detailed statistics; **p<0.01, ***p<0.001, photoinhibition vs. control and recovery conditions; ### p<0.001, between photostimulation frequencies.
Figure 7 with 1 supplement
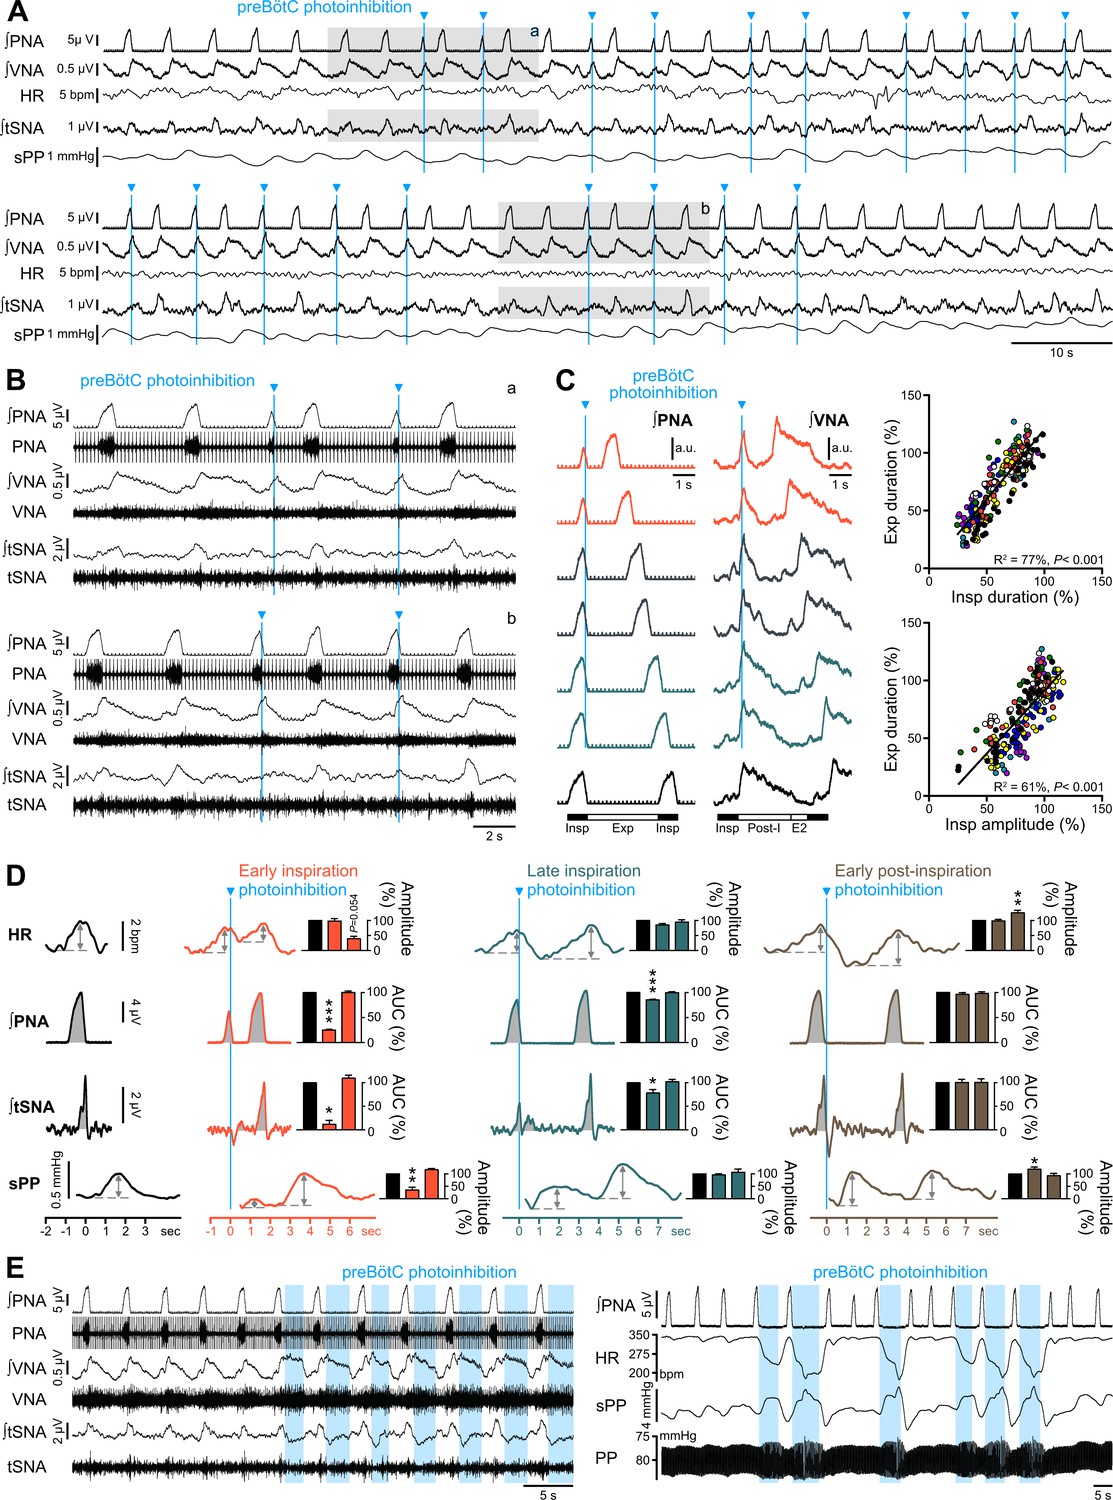
Effect of single pulse preBötC photoinhibition on respiration, RespSNA, Traube-Hering waves and RSA.
(A, B) Traces showing the effect of single light pulse (10 ms) preBötC photoinhibition on phrenic (PNA), vagal (VNA) and thoracic sympathetic (tSNA) nerve activity, HR and systolic perfusion pressure (sPP) at low (A) and high (B) time resolution in the WHBP. Pulses were applied during early (top traces, (a) and late (bottom traces, (b) inspiration. (C) Triggered averages of PNA and VNA showing that single pulse photoinhibition of preBötC delivered during early (orange, 40% and 50% inspiratory duration), mid- (grey, 60% and 70% inspiratory duration) or late inspiration (green, 80% and 90% inspiratory duration) immediately stopped inspiration (Insp) and triggered post-inspiration (Post-I). For analysis, inspiratory burst duration was normalized to the bottom (black) control trace. The correlograms, showing analysis across multiple respiratory cycles in all animals, with each animal represented by a single color, indicate that the duration of the expiratory phase (Exp, the addition of Post-I and late expiration, (E2) is determined by the duration and amplitude of the preceeding inspiratory period. Data are expressed in % relative to intra-preparation averaged control values, to normalize variability in respiratory phase durations between preparations. (D) PNA burst-triggered averages of HR, PNA, tSNA and sPP were used to derive RSA amplitude, mean PNA AUC, RespSNA AUC and Traube-Hering wave amplitude during control (black) and preBötC photoinhibition in early (orange), late (green) or early post-inspiration (brown). Data are expressed relative to intra-preparation control conditions, and were analyzed for the respiratory cycle during which preBötC photoinhibition occurred and the following, to evaluate direct and indirect photoinhibition effects. (E) Traces showing that when delivered during expiration, preBötC photoinhibition increased VNA for the entire photoinhibition period, but only transiently decreased tSNA. The latter effect was amplified with successive bouts of expiratory preBötC photoinhibition, also inducing increases in RespSNA. PNA bursting always occured following a short (~1 s) post-photoinhibition delay. Group data are presented as mean ± SEM; one-way repeated measures ANOVA followed with post hoc Holm-Sidak multiple-comparison test or Friedman repeated measures analysis of variance on ranks followed with pairwise multiple comparison Tukey test performed on raw data, as shown on Figure 7—figure supplement 1 and associated source data and detailed statistics; *p<0.05, **p<0.01, ***p<0.001, different vs. the two other conditions.
-
Figure 7—source data 1
Source data and statistics for Figure 7; Figure 7—figure supplement 1.
- https://cdn.elifesciences.org/articles/57288/elife-57288-fig7-data1-v2.xlsx
Figure 7—figure supplement 1

Individual data showing respiratory-phase-specific alterations in PNA AUC, RSA, RespSNA and Traube-Hering waves during single-pulse preBötC photoinhibition.
(A) Individual data for the PNA AUC, RSA, RespSNA and Traube-Hering waves presented in Figure 7D. (B) Representation of the three phases of the respiratory cycle as observed in PNA burst-triggered averages of HR, sPP and integrated VNA, PNA, and tSNA, with inspiration (dark gray) defined by PNA activity, post-inspiration (light gray) defined by the post-inspiratory burst of VNA activity, and late expiration (E2, white) defined as the period of non-respiratory-related activity on both PNA and VNA. RSA is characterized by a peak in HR at the end of inspiration, a decrease in HR at the beginning of post-inspiration, and a progressive increase in HR from mid-post-inspiration, through late expiration and into inspiration. RespSNA peaks at the transition between inspiration and post-inspiration, and the RespSNA burst is mainly composed of an inspiratory component, and a smaller post-inspiratory component. Traube-Hering waves, induced by RespSNA, peak during post-inspiration and therefore with a delay compared to RespSNA, due to the slow vascular contraction dynamics. The duration of the respiratory phases was impacted by preBötC photoinhibition, which also impacted the duration of RSA, RespSNA and Traube-Hering waves, yet their timing relative to the respiratory cycle remained unaltered. One-way repeated measures ANOVA followed with post hoc Holm-Sidak multiple-comparison test or Friedman repeated measures analysis of variance on ranks followed with pairwise multiple comparison Tukey test, as shown on the associated source data and detailed statistics; *p<0.05, **p<0.01, ***p<0.001, different vs. the two other conditions.
Figure 8
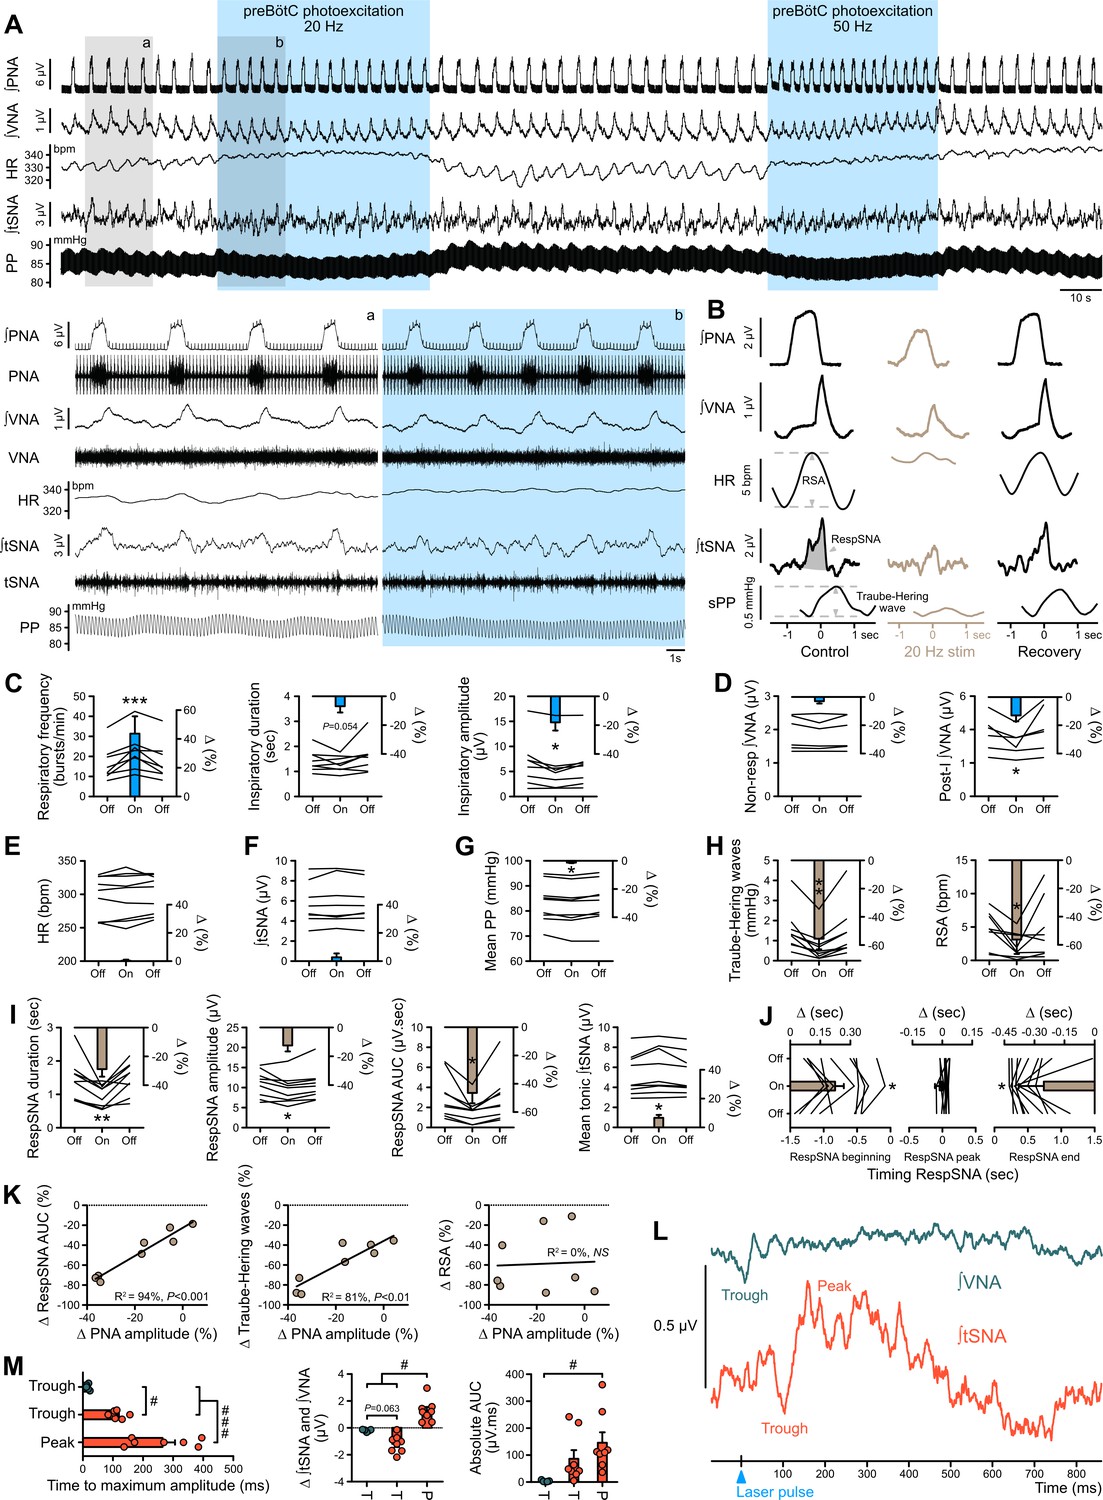
Photoexcitation of preBötC decreases amplitude of the respiratory command, RespSNA, Traube-Hering waves and RSA.
Traces of activity recorded in the WHBP at low (A) and higher (lower traces from the shaded areas) time resolution showing the effect of bilateral photoexcitation of the preBötC with ChR2. (B) PNA burst-triggered averaging was used to quantify the effect on RespSNA AUC, Traube-Hering wave amplitude and RSA amplitude. (C–J) Individual and group data (n = 8) quantifying the effect of preBötC photoexcitation (20 Hz) on: (C) respiratory parameters; (D) VNA; (E) HR; (F) tSNA; (G) mean PP; (H) Traube-Hering wave and RSA; and (I) RespSNA. (J) Further analysis shows the decrease in duration of RespSNA was due to both shorter inspiratory and post-inspiratory components. (K) Correlograms showing that RespSNA AUC and Traube-Hering wave amplitude were both correlated with PNA amplitude, whilst RSA was not. (L) Traces from one animal showing laser-triggered averaging of integrated VNA and tSNA in response to 1 Hz preBötC photoexcitation. (M) Quantification of this response in all animals showing photoexcitation induces inverse responses to that of photoinhibition, and of smaller amplitude. Group data are presented as mean ± SEM; one-way repeated measures ANOVA followed with post hoc Holm-Sidak multiple-comparison test or Friedman repeated measures analysis of variance on ranks followed with pairwise multiple comparison Tukey test performed on raw data, as shown on the associated source data and detailed statistics; *p<0.05, **p<0.01, ***p<0.001, photoinhibition vs. control and recovery conditions; # p<0.05, ## p<0.01, between respective effects.
-
Figure 8—source data 1
Source data and statistics for Figure 8.
- https://cdn.elifesciences.org/articles/57288/elife-57288-fig8-data1-v2.xlsx
Figure 9
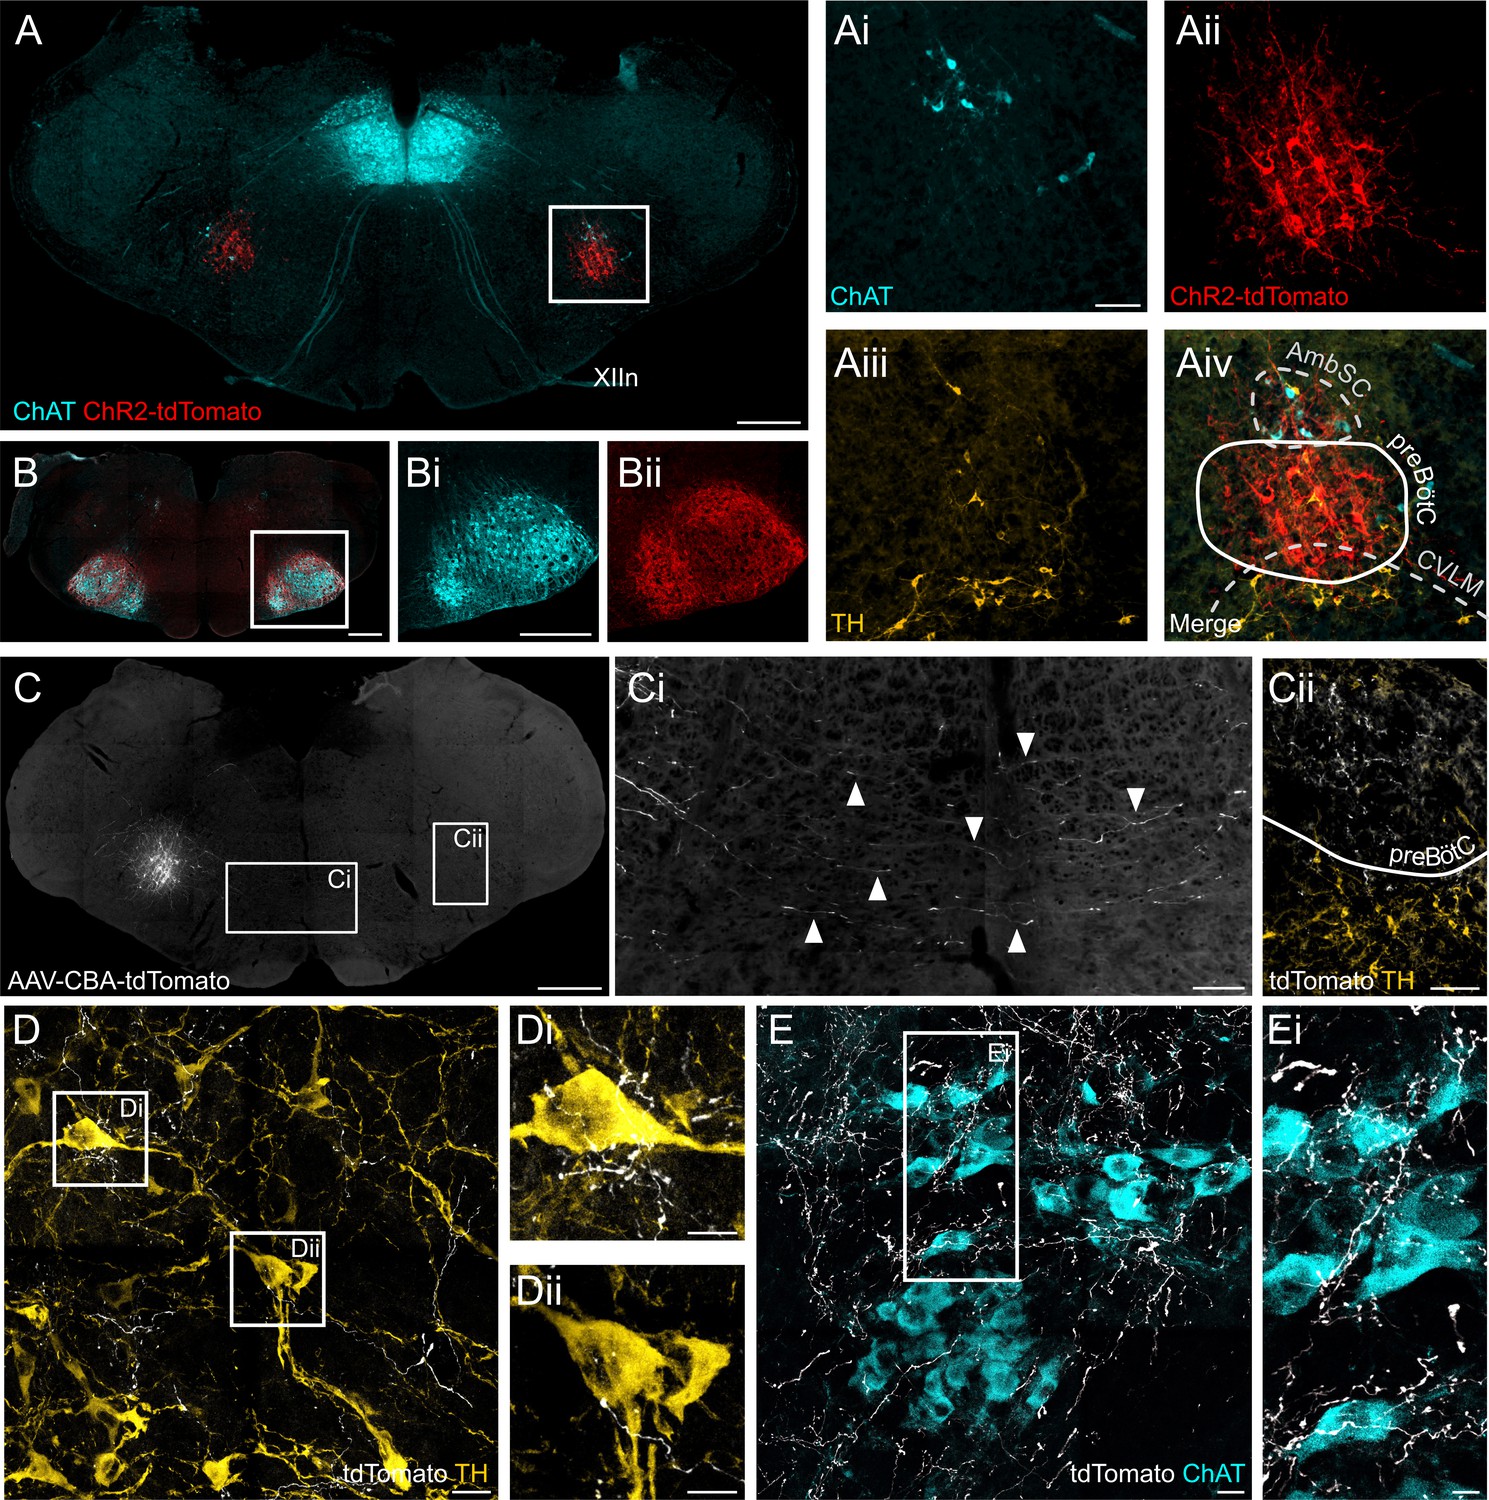
ChR2 expression in the preBötC, and direct projections to adrenergic C1 and nucleus ambiguus neurons.
(A) Coronal section showing immunoreactivity for tdTomato, fused to ChR2, choline acetyltransferase (ChAT) and tyrosine hydroxylase (TH) at low and high magnification (white box in A, shown as individual colour channels in Ai-iv). The ChR2 expression profile is restricted to the preBötC, ventral to the semicompact formation of the nucleus ambiguus (AmbSC), and dorsal to the caudal ventrolateral medulla oblongata (CVLM). (B) ChR2-positive terminals were found in the facial nucleus, a characteristic feature of preBötC projections (Deschênes et al., 2016). (C) Small volume (5 nl) unilateral viral injections (n = 2) restricted tdTomato expression to core preBötC neurons, with substantial numbers of tdTomato-positive fibers crossing the midline (Ci) to the contralateral preBötC (Cii). (D) TdTomato-positive preBötC terminals were found in close apposition to TH-positive C1 neurons in the rostral ventrolateral medulla (Di and Dii), and (E) ChAT-positive neurons in the compact formation of the nucleus ambiguus (AmbC) (Ei). Scale bars are 500 µm (A, B, Bi, C), 100 µm (Ai, Ci, Cii), 20 µm (D, E) or 10 µm (Di, Dii, Ei).
Tables
Key resources table
| Reagent type (species) or resource | Designation | Source or reference | Identifiers | Additional information |
|---|---|---|---|---|
| Strain, strain background (male Sprague Dawley rats) | WT Sprague Dawley rats | Biomedical Science Animal Facility of the University of Melbourne | ||
| Recombinant DNA reagent | pFUGW-hGtACR2-EYFP | Addgene, gift from John Spudich | plasmid # 67877; RRID:Addgene_67877 | http://n2t.net/addgene:67877 |
| Recombinant DNA reagent | pAAV-CAG-hChR2-H134R-tdTomato | Addgene, gift from Karel Svoboda | plasmid #28017; RRID:Addgene_28017 | http://n2t.net/addgene:28017 |
| Recombinant DNA reagent | pAM.DCA.spe.tdTomato | Gift from Verena Wimmer | ||
| Strain, strain background (lentivirus) | Lv-CBA-GtACR2-YFP-WPRE | In house cloning and virus production | Titre 6.95 × 10⁹ IU/ml | |
| Strain, strain background (AAV) | AAV-CBA-GtACR2-YFP-WPRE | In house cloning and virus production | Titre 9.65 × 10¹¹ VP/ml | |
| Strain, strain background (AAV) | AAV-CAG-hChR2-H134R-tdTomato | In house virus production | Titre 2.23 × 10¹⁰ VP/ml | |
| Strain, strain background (AAV) | AAV-CBA-tdTomato | In house virus production | Titre 6.32 × 10¹² VP/ml | |
| Antibody | Rabbit polyclonal anti-TH | Merck-Millipore Bioscience Research Reagents | AB152 | 1:5000 |
| Antibody | Chicken polyclonal anti-GFP | Abcam | AB13970 | 1:5000 |
| Antibody | Mouse monoclonal anti-parvalbumin | Merck-Millipore Bioscience Research Reagents | MAB1572 | 1:10,000 |
| Antibody | Rabbit polyclonal anti-NK1R | Merck-Sigma-Aldrich | S8305 | 1:5000 |
| Antibody | Rabbit polyclonal anti-DsRed | Takara Bio | 632496 | 1:5000 |
| Antibody | Goat polyclonal anti-ChAT | Merck-Millipore Bioscience Research Reagents | AB144P | 1:1000 |
| Antibody | Rabbit polyclonal anti-GFP | Life Technologies | A-6455 | 1:500 |
| Antibody | Cy3-conjugated donkey polyclonal anti-rabbit | Jackson ImmunoResearch Laboratories | 711-165-152 | 1:500 |
| Antibody | Cy3-conjugated donkey polyclonal anti-mouse | Jackson ImmunoResearch Laboratories | 715-165-151 | 1:500 |
| Antibody | AlexaFluor-488 donkey polyclonal anti-rabbit | Jackson ImmunoResearch Laboratories | 711-545-152 | 1:500 |
| Antibody | AlexaFluor-488 donkey polyclonal anti-mouse | Jackson ImmunoResearch Laboratories | 715-545-151 | 1:500 |
| Antibody | AlexaFluor-488 donkey polyclonal anti-chicken | Jackson ImmunoResearch Laboratories | 703-545-155 | 1:500 |
| Antibody | AlexaFluor-488 donkey polyclonal anti-rabbit | Life Technologies | A21206 | 1:500 |
| Sequence-based reagent | PCR primers for generation of cRNA probe for glycine transporter 2 (GlyT2) | SP6 forward primer:GGATCCATTTAGGTGACACTATAGAAGaagcgtcttgcccactagaa T7 reverse primer: GAATTCTAATACGACTCACTATAGGGAGAagcctgagcttgcttttcag | ||
| Sequence-based reagent | PCR primers for generation of cRNA probe for glutamic acid decarboxylase 67 (GAD67) | SP6 forward primer:GGATCCATTTAGGTGAC ACTATAGAAGttatgtcaatgcaaccgc T7 reverse primer: GAATTCTAATACGACTCAC TATAGGGAGAcccaacctctctatttcctcC | ||
| Sequence-based reagent | PCR primers for generation of cRNA probe for vesicular glutamate transporter 2 (VGluT2) | SP6 forward primer: GGATCCATTTAGGTGACACTATAGAAGtcaatgaaatccaacgtcca T7 reverse primer:GAATTCTAATACGACTCACTATAGGGAGAcaagagcacaggacaccaaa | ||
| Chemical compound, drug | Meloxicam | Boehringer Ingelheim | 1 mg/kg, s.c. | |
| Chemical compound, drug | Isoflurane | Rhodia Australia Pty. Ltd., | 5% induction, 3% maintenance | |
| Chemical compound, drug | Ketamine | Lyppard | 60 mg/kg, i.m. | |
| Chemical compound, drug | Medetomidine | Pfizer Animal Health | 250 μg/kg, i.m. | |
| Chemical compound, drug | Atipamazole | Pfizer Animal Health | 1 mg/kg, i.m. | |
| Chemical compound, drug | Urethane | SigmaAldrich | 1.2 mg/kg i.v. | |
| Chemical compound, drug | Vasopressin acetate | Sigma-Aldrich | V9879 | 0.5 nM |
| Chemical compound, drug | Vecuronium bromide | Organon Teknika | 2–4 μg.ml−1 | |
| Chemical compound, drug | Atropine | Sigma Aldrich | A0257-25G | 0.2 µM |
| Software, algorithm | Spike2 | Cambridge Electrical Design | ||
| Software, algorithm | pClamp 10.3 | Molecular Devices | ||
| Software, algorithm | ZEN 2.6 | Carl-Zeiss | ||
| Software, algorithm | Affinity Designer | Serif Ltd. | ||
| Software, algorithm | Image J | NIH | ||
| Software, algorithm | SigmaPlot v12 | Systat Software Inc | ||
| Software, algorithm | Prism v2.0 | GraphPad |
Additional files
Download links
A two-part list of links to download the article, or parts of the article, in various formats.
Downloads (link to download the article as PDF)
Open citations (links to open the citations from this article in various online reference manager services)
Cite this article (links to download the citations from this article in formats compatible with various reference manager tools)
PreBötzinger complex neurons drive respiratory modulation of blood pressure and heart rate
eLife 9:e57288.
https://doi.org/10.7554/eLife.57288


