Dynamic effects of genetic variation on gene expression revealed following hypoxic stress in cardiomyocytes
- Department of Medicine, University of Chicago, United States
- Department of Biochemistry and Molecular Biology, University of Texas Medical Branch, United States
- Department of Human Genetics, University of Chicago, United States
- Integrated Cancer Genomics Division, Translational Genomics Research Institute, United States
- Department of Statistics, University of Chicago, United States
Figures
Figure 1 with 3 supplements
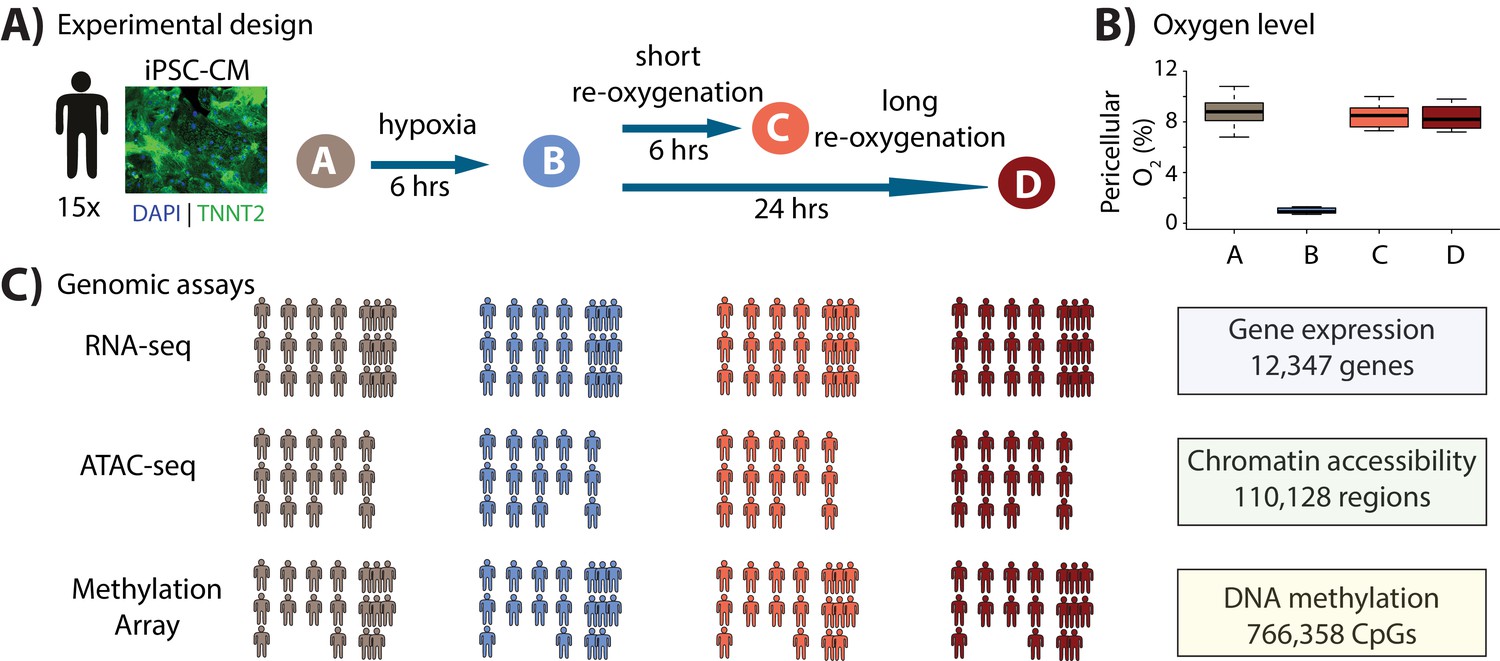
Study design to test the response of iPSC-derived cardiomyocytes to hypoxia and re-oxygenation.
(A) Experimental design of the study. Cardiomyocytes differentiated from iPSCs (iPSC-CMs) from 15 Yoruba individuals were cultured in normoxic conditions (10% oxygen - condition A, brown) and subjected to 6 hr of hypoxia (1% oxygen - condition B, blue) followed by 6 and 24 hr of re-oxygenation (10% oxygen - conditions C [coral] and D [red]). Immunocytochemistry of a representative cardiomyocyte culture where green: TNNT2; blue: nuclei. (B) Peri-cellular oxygen levels of each condition. Each data point represents one individual undergoing the oxygen stress experiment. (C) Molecular phenotypes collected from each individual in each condition.
Figure 1—figure supplement 1
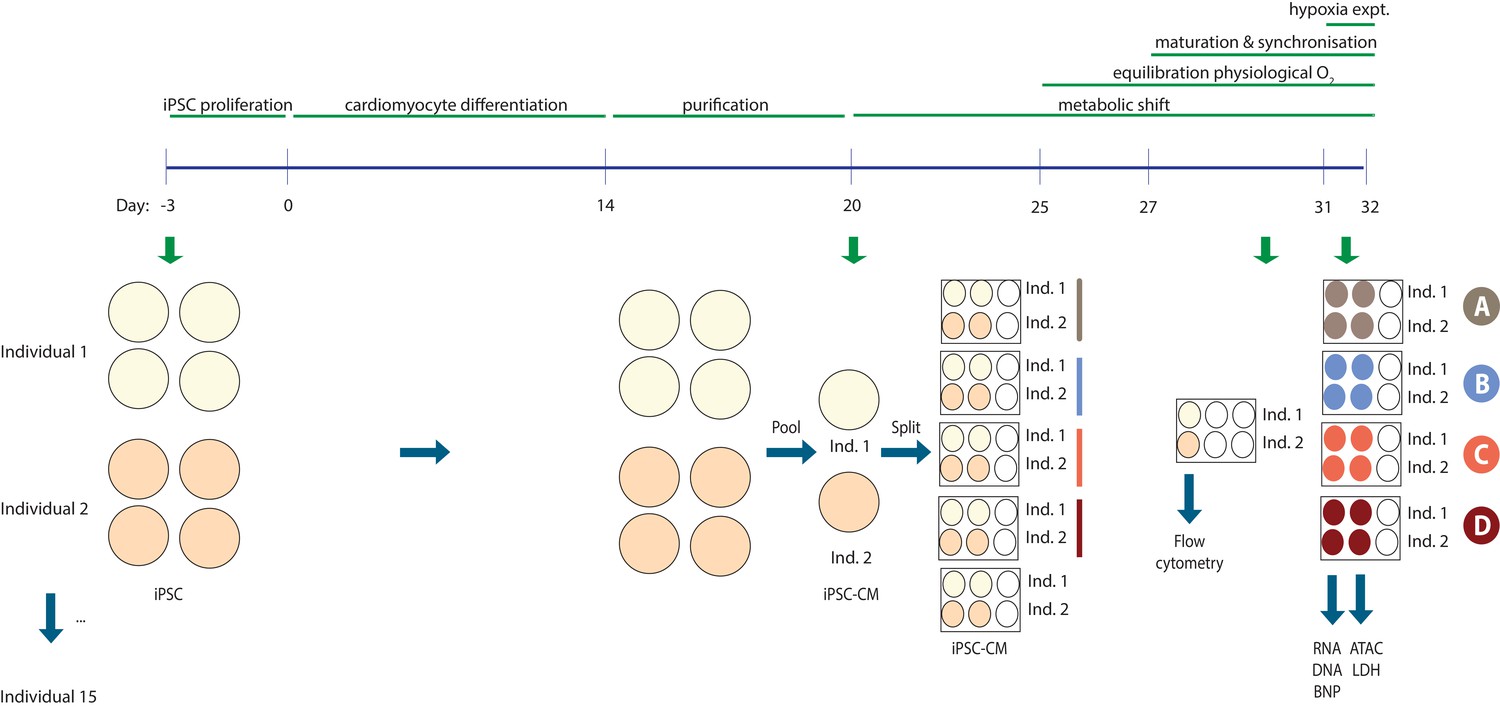
Experimental design.
The experimental setup for two representative individuals. iPSCs were differentiated into cardiomyocytes in four cell culture dishes per individual. On differentiation Day 20 the cultures from each individual were pooled and re-plated into five six-well plates – one plate for each experimental condition and one plate for analysis of cardiomyocyte purity. Flow cytometry was performed on Day 30 +/- 1 day and the hypoxia experiment on Day 31–32 +/- 1 day to sync up cultures from different individuals. Cells were used for RNA and DNA extraction and nuclei preparation, while cell culture media was used to measure BNP levels and LDH activity.
Figure 1—figure supplement 2
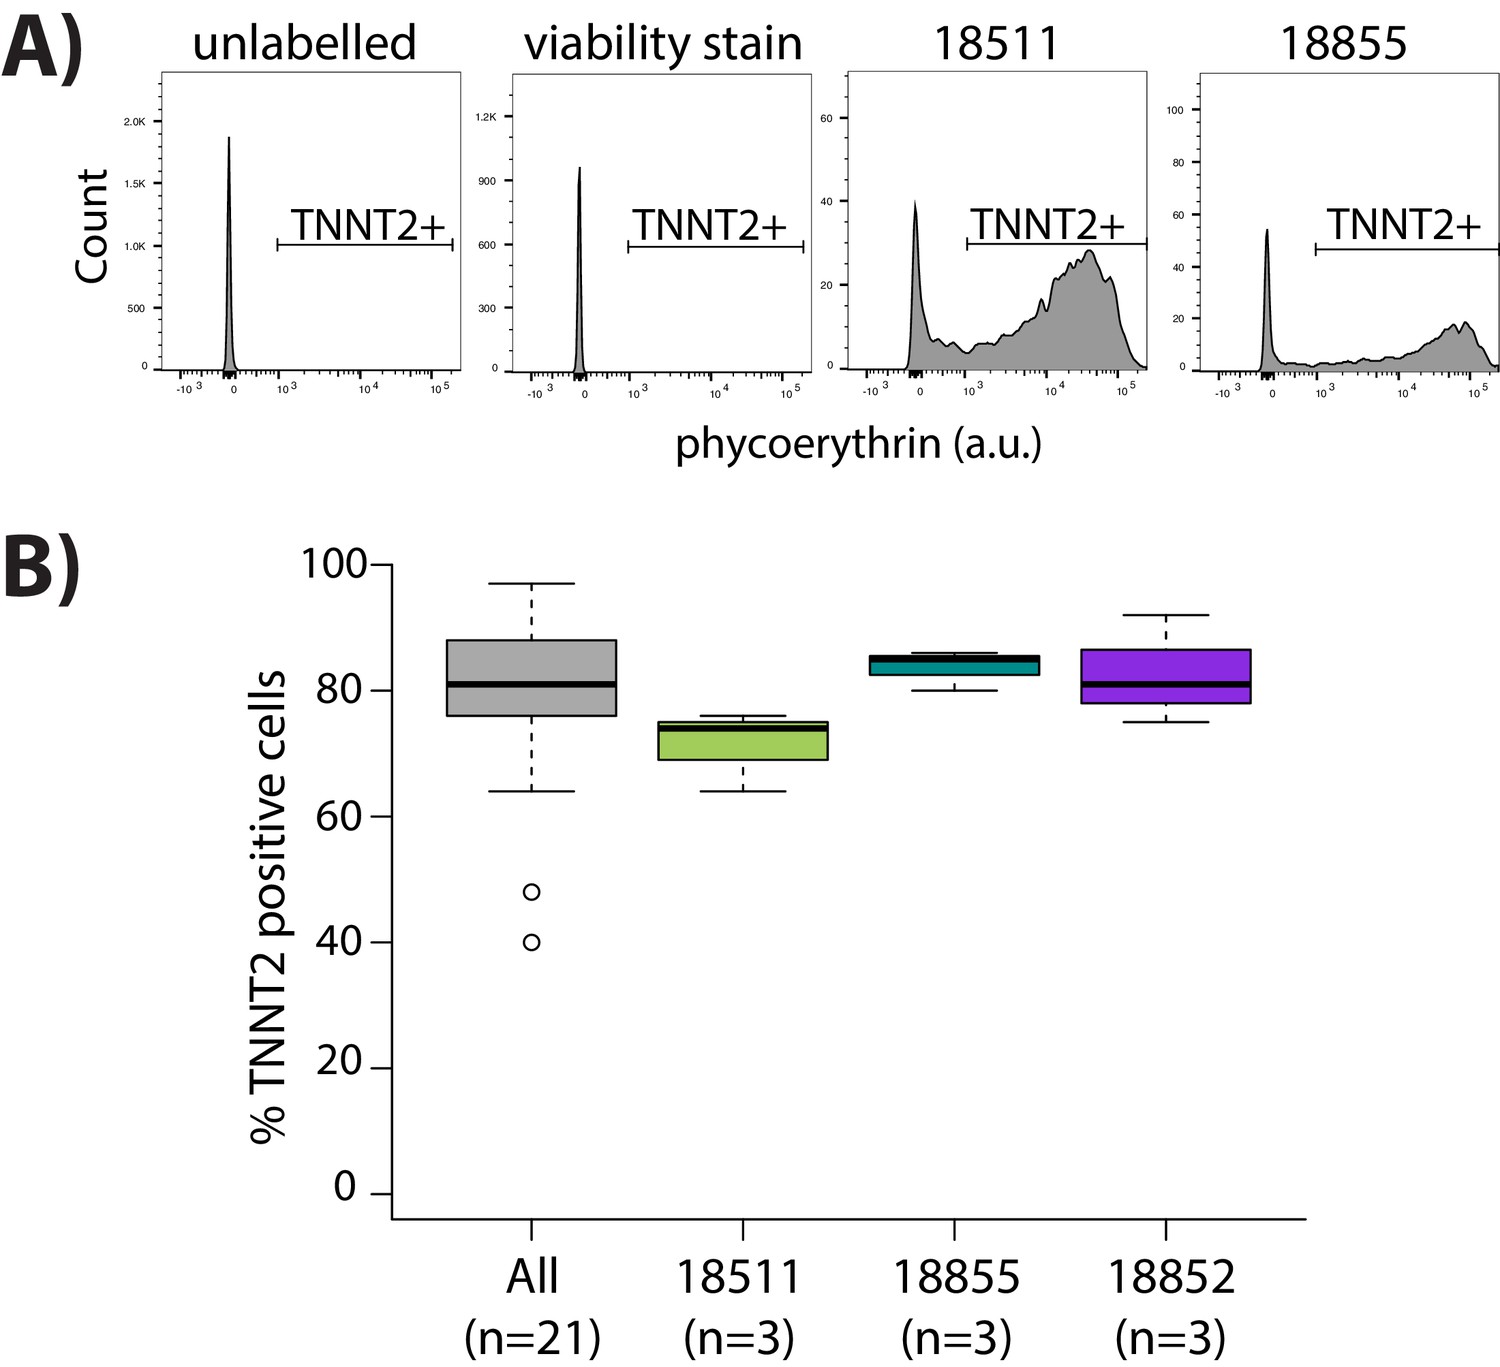
Purity of cardiomyocyte cultures.
(A) Representative images from flow cytometry experiments for iPSC-derived cardiomyocytes that are labeled with cardiac troponin T (TNNT2) antibody and viability stain, and negative controls cells that are only labeled with viability stain, or are not labeled with either viability stain or TNNT2 antibody. (B) Proportion of cells that are positive for expression of TNNT2 across all samples (All) and segregated by individuals which have three replicate samples (18511, 18855, 18852).
Figure 1—figure supplement 3

iPSC-CMs elicit a response to cellular stress.
(A) Lactate dehydrogenase activity assays performed on cell culture media. (B) Lactate dehydrogenase activity assays excluding the outlier individual. (C) BNP ELISA assays performed on cell culture media. One representative individual for individuals with replicate data is plotted. Asterisk denotes a significant difference between conditions (p*<0.05, p***<0.0005).
Figure 2 with 6 supplements
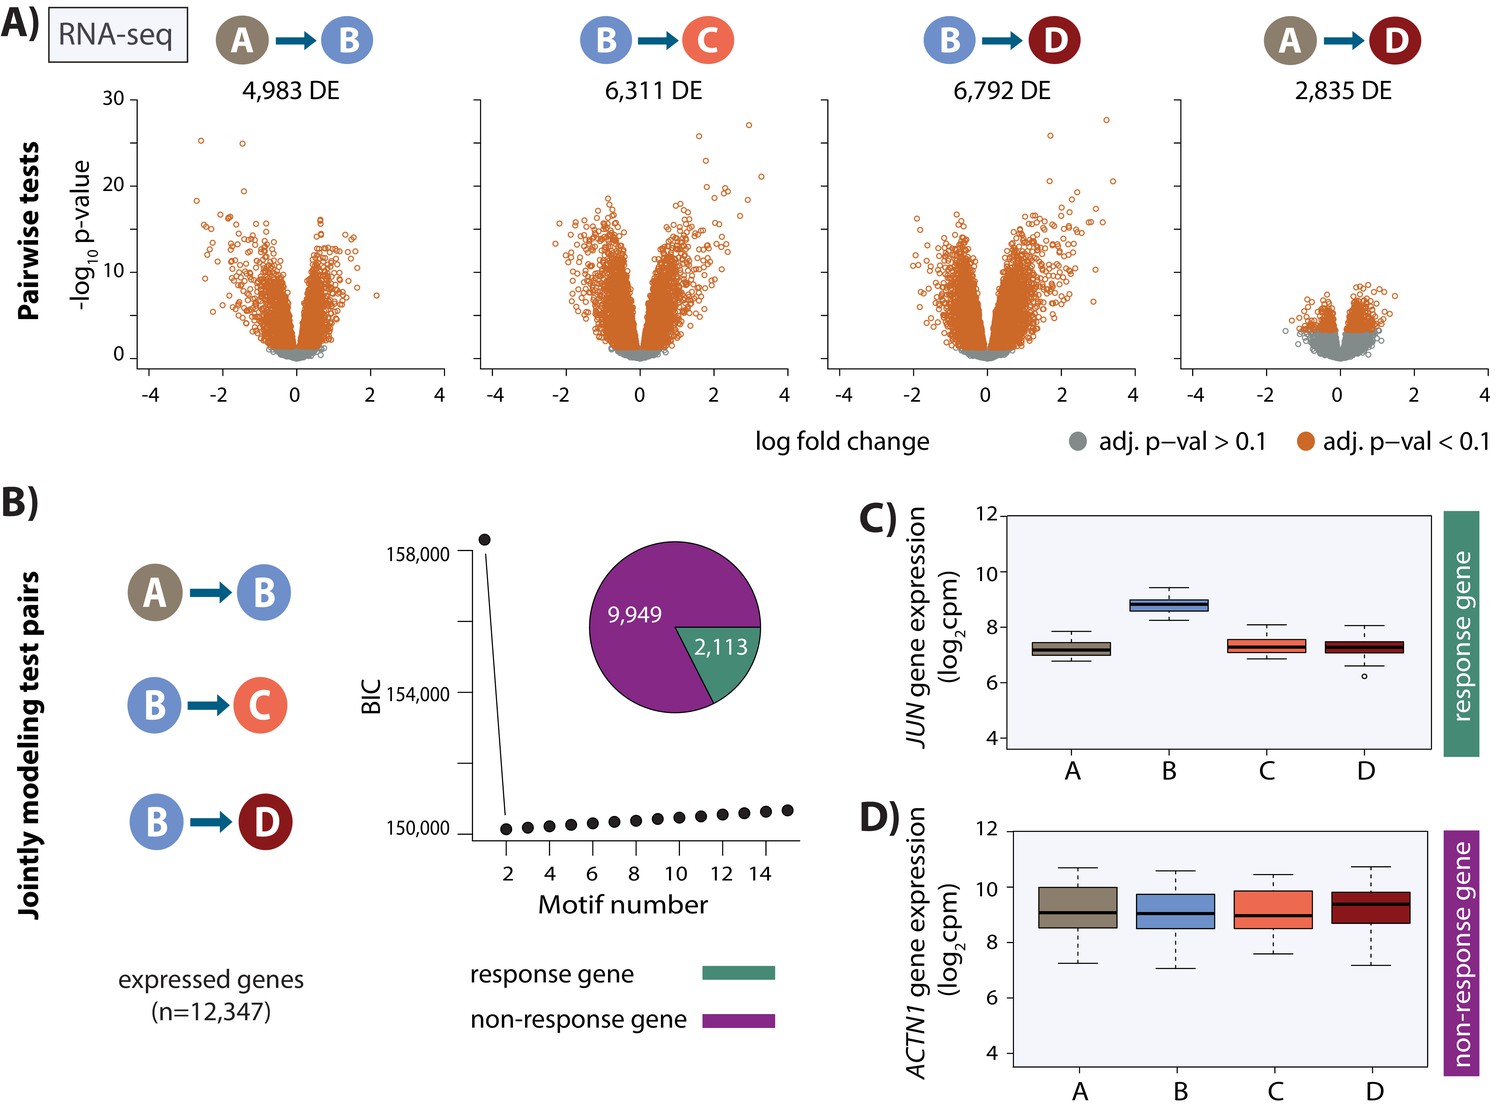
Thousands of gene expression changes occur following hypoxia and re-oxygenation.
(A) Volcano plots representing genes that are differentially expressed (DE) between pairs of conditions (orange dots). (B) Bayesian information criterion (BIC) at increasing numbers of Cormotif correlation motifs following joint modeling of pairs of tests. Genes with a posterior probability of being differentially expressed p>0.5 across all tests are defined as ‘response genes’ and those with p<0.5 as ‘non-response genes’. Inset shows the proportion of all expressed genes that are classified as response genes (green), and non-response genes (magenta). (C) Expression levels of JUN, a response gene, during the course of the experiment. (D) Expression levels of ACTN1, a non-response gene.
Figure 2—figure supplement 1
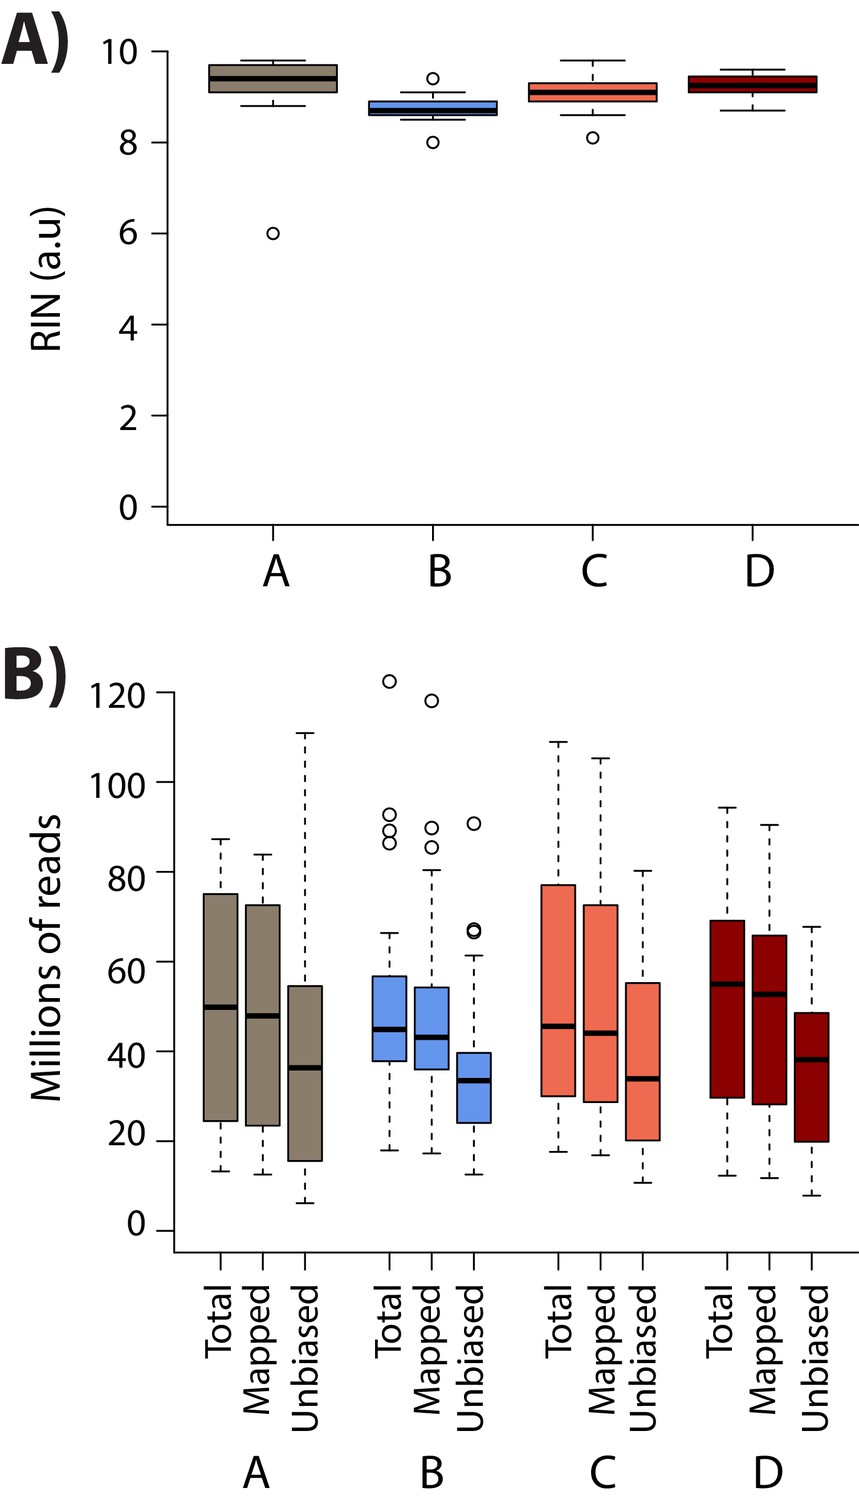
RNA integrity is similar across conditions.
(A) RIN score for all samples within each condition. (B) The total number of sequenced reads (Total), the number of reads that map to the human genome (Mapped), and the number of reads that pass the WASP re-mapping step (Unbiased) are shown for each sample within each of the four conditions (A: brown, B: blue, C: coral, D: red).
Figure 2—figure supplement 2

Correlation of read counts across samples.
Spearman correlation of RNA-seq read counts between all pairs of samples.
Figure 2—figure supplement 3
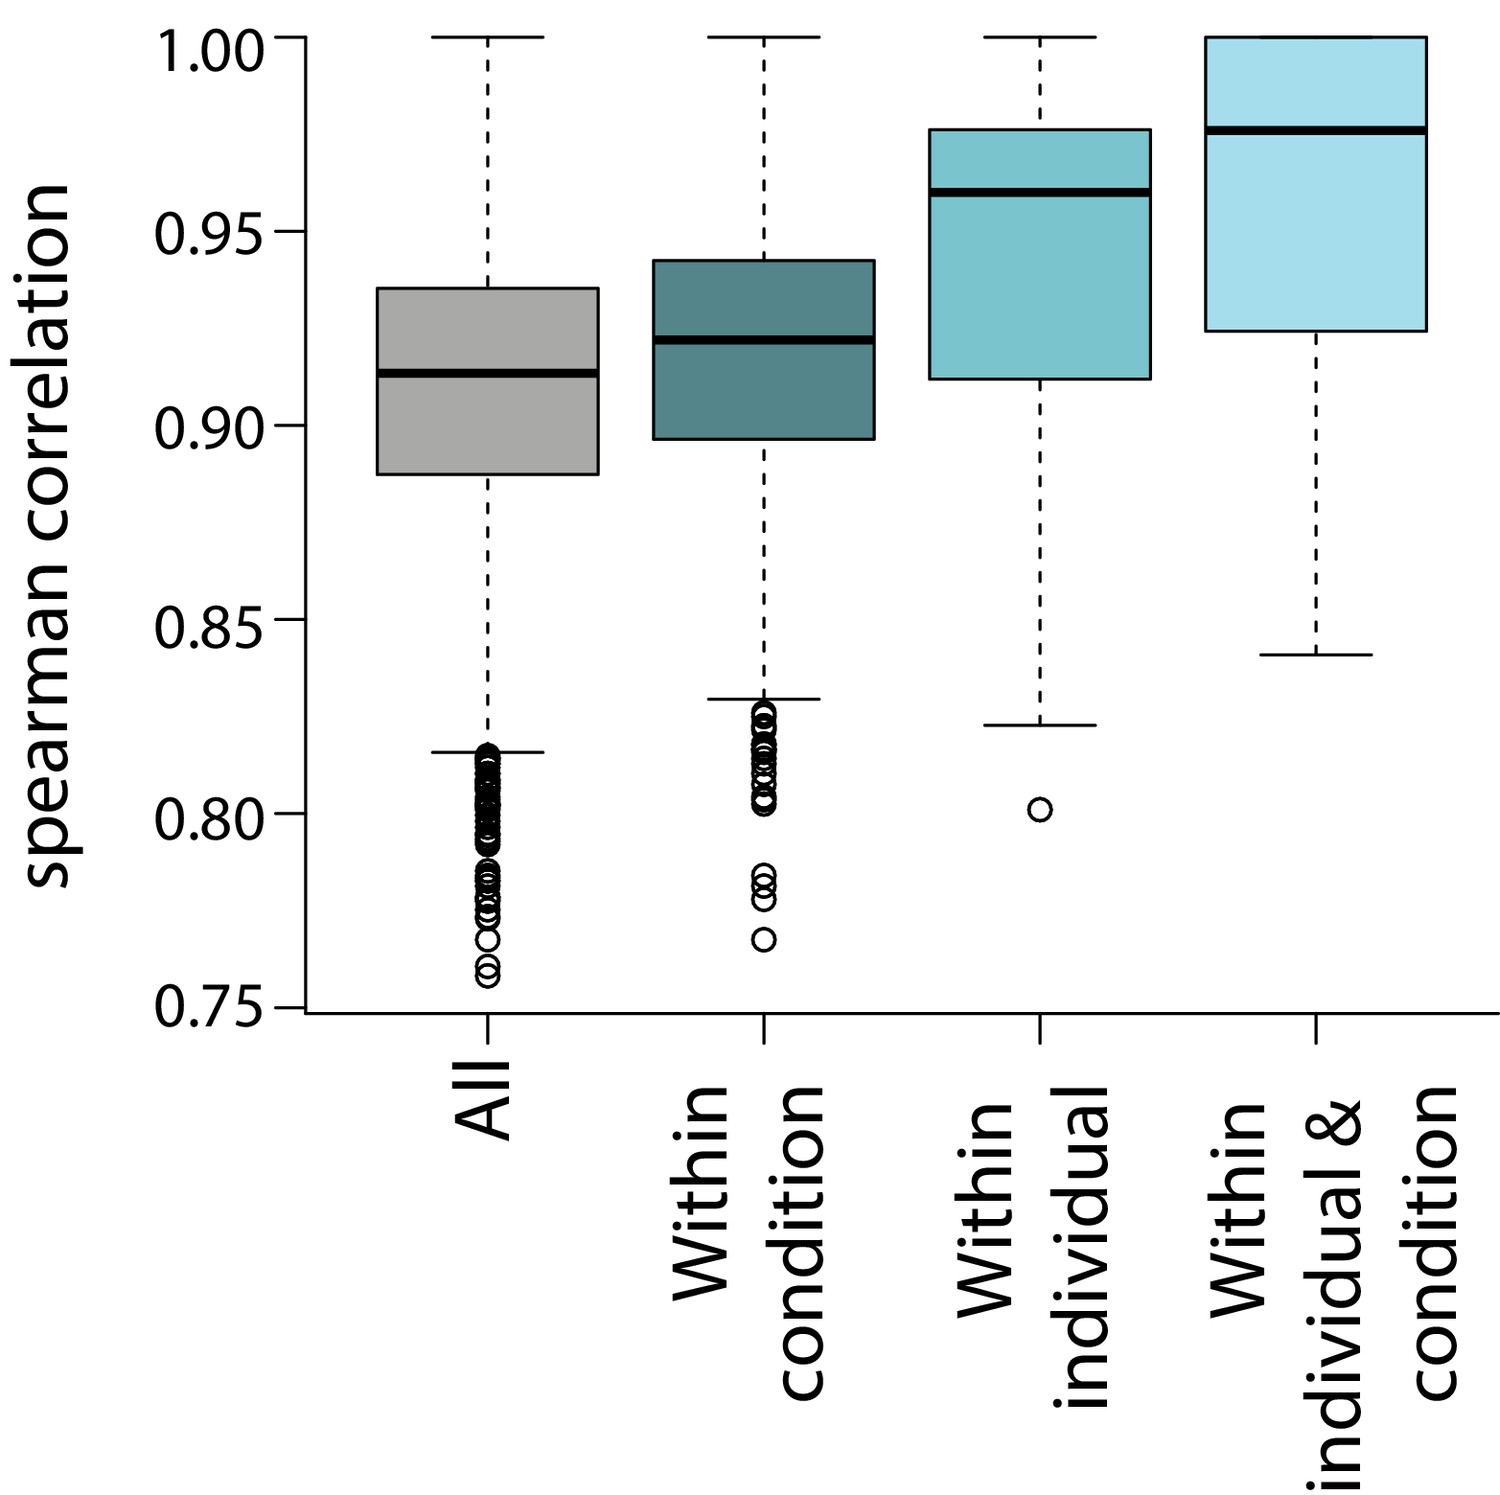
Correlation of gene expression measurements across samples.
Spearman correlation between all samples, samples within the same condition, samples from the same individual, and samples from the same condition and individual.
Figure 2—figure supplement 4
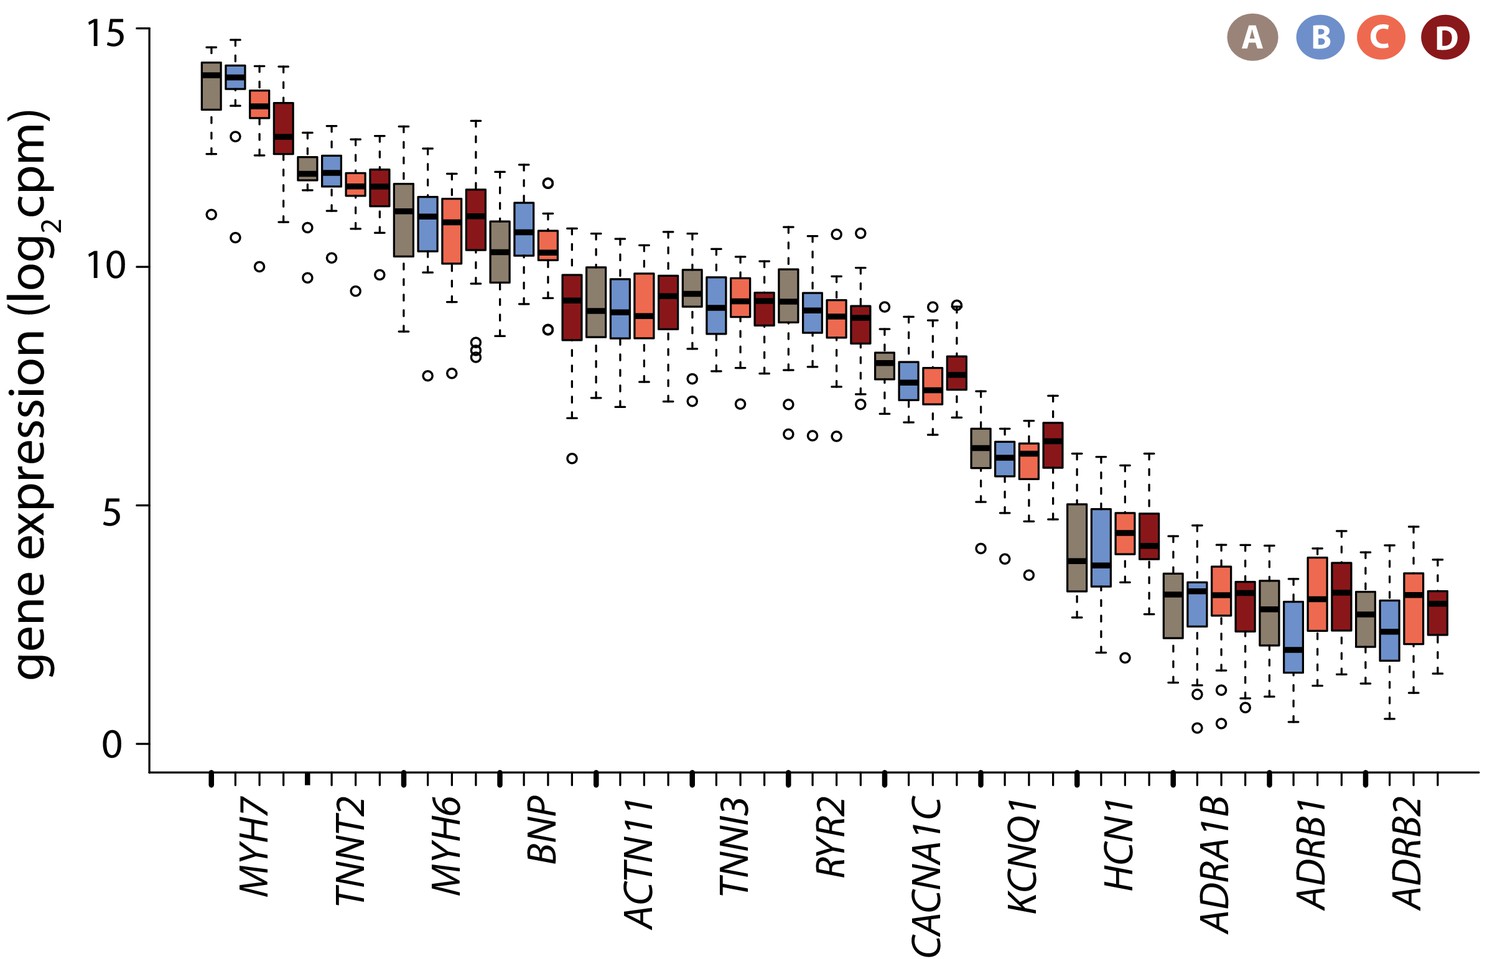
Cardiomyocyte marker genes are expressed in iPSC-CMs.
Log2cpm expression levels for a panel of genes known to be expressed in cardiomyocytes in each condition.
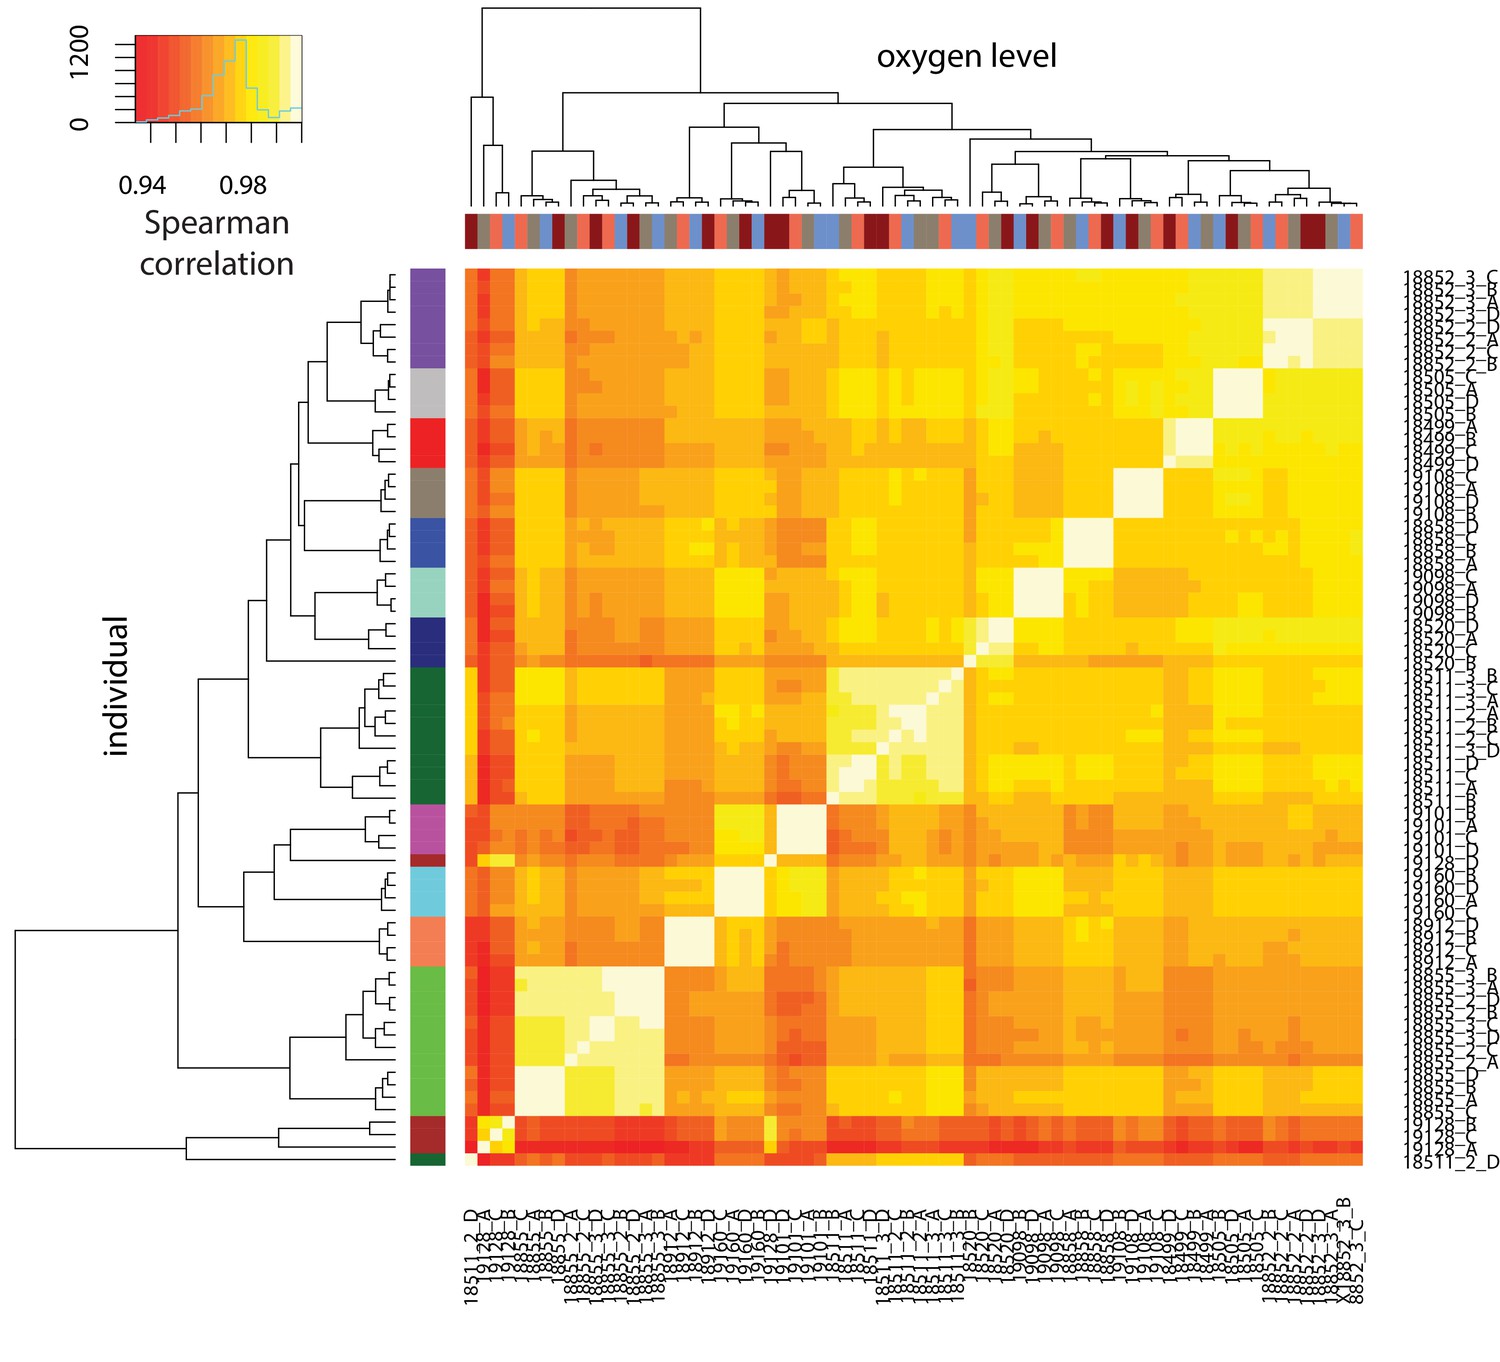
Figure 2—figure supplement 5

RNA-seq samples cluster by oxygen level and individual.
Spearman correlation of RUVs-normalized log2cpm expression levels between all pairs of samples. X-axis: oxygen level: normoxia at 10% oxygen (condition A: brown), 1% oxygen for 6 hr (condition B: blue), re-oxygenation to 10% oxygen for 6 hr (condition C: coral), re-oxygenation to 10% oxygen for 24 hr (condition D: red). Y-axis: individual. All samples from the same individual are represented by the same color.
Figure 2—figure supplement 6
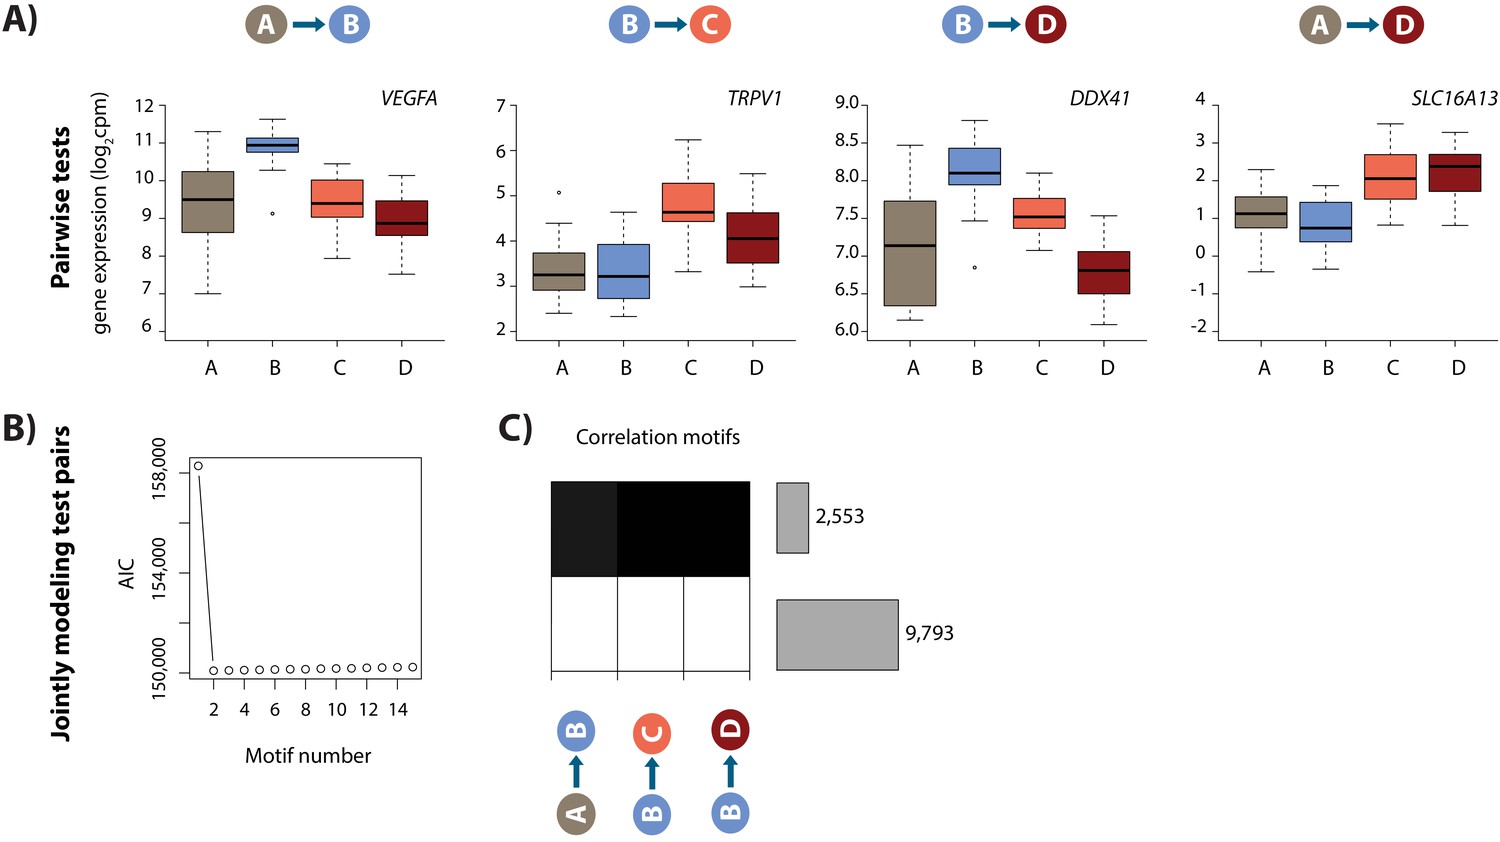
Hypoxia and re-oxygenation induces a gene expression response.
(A) Examples of genes that are differentially expressed between each pair of conditions. (B) Akaike information criterion (AIC) at increasing numbers of Cormotif correlation motifs. (C) The two correlation motifs identified by Cormotif. Color represents the posterior probability of genes being differentially expressed between pairs of conditions. The number of genes associated with each motif is plotted on the right. Genes with a p>0.5 across all tests are defined as ‘response genes’ and those with p<0.5 as ‘non-response genes’.
Figure 3 with 3 supplements
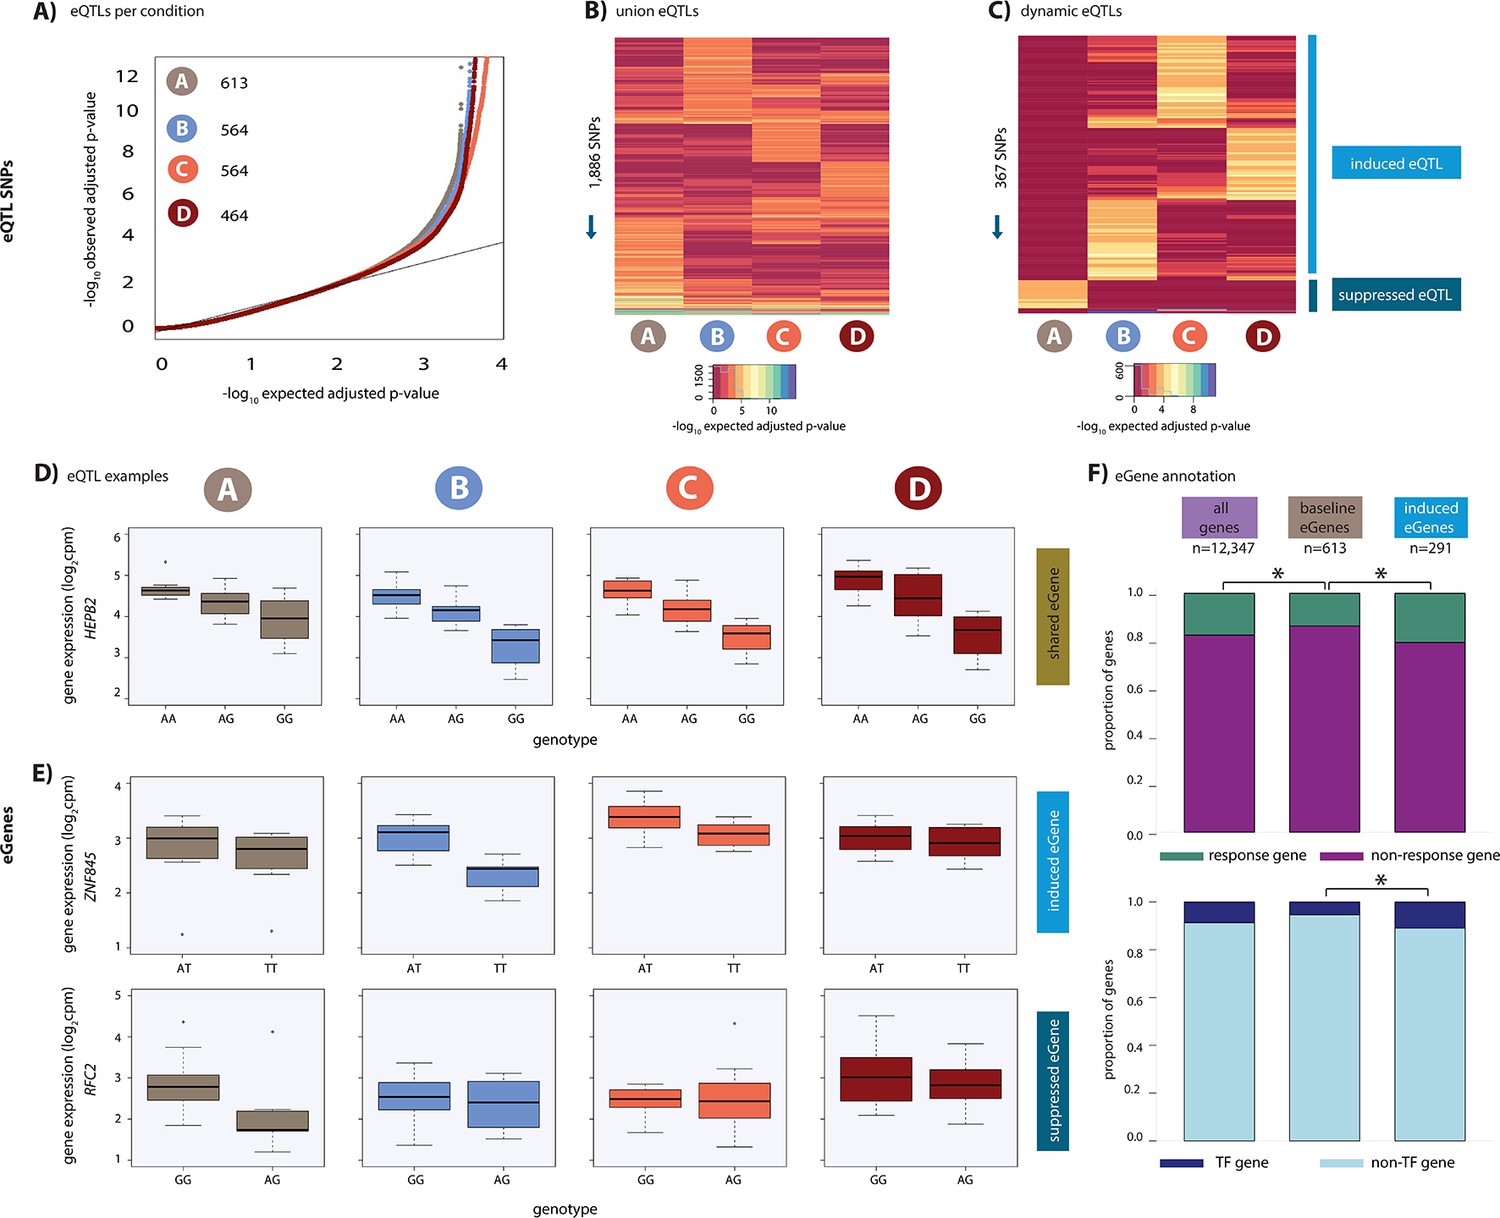
Hundreds of dynamic eQTLs are revealed following hypoxia and re-oxygenation.
(A) QQ plot illustrating an enrichment of associations between genetic variants and gene expression levels in each condition. Numbers represent the number of eGenes in each condition. (B) Union of eQTLs identified in each condition. Each row represents a SNP that is an eQTL in at least one condition. Color represents the strength of the association p-value. (C) Heatmap illustrating the 367 SNPs that are classified as dynamic eQTLs including 330 induced eQTLs and 37 suppressed eQTLs. (D) An example of a shared eQTL, HEPB2. (E) Examples of each of the two dynamic eQTL categories. Top panel: genes that become an eQTL following hypoxia – induced eQTLs e.g. ZNF845. Bottom panel: genes that are an eQTL in normoxic condition A but not following hypoxia – suppressed eQTLs e.g. RFC2. (F) The proportion of all genes, baseline eGenes (all those identified in condition A), and induced eGenes that are also response genes, and transcription factor genes curated by Lambert et al. Asterisk denotes a statistically significant difference between gene categories (*p<0.05).
Figure 3—figure supplement 1
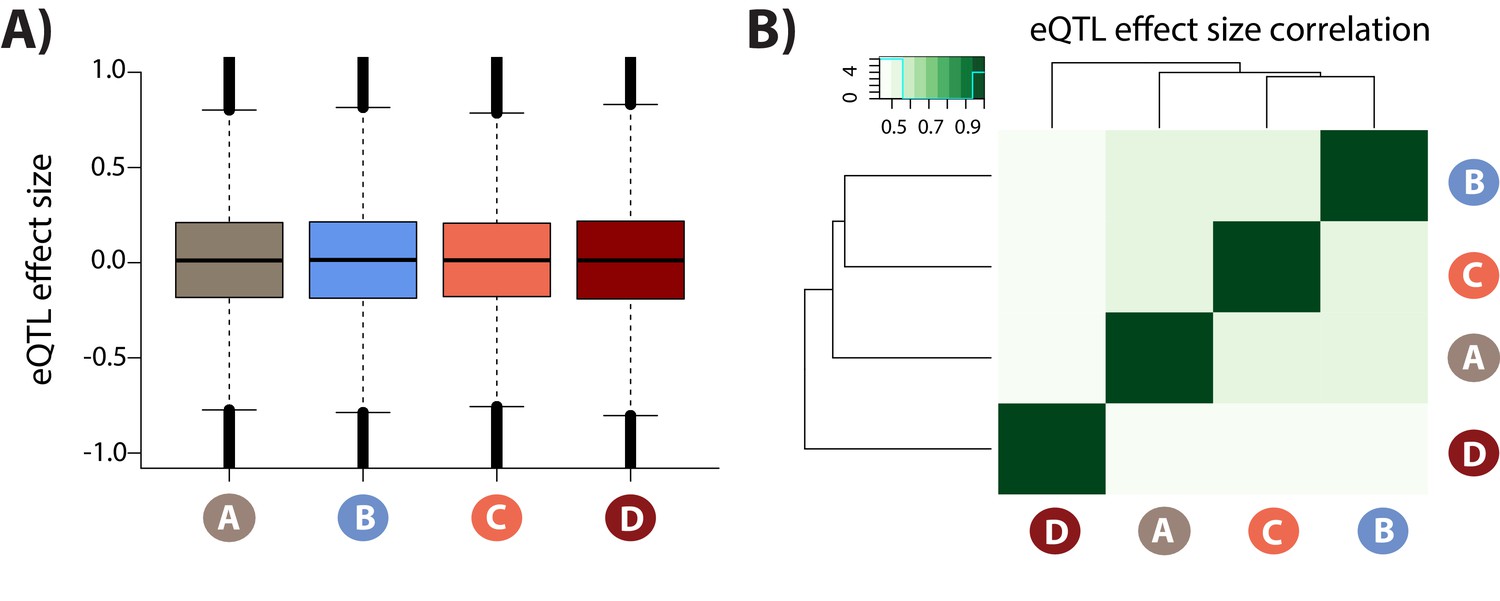
eQTL effect sizes in each condition.
(A) Distribution of eQTL effect sizes for all SNP-gene pairs in each condition. (B) Pearson correlation of effect sizes between each condition pair.
Figure 3—figure supplement 2
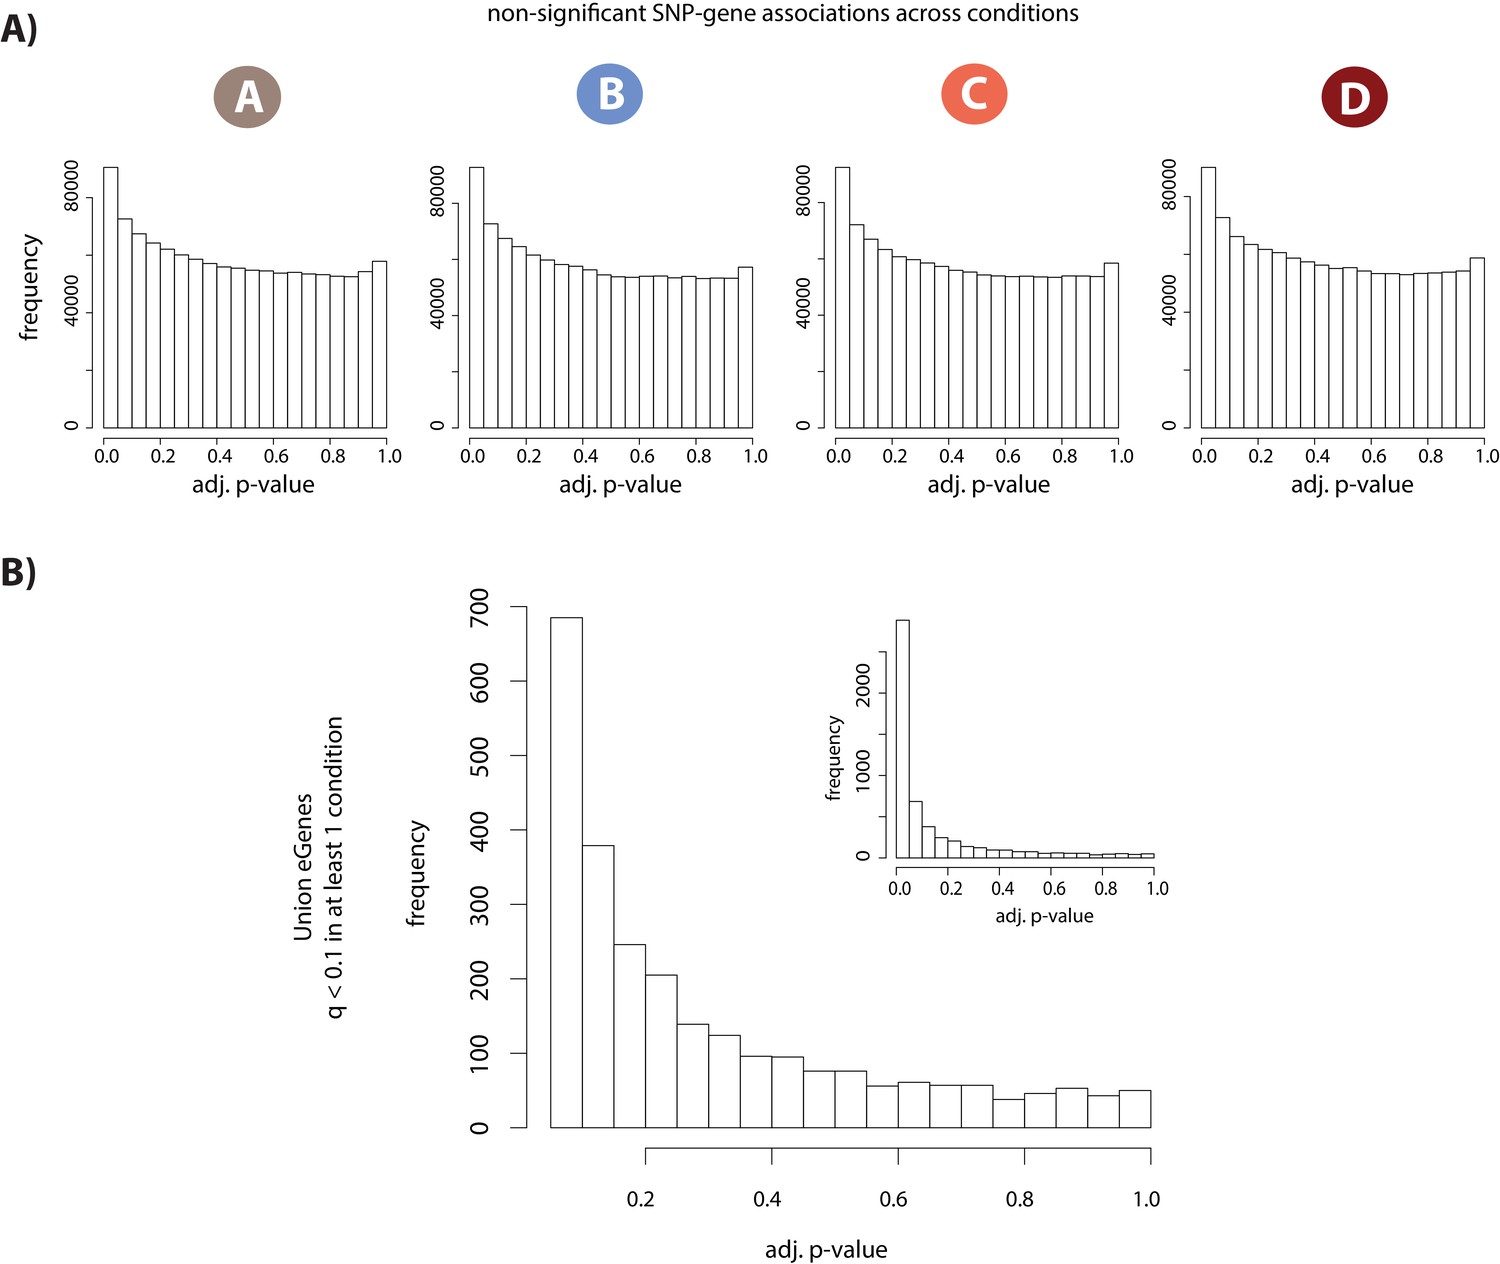
eQTL and dynamic eQTL identification.
(A) Distribution of permutation-adjusted p-values in each condition for all tested SNP-gene pairs that are not significantly associated (q > 0.1). KS D statistic for A = 0.05, p<2.2×10⁻¹⁶; KS D B = 0.05 p<2.2×10⁻¹⁶; KS D C = 0.05, p<2.2×10⁻¹⁶; KS D D = 0.05, p<2.2×10⁻¹⁶. (B) Distribution of permutation-adjusted p-values for all non-significant SNP-gene associations (q < 0.1 in at least one condition, and q > 0.1 in at least one condition) where all p-values greater than 0.05 are plotted. Inset: distribution of all p-values including those <0.05. KS main plot D = 0.35, p<2.2×10⁻¹⁶; KS inset D = 0.57, p<2.2×10⁻¹⁶. Dynamic eQTLs were identified using a p-value based threshold of 0.15.
Figure 3—figure supplement 3
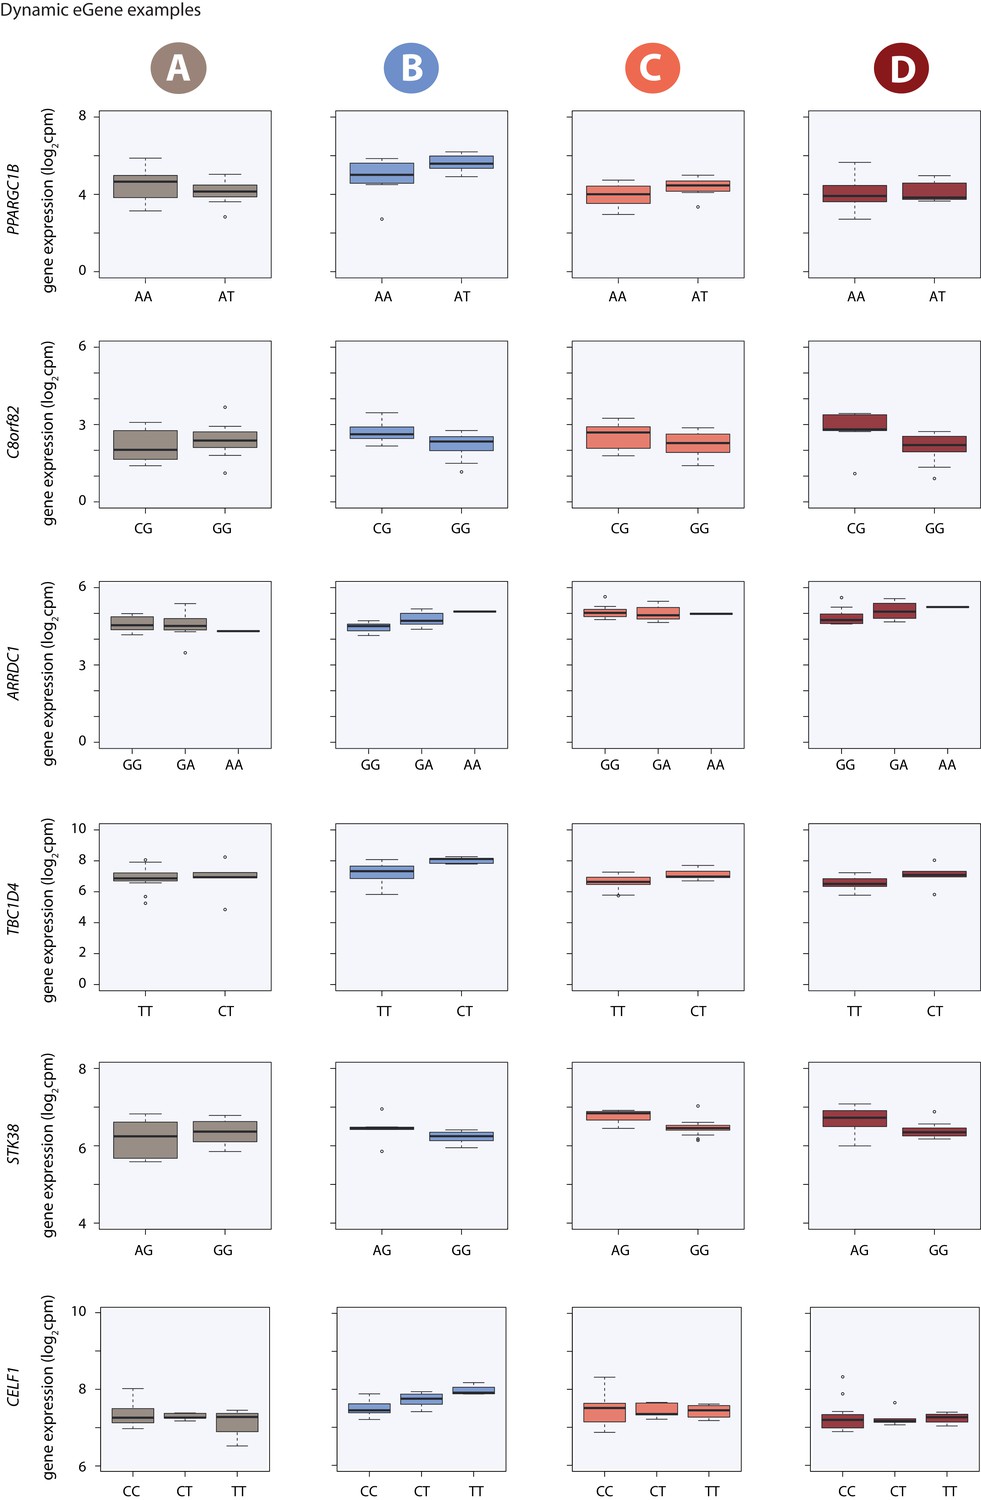
Dynamic eQTL examples.
Gene expression measurements for six induced eQTLs stratified by genotype.
Figure 4 with 4 supplements
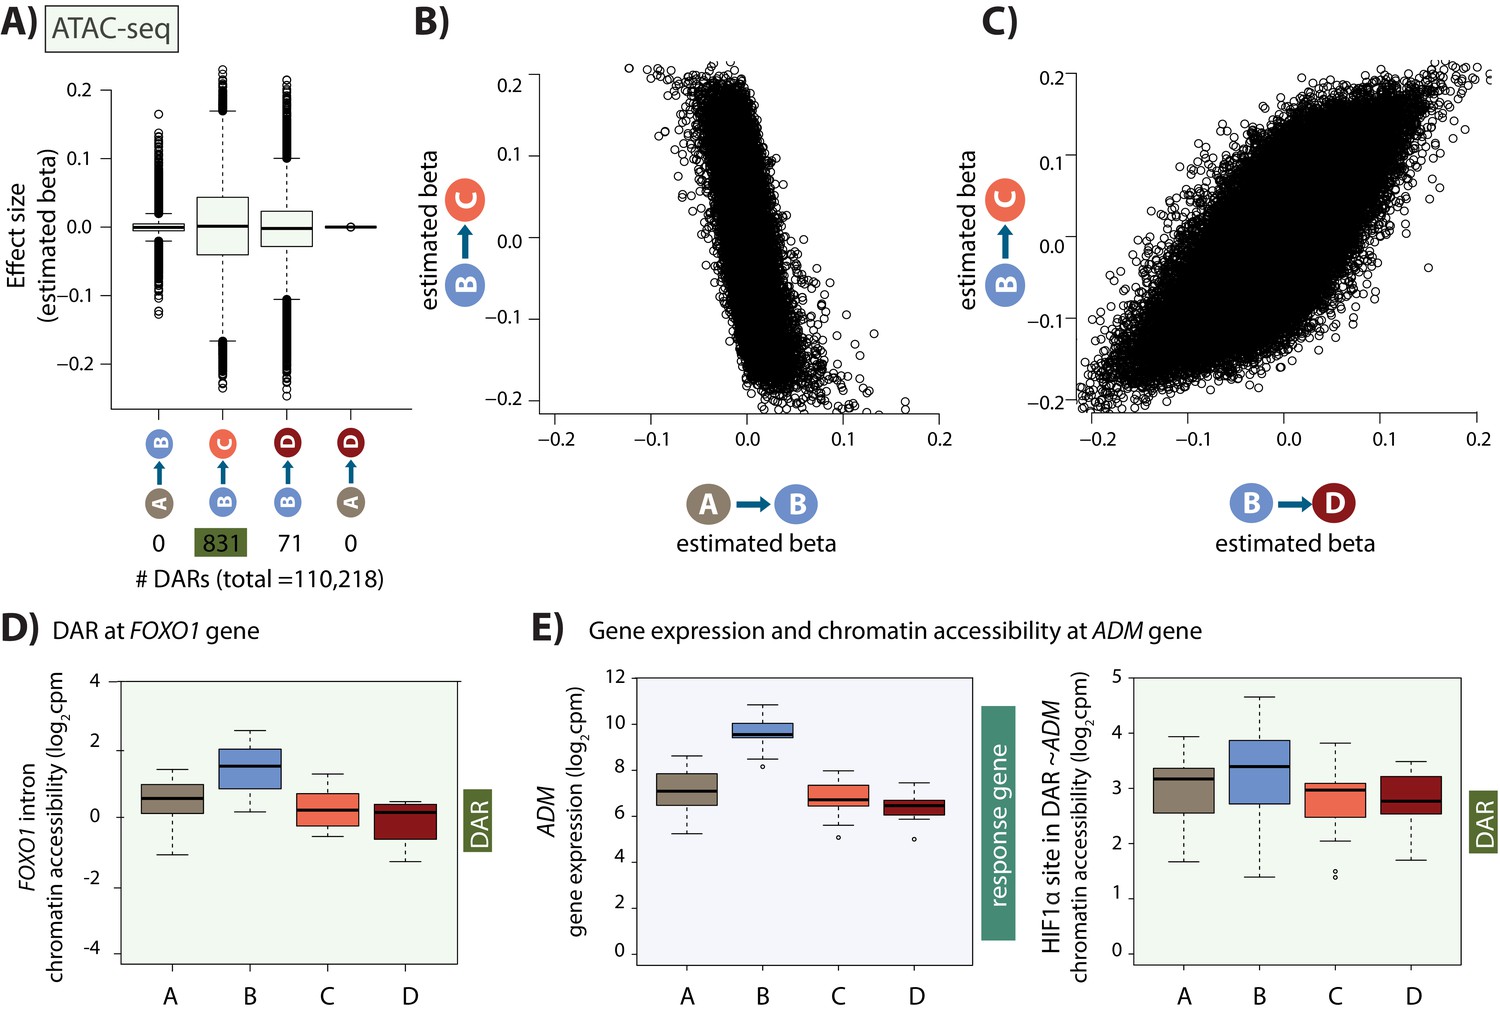
Hundreds of chromatin accessibility changes occur following hypoxia and re-oxygenation.
(A) Estimated effect size (Beta) following adaptive shrinkage (ash) between each pair of conditions, and the numbers of chromatin regions that are differentially accessible (DARs) between pairs of conditions. (B) Estimated Beta for each region when comparing A vs. B and B vs. C. (C) Estimated Beta for each region when comparing B vs. C, and B vs. D. (D) Chromatin accessibility levels at a chromatin region within a FOXO1 intron. (E) Expression levels of the hypoxia-responsive gene ADM following hypoxia, and chromatin accessibility levels at a DAR, overlapping an induced HIF1α-bound region, within 500 bp of the ADM gene.
Figure 4—figure supplement 1
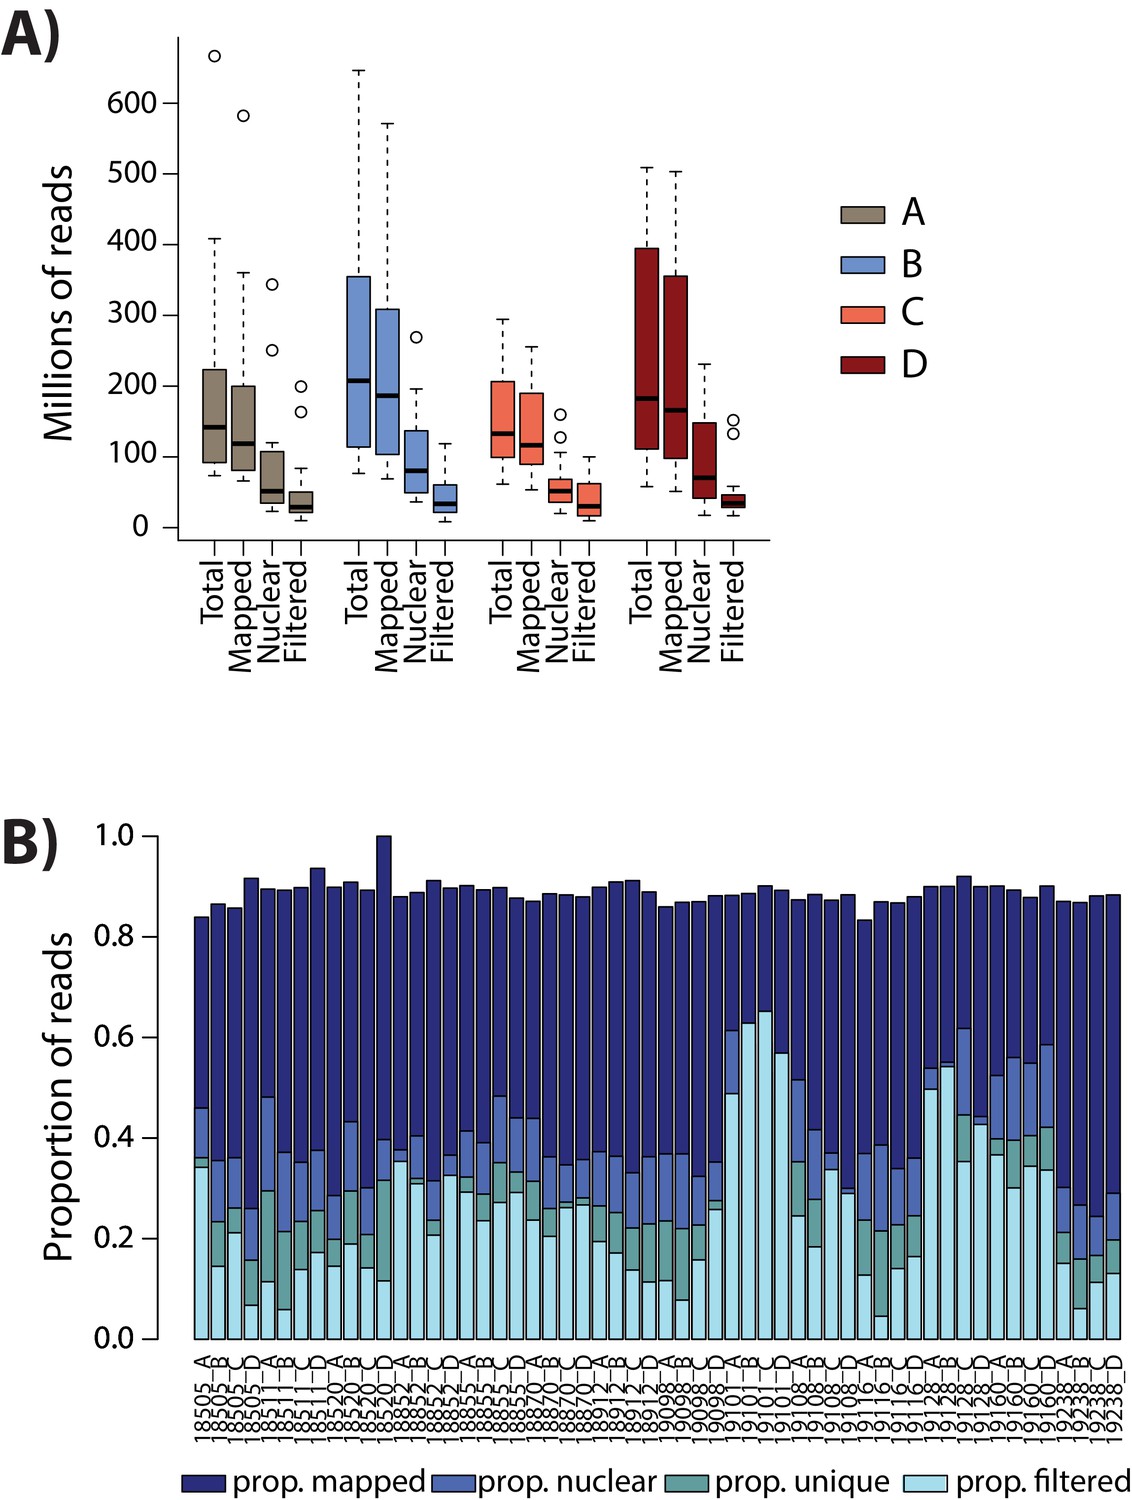
Numbers of ATAC-seq reads are similar across conditions.
(A) The total number of sequenced reads (Total), the number of reads that map to the human genome (Mapped), the number of reads that map to the nuclear genome (Nuclear), and the number of reads that pass the WASP re-mapping and quality filtering step (Filtered) are shown for each sample within each of the four conditions (A: brown, B: blue, C: coral, D: red). (B) The proportion of reads in each mapping category for each sample.
Figure 4—figure supplement 2
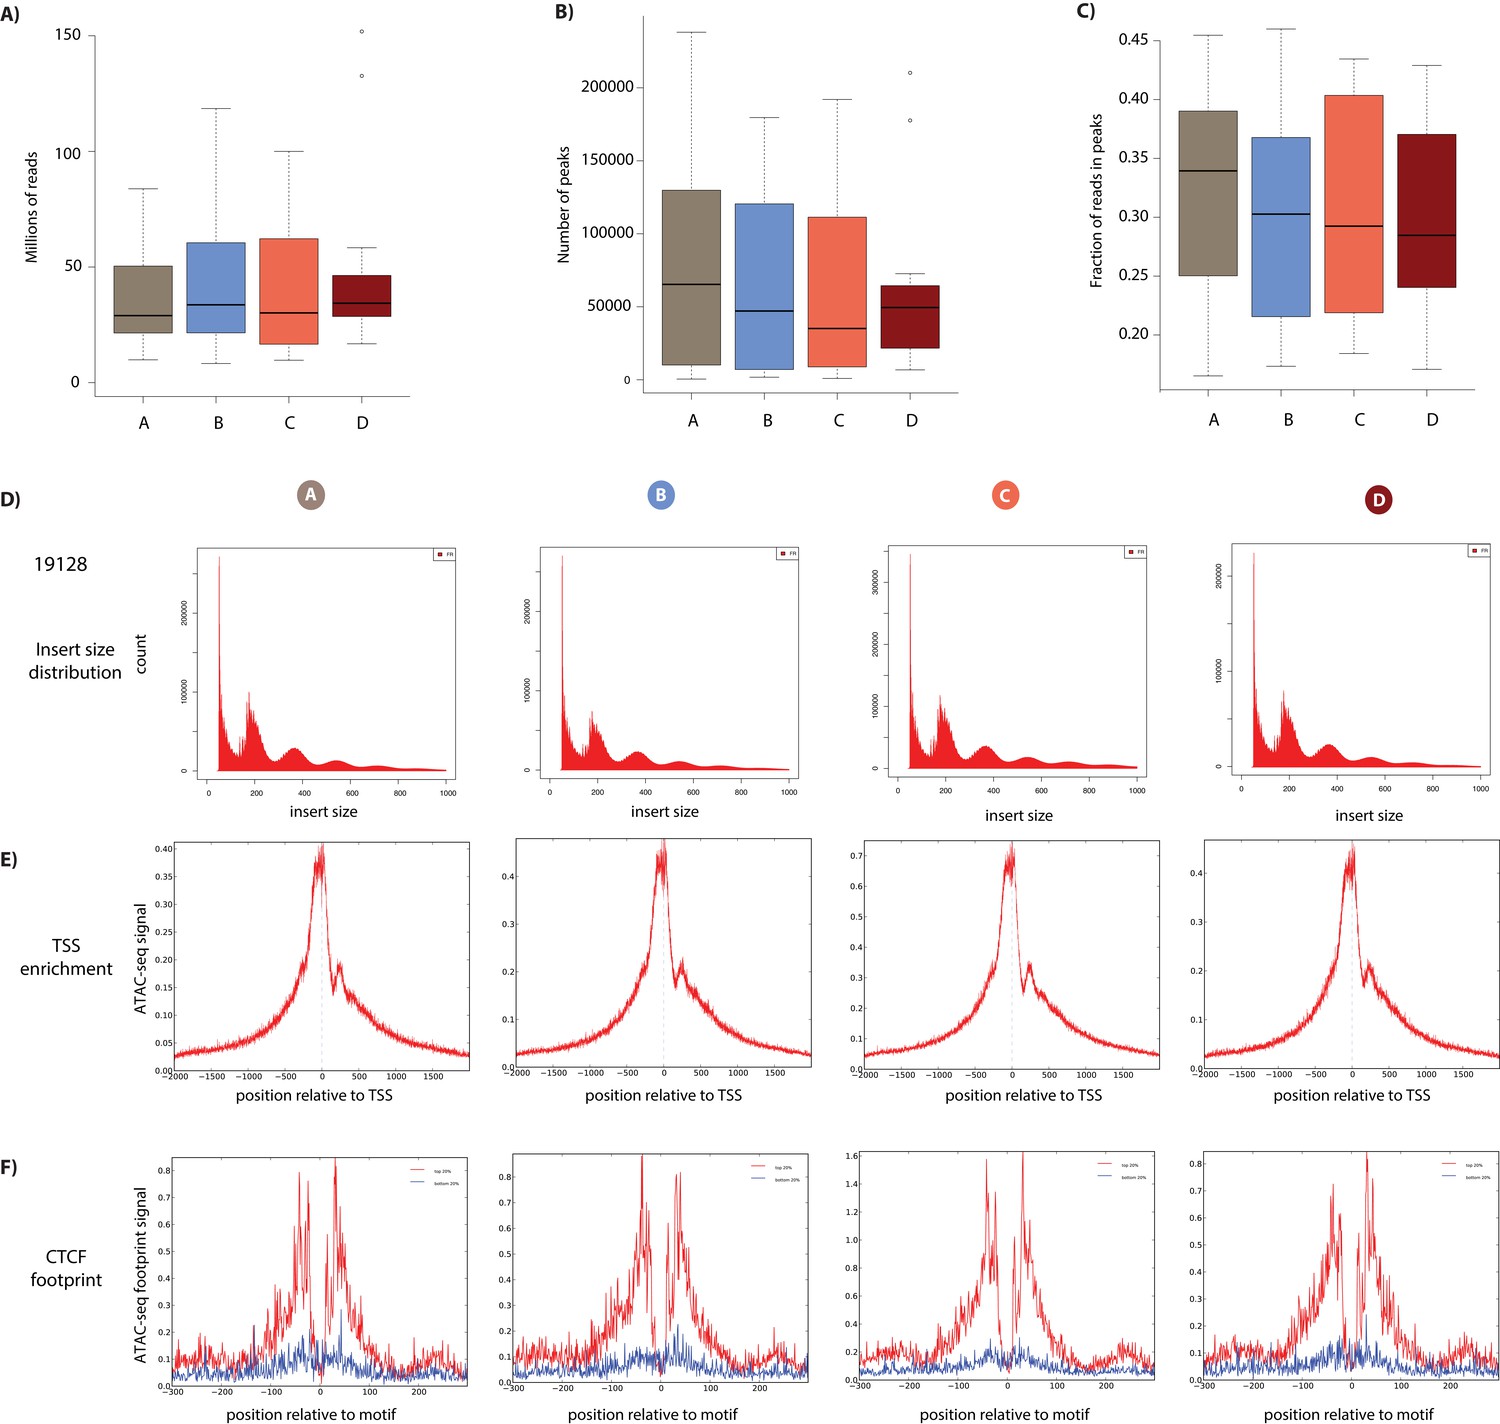
ATAC-seq library quality control.
(A) The final number of ATAC-seq reads that have passed all mapping and filtering steps segregated by condition. (B) The number of open chromatin regions (peaks) in each sample segregated by condition. (C) The fraction of reads in peaks in all samples segregated by condition. (D) The distribution of fragment sizes of ATAC-seq libraries from the four conditions from a representative individual (19128). (E) The enrichment of sequencing reads around the TSS. The ATAC-seq footprint around CTCF motifs. Motifs are segregated by motif strength (top and bottom 20% of sites).
Figure 4—figure supplement 3
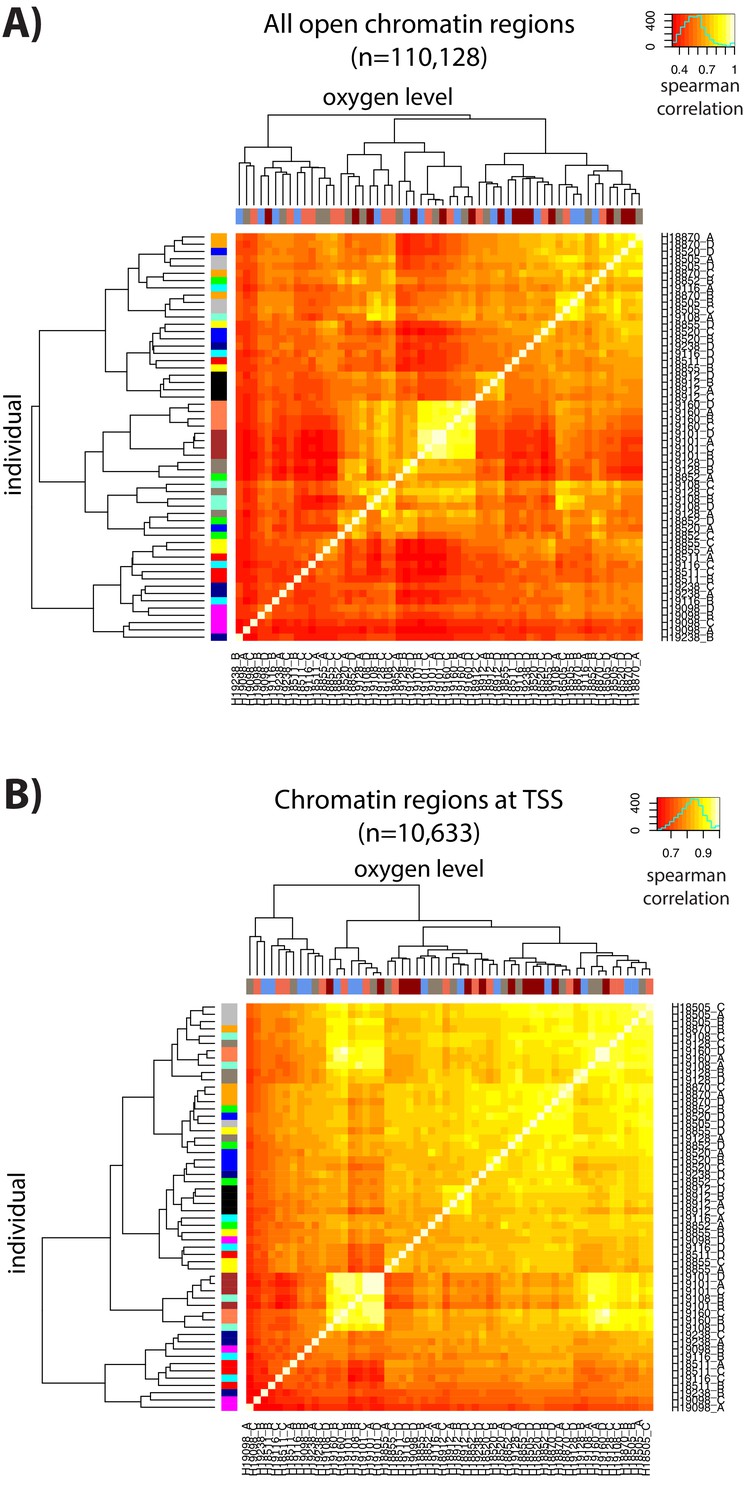
ATAC-seq libraries cluster by individual and treatment.
(A) Spearman correlation of ATAC-seq read counts between samples when considering all chromatin regions. (B) Spearman correlation of ATAC-seq read counts between samples when restricting to chromatin regions at the TSS. Colors on the x-axis refer to each of the four conditions (A: brown, B: blue, C: coral, D: red) and colors on the y-axis refer to each of the 14 individuals.
Figure 4—figure supplement 4
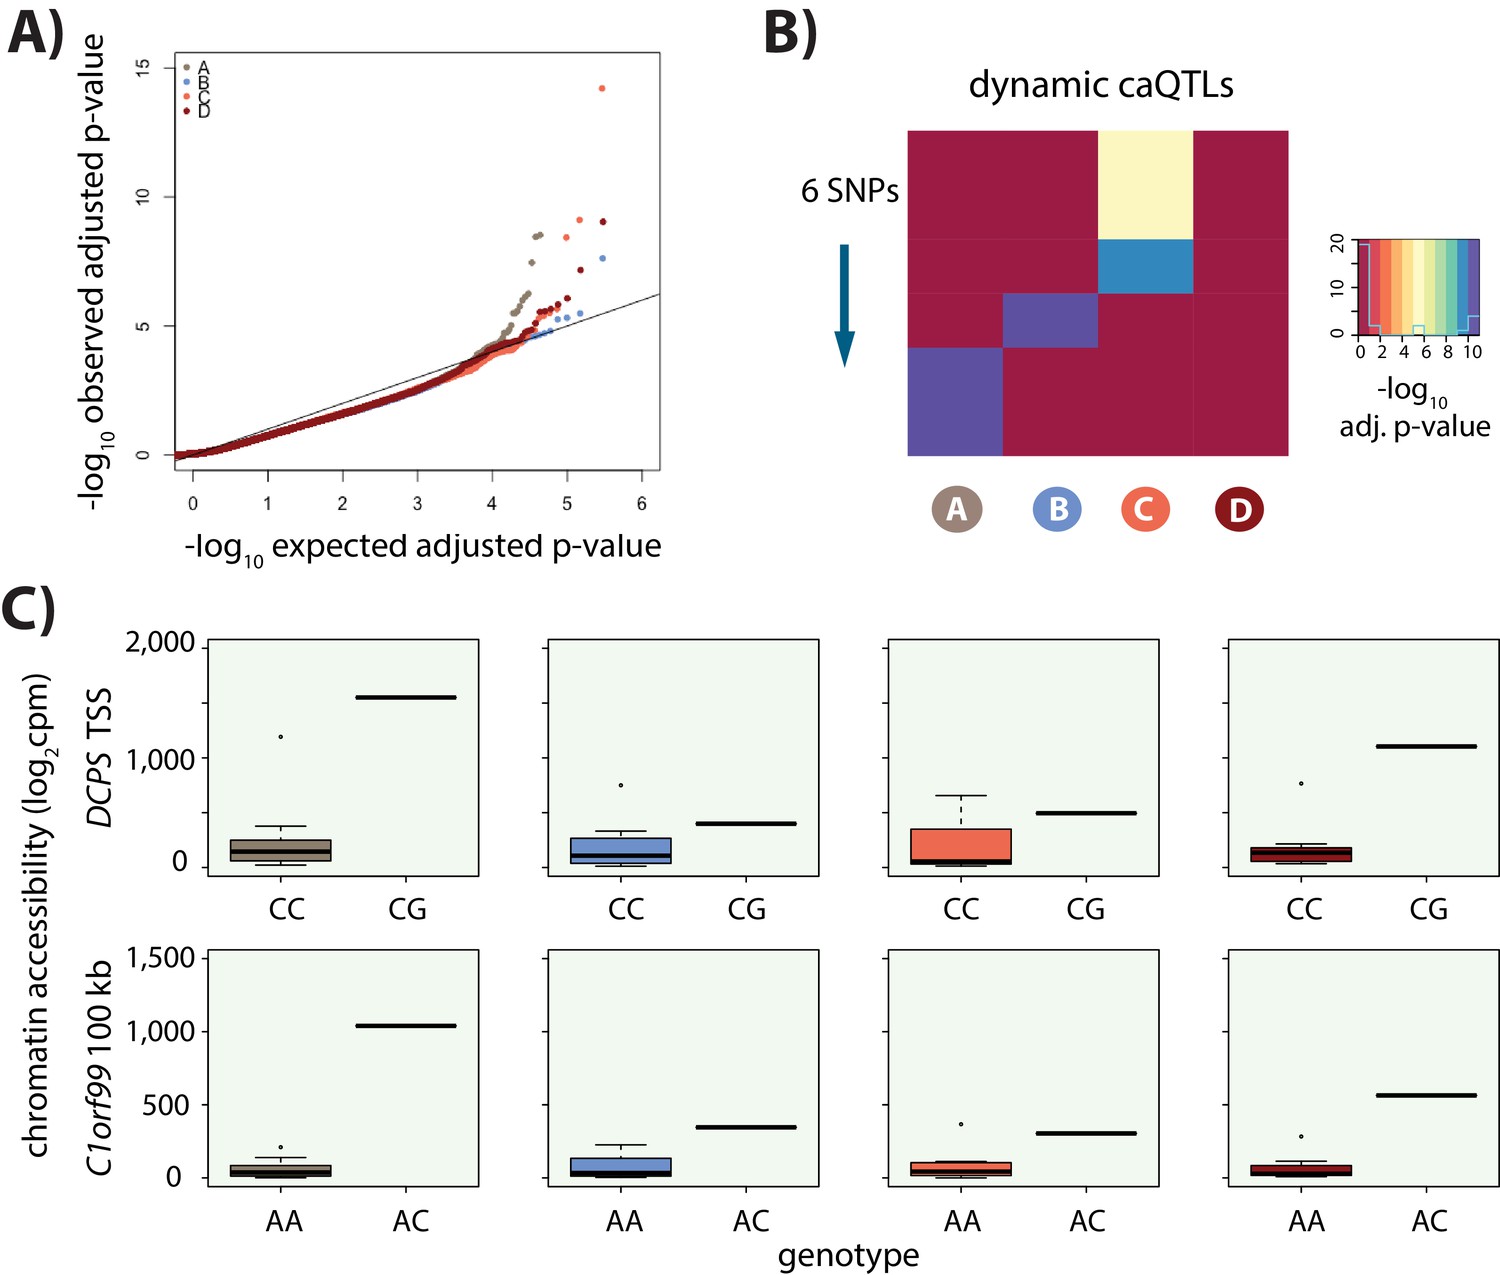
Identification of caQTLs.
(A) QQ plot showing an enrichment of low p-values for the association between genotype and level of chromatin accessibility in each of the four conditions. (B) Heatmap representing the six dynamic caQTLs. Each row represents a SNP, and the color represents the significance of the association between genotype and chromatin accessibility. (C) Examples of two dynamic caQTLs including a region within the promoter of the DCPS gene, and a region ~100 kb away from the C1orf99 gene. The two genotype classes represented at these loci are included.
Figure 5
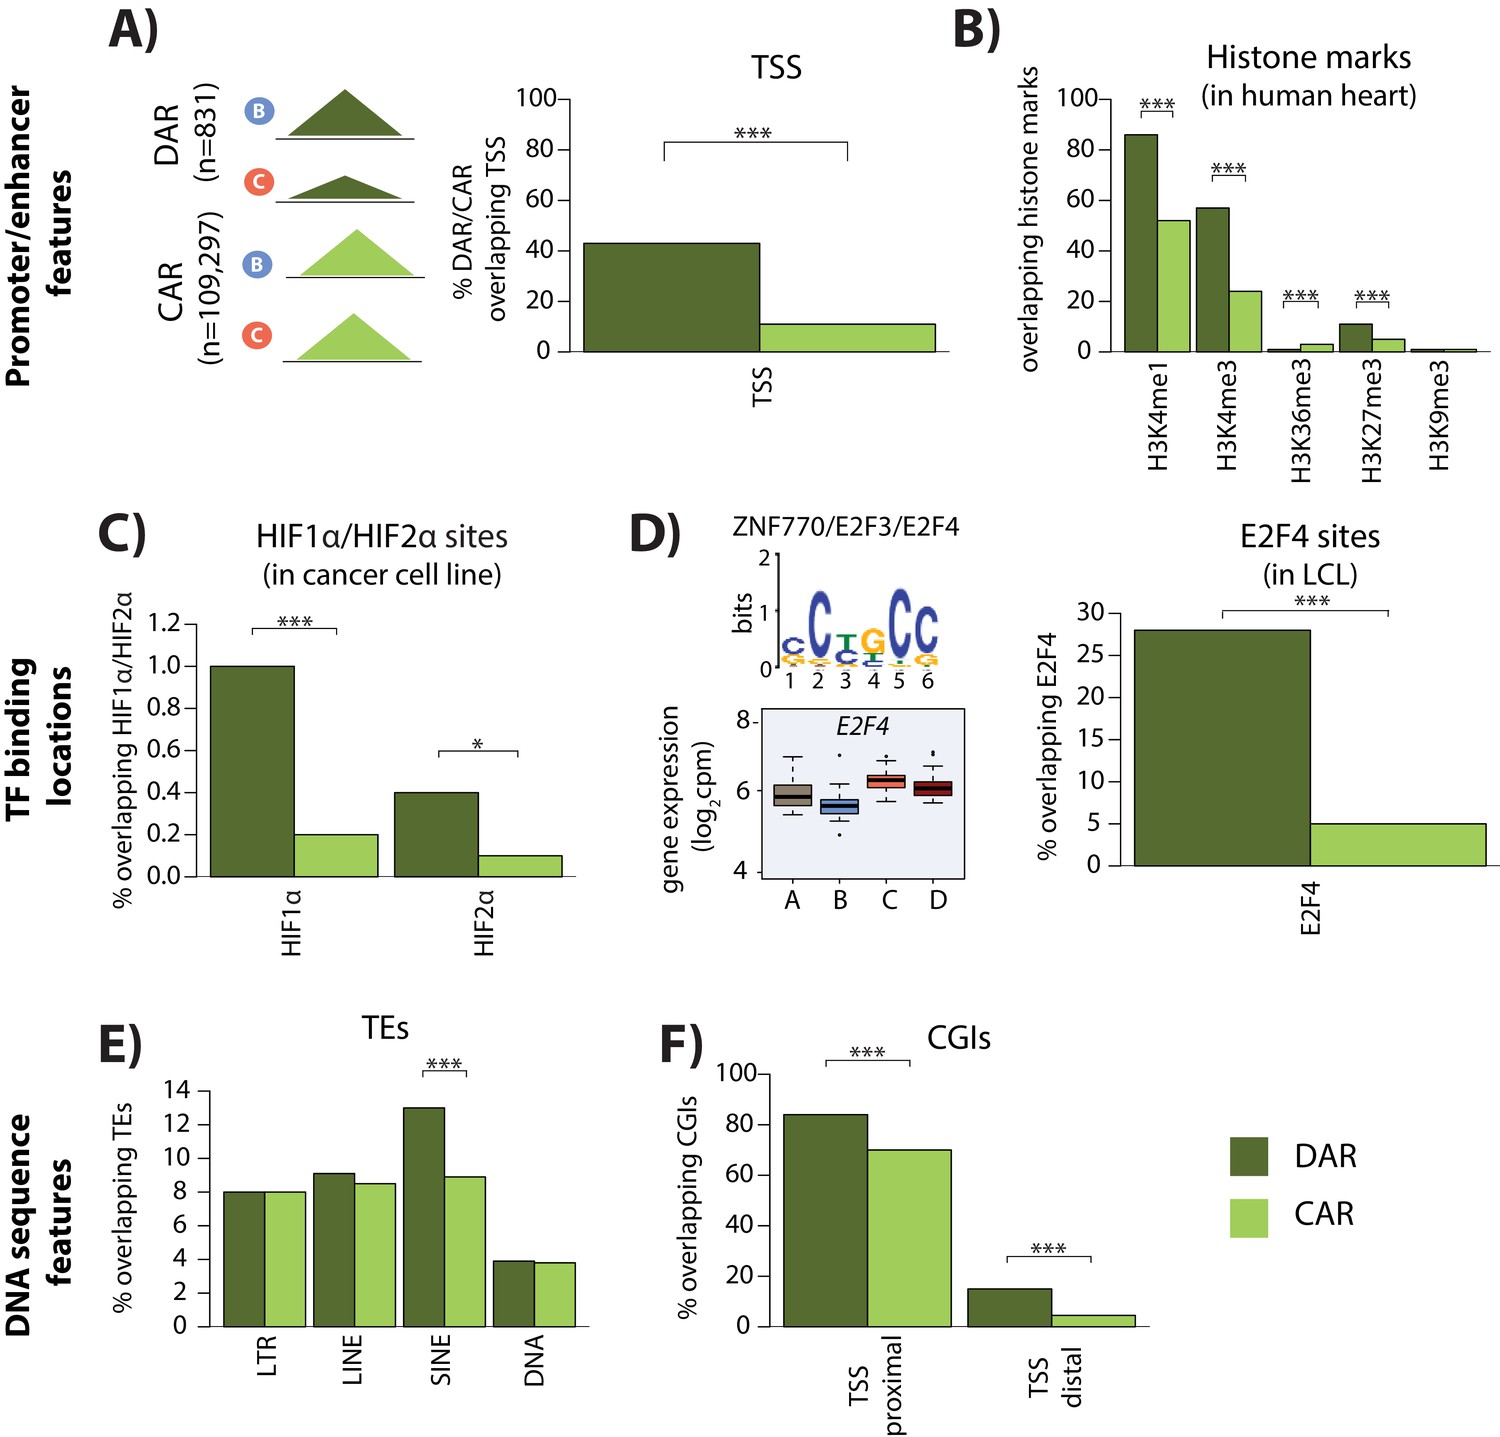
Differentially accessible regions are enriched for active chromatin features.
(A) The proportion of differentially accessible regions (DARs) and constitutively accessible regions (CARs) that overlap with annotated TSS. (B) The proportion of DARs and CARs that overlap with the locations of histone marks determined by ChIP-seq in human heart tissue (ENCODE Project Consortium, 2012). (C) The proportion of DARs and CARs that overlap with HIF1α and HIF2α binding locations determined by ChIP-seq in a breast cancer cell line (Schödel et al., 2011). (D) The most significant motif identified to be differentially enriched in DARs compared to all ARs that is putatively recognized by ZNF770, E2F3 and E2F4. We classify E2F4 as a response gene and therefore determined the proportion of DARs and CARs that overlap with E2F4 ChIP-seq binding locations identified in a human LCL line (Lee et al., 2011). (E) The proportion of DARs and CARs that overlap four major transposable element (TE) classes – LTR, LINE, SINE, DNA. The proportion of DARs and CARs that overlap with CpG islands (CGIs) that is proximal to the TSS (+/- 2 kb from the TSS), and distal to the TSS. Asterisk denotes a statistically significant difference between DARs and CARs (*p<0.05, **p<0.005, ***p<0.0005).
Figure 6 with 4 supplements
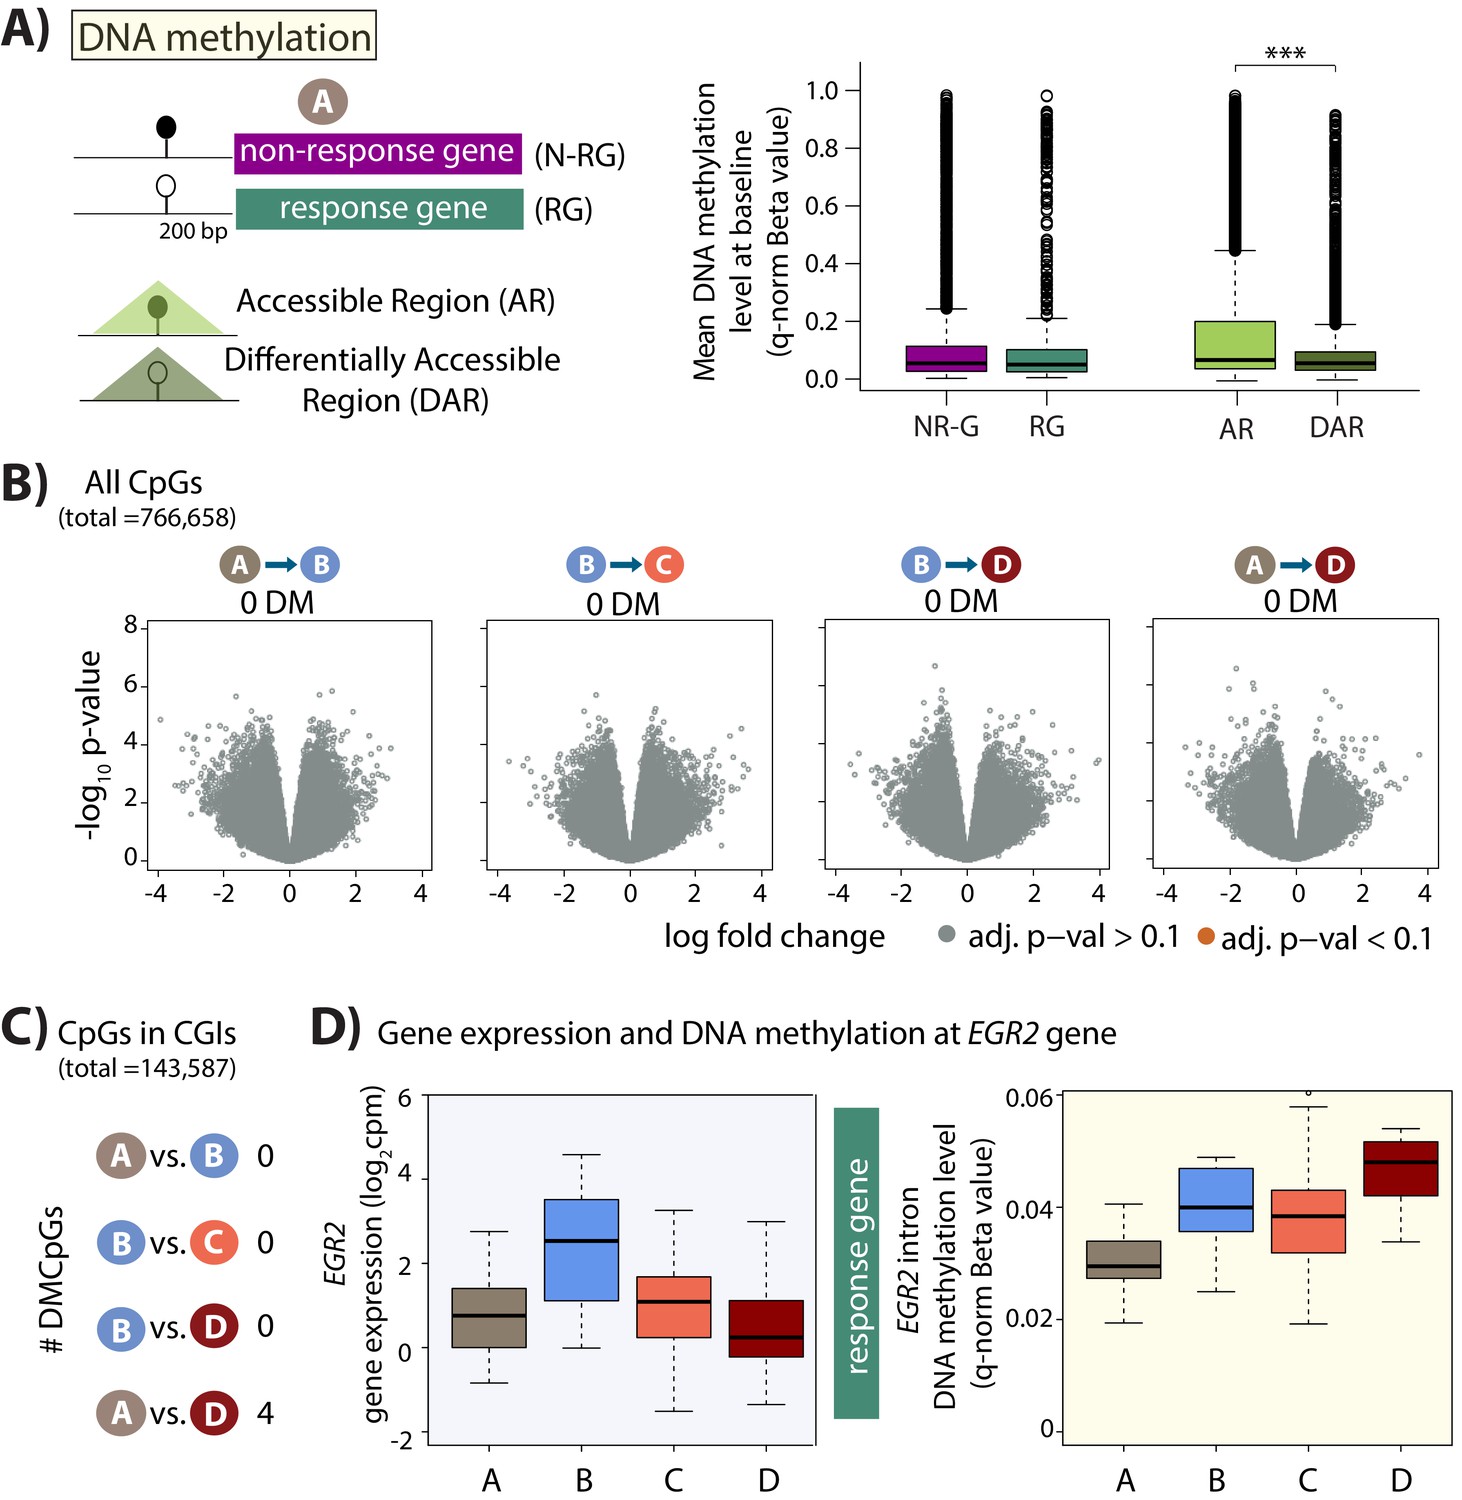
Minimal DNA methylation changes following hypoxia.
(A) Mean DNA methylation levels (Beta-values) in the baseline condition (A) at CpGs within 200 bp upstream of the TSS of non-response genes (NR-G) and response genes (RG), and within all accessible regions (ARs) and differentially accessible regions (DARs; *p<0.05, ***p<0.0005). (B) Volcano plots representing the differential DNA methylation analysis across 766,658 CpGs. There are no differentially methylated (DM) CpGs across any pair of conditions. (C) Numbers of differentially methylated CpGs, when restricting the test set to include only CpGs within CpG islands, across pairs of conditions. (D) Gene expression and DNA methylation levels at a differentially methylated CpG within an intron of the EGR2 response gene.
Figure 6—figure supplement 1
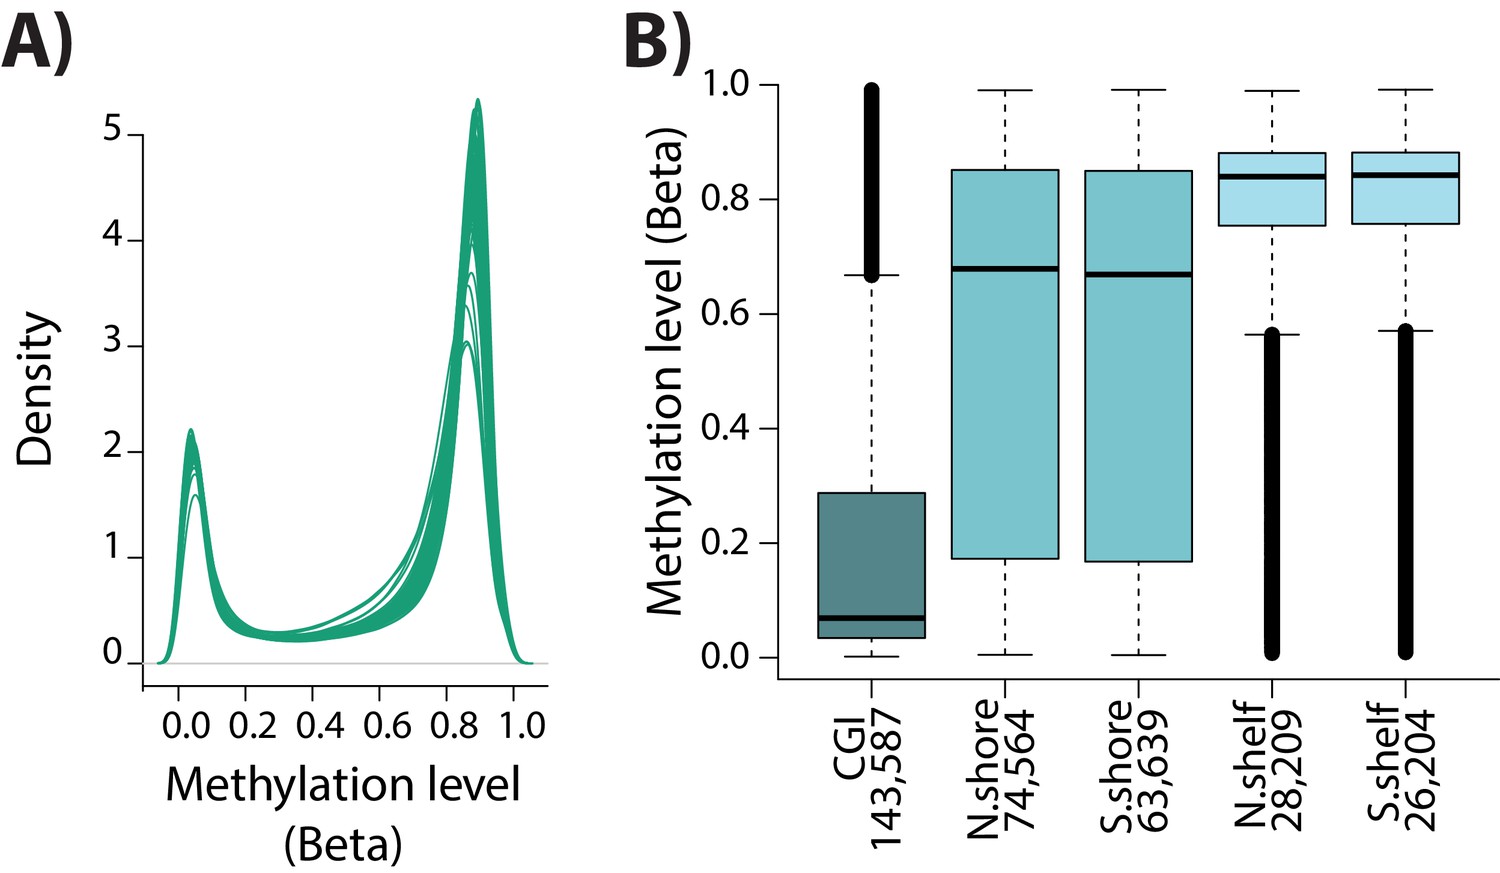
DNA methylation array quality control.
(A) The distribution of Beta-values across samples. (B) The Beta-value for each CpG within a CpG island (CGI), CGI north and south shores, and CGI north and south shelves.
Figure 6—figure supplement 2
DNA methylation levels cluster by individual.
Spearman correlation of quantile-normalized Beta-values for 766,858 CpGs between all sample pairs. X-axis represents oxygen level, and y-axis represents individual.
Figure 6—figure supplement 3
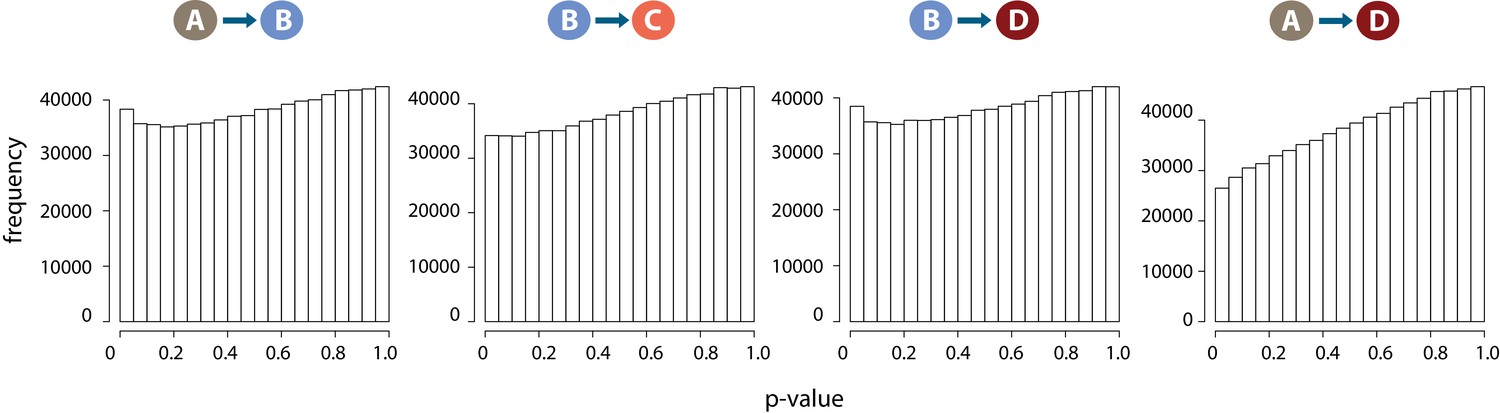
DNA methylation levels are stable across conditions.
Distribution of p-values across each pair of contrasts following differential DNA methylation analysis across 766,658 CpGs.
Figure 6—figure supplement 4
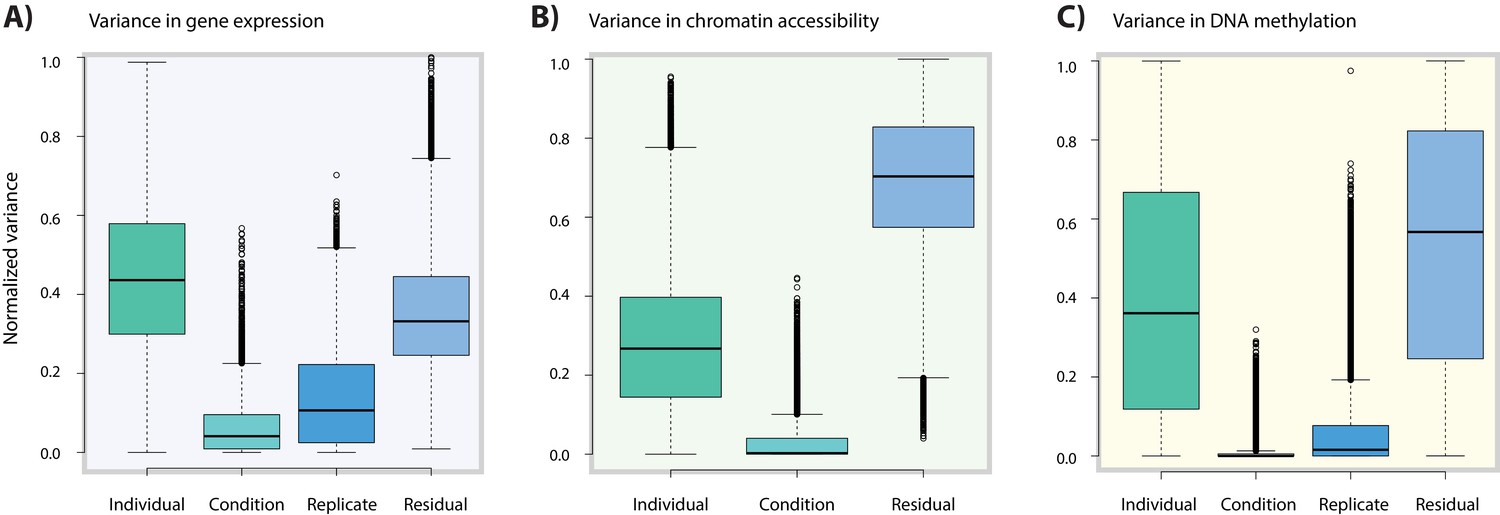
Variance associated with oxygen condition is lower in DNA methylation data compared to gene expression data.
(A) Variance in normalized gene expression counts attributed to individual (one of 15 different individuals), condition (A,B,C,D), replicate (all conditions from three individuals replicated three times) and residual variance. (B) Variance in normalized read counts in accessible regions across 14 individuals (no replicate samples were collected). (C) Variance in normalized DNA methylation Beta-values across all CpGs in 13 individuals.
Figure 7 with 4 supplements
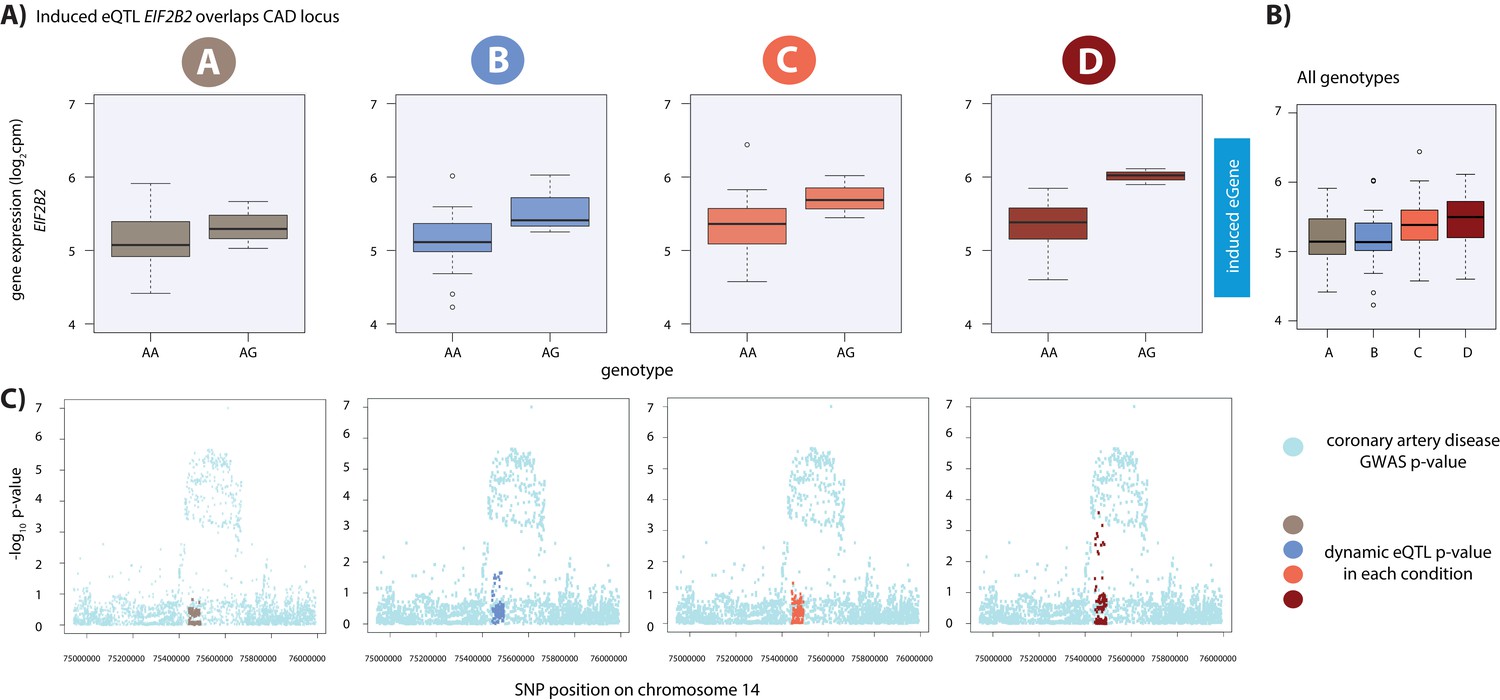
Dynamic eQTL for EIF2B2 overlaps a coronary artery disease GWAS locus.
(A) EIF2B2 is a dynamic eGene. (B) Expression levels of EIF2B2 during the course of the experiment following aggregation of all individuals. (C) Locus zoom plots in each condition illustrating the tested SNPs in the CARDIoGRAMplusC4D GWAS study (light blue), and the SNPs tested in our eQTL analyses in each condition (A: brown, B: blue, C: coral, D: red). All tested SNPs within a 1 Mb region around the dynamic eQTL SNP on chromosome 14 are shown.
Figure 7—figure supplement 1
Dynamic eQTLs associate with SNPs and genes implicated in complex disease.
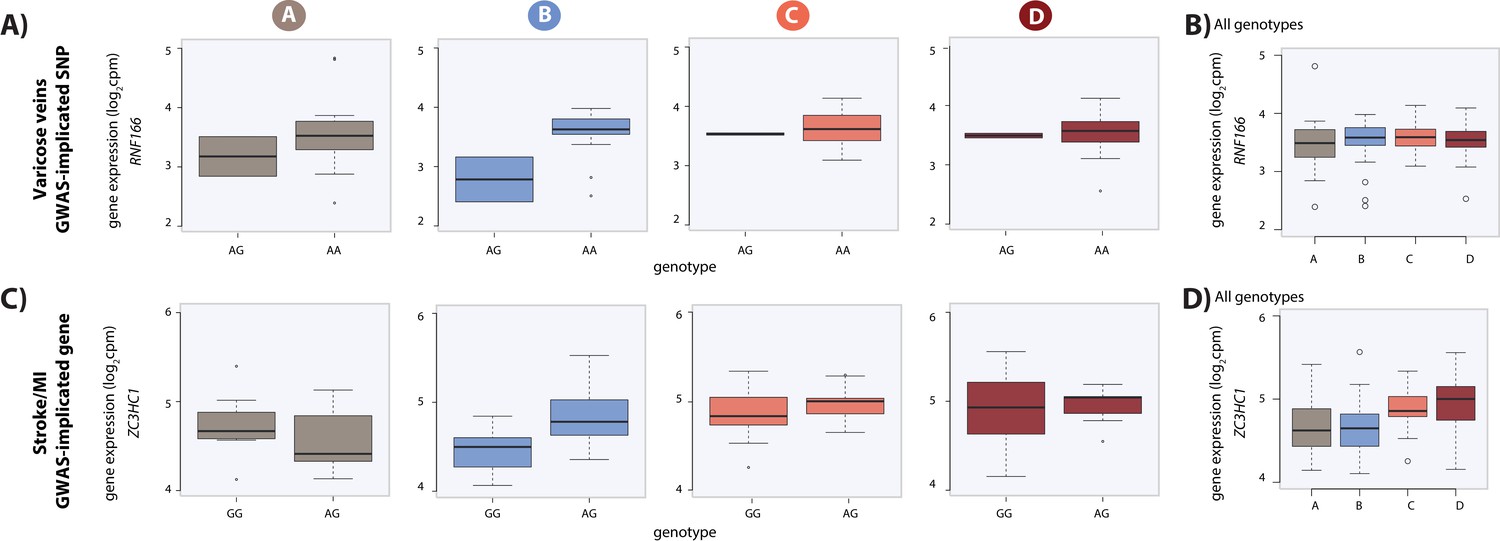
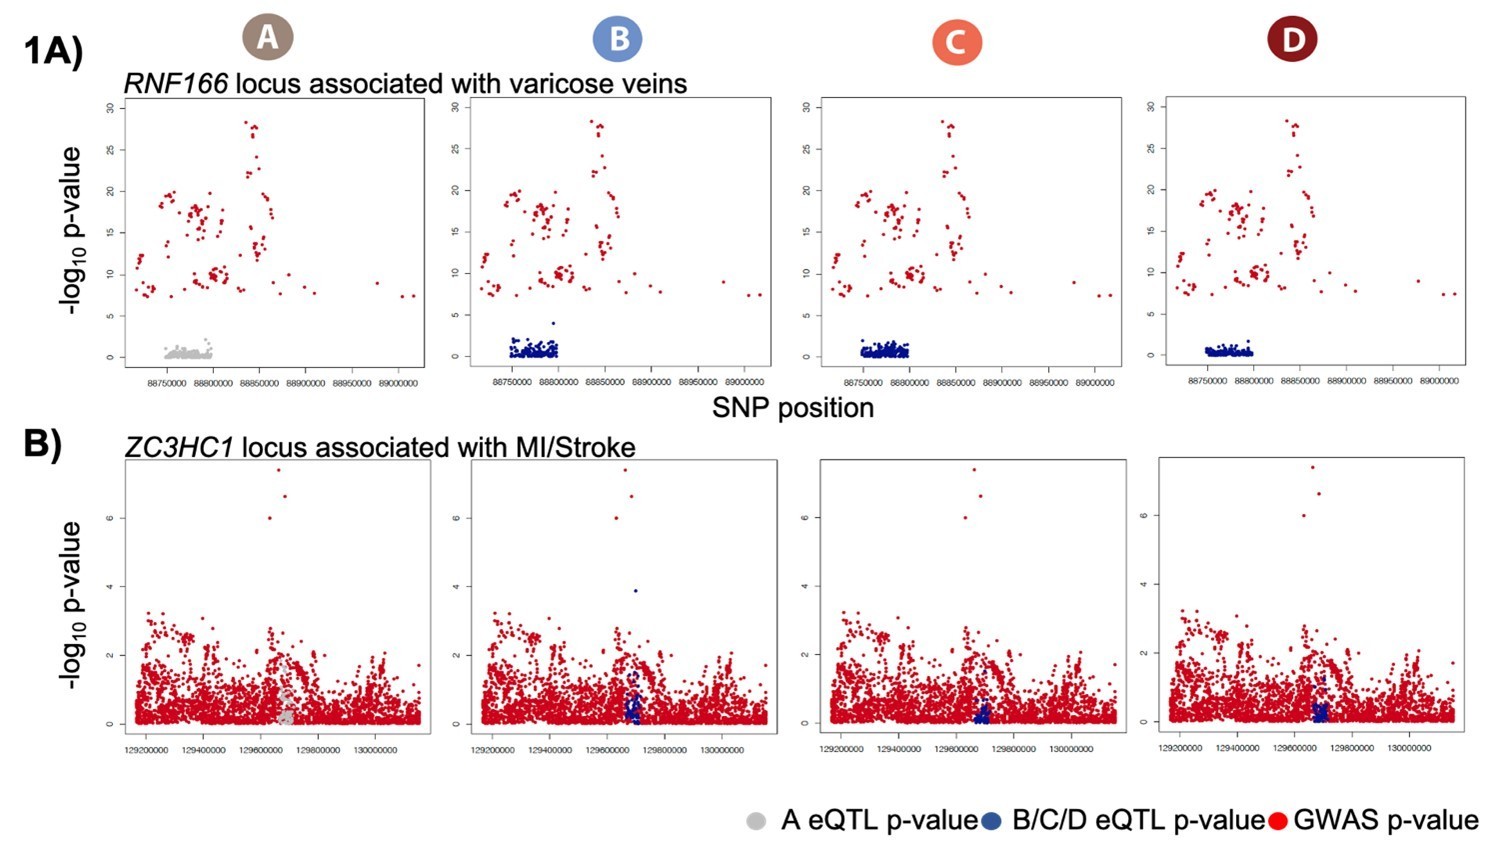
(A) Example of a GWAS-implicated SNP that is also a dynamic eQTL SNP. RNF166 is a dynamic eGene and the associated SNP is implicated in the presence of varicose veins. RNF166 expression levels are stratified by genotype in each condition. (B) Expression levels of RNF166 during the course of the experiment following aggregation of all individuals. (C) Example of a stroke and myocardial infarction (MI) GWAS-implicated gene that is also a dynamic eGene (ZC3HC1). (D) Expression levels of ZC3HC1 during the course of the experiment following aggregation of all individuals.
Figure 7—figure supplement 2

EIF2B2 eSNP is in high LD with the lead GWAS variant associated with CAD at this locus.
All tested SNPs within 5 kb of the EIF2B2 eSNP (rs12588981; green) are displayed along the x-axis of the LD matrix and all GWAS variants tested for association with CAD within 5 kb of the lead GWAS variant (rs3832966; purple) are displayed on the y-axis. Each square below the diagonal represents the R2 measure of LD (with darker red representing a higher value) and squares above the diagonal representing D' (darker blue representing a higher value). Genes within the locus are displayed in the lower panel.
Figure 7—figure supplement 3
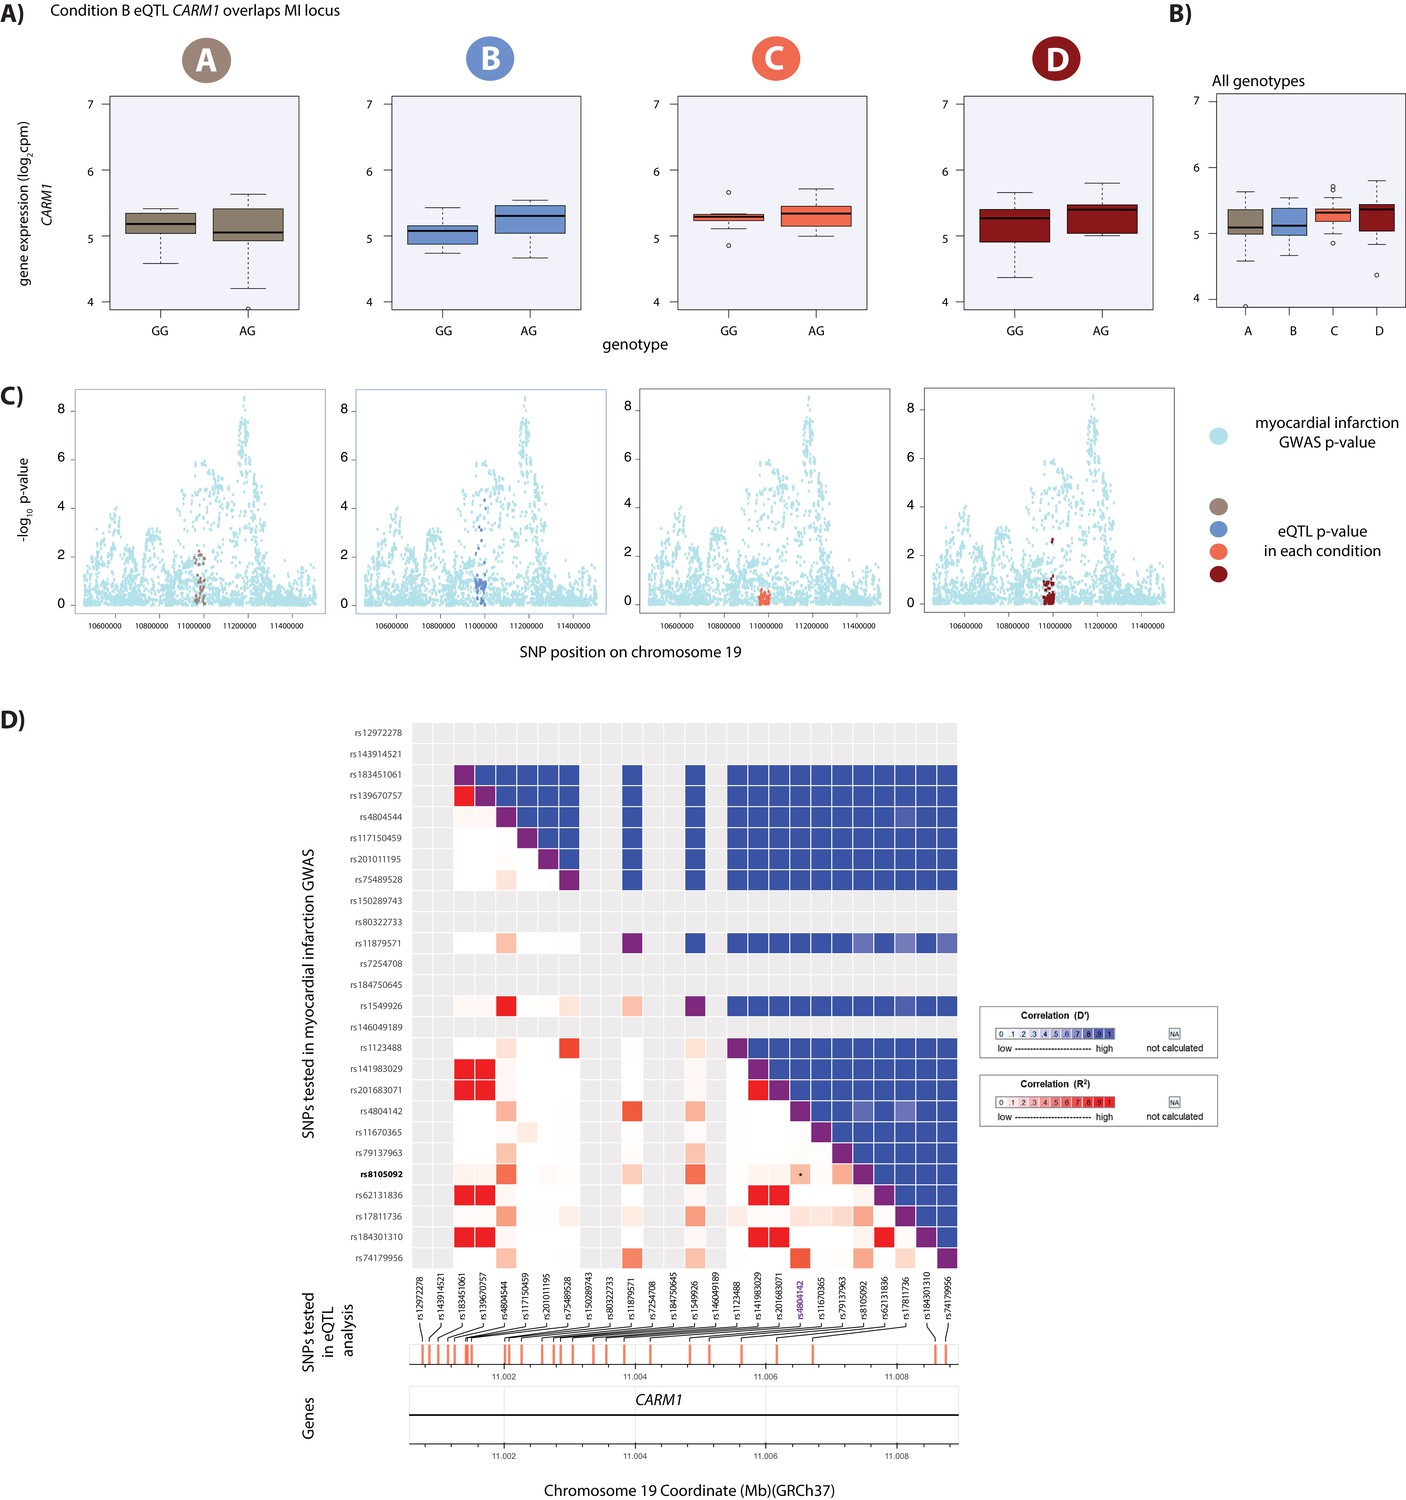
Hypoxic eQTL CARM1 associates with MI.
(A) CARM1 is an eGene in hypoxic condition B. (B) Expression levels of CARM1 during the course of the experiment following aggregation of all individuals. (C) Locus zoom plots in each condition illustrating the tested SNPs in the CARDIoGRAMplusC4D GWAS study (light blue), and the SNPs tested in our eQTLs analyses in each condition (A: brown, B: blue, C: coral, D: red). All tested SNPs within a 1 Mb region around the dynamic eQTL SNP on chromosome 19 are shown. (D) All tested SNPs within 5 kb of the lead MI GWAS variant (rs4804142; purple) are displayed on the x-axis of the LD matrix and all tested SNPs within 5 kb of the CARM1 eSNP (rs8105092; green) are displayed on the y-axis. Each square below the diagonal represents the R2 measure of LD (with darker red representing a higher value) and squares above the diagonal representing D' (darker blue representing a higher value). The locus falls within an intron of the CARM1 gene.
Figure 7—figure supplement 4
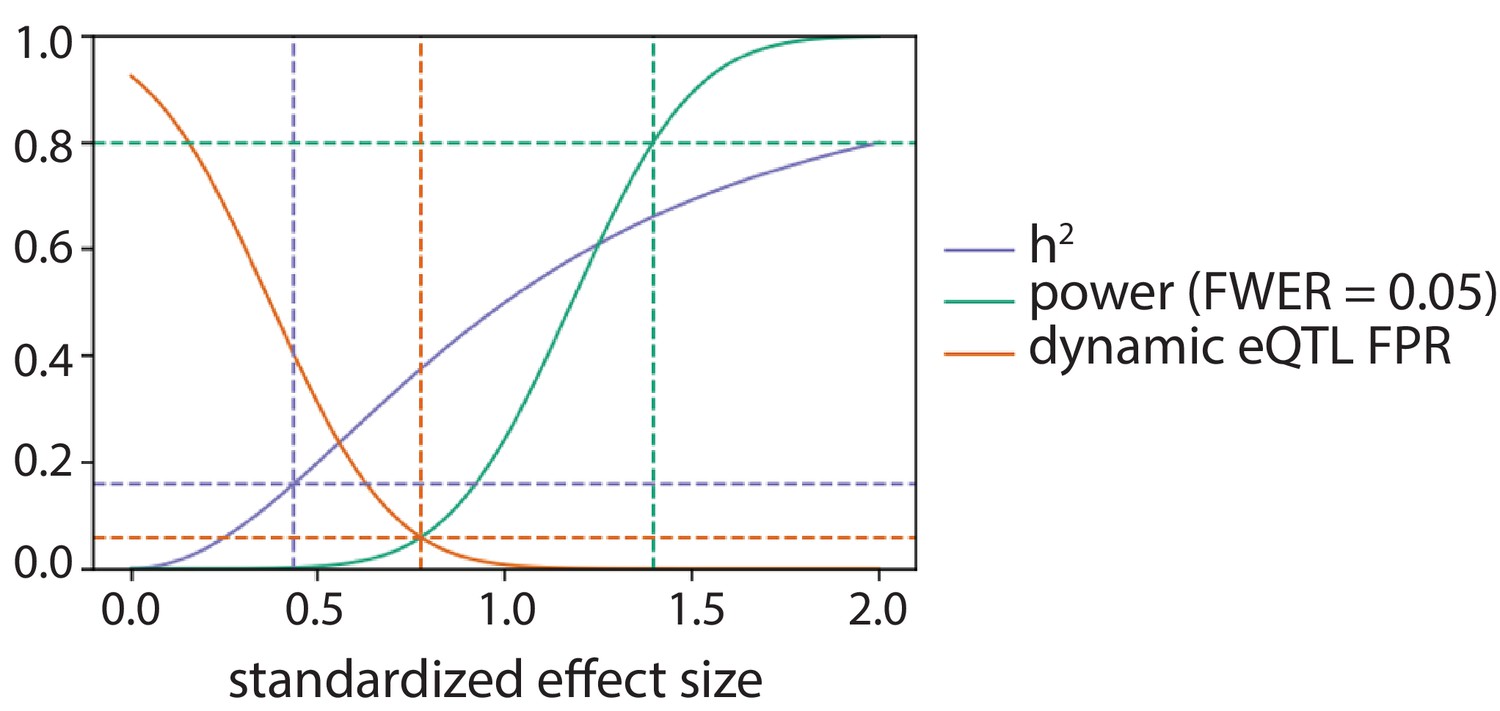
Power to detect eQTLs and false positive rate to call dynamic eQTLs.
As a function of standardized effect size: the power of this study to detect an eQTL in one condition after Bonferroni correction at level 0.05 (green), the phenotypic variance explained assuming a single causal variant (h2; purple), and the false positive rate (FPR; orange) to call a dynamic eQTL assuming the true effect size is equal in all four conditions. The green dotted lines denote the effect size this study has 80% power to detect in one condition. The purple dotted lines denote the effect size corresponding to the median cis-heritability of gene expression (h2 = 0.16; Gusev et al., 2016; Wheeler et al., 2016). The orange dotted lines denote the effect size for which the power to detect a QTL in one condition is equal to the FPR to call a dynamic eQTL.
Author response image 1
Tables
Key resources table
| Reagent type (species) or resource | Designation | Source or reference | Identifiers | Additional information |
|---|---|---|---|---|
| Cell line (H. sapiens, Female) | 18499 iPSC | 10.1101/gr.224436.117 | Derived from HapMap Yoruba LCL | |
| Cell line (H. sapiens, Female) | 18505 iPSC | 10.1101/gr.224436.117 | Derived from HapMap Yoruba LCL | |
| Cell line (H. sapiens, Female) | 18511 iPSC | 10.1101/gr.224436.117 | Derived from HapMap Yoruba LCL | |
| Cell line (H. sapiens, Female) | 18520 iPSC | 10.1101/gr.224436.117 | Derived from HapMap Yoruba LCL | |
| Cell line (H. sapiens, Female) | 18852 iPSC | 10.1101/gr.224436.117 | Derived from HapMap Yoruba LCL | |
| Cell line (H. sapiens, Female) | 18855 iPSC | 10.1101/gr.224436.117 | Derived from HapMap Yoruba LCL | |
| Cell line (H. sapiens, Female) | 18858 iPSC | 10.1101/gr.224436.117 | Derived from HapMap Yoruba LCL | |
| Cell line (H. sapiens, Female) | 18870 iPSC | 10.1101/gr.224436.117 | Derived from HapMap Yoruba LCL | |
| Cell line (H. sapiens, Female) | 18912 iPSC | 10.1101/gr.224436.117 | Derived from HapMap Yoruba LCL | |
| Cell line (H. sapiens, Male) | 19098 iPSC | 10.1101/gr.224436.117 | Derived from HapMap Yoruba LCL | |
| Cell line (H. sapiens, Male) | 19101 iPSC | 10.1101/gr.224436.117 | Derived from HapMap Yoruba LCL | |
| Cell line (H. sapiens, Female) | 19108 iPSC | 10.1101/gr.224436.117 | Derived from HapMap Yoruba LCL | |
| Cell line (H. sapiens, Female) | 19116 iPSC | 10.1101/gr.224436.117 | Derived from HapMap Yoruba LCL | |
| Cell line (H. sapiens, Female) | 19128 iPSC | 10.1101/gr.224436.117 | Derived from HapMap Yoruba LCL | |
| Cell line (H. sapiens, Female) | 19160 iPSC | 10.1101/gr.224436.117 | Derived from HapMap Yoruba LCL |
Additional files
-
Supplementary file 1
Document containing tables listing experimental batches, cardiomyocyte purity, oxygen levels, RIN scores, sequencing read numbers, identified response genes, eGenes in A, B, C, D, dynamic eGenes, DARs, caQTLs in A, B, C, D, dynamic caQTLs, DMCpGs and GWAS trait overlaps.
- https://cdn.elifesciences.org/articles/57345/elife-57345-supp1-v2.xlsx
-
Supplementary file 2
Document containing the output of the CHT test to identify eQTLs in each condition.
Values associated with the most significant SNP-gene association are included.
- https://cdn.elifesciences.org/articles/57345/elife-57345-supp2-v2.xlsx
-
Transparent reporting form
- https://cdn.elifesciences.org/articles/57345/elife-57345-transrepform-v2.pdf
Download links
A two-part list of links to download the article, or parts of the article, in various formats.
Downloads (link to download the article as PDF)
Open citations (links to open the citations from this article in various online reference manager services)
Cite this article (links to download the citations from this article in formats compatible with various reference manager tools)
Dynamic effects of genetic variation on gene expression revealed following hypoxic stress in cardiomyocytes
eLife 10:e57345.
https://doi.org/10.7554/eLife.57345


