Alzheimer’s disease risk gene BIN1 induces Tau-dependent network hyperexcitability
- Center for Neurodegeneration and Experimental Therapeutics, Alzheimer’s Disease Center, and Evelyn F. McKnight Brain Institute, Departments of Neurology and Neurobiology, University of Alabama at Birmingham, United States
- Department of Neurobiology, University of Alabama at Birmingham, United States
- Department of Cell, Developmental and Integrative Biology, University of Alabama at Birmingham, United States
Figures
Figure 1
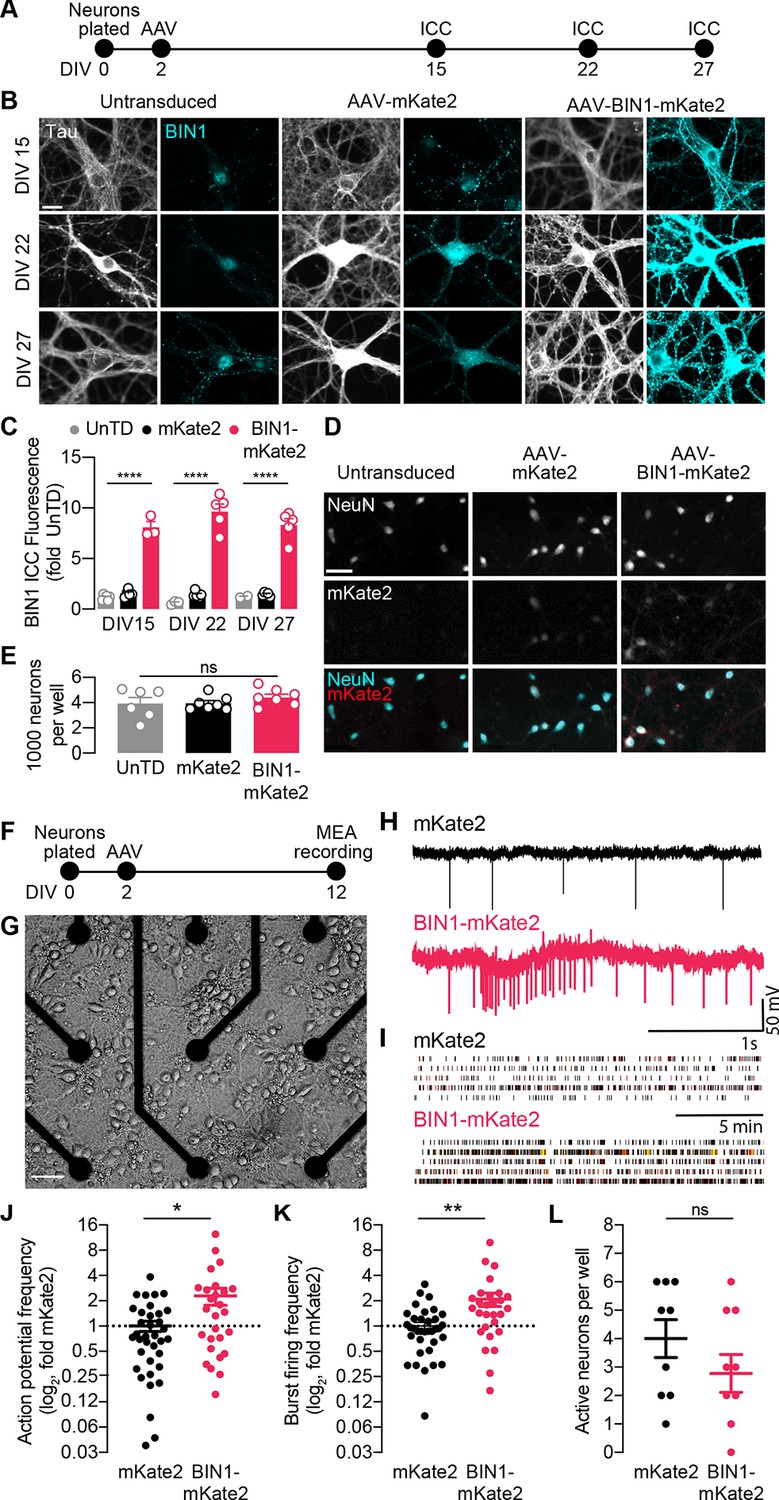
BIN1 increases action potential and burst frequency in primary hippocampal neurons cultured on microelectrode arrays (MEAs).
(A) ICC experimental timeline: neurons were plated on day in vitro (DIV) 0, virally transduced on DIV 2, and immunostained at DIV 15, DIV 22, or DIV 27. (B) Representative images of primary hippocampal cultures: untransduced (left), AAV-mKate2 (center), or AAV-BIN1-mKate2 (right), showing Tau and BIN1 immunostaining at DIV 15 (top), DIV 22 (middle), or DIV 27 (bottom). Scale bar = 20 µm. (C) AAV-BIN1-mKate2 increased BIN1 levels ~ 8–9-fold in BIN1 group compared to BIN1 levels in untransduced or mKate2 groups (n = 2–6 fields of view per coverslip, 60x magnification, two-way ANOVA, BIN-DIV interaction p=0.1123, main effect of AAV-BIN1-mKate2 ****p<0.0001, main effect of DIV p=0.6373, Tukey’s multiple comparisons test: DIV 15:UnTD vs. DIV 15:AAV-BIN1-mKate2, ****p<0.0001, DIV 22:UnTD vs. DIV 22:AAV-BIN1-mKate2, ****p<0.0001, DIV 27:UnTD vs. DIV 27:AAV-BIN1-mKate2, ****p<0.0001. (D) Representative images of primary hippocampal cultures at DIV 12: untransduced (left), AAV-mKate2 (center), or AAV-BIN1-mKate2 (right), showing NeuN immunostaining (top), mKate2 fluorescence (middle), or merge of both (bottom). Scale bar = 25 µm. (E) The total number of neurons per well did not change between untransduced, mKate2, or BIN1 groups (n = 6–7 coverslips, 10 × 10 fields of view per coverslip, 20x magnification, from two different primary neuron harvests, one-way ANOVA, p=0.5157). (F) MEA experimental timeline: neurons were plated on day in vitro (DIV) 0, virally transduced on DIV 2, and recorded on DIV 12. (G) Primary neuronal hippocampal cultures grown on an MEA plate. Scale bar = 50 µm. (H) Representative local field potential (LFP) traces. (I) Representative raster plots of firing activity from five different neurons per group. (J) BIN1 increased action potential frequency (n = 27–36 neurons per group from three different primary neuron harvests, normalized to the controls from each harvest, median frequency in controls = 388 mHz; unpaired Mann-Whitney U test; p=0.0233). (K) BIN1 increased burst firing frequency (n = 27–36 neurons per group from three different primary neuron harvests, normalized to the controls from each harvest, median frequency in controls = 11.7 mHz; unpaired Mann-Whitney U test; p=0.0020). (L) The total number of active neurons per well did not differ between mKate2 and BIN1 expressing groups (n = 9 MEA plates for each group from three different primary neuron harvests, unpaired Student’s t test; p=0.346). All data are expressed as mean ± SEM, *p<0.05, **p<0.01, and ****p<0.0001. All data are expressed as mean ± SEM.
Figure 2
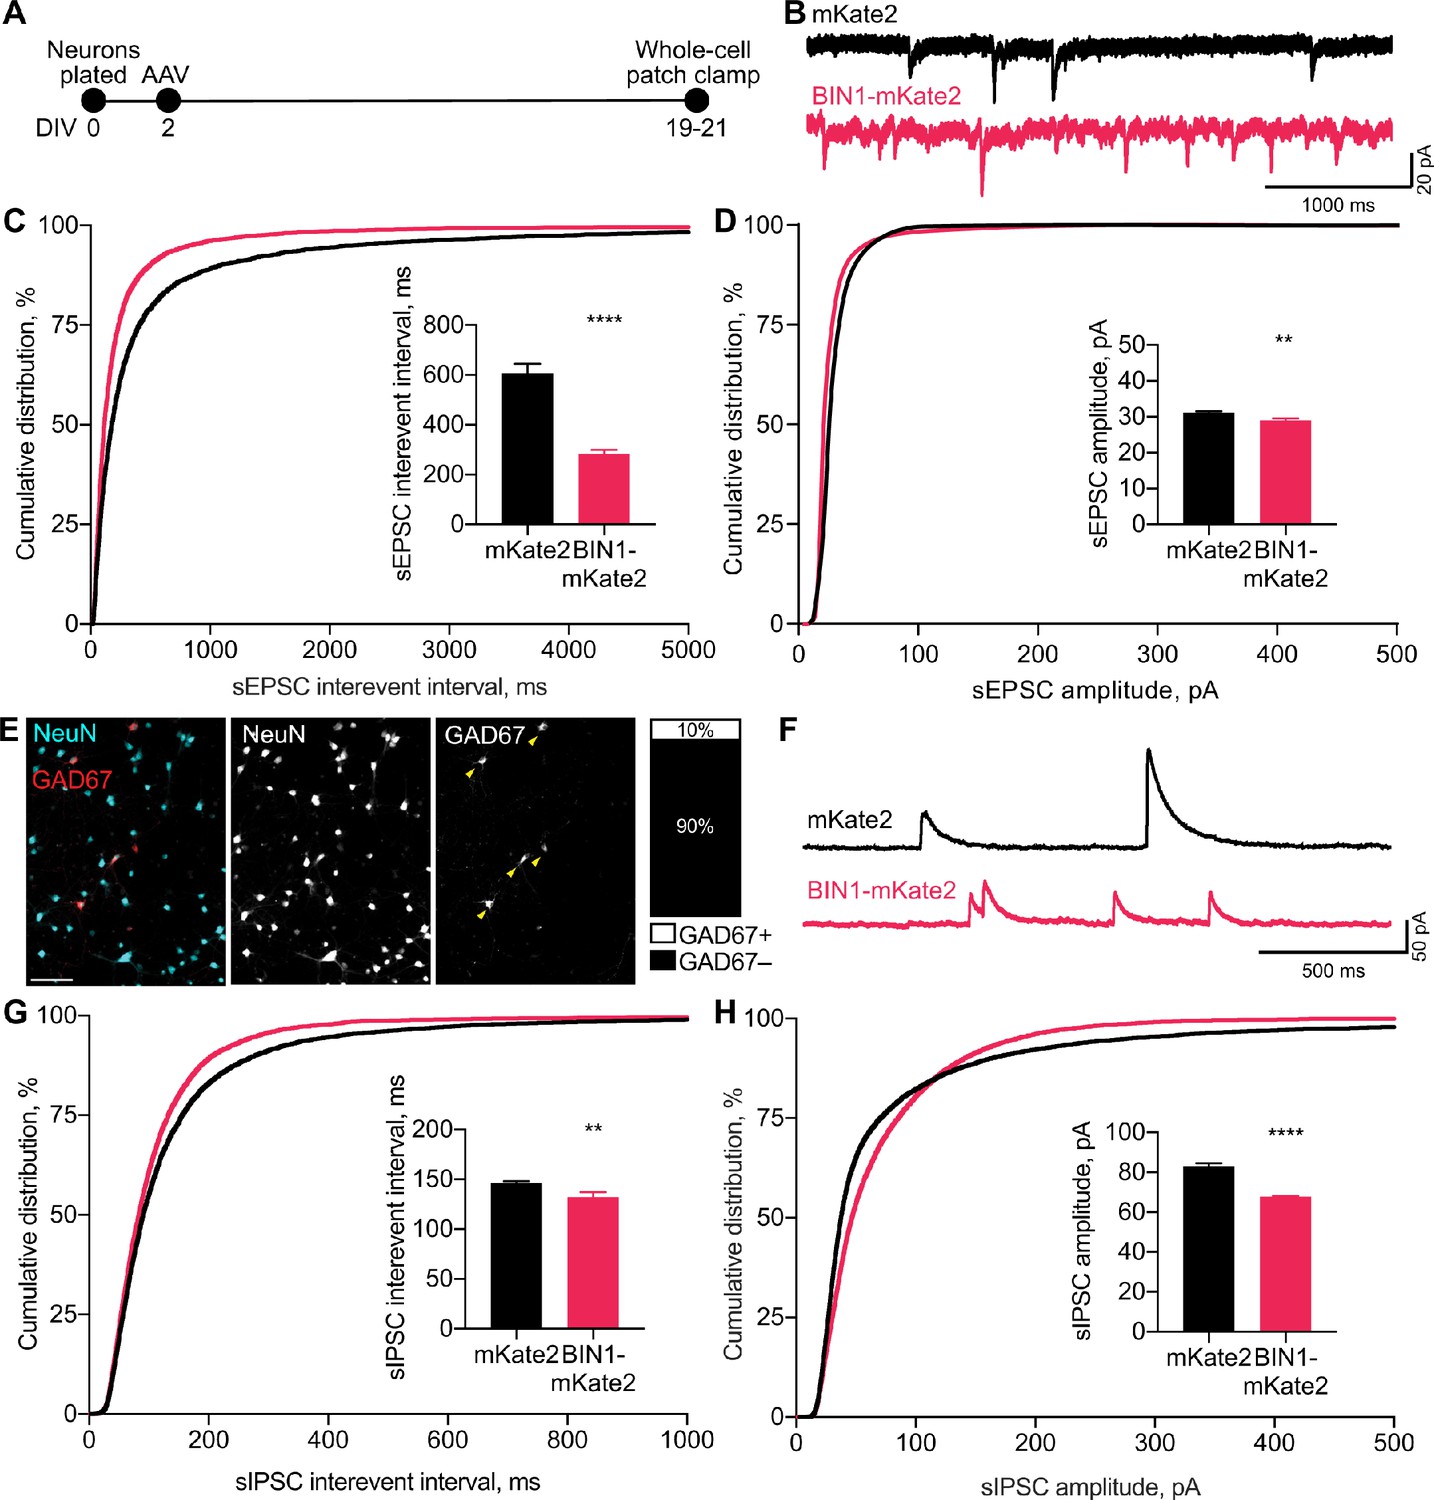
BIN1 increases both excitatory and inhibitory synaptic transmission.
(A) Synaptic transmission recordings experimental timeline: neurons were plated on DIV 0, virally transduced on DIV 2, electrophysiologically recorded on DIV 19–21. (B) Representative traces of sEPSCs recorded from neurons transduced with mKate2 or BIN1. (C) BIN1 decreased mean sEPSC interevent interval (Kolmogorov-Smirnov test on cumulative distribution, ****p<0.0001, KS D score: 0.1657; unpaired two-tailed Student’s t-test on mean IEI, ****p<0.0001). (D) BIN1 slightly decreased mean sEPSC amplitude unpaired (Kolmogorov-Smirnov test on cumulative distribution, ****p<0.0001, KS D score: 0.1803; unpaired two-tailed Student’s t-test on mean amplitude, ***p=0.0004) (n = 12–21 neurons per group from three different primary neuron harvests). (E) Representative images and quantification of NeuN and GAD67+ neurons in primary hippocampal cultures at DIV 12 (n = 255 GAD67+ neurons, n = 2342 NeuN+ neurons, from 10 randomly taken images per coverslip, 10 coverslips from two different primary neuron harvests.) Scale bar = 100 µm. (F) Representative traces of sIPSCs recorded from neurons transduced with mKate2 or BIN1. (G) BIN1 decreased mean sIPSC interevent interval (Kolmogorov-Smirnov test on cumulative distribution, ****p<0.0001, KS D score: 0.06862; unpaired two-tailed Student’s t-test on mean IEI, **p=0.0035) (H) BIN1 decreased mean sIPSC amplitude (Kolmogorov-Smirnov test on cumulative distribution, ****p<0.0001, KS D score: 0.1297; unpaired two-tailed Student’s t-test on mean amplitude, ****p<0.0001) (n = 11–16 neurons per group from three different primary neuron harvests). All data are expressed as mean ± SEM.
Figure 3
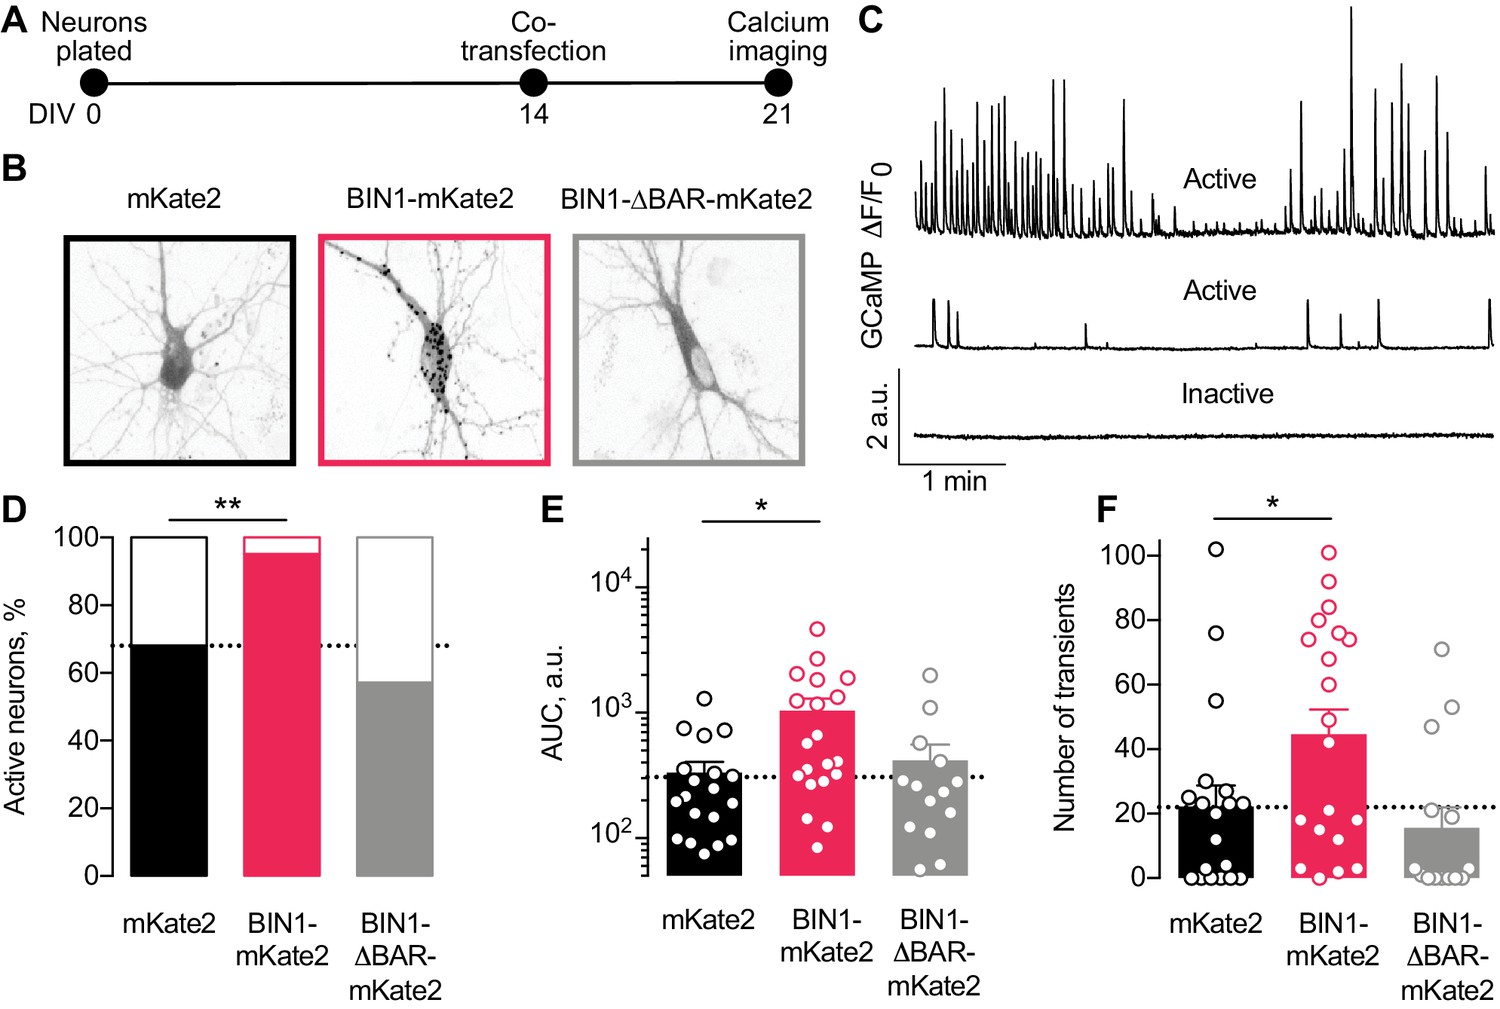
Higher BIN1 levels in mature neurons increase calcium influx in primary hippocampal neuronal cultures.
(A) Calcium imaging experimental timeline: neurons were plated on DIV 0, co-transfected on DIV 14 with GCaMP6f calcium indicator and either BIN1-mKate2, BIN1-ΔBAR-mKate2, or mKate2 control construct, and recorded on DIV 21. n = 14–20 neurons per condition. (B) mKate2 fluorescence in primary transfected primary hippocampal neurons. BIN1-mKate2 fluorescence was punctate in transfected neurons. mKate2 and BIN-BAR-mKate2 fluorescence was diffuse and filled the neuron. (C) GCaMP fluorescence intensity, F, relative to the quiescent period between transients, F0. Neurons were classified as either active (with a range of activity levels indicated by the top and middle traces) or inactive (no calcium transients during the 8 min recording, bottom trace). (D) BIN1, but not BIN1-ΔBAR, increased the proportion of active neurons (Binomial test, **p=0.0071). (E) BIN1, but not BIN1-ΔBAR, increased neuronal calcium influx measured as area under the curve (AUC; one-way ANOVA, p=0.0134; Dunnett’s posthoc, *p=0.0122). (F) BIN1, but not BIN1-ΔBAR, increased the number of calcium transients (one-way ANOVA, p=0.0144; Dunnett’s posthoc, mKate2 vs BIN1-mKate2 adjusted *p=0.0437). All data are expressed as mean ± SEM.
Figure 4
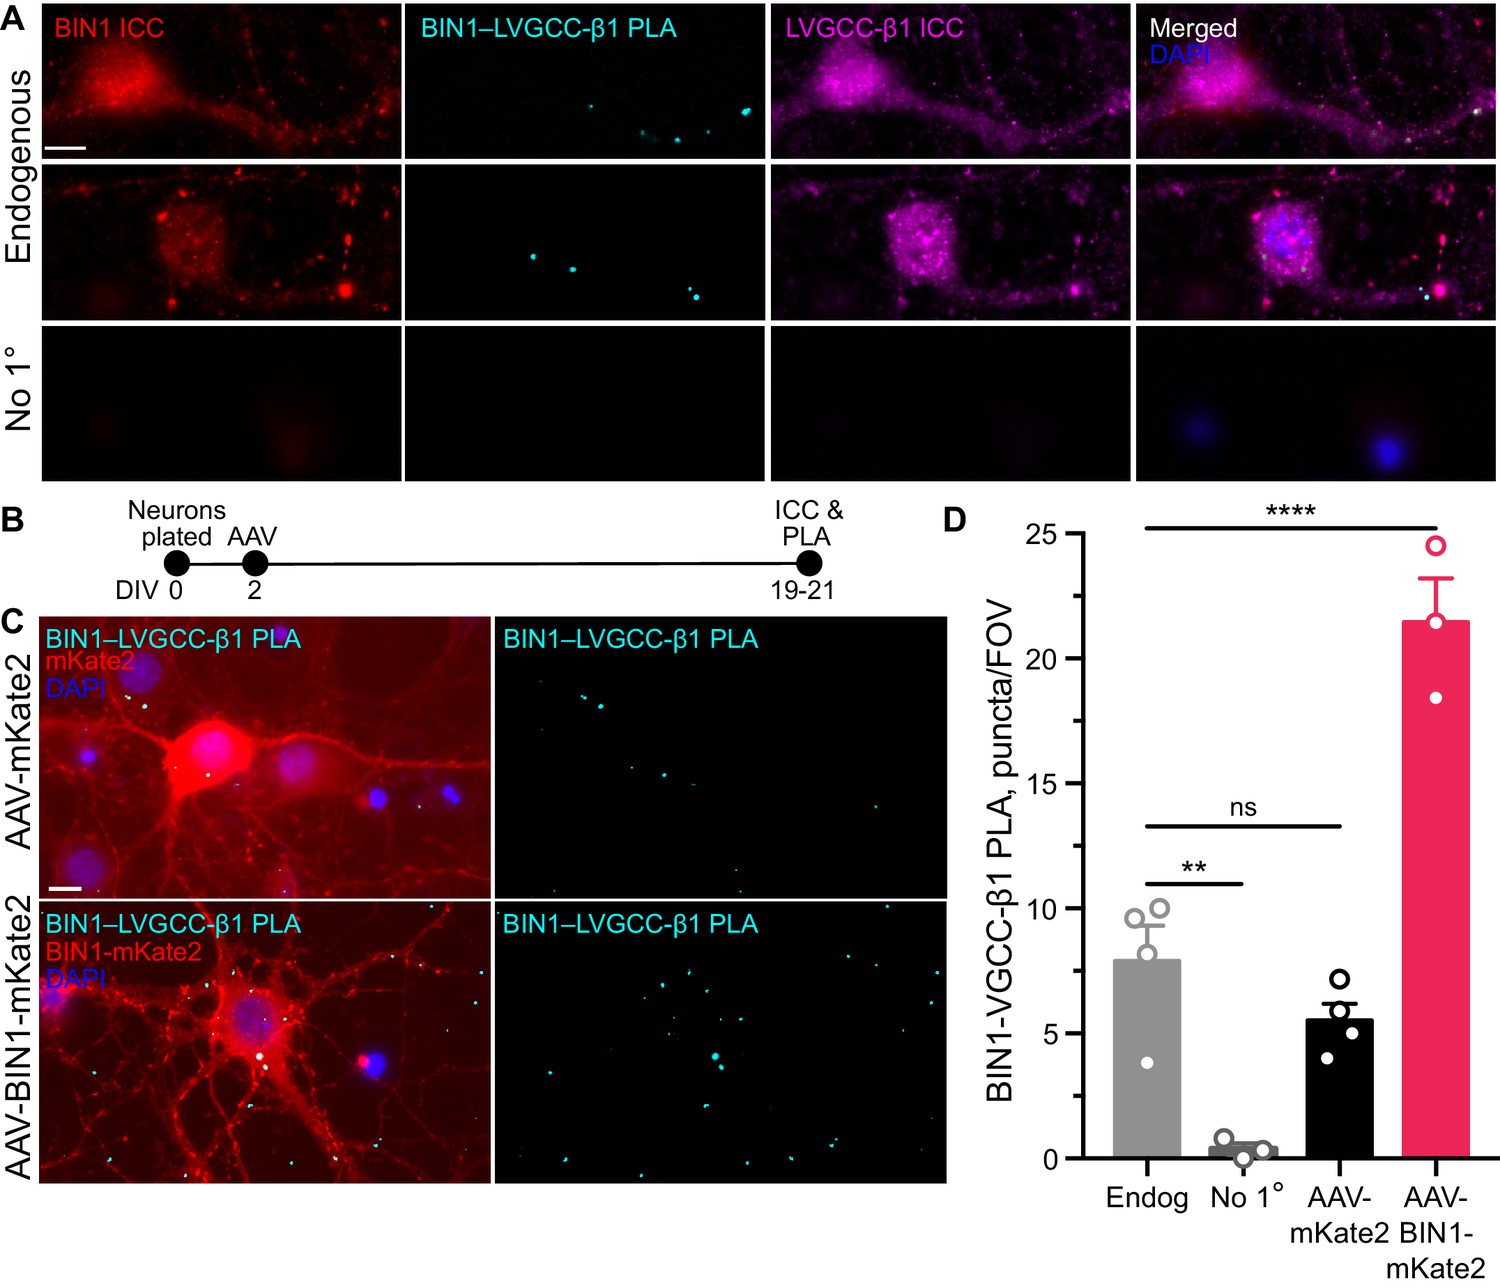
BIN1 interacts with LVGCC-β1 subunits in neurons.
(A) Localization of endogenous BIN1, LVGCC-β1, and endogenous BIN1-LVGCC-β1 interaction detected by PLA. Scale bar = 10 µm. (B) Experimental timeline: neurons were plated on DIV 0, transduced with AAV-BIN1-mKate2 or AAV-mKate2 on DIV 2, and fixed and stained on DIV 19–21. (C) Representative images of mKate2 fluorescence, BIN1–LVGCC-β1 PLA puncta, and BIN1 ICC in primary hippocampal neurons. Scale bar = 10 µm. (D) BIN1–LVGCC-β1 interaction was increased by BIN1 (n = 3–4 coverslips per group, each with 5 fields of view averaged, from three different primary neurons harvests; one-way ANOVA, p<0.0001; Endogenous vs. AAV-BIN1-mKate2 ****p=0.0001 by Dunnett’s post-hoc). All data are expressed as mean ± SEM.
Figure 5
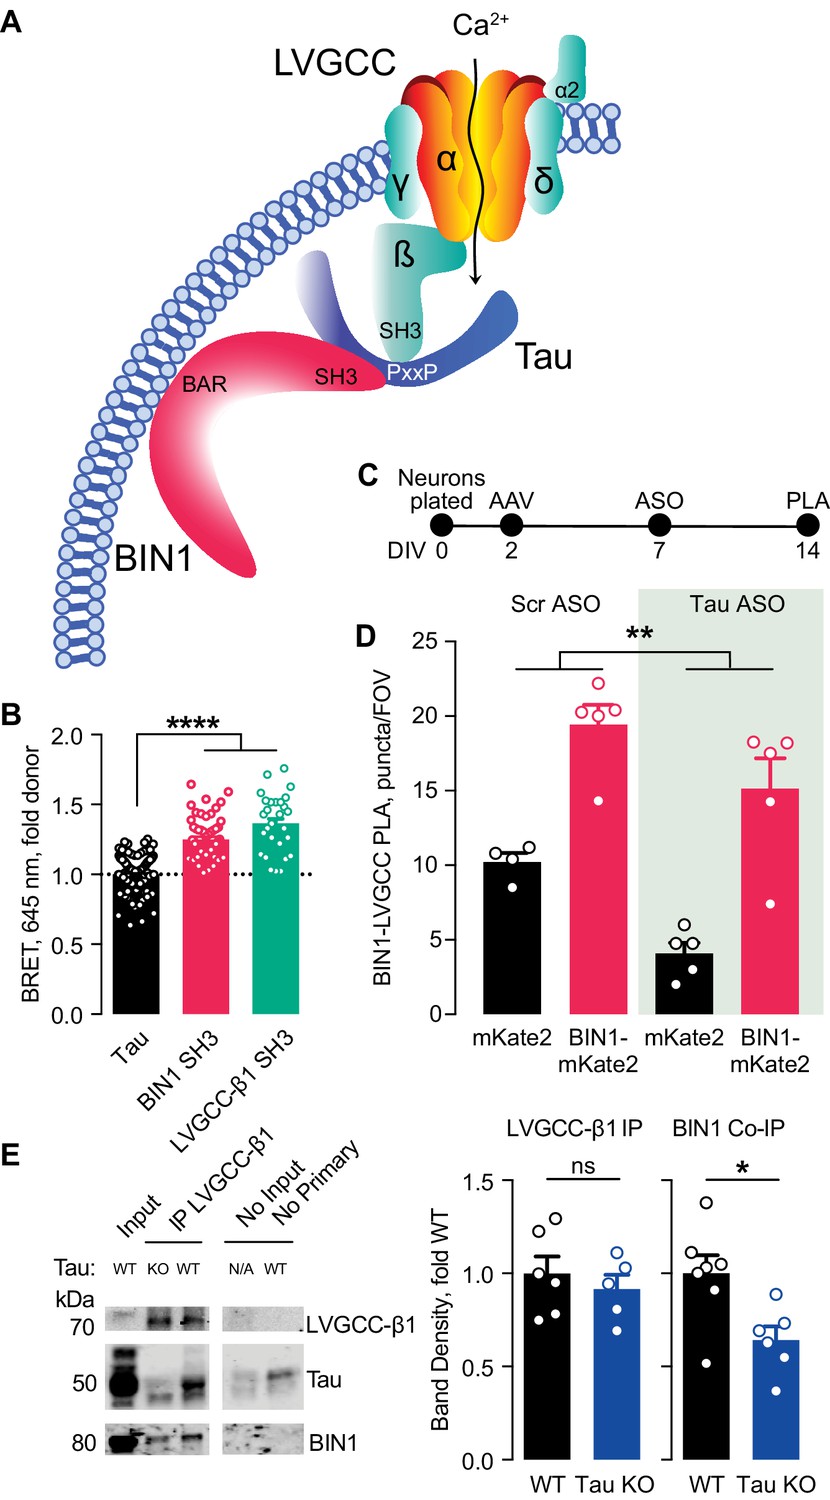
Tau-dependent BIN1–LVGCC interaction.
(A) Model of Tau-dependent BIN1–LVGCC interaction. BIN1’s BAR domain localizes BIN1 to the plasma membrane, and PxxP motifs in Tau’s central proline-rich domain interact with the SH3 domains of BIN1 and LVGCC- β1. (B) Tau interacts with both BIN1 and LVGCC-β1 SH3 domains detected by bioluminescence resonance energy transfer (BRET) (n = 28–164 wells, one-way ANOVA, ****p<0.0001). (C) Experimental timeline of BIN1–LVGCC-β1 PLA: neurons were plated on DIV 0, transduced with AAV-BIN1-mKate2 or AAV-mKate2 on DIV 2, treated with Tau or scrambled ASO on DIV 7, and stained on DIV 14. (D) AAV-BIN1-mKate2 increased BIN1-LVGCC-β1 interaction, while Tau reduction with Tau ASO decreased BIN1–LVGCC-β1 interactions (n = 4–6 coverslips per group representing an average of 4–5 fields of view (FOV) per coverslip from three different neuronal harvests; Two-way ANOVA, main effect of Tau ASO **p=0.0018, main effect of AAV-BIN1-mKate2 ****p<0.0001). (E) We immunoprecipitated LVGCC-β1 followed by western blotting for LVGCC-β1, Tau, and BIN1 from cortical homogenates of wild-type and Tau KO mice. The amount of LVGCC-β1 immunoprecipitated did not differ between wild-type and Tau KO brains (n = 5–6 mice, 3.56 ± 0.04 months old, unpaired Student’s t test; p=0.5105). However, the amount of BIN1 co-immunoprecipitated with LVGCC-β1 was decreased in Tau KO brains compared to wild-type litter mate controls (n = 5–6 mice, unpaired Student’s t test; *p=0.0157). All data are expressed as mean ± SEM.
Figure 6

Tau reduction prevents network hyperexcitability induced by BIN1.
(A) MEA experimental timeline: neurons were plated on DIV 0, virally transduced on DIV 2, treated with Tau or scrambled ASO on DIV 5, and electrophysiologically recorded on DIV 12. (B) The number of active neurons was not different between groups (n = 6–8 coverslips per group from three different neuronal harvests; two-way ANOVA, main effect of Tau ASO p=0.9140, main effect of AAV-BIN1-mKate2 p=0.9026, interaction p=0.1101). (C) Representative LFP traces of MEA recordings. (D) Representative raster plots of MEA recordings. (E) Tau reduction prevented BIN1-induced network hyperexcitability as measured by mean action potential frequency (n = 159–230 neurons from 6 to 8 wells per group from three different neuronal harvests; two-way ANOVA, BIN-Tau interaction **p=0.0073, main effect of Tau ASO p=0.0761, main effect of AAV-BIN1-mKate2 *p=0.0130, Sidak’s multiple comparisons test: UnTd:Scr ASO vs. BIN1-mKate2:Scr ASO ***p=0.0010). (F) Cumulative distribution of the mean action potential frequency (Kolmogorov-Smirnov test on cumulative distribution, UnTD-Scr ASO vs. BIN1-mKate2-Scr ASO **p=0.0028). (G) Tau reduction prevented BIN1-induced network hyperexcitability as measured by mean burst frequency (n = 159–230 neurons from 6 to 8 wells per group from three different neuronal harvests; two-way ANOVA, BIN-Tau interaction ***p=0.0005, main effect of Tau ASO **p=0.0066, main effect of AAV-BIN1-mKate2 p=0.2286, Sidak’s multiple comparisons test: UnTd:Scr ASO vs. BIN1-mKate2:Scr ASO *p=0.0227). (H) Cumulative distribution of the burst frequency (Kolmogorov-Smirnov test on cumulative distribution, UnTD-Scr ASO vs. BIN1-mKate2-Scr ASO, p=0.1107). All data are expressed as mean ± SEM.
Tables
Table 1
Resting membrane potential (RMP) and input resistance (Rin) in patched hippocampal neurons did not differ across untransduced, AAV-mKate2, and AAV-BIN1-mKate2 groups.
| RMP, mV | Rin, MΩ | N, Cells | |
|---|---|---|---|
| Untransduced | –60.43 ± 5.36 | 843.04 ± 55.11 | 4 |
| AAV-mKate2 | –59.90 ± 3.70 | 834.83 ± 41.09 | 6 |
| AAV-BIN1-mKate2 | –62.40 ± 2.24 | 790.18 ± 15.74 | 7 |
| One-way ANOVA, p | 0.85 | 0.36 |
Key resources table
| Reagent type (species) or resource | Designation | Source or reference | Identifiers | Additional information |
|---|---|---|---|---|
| Gene (Homo sapiens) | BIN1 | NCBI | Gene ID 274 | |
| Antibody | Anti-NeuN Rabbit polyclonal | abcam | Cat# ab104225; RRID:AB_10711153 | ICC (1:500), Lot #GR3321966-1 |
| Antibody | Anti-GAD67 Mouse monoclonal | Millipore Sigma | Cat# MAB5406; RRID:AB_2278725 | ICC (1:500), Lot #3015328 |
| Antibody | Anti-BIN1 Rabbit polyclonal | Santa Cruz | Cat# sc-30099; RRID:AB_2243399 | ICC/PLA/IP (1:500), Lot #K1605; H-100 |
| Antibody | Anti-LVGCC-β1 Mouse monoclonal | abcam | Cat# ab85020; RRID:AB_1861569 | ICC/PLA/IP (1:1000), Lot #413-8RR-52 |
| Antibody | Anti-Tau Rabbit polyclonal | DAKO | Cat# A0024; RRID:AB_10013724 | ICC/IP (1:1000), Lot #20031827 |
| Antibody | Anti-BIN1 Mouse monoclonal | Santa Cruz | Cat# sc-13575; RRID:AB_626753 | ICC/IP (1:1000), Lot #L3014; 99D |
| Cell line (Rattus norvegicus) | Primary neuron | Charles River | Fresh from E19 albino Sprague Dawley rats | |
| Genetic reagent | AAV-BIN1-mKate2 | UPenn Vector Core | AAV2 | |
| Genetic reagent | AAV-mKate2 | UPenn Vector Core | AAV2 | |
| Sequence-based reagent | Tau ASO | PMID:23904623 IDT | 5-ATCACTGATTTTGAAGTCCC-3 | |
| Sequence-based reagent | Scrambled ASO | PMID:23904623 IDT | 5-CCTTCCCTGAAGGTTCCTCC-3 | |
| Commercial assay, kit | Duolink PLA kit | Millipore Sigma | Cat#s DUO92014; DUO92002; DUO92004 | |
| Transfected construct | GCaMP6f | Addgene | RRID:Addgene_40755 | |
| Transfected construct | mKate2 | PMID:25156556 Evrogen | Cat# FP184 | Actin was removed from the construct obtained |
| Transfected construct (Homo sapiens) | BIN1 | Horizon Discovery ORFeome Collaboration Clones | OHS5894-202501160 | Isoform 1 |
| Cell line (Cricetulus griseus) | CHO-K1 | Millipore Sigma | Cat# 85051005-1VL | Chinese Hamster Ovary cell line |
| Transfected construct | mKate2-Tau-mKate2 | PMID:25156556 | ||
| Transfected construct | Fyn-SH3-CBG | PMID:25156556 | BIN1-SH3 or LVGCC-β1-SH3 was cloned in replacing Fyn-SH3 | |
| Transfected construct (Homo sapiens) | BIN1-SH3 | IDT | AAC28646.1 | Codon optimized |
| Transfected construct (Homo sapiens) | LVGCC-β1-SH3 | IDT | AAA35632.1 | Codon optimized |
Author response table 1
Calculated E/I ratios of spontaneous postsynaptic current frequencies and amplitudes.
| mKate2 Frequency, mean ±SEM | BIN1-mKate2 Frequency, mean ±SEM | mKate2 Amplitude, mean ±SEM | BIN1-mKate2 Amplitude, mean ±SEM | |
|---|---|---|---|---|
| sEPSCs | 1.65 ± 26.59 Hz | 3.53 ± 65.58 Hz | 31.15 ± 0.40 pA | 29.02 ± 0.53 pA |
| sIPSCs | 6.82 ± 37.61 Hz | 7.57 ± 15.25 Hz | 83.07 ± 1.49 pA | 67.73 ± 0.55 pA |
| E/I ratio | 0.24 ± 0.71 | 0.47 ± 4.30 | 0.37 ± 0.27 | 0.43 ± 0.97 |
Additional files
Download links
A two-part list of links to download the article, or parts of the article, in various formats.
Downloads (link to download the article as PDF)
Open citations (links to open the citations from this article in various online reference manager services)
Cite this article (links to download the citations from this article in formats compatible with various reference manager tools)
Alzheimer’s disease risk gene BIN1 induces Tau-dependent network hyperexcitability
eLife 9:e57354.
https://doi.org/10.7554/eLife.57354


