Met and Cxcr4 cooperate to protect skeletal muscle stem cells against inflammation-induced damage during regeneration
- Neurowissenschaftliches Forschungzentrum, NeuroCure Cluster of Excellence, Charité–Universitätsmedizin Berlin, Corporate Member of Freie Universität Berlin and Humboldt-Universität zu Berlin, Germany
- Developmental Biology/Signal Transduction Group, Max Delbrueck Center for Molecular Medicine (MDC) in the Helmholtz Society, Germany
- Department of Neuropediatrics, Charité–Universitätsmedizin Berlin, Corporate Member of Freie Universität Berlin and Humboldt-Universität zu Berlin, Germany
Figures
Figure 1 with 1 supplement
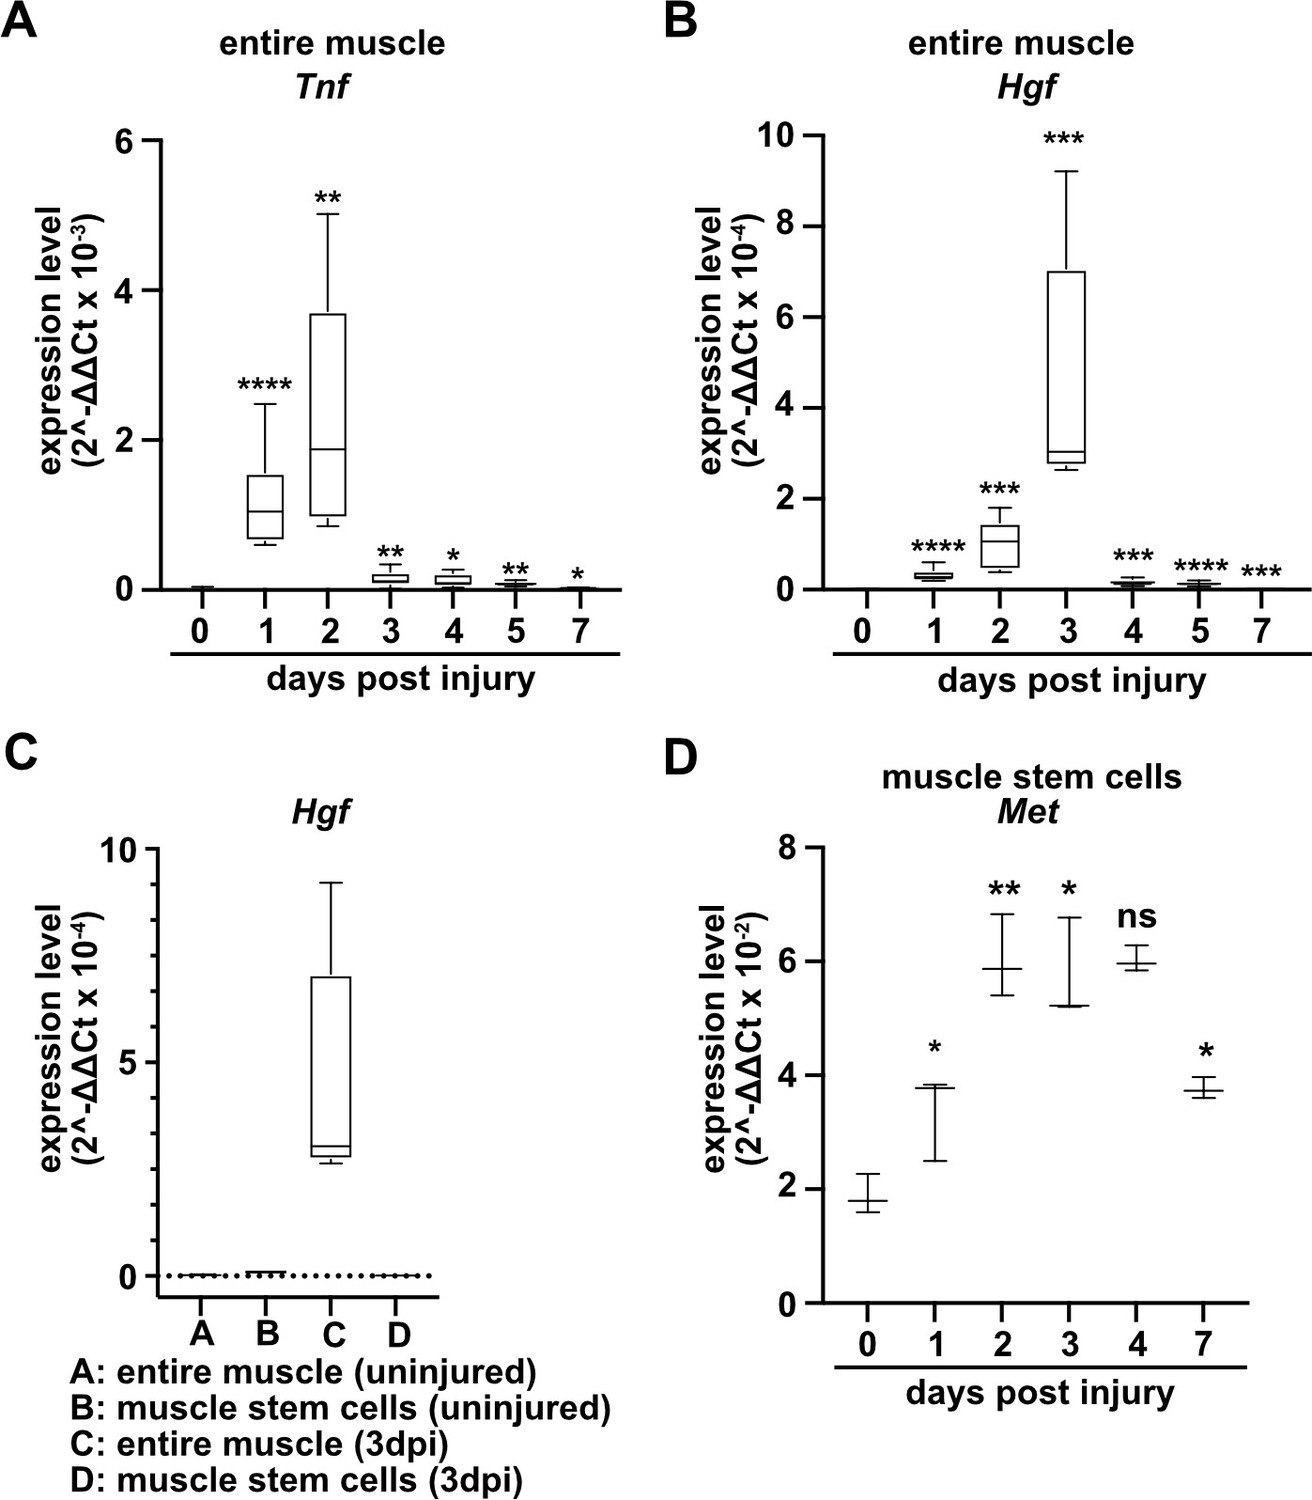
Expression of Tnf, Hgf, and Met during muscle regeneration.
(A, B) Expression dynamics of Tnf (A) and Hgf (B) in uninjured and regenerating muscle tissue determined by qPCR. (C) Expression dynamics of Hgf in quiescent and activated muscle stem cells and in muscle tissue during muscle regeneration determined by qPCR. (D) Expression levels of Met in quiescent and activated muscle stem cells determined by qPCR. Boxplots represent interquartile range, and whiskers show min-to-max range. β-Actin expression was used for normalization in (A–D).
-
Figure 1—source data 1
Quantification of Tnf, Hgf and Met expression represented in the diagrams shown in A-D.
- https://cdn.elifesciences.org/articles/57356/elife-57356-fig1-data1-v2.xlsx
Figure 1—figure supplement 1
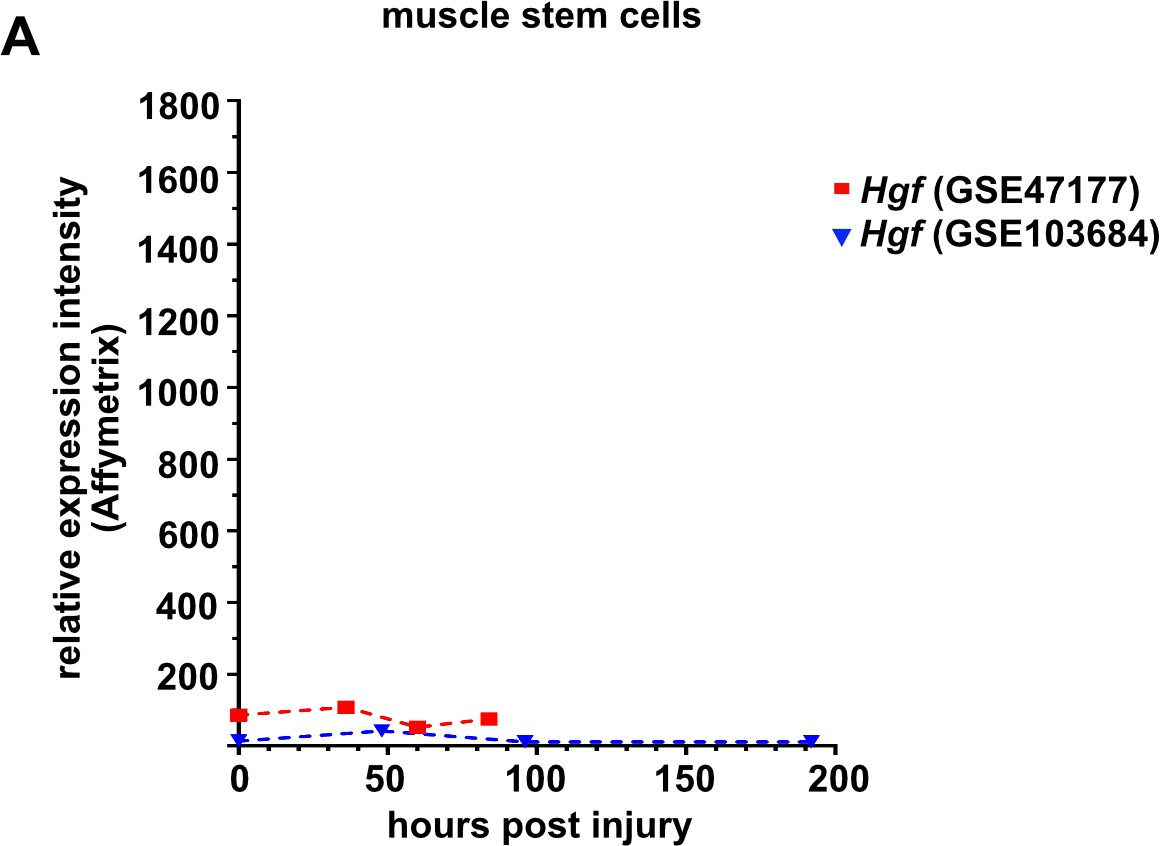
Expression levels of Hgf in quiescent (freshly isolated) and proliferating muscle stem cells at various time points defined by microarray analysis (Liu et al., 2013; Latroche et al., 2017).
The microarray data sets were obtained from the GEO Database under the accession numbers GSE103684 and GSE47177. Symbols represent the mean of three independent biological replicates, error bars represent the standard deviation.
Figure 2
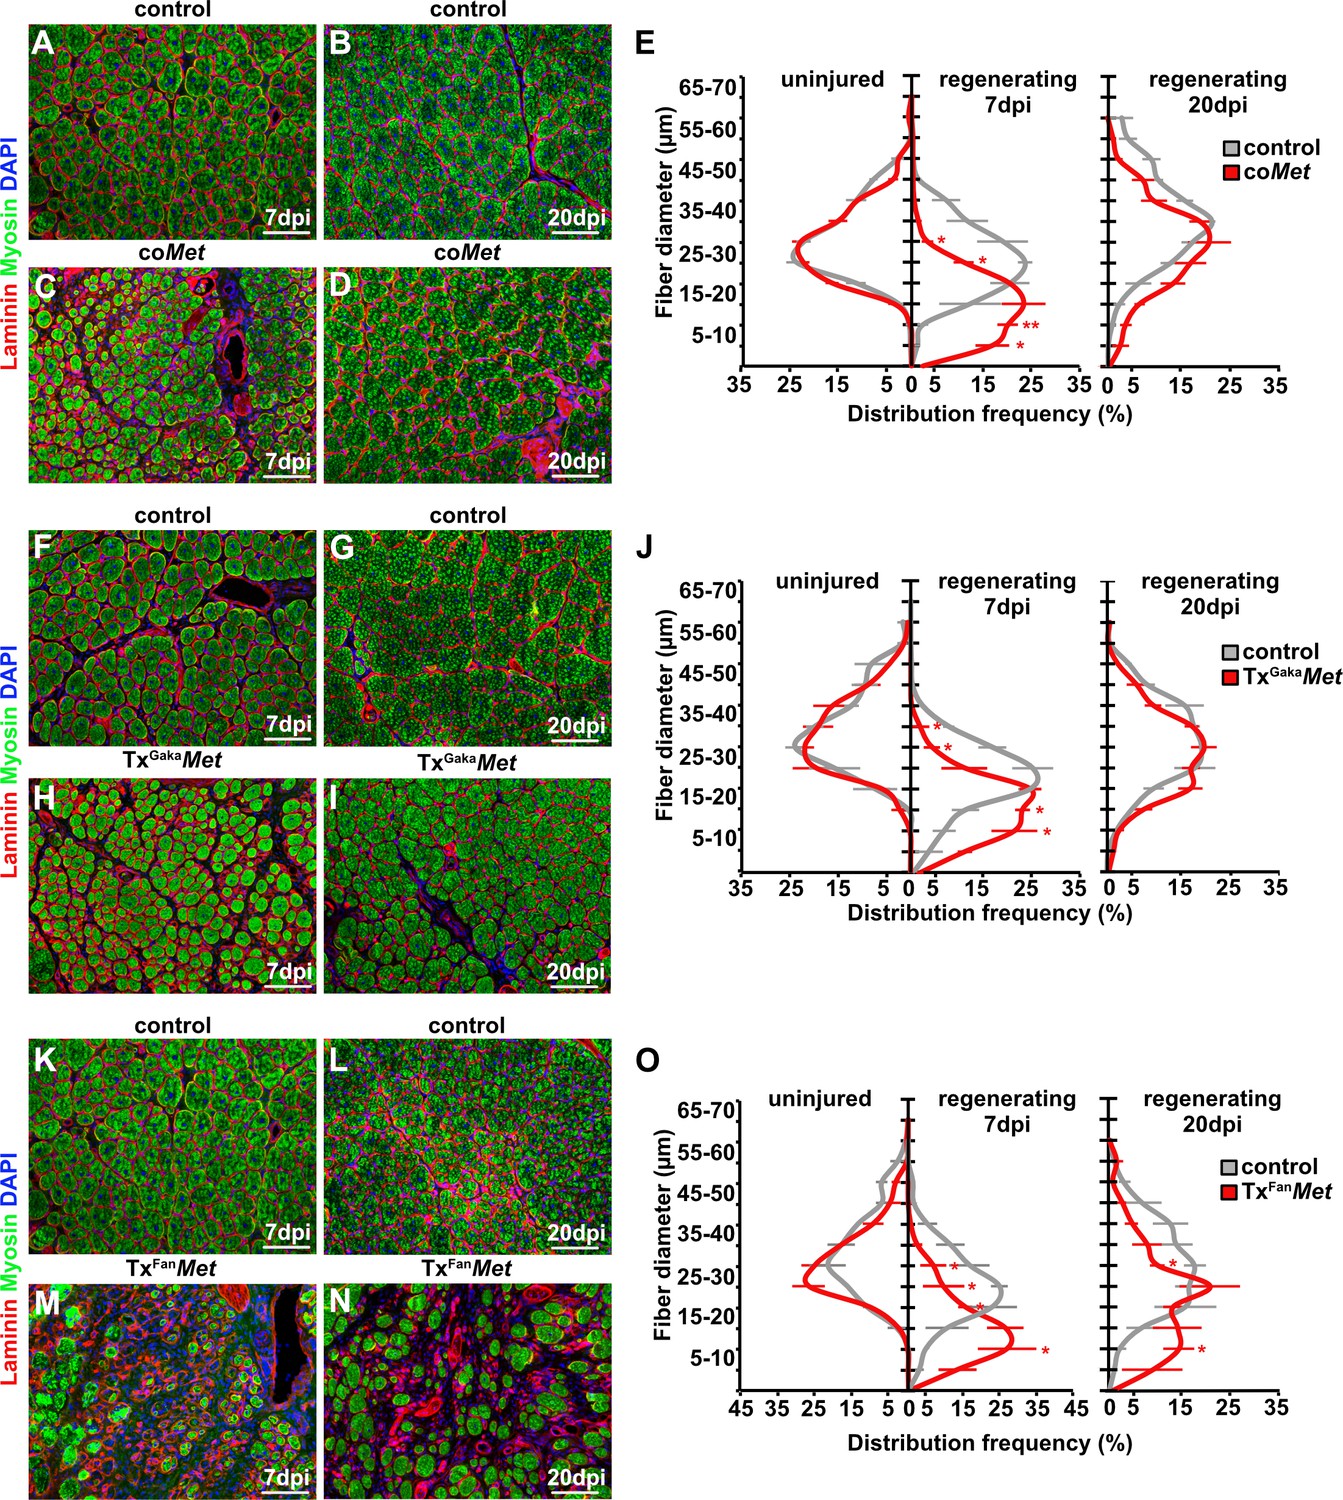
Mutation of Met impairs muscle regeneration.
(A–D) Immunohistological analysis of regenerating (7 days post injury [dpi] and 20 dpi) muscle of control and coMet mutants using antibodies against laminin (red) and sarcomeric myosin (green). DAPI was used as a counterstain. (E) Distribution of Feret fiber diameters in uninjured and regenerating muscle (7 dpi and 20 dpi) of control mice and coMet mutants. (F–I) Immunohistological analysis of regenerating muscle of control and TxGakaMet mice using antibodies against laminin (red) and sarcomeric myosin (green). DAPI was used as a counterstain. (J) Distribution of Feret fiber diameters in uninjured and regenerating muscle (7 dpi and 20 dpi) of control and TxGakaMet mice. (K–N) Immunohistological analysis of regenerating (7 dpi and 20 dpi) muscle of control and TxFanMet mice using antibodies against laminin (red) and sarcomeric myosin (green). DAPI was used as a counterstain. (O) Distribution of Feret fiber diameters in uninjured and regenerating (7 dpi and 20 dpi) muscle of control and TxFanMet mice. Scale bars, 100 µm. In (A–E) control: Pax7iresCre/+;Met+/+; coMet: Pax7iresCre/+;Metflox/flox. In (F–J) control: Pax7iresCreERT2Gaka/+;Met+/+; TxGakaMet: Pax7iresCreERT2Gaka/+;Metflox/flox; In (K–O) control: Pax7CreERT2Fan/+;Met+/+; TxFanMet: Pax7CreERT2Fan/+;Metflox/flox. Animals in (F–O) were treated with tamoxifen.
-
Figure 2—source data 1
Quantification of fiber diameters represented in the diagrams shown in E, J and O.
- https://cdn.elifesciences.org/articles/57356/elife-57356-fig2-data1-v2.xlsx
Figure 3 with 1 supplement
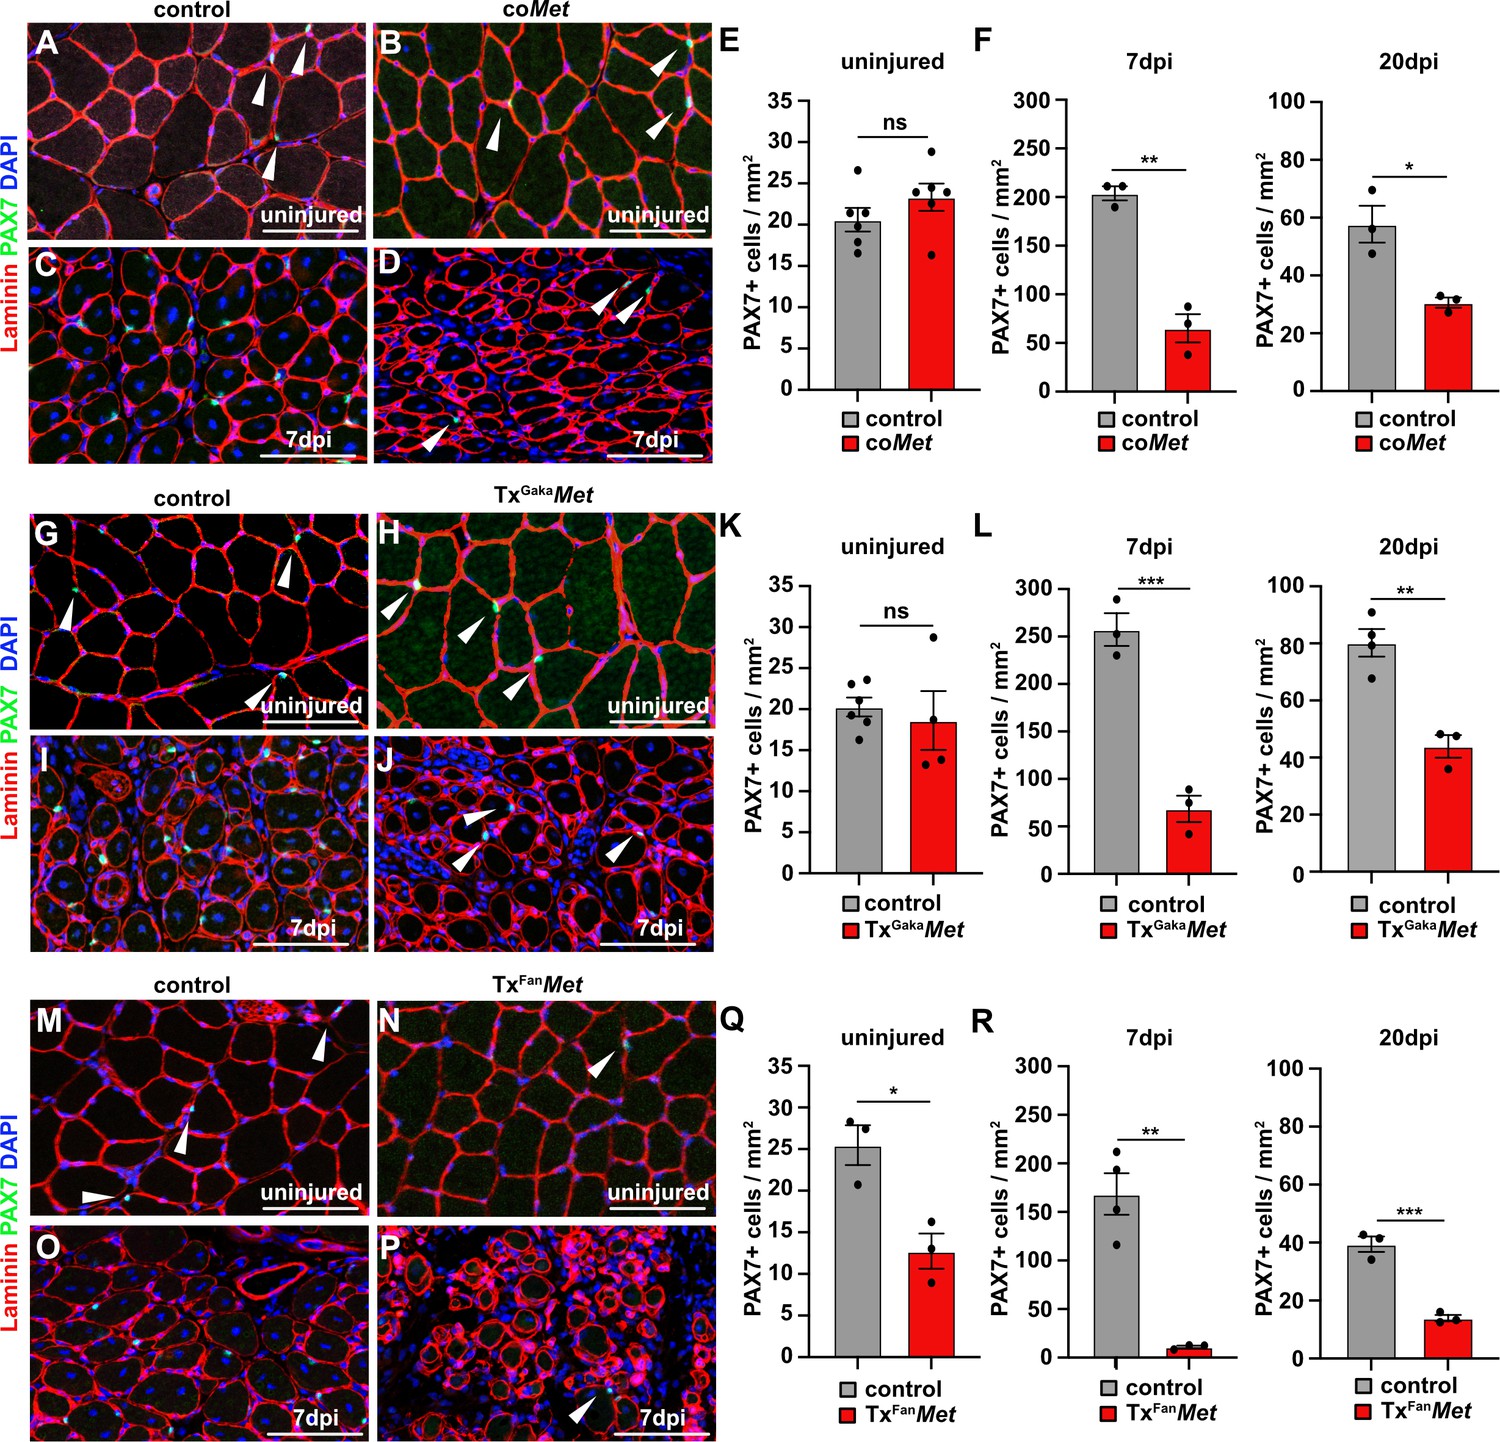
Mutation of Met reduces the muscle stem cell pool during regeneration.
(A–D) Immunohistological analysis of uninjured and regenerating (7 days post injury [dpi]) muscle of control and coMet mice using antibodies against laminin (red) and PAX7 (green). DAPI was used as a counterstain. (E, F) Quantification of PAX7+ cells in uninjured and regenerating muscle from control and coMet mice. (G–J) Immunohistological analysis of uninjured and regenerating (7 dpi) muscle from control and TxGakaMet mice using antibodies against laminin (red) and Pax7 (green). DAPI was used as a counterstain. (K, L) Quantification of PAX7+ cells in uninjured and regenerating muscle of control and TxGakaMet mice. (M–P) Immunohistological analysis of uninjured and regenerating (7 dpi) muscle from control and TxFanMet mice using antibodies against laminin (red) and Pax7 (green). DAPI was used as a counterstain. (Q, R) Quantification of PAX7+ cells in uninjured and regenerating (7 dpi) muscle from control and TxFanMet mice. Arrowheads point to PAX7+ cells. Scale bars 100 µm. In (A–F) control: Pax7iresCre/+;Met+/+; coMet: Pax7iresCre/+;Metflox/flox. In (G–L) control: Pax7iresCreERT2Gaka/+;Met+/+; TxGakaMet: Pax7iresCreERT2Gaka/+;Metflox/flox. In (M–R) control: Pax7CreERT2Fan/+;Met+/+; TxFanMet: Pax7CreERT2Fan/+;Metflox/flox. Animals in (G–R) were treated with tamoxifen.
-
Figure 3—source data 1
Quantification of PAX7+ cells represented in the diagrams shown in E, F, K, L, Q and R (Figure 3).
Quantification of recombination efficiency of the Metflox allele represented in the diagrams shown in B, C and D (Figure 3—figure supplement 1).
- https://cdn.elifesciences.org/articles/57356/elife-57356-fig3-data1-v2.xlsx
Figure 3—figure supplement 1
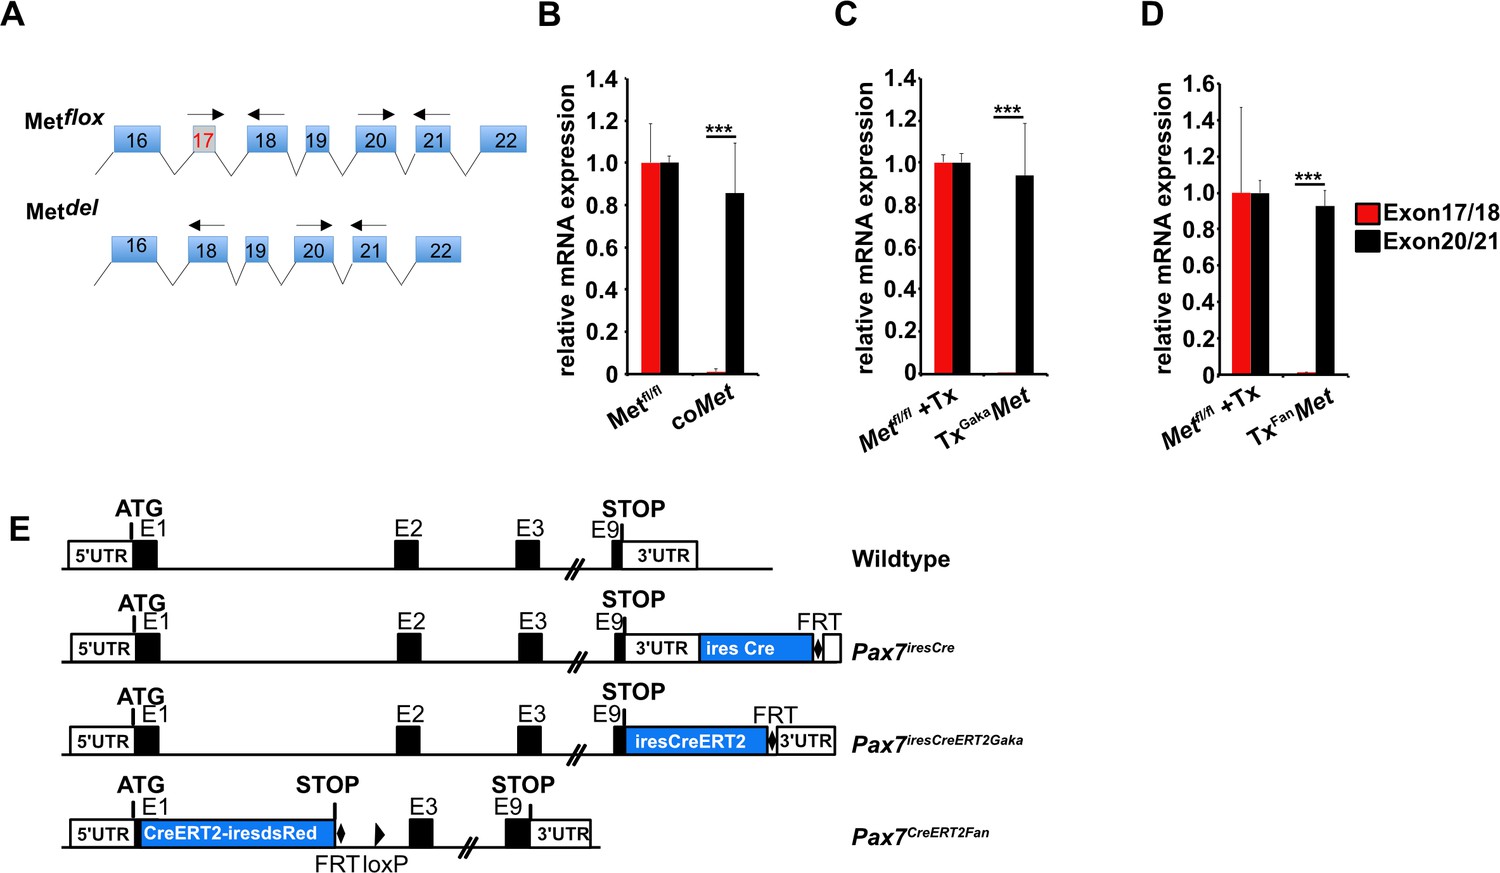
Recombination efficiency and schematic drawing of the different Pax7Cre alleles.
(A) Cartoon showing the unspliced transcripts from the Metflox allele before and after Cre-dependent excision of exon 17. Arrows mark position of qPCR primers used to determine the recombination efficiency. (B–D) Transcript levels generated from the Metflox allele before and after recombination using Pax7iresCre (B), Pax7iresCreERT2Gaka (C), and Pax7CreERT2Fan (D) in isolated muscle stem cells quantified by qPCR. β-Actin expression was used for normalization. (E) Cartoon showing the Cre alleles used to recombine muscle stem cells in this work. Genotypes of controls are in (B) Metflox/flox, in (C), Metflox/flox treated with tamoxifen, and in (D) Metflox/flox treated with tamoxifen.
Figure 4 with 1 supplement
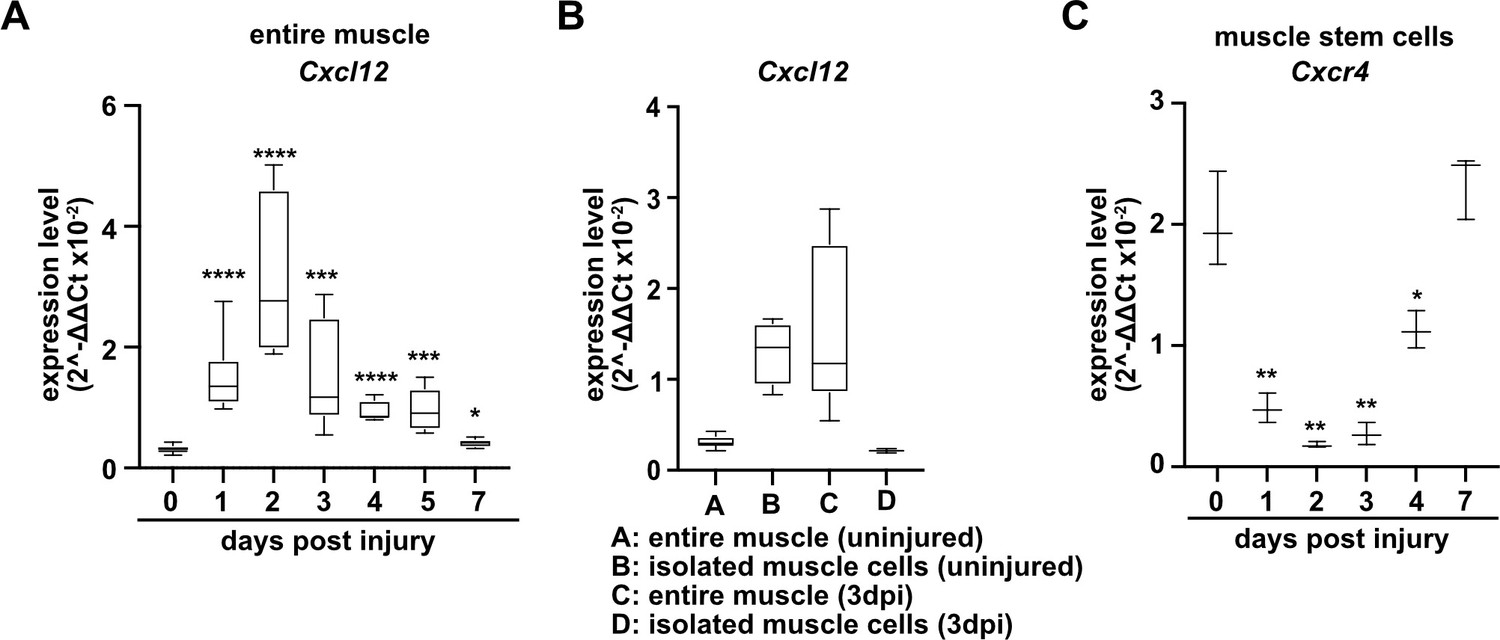
Expression of Cxcl12 and Cxcr4 during regeneration.
(A) Expression dynamics of Cxcl12 in uninjured and regenerating muscle tissue determined by qPCR. (B) Expression levels of Cxcl12 in quiescent and activated muscle stem cells and in muscle tissue during muscle regeneration determined by qPCR. (C) Expression levels of Cxcr4 in quiescent and activated muscle stem cells determined by qPCR. Boxplots represent interquartile range, whiskers show min-to-max range. β-Actin expression was used for normalization in (A–C).
-
Figure 4—source data 1
Quantification of Cxcl12 and Cxcr4 expression represented in the diagrams shown in A-C.
- https://cdn.elifesciences.org/articles/57356/elife-57356-fig4-data1-v2.xlsx
Figure 4—figure supplement 1
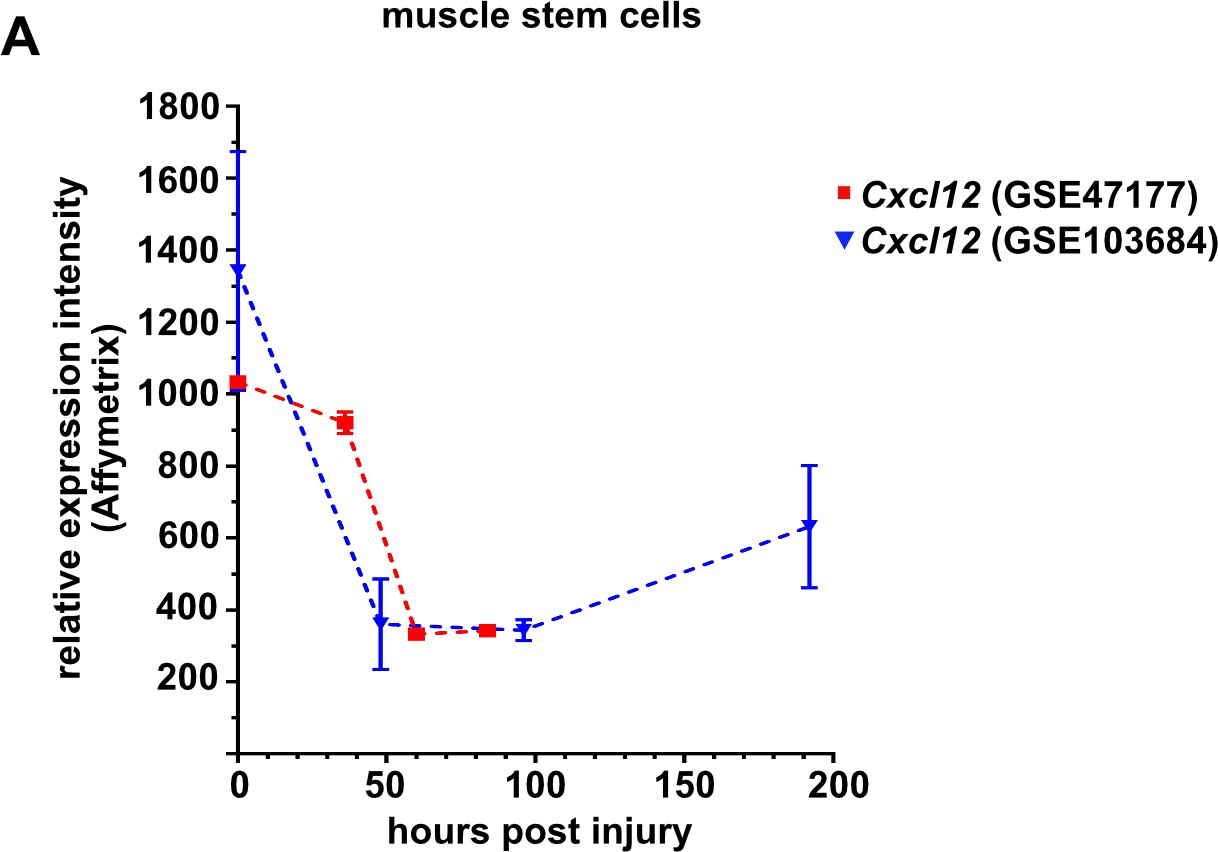
Expression levels of Cxcl12 in quiescent (freshly isolated) and proliferating muscle stem cells at various time points defined by microarray analysis (Liu et al., 2013; Latroche et al., 2017).
The microarray data sets were obtained from the GEO Database under the accession numbers GSE103684 and GSE47177. Symbols represent the mean of three independent biological replicates, error bars represent the standard deviation.
Figure 5 with 2 supplements
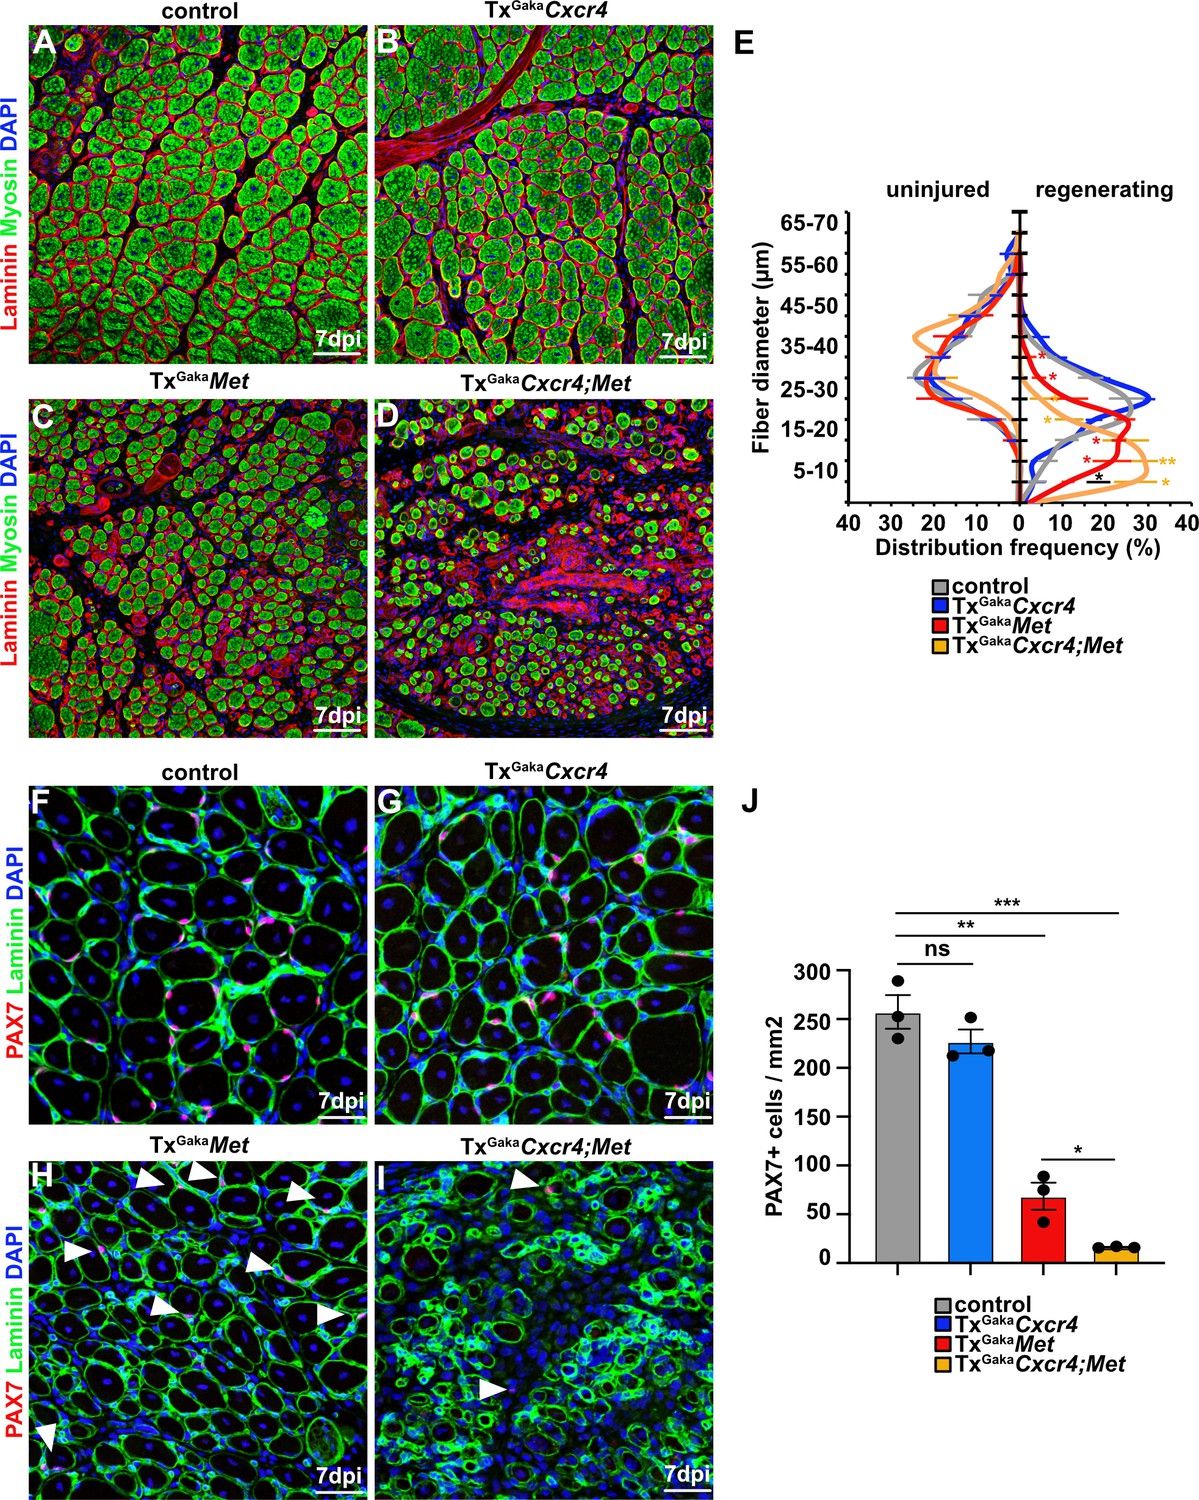
Cxcr4 and Met cooperate during muscle regeneration.
(A–D) Immunohistological analysis of regenerating (7 days post injury [dpi]) muscle of control, TxGakaCxcr4, TxGakaMet, and TxGakaCxcr4;Met mice using antibodies against laminin (red) and sarcomeric myosin (green). DAPI was used as a counterstain. Control and mutant animals had been treated with tamoxifen. (E) Distribution of Ferret fiber diameters in uninjured and regenerating (7 dpi) muscle of control, TxGakaCxcr4, TxGakaMet, and TxGakaCxcr4;Met mice. (F–I) Immunohistological analysis of regenerating (7 dpi) muscle of control animals, TxGakaCxcr4, TxGakaMet, and TxGakaCxcr4;Met mutants using antibodies against laminin (green) and Pax7 (red). DAPI was used as a counterstain. Arrowheads in (H, I) point to PAX7+ cells. (J) Quantification of PAX7+ cells in regenerating muscle of control, TxGakaCxcr4 and TxGakaMet mice, and TxGakaCxcr4;Met double mutants. Scale bars, 50 µm (A–D), 30 µm (F–I). Control: Pax7iresCreERT2Gaka/+; TxGakaCxcr4: Pax7iresCreERT2Gaka/+;Cxcr4flox/flox; TxGakaMet: Pax7iresCreERT2Gaka/+;Metflox/flox; TxGakaCxcr4;Met: Pax7iresCreERT2Gaka/+;Cxcr4flox/flox;Metflox/flox. All animals were treated with tamoxifen.
-
Figure 5—source data 1
Quantification of fiber diameters, PAX7+ cells and fibrotic area represented in the diagrams shown in E, J (Figure 5), E (Figure 5—figure supplement 1) and E, F (Figure 5—figure supplement 2).
- https://cdn.elifesciences.org/articles/57356/elife-57356-fig5-data1-v2.xlsx
Figure 5—figure supplement 1
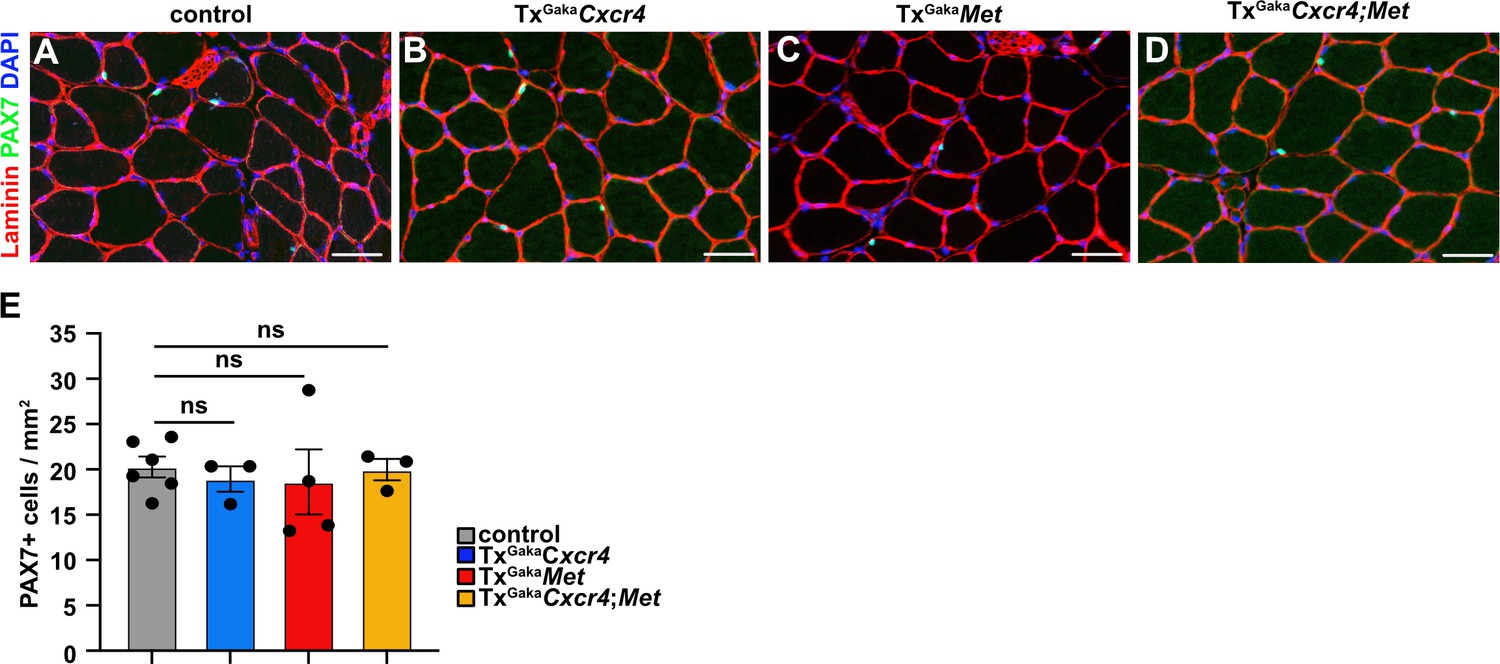
Mutations of Cxcr4 and Met in muscle stem cells did not affect muscle stem cell numbers.
(A–D) Immunohistological analysis of uninjured muscle of control, TxGakaCxcr4, TxGakaMet, andTxGakaCxcr4;Met mice using antibodies against laminin (red) and PAX7 (green). DAPI was used as a counterstain. (E) Quantification of PAX7+ cells in uninjured muscle. Scale bars: 30 µm. Genotype of control is Pax7iresCreERT2Gaka/+, treated with tamoxifen.
Figure 5—figure supplement 2
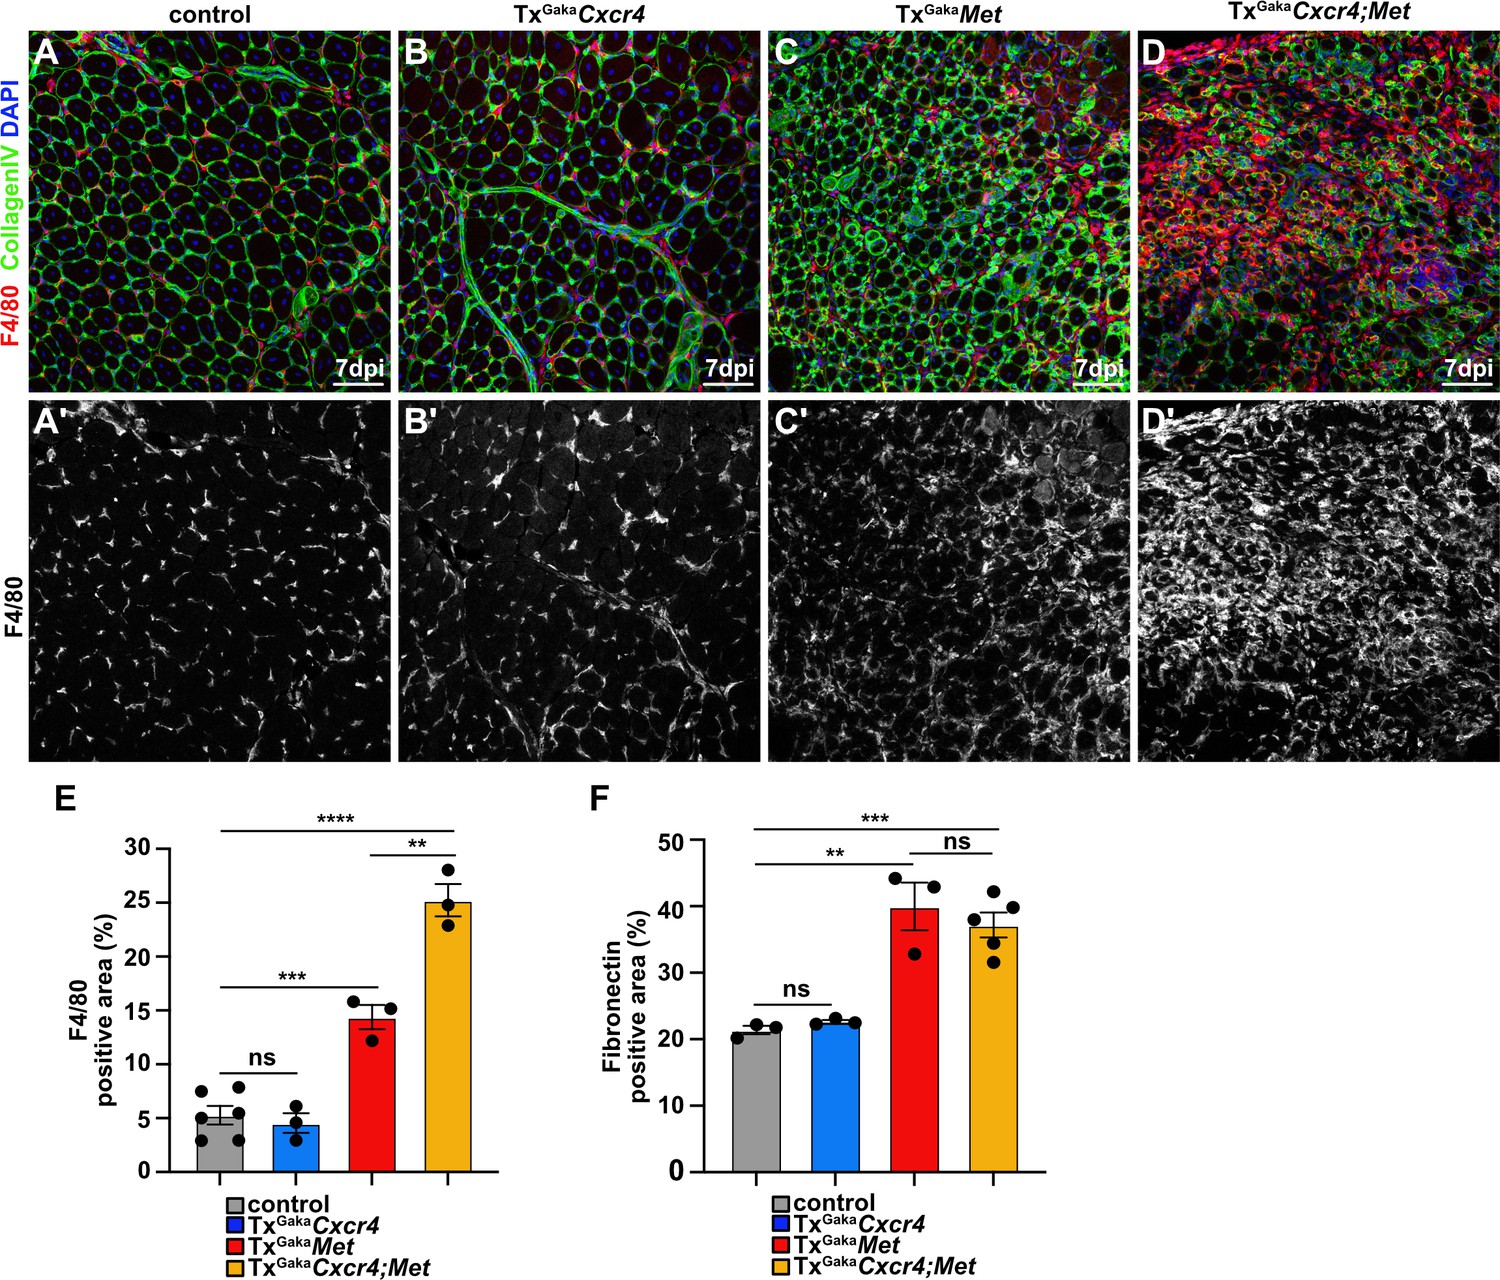
Increased fibrosis in the regenerating muscle of Met and Cxcr4;Met mutants.
(A–D, A′–D′) Immunohistological analysis of regenerating muscle at 7 days post injury (dpi) of control, TxGakaCxcr4, TxGakaMet, and TxGakaCxcr4;Met mutants using antibodies against F4/80 (red in A–D, white in A′–D′) and CollagenIV (green). DAPI was used as a counterstain. (E) Quantifications of F4/80+ stained area and (F) fibronectin-positive area in the regenerating muscle. Scale bars, 100 µm. Genotype of control is Pax7iresCreERT2Gaka/+, treated with tamoxifen.
Figure 6 with 2 supplements
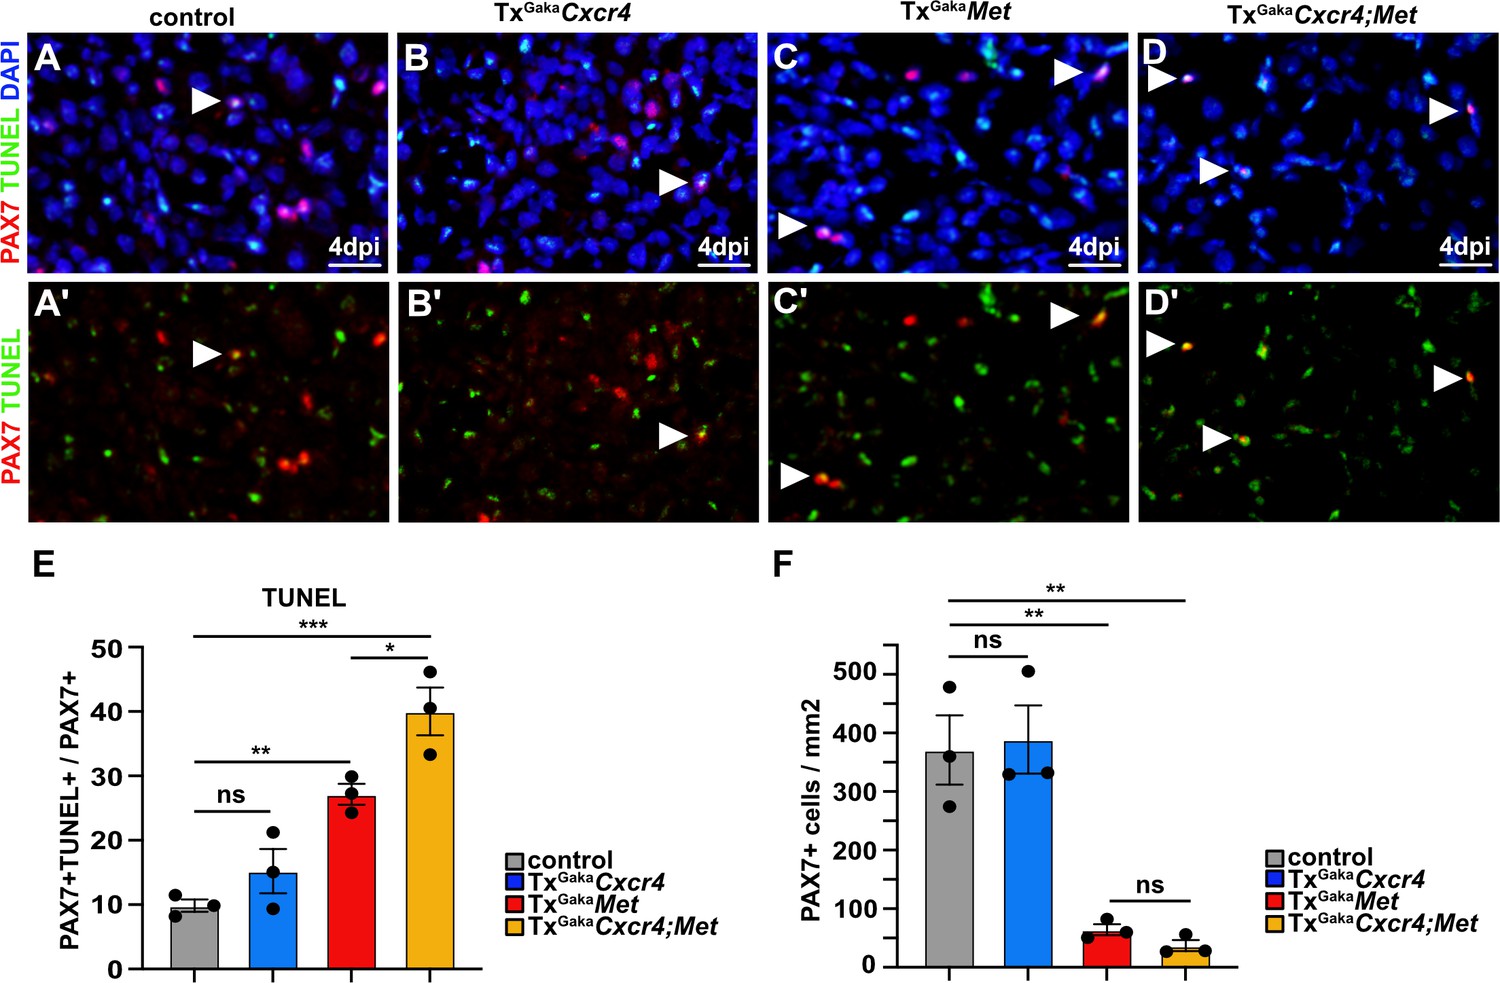
Cxcr4;Met mutant muscle stem cells undergo apoptosis after acute injury.
(A–D, A′–D′) Immunohistological analysis of apoptotic cells. PAX7 antibody staining (red) was combined with TUNEL assay (green) to identify apoptotic muscle stem cells in injured muscle of control, TxGakaCxcr4, TxGakaMet, and TxGakaCxcr4;Met mice at 4 days post injury (dpi). DAPI was used as a counterstain in (A–D). Arrowheads point to TUNEL+ PAX7+ cells. (E) Quantification of PAX7+ TUNEL+ cells in regenerating muscle of control, TxGakaCxcr4, TxGakaMet, and TxGakaCxcr4;Met mutants. (F) Quantification of PAX7+ cells in regenerating muscle of control, TxGakaCxcr4, TxGakaMet, and TxGakaCxcr4;Met mice. Scale bars, 20 µm. Control: Pax7iresCreERT2Gaka/+; TxGakaCxcr4: Pax7iresCreERT2Gaka/+;Cxcr4flox/flox; TxGakaMet: Pax7iresCreERT2Gaka/+;Metflox/flox; TxGakaCxcr4;Met: Pax7iresCreERT2Gaka/+;Cxcr4flox/flox;Metflox/flox. All animals were treated with tamoxifen.
-
Figure 6—source data 1
Quantification of PAX7+TUNEL+ and PAX7+ cells represented in the diagrams shown in E and F (Figure 6).
Quantification of EdU+PAX7+ cells represented in the diagram shown in E (Figure 6—figure supplement 1). Quantification of MYOG+ and PAX7+ cells represented in the diagrams shown in E and F (Figure 6—figure supplement 2).
- https://cdn.elifesciences.org/articles/57356/elife-57356-fig6-data1-v2.xlsx
Figure 6—figure supplement 1
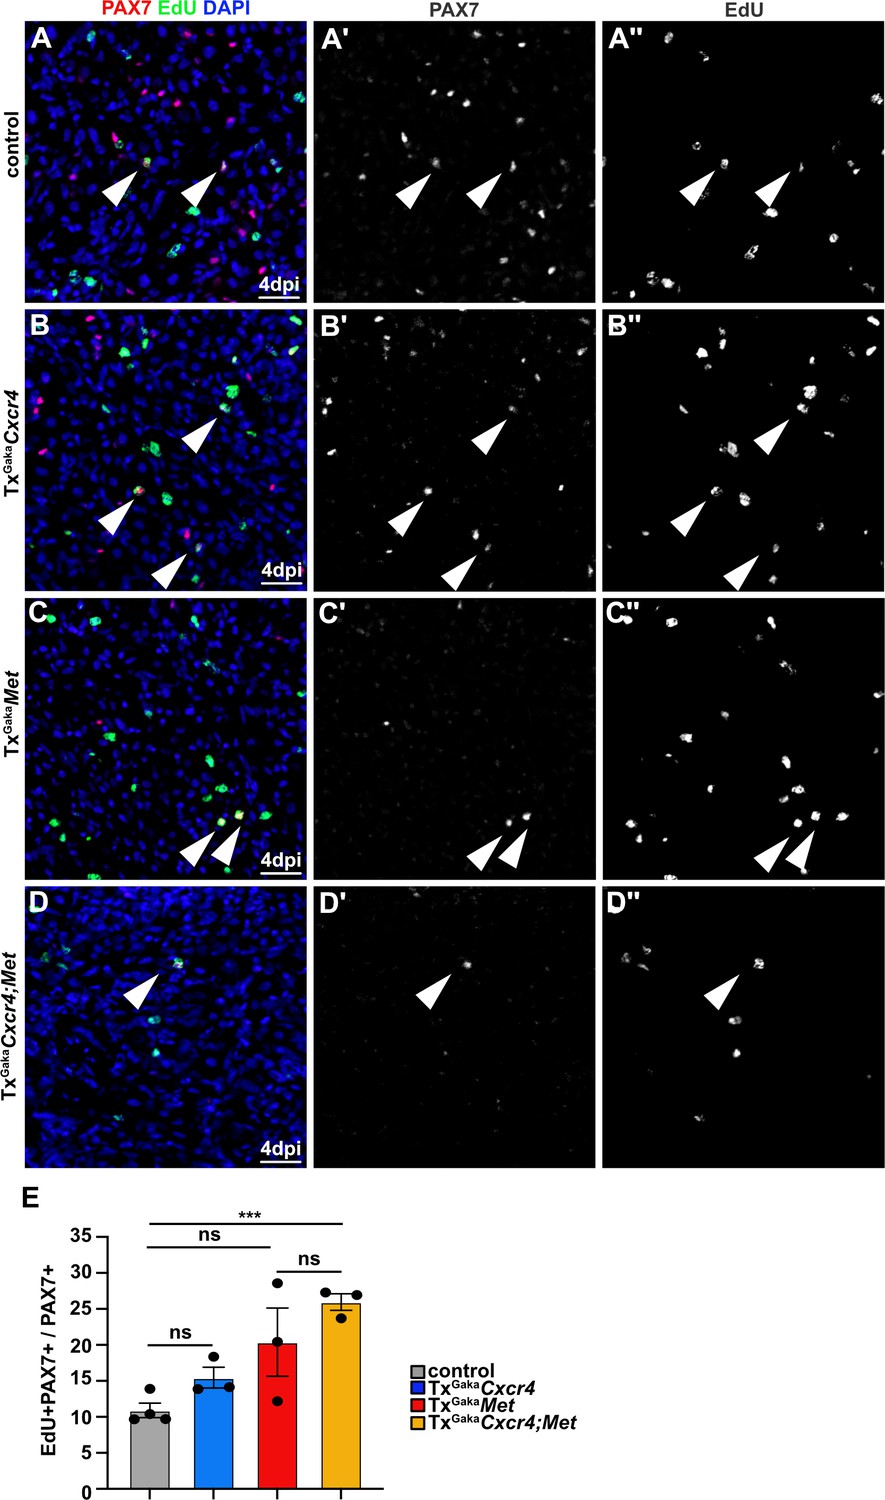
Enhanced proliferation of PAX7+ cells in Cxcr4;Met mutants during regeneration.
(A–D) Identification of proliferating muscle stem cells by EdU incorporation in regenerating muscle of (A) control, (B) TxGakaCxcr4, (C) TxGakaMet, and (D) TxGakaCxcr4;Met mice at 4 days post injury (dpi) using antibodies against EdU (green) and PAX7 (red). DAPI was used as a counterstain. Arrowheads point to EdU+ PAX7+ muscle stem cells in regenerating muscle. (A′–D′) show the Pax7 channel, (A′′–D′′) show the EdU channel of images in (A–D). (E) Quantification of the proliferating EdU+ PAX7+ cells. Scale bars, 20 µm. Genotype of control is Pax7iresCreERT2Gaka/+, treated with tamoxifen.
Figure 6—figure supplement 2
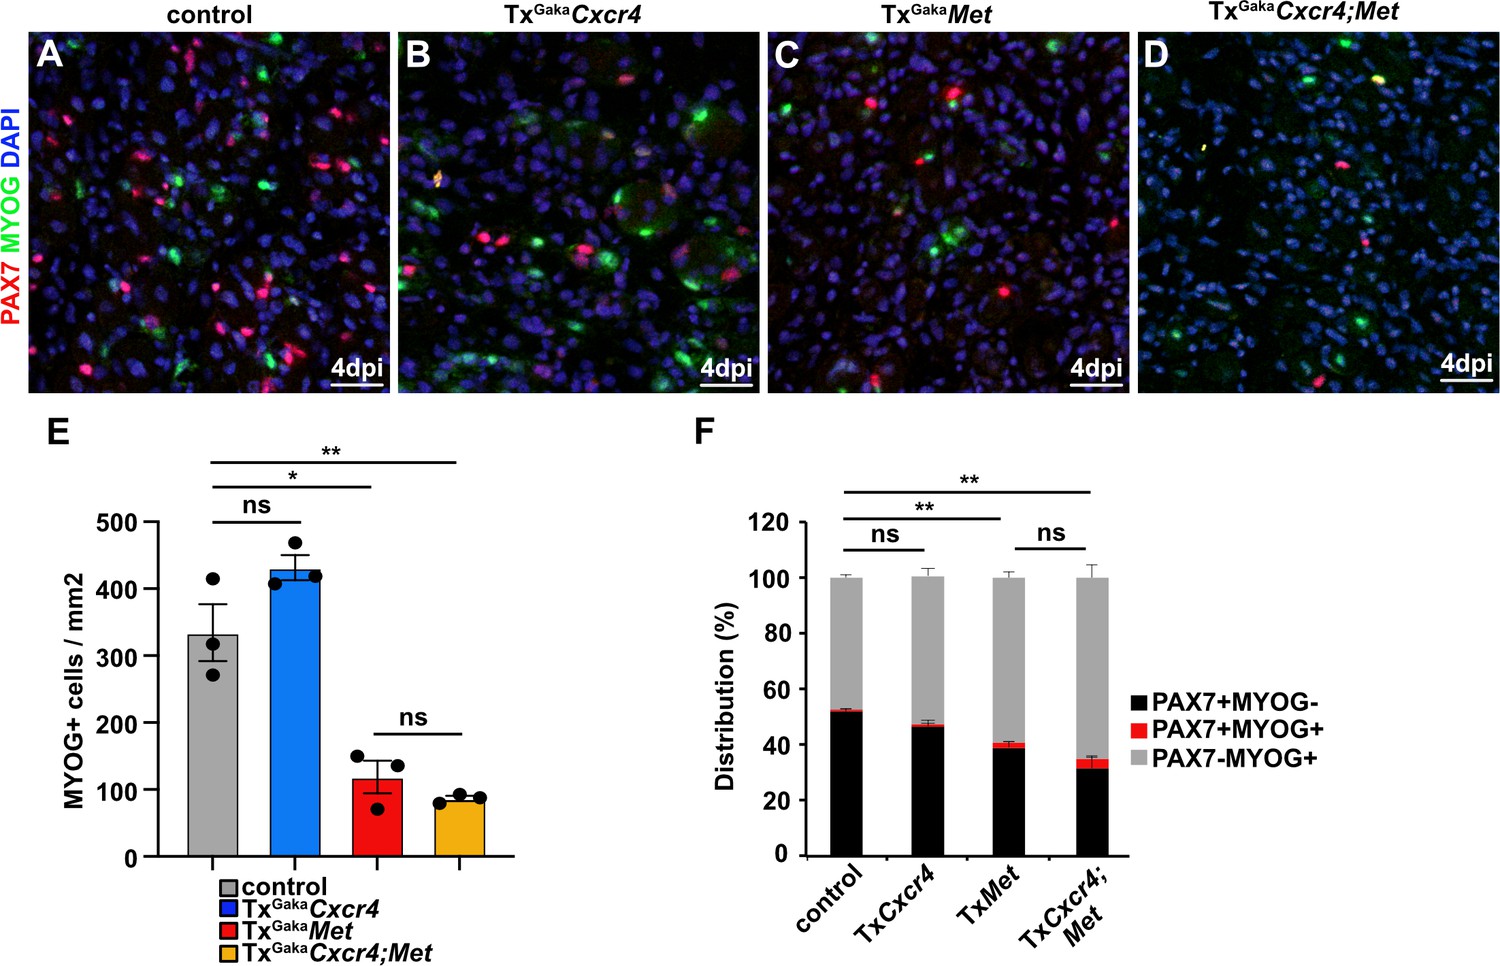
Differentiation is mildly enhanced in Met and Cxcr4;Met mutants during regeneration.
(A–D) Identification of differentiating myogenic cells in regenerating muscle of (A) control, (B) TxGakaCxcr4, (C) TxGakaMet, and (D) TxGakaCxcr4;Met mice at 4 days post injury (dpi) using antibodies against Myogenin (green) and PAX7 (red). DAPI was used as a counterstain. (E) Number of Myogenin+ cells/mm2 and (F) quantification of the proportion of cells that express PAX7 and/or Myogenin. Scale bars, 20 µm. Genotype of control is Pax7iresCreERT2Gaka/+, treated with tamoxifen.
Figure 7 with 1 supplement
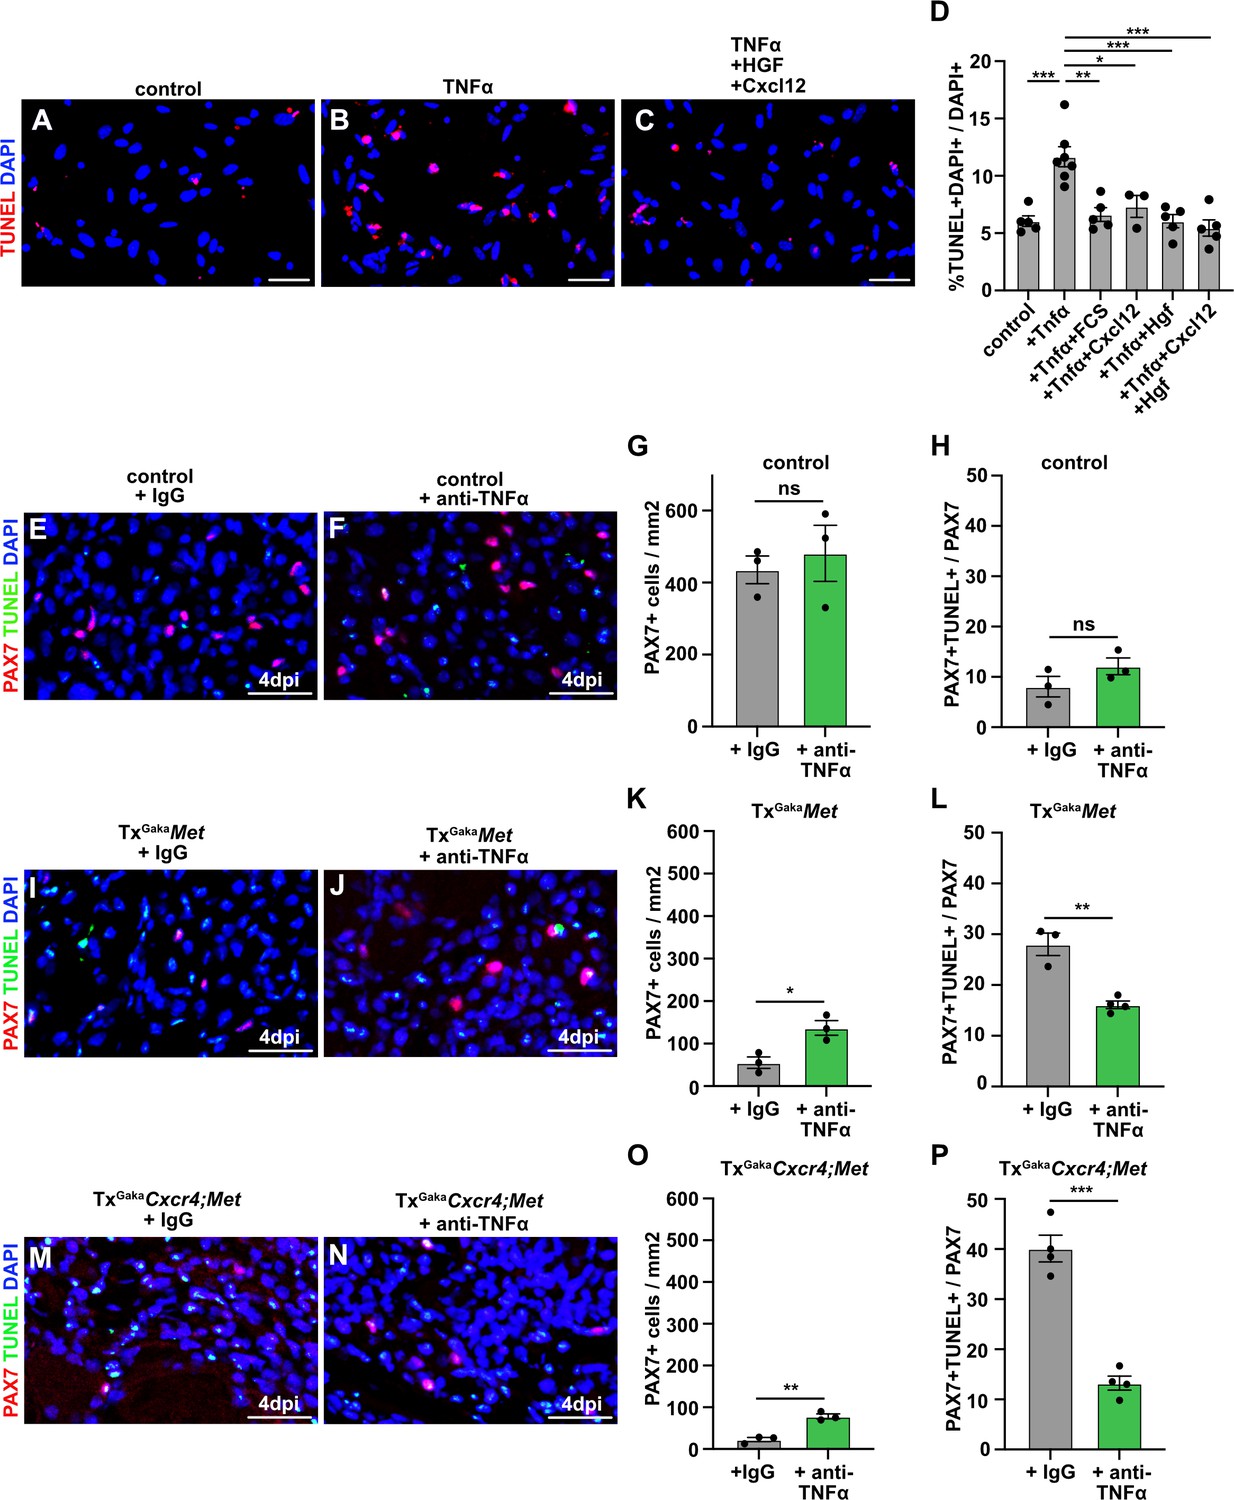
CXCL12 and HGF protect muscle cells from TNFα-induced cell death.
(A–C) Primary muscle stem cells were isolated and cultured for 3 hr in the presence of TNFα plus/minus HGF and Cxcl12. Apoptotic cells were identified by TUNEL staining. (D) Quantification of TUNEL+ cells present in such cultures. (E, F) Immunohistological analysis of muscle stem cells (PAX7+, red) and apoptotic cells (TUNEL staining, green) in injured muscle (4 days post injury [dpi]) of control mice treated with TNFα neutralizing antibodies or control IgG 2 hr before acute injury. DAPI was used as a counterstain. (G) Quantification of PAX7+ cells in regenerating muscle (4 dpi) of control mice treated with TNFα neutralizing antibodies or control IgG. (H) Quantification of PAX7+ TUNEL+ cells in regenerating muscle (4 dpi) of control mice treated with TNFα neutralizing antibodies or control IgG. (I, J) Immunohistological analysis of muscle stem cells (PAX7+, red) and apoptotic cells (TUNEL staining, green) in injured muscle (4 dpi) of TxGakaMet mutants treated with TNFα neutralizing antibodies or control IgG 2 hr before acute injury. DAPI was used as a counterstain. (K) Quantification of PAX7+ cells in regenerating (4 dpi) muscle of TxGakaMet mice treated with TNFα neutralizing antibodies or control IgG. (L) Quantification of PAX7+ TUNEL+ cells in regenerating muscle from TxGakaMet mice treated with TNFα neutralizing antibodies or control IgG. (M, N) Immunohistological analysis of muscle stem cells (PAX7+, red) and apoptotic cells (TUNEL staining, green) in injured muscle (4 dpi) of TxGakaCxcr4;Met mutants treated with TNFα neutralizing antibodies or control IgG 2 hr before acute injury. DAPI was used as a counterstain. (O) Quantification of PAX7+ cells in regenerating muscle (4 dpi) of TxGakaCxcr4;Met mice treated with TNFα neutralizing antibodies or control IgG. (P) Quantification of PAX7+ TUNEL+ cells in regenerating muscle (4 dpi) of TxGakaCxcr4;Met mice treated with TNFα neutralizing antibodies or control IgG. Scale bars, 20 µm. Control: Pax7iresCreERT2Gaka/+; TxGakaMet: Pax7iresCreERT2Gaka/+;Metflox/flox; TxGakaCxcr4;Met: Pax7iresCreERT2Gaka/+;Cxcr4flox/flox;Metflox/flox. All animals were treated with tamoxifen.
-
Figure 7—source data 1
Quantification of TUNEL+, PAX7+ and PAX7+TUNEL+ cells represented in the diagrams shown in D, G, H, K, L, O and P (Figure 7).
Quantification of TUNEL+ cells represented in the diagram shown in Figure 7—figure supplement 1.
- https://cdn.elifesciences.org/articles/57356/elife-57356-fig7-data1-v2.xlsx
Figure 7—figure supplement 1
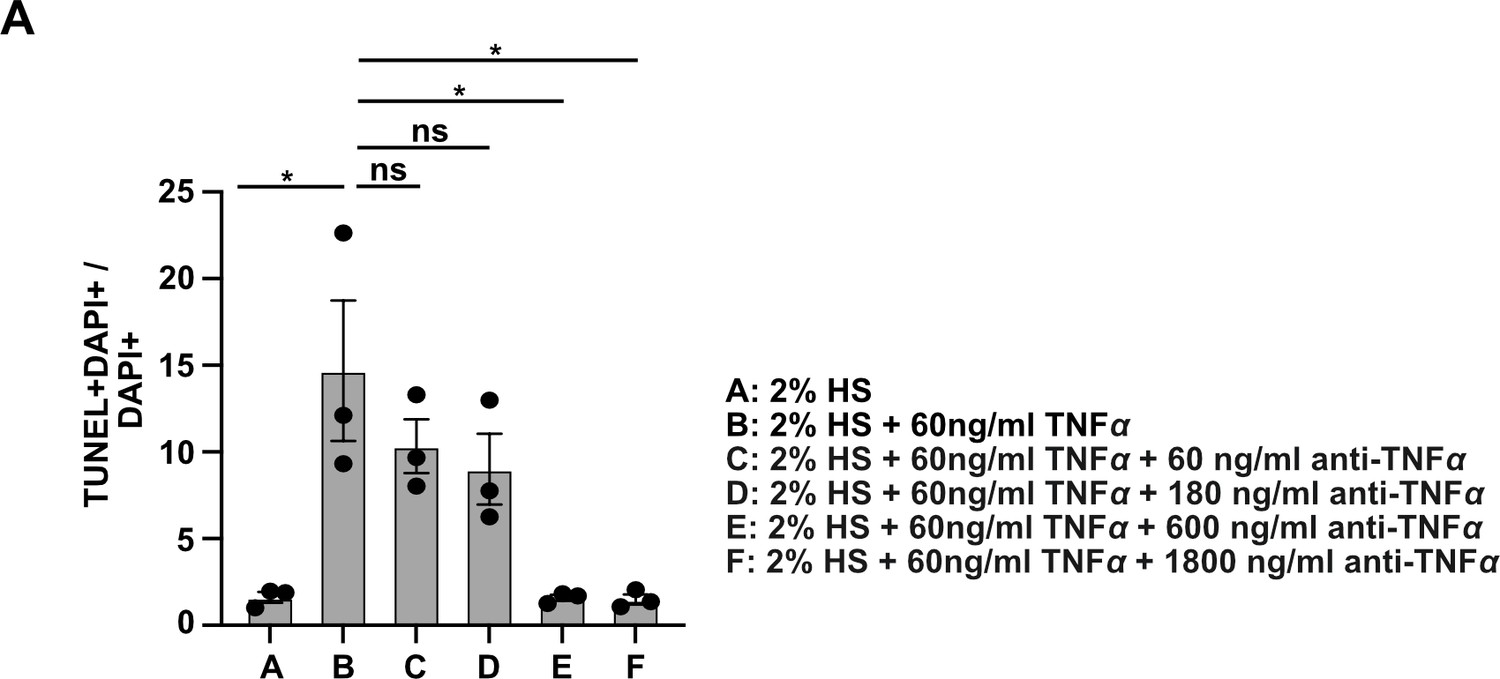
Neutralizing capacity of TNFα antibody used in Figure 7.
C2C12 cells were cultured for 24 hr in the presence of TNFα plus/minus different concentration of neutralizing TNFα antibody. Apoptotic cells were identified by TUNEL staining and quantified.
Tables
Key resources table
| Reagent type (species) or resource | Designation | Source or reference | Identifiers | Additional information |
|---|---|---|---|---|
| Antibody | Guinea pig polyclonal anti-PAX7 | Our lab | PMID:22940113 | 1:2500 |
| Antibody | Rabbit polyclonal anti-Laminin | Sigma-Aldrich | L9393RRID:AB_477163 | 1:500 |
| Antibody | Goat polyclonalanti-CollagenIV | Millipore | AB769RRID:AB_92262 | 1:500 |
| Antibody | Mouse monoclonalanti-sarcomeric myosin | DSHB | MF20RRID:AB_2147781 | 1:10 |
| Antibody | Rabbit polyclonalanti-Myogenin | Abcam | ab124800RRID:AB_10971849 | 1:1000 |
| Antibody | Mouse monoclonal anti-F4/80 | Abcam | ab6640RRID:AB_1140040 | 1:100 |
| Antibody | Rabbit polyclonal anti-fibronectin | Sigma-Aldrich | F7387RRID:AB_476988 | 1:500 |
| Antibody | Cy2, Cy3, Cy5 conjugated antibodies | Dianova | 1:500 | |
| Commercial assay or kit | In Situ Cell Death Detection Kit | Roche | 12156792910 | |
| Commercial assay or kit | EdU | baseclick GmbH | BCK-EdU647 | |
| Commercial Assay or kit | qPCR SYBR Green Mix | ThermoFisher | AB1158B | |
| Sequence-based reagent | ATCCACGATGTTCATGAGAG | Eurofins | N/A | qPCR HGF (forward primer) |
| Sequence-based reagent | GCTGACTGCATTTCTCATTC | Eurofins | N/A | qPCR HGF (reverse primer) |
| Sequence-based reagent | CACAGAAAGCATGATCCGCGACGT | Eurofins | N/A | qPCR TNF (forward primer) |
| Sequence-based reagent | CGGCAGAGAGGAGGTTGACTTTCT | Eurofins | N/A | qPCR TNF (reverse primer) |
| Sequence-based reagent | CAGAGCCAACGTCAAGCA | Eurofins | N/A | qPCR Cxcl12 (forward primer) |
| Sequence-based reagent | AGGTACTCTTGGATCCAC | Eurofins | N/A | qPCR Cxcl12 (reverse primer) |
| Sequence-based reagent | CATTTTGGCTGTGTCTATCATG | Eurofins | N/A | qPCR Met (forward primer) |
| Sequence-based reagent | ACTCCTCAGGCAGATTCCC | Eurofins | N/A | qPCR Met (reverse primer) |
| Sequence-based reagent | TCAGTGGCTGACCTCCTCTT | Eurofins | N/A | qPCR CXCR4 (forward primer) |
| Sequence-based reagent | CTTGGCCTTTGACTGTTGGT | Eurofins | N/A | qPCR CXCR4 (reverse primer) |
| Sequence-based reagent | CATTTTGGCTGTGTCTATCATG | Eurofins | N/A | qPCR Met Exon 17 (forward primer) |
| Sequence-based reagent | ACTCCTCAGGCAGATTCCC | Eurofins | N/A | qPCR Met Exon 18 (reverse primer) |
| Sequence-based reagent | CTTGCCAGAGACATGTACGAT | Eurofins | N/A | qPCR Met Exon 20 (forward primer) |
| Sequence-based reagent | AGGAGCACACCAAAGGACCA | Eurofins | N/A | qPCR Met Exon 21 (reverse primer) |
| Sequence-based reagent | CCAGTTGGTAACAATGCCATGT | Eurofins | N/A | qPCR β-actin (forward primer) |
| Sequence-based reagent | GGCTGTATTCCCCTCCATCG | Eurofins | N/A | qPCR β-actin (reverse primer) |
| Sequence-based reagent | ACTAGGCTCCACTCTGTCCTTC | Eurofins | PMID:19554048 | Genotyping PCR-Primer 1 Pax7CreERT2Fan |
| Sequence-based reagent | GCAGATGTAGGGACATTCCAGTG | Eurofins | PMID:19554048 | Genotyping PCR-Primer 2 Pax7CreERT2Fan |
| Sequence-based reagent | GCTGCTGTTGATTACCTGGC | Eurofins | PMID:21828091 | Genotyping PCR-Primer 1 Pax7CreERT2GaKa |
| Sequence-based reagent | CTGCACTGAGACAGGACCG | Eurofins | PMID:21828091 | Genotyping PCR-Primer 2 Pax7CreERT2GaKa |
| Sequence-based reagent | GCTGCTGTTGATTACCTGGC | Eurofins | PMID:21828091 | Genotyping PCR-Primer 1 Pax7CreERT2GaKa |
| Sequence-based reagent | GCTCTGGATACACCTGAGTCT | Eurofins | PMID:15520281 | Genotyping PCR-Primer 1 Pax7-IRESCre |
| Sequence-based reagent | GGATAGTGAAACAGGGGCAA | Eurofins | PMID:15520281 | Genotyping PCR-Primer 2 Pax7-IRESCre |
| Sequence-based reagent | TCGGCCTTCTTCTAGGTTCTGCTC | Eurofins | PMID:15520281 | Genotyping PCR-Primer 3 Pax7-IRESCre |
| Sequence-based reagent | CCACCCAGGACAGTGTGACTCTAA | Eurofins | PMID:15520246 | Genotyping PCR-Primer 1 Cxcr4 flox |
| Sequence-based reagent | GATGGGATTCTGTATGAGGATTAGC | Eurofins | PMID:15520246 | Genotyping PCR-Primer 2 Cxcr4 flox |
| Sequence-based reagent | CCAAGTGTCTGACGGCTGTG | Eurofins | N/A | Genotyping PCR-Primer 1 Met flox |
| Sequence-based reagent | AGCCTAGTGGAATTCTCTGTAAG | Eurofins | N/A | Genotyping PCR-Primer 2 Met flox |
Additional files
-
Supplementary file 1
Tnf, Hgf, and Cxcl12 expression levels during muscle regeneration.
Expression levels of Tnf, Hgf, and Cxcl12 mRNA after acute injury were determined in the entire muscle by qPCR. Uninjured and 1–7 days post injury (dpi) were assessed, and expression was normalized to the expression in the uninjured muscle. The values are displayed as means ± SEM. p-Values are shown in brackets. β-Actin was used for normalization.
- https://cdn.elifesciences.org/articles/57356/elife-57356-supp1-v2.xlsx
-
Transparent reporting form
- https://cdn.elifesciences.org/articles/57356/elife-57356-transrepform1-v2.docx
Download links
A two-part list of links to download the article, or parts of the article, in various formats.
Downloads (link to download the article as PDF)
Open citations (links to open the citations from this article in various online reference manager services)
Cite this article (links to download the citations from this article in formats compatible with various reference manager tools)
Met and Cxcr4 cooperate to protect skeletal muscle stem cells against inflammation-induced damage during regeneration
eLife 10:e57356.
https://doi.org/10.7554/eLife.57356


