Infant and adult SCA13 mutations differentially affect Purkinje cell excitability, maturation, and viability in vivo
- Department of Physiology, David Geffen School of Medicine at UCLA, United States
- Interdepartmental PhD Program in Molecular, Cellular, and Integrative Physiology, David Geffen School of Medicine at UCLA, United States
- Brain Research Institute, UCLA, United States
- Molecular Biology Institute, UCLA, United States
Figures
Figure 1 with 3 supplements
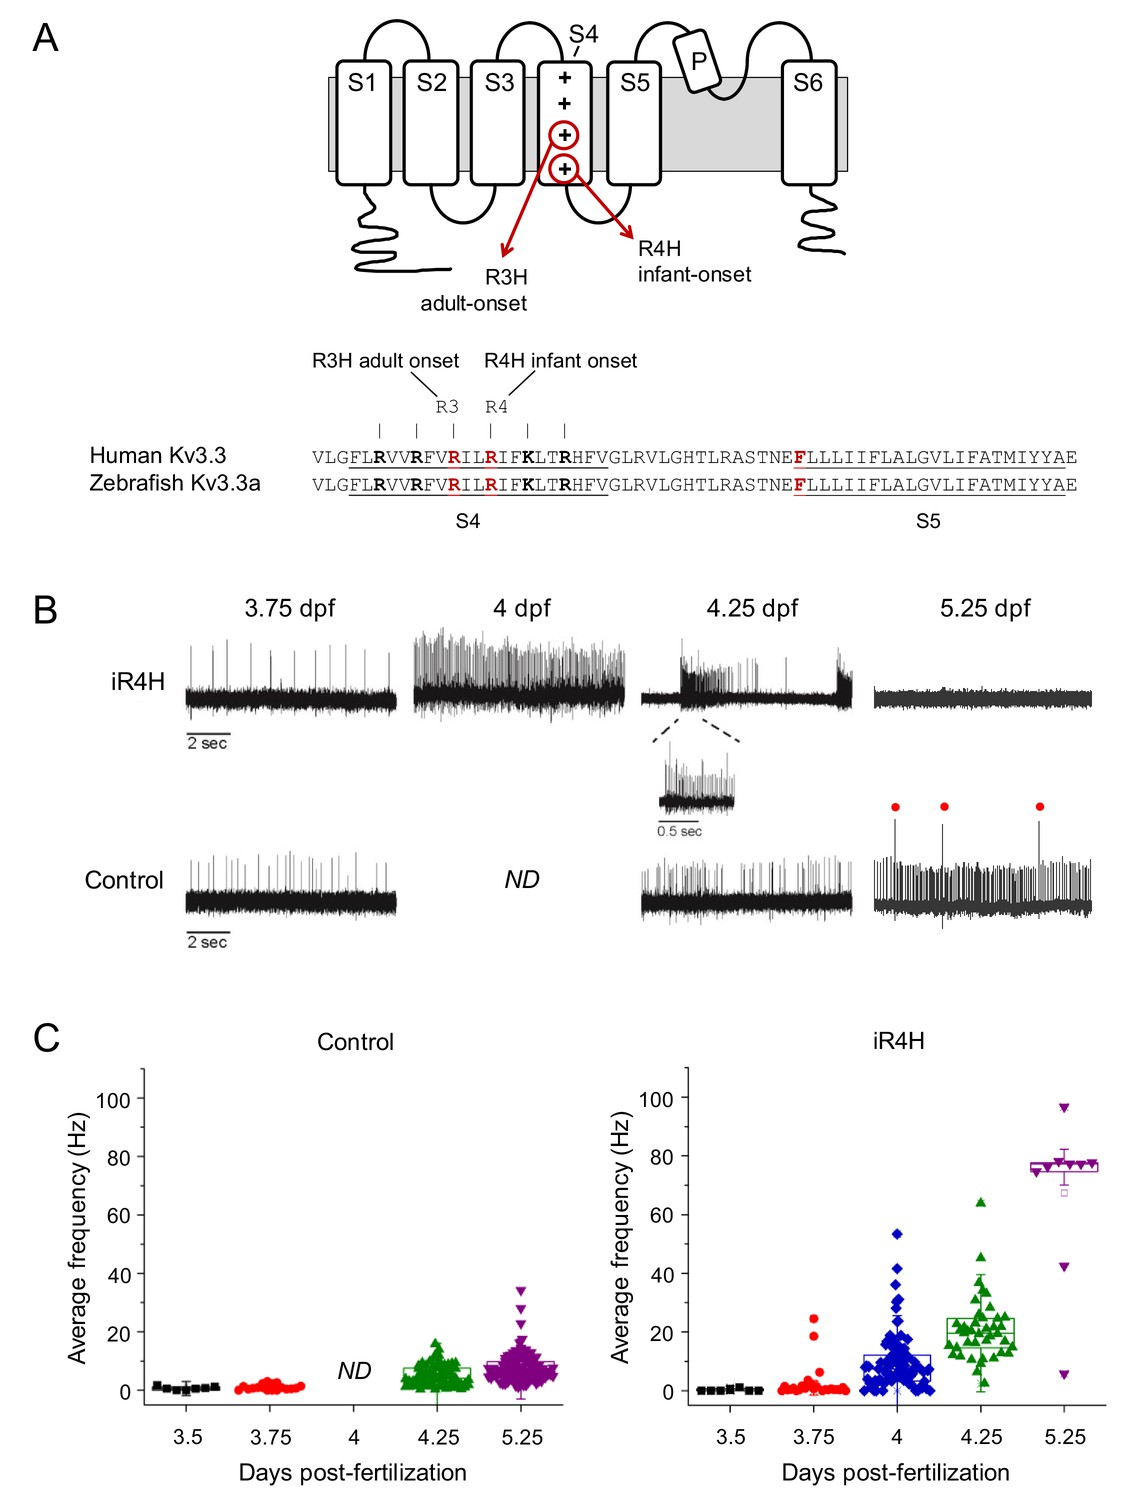
iR4H expression dramatically and transiently increases Purkinje cell excitability.
(A) Top: cartoon of membrane topology of one Kv3.3 subunit shows transmembrane segments S1-S6, re-entrant P loop, and approximate locations of the adult-onset R3H and infant-onset R4H SCA13 mutations in S4. The plus signs in S4 represent the positively charged arginine residues that sense changes in voltage and initiate conformational changes that result in pore opening (Seoh et al., 1996). The aR3H mutation corresponds to R420H and R335H in human and zebrafish Kv3.3, respectively (Mock et al., 2010). The iR4H mutation corresponds to R423H and R338H in human and zebrafish Kv3.3, respectively (Mock et al., 2010). Bottom: alignment shows the identity of S4, S4-S5 linker, and S5 sequences from human Kv3.3 and zebrafish Kv3.3a. The underlined and bolded residues shown in red indicate the locations of aR3H and iR4H in S4, and the location of a phenylalanine residue at position 448 (F448) in human Kv3.3. The mutation F448L (iFL), mentioned in the text, causes infant-onset SCA13 (Waters et al., 2006). (B) Representative loose patch recordings of spontaneous firing in Purkinje cells at different times between 3.75 and 5.25 dpf, as indicated (Hsieh et al., 2014). Upper row: Purkinje cells expressing iR4H. Lower row: control Purkinje cells. A portion of the trace recorded from an iR4H-expressing cell at 4.25 dpf is shown on an expanded time scale to illustrate an interval of high frequency firing. Red dots: complex spikes. ND: not done. (C) Average frequency of simple spikes was calculated from individual 10 s traces and plotted versus the recording time post-fertilization. Each symbol represents a trace. For control cells, mean firing frequencies ± SEM were 0.7 ± 0.2, 1.0 ± 0.2, 5.1 ± 0.4, and 7.7 ± 0.5 Hz at 3.5, 3.75, 4.25, and 5.25 dpf, respectively (n = 7–117). No recordings from control cells were made at the 4 dpf time point. For iR4H-expressing cells, mean firing frequencies ± SEM were 0.3 ± 0.2, 2.7 ± 1.2, 9.7 ± 1.0, 20.8 ± 1.7, and 67.4 ± 9.0 Hz at 3.5, 3.75, 4, 4.25, and 5.25 dpf, respectively (n = 7–92). Note that most iR4H-expressing Purkinje cells were electrically silent at 5.25 dpf. Data are shown only for those cells that fired at that time point. Average frequency of simple spikes differed significantly between control and iR4H-expressing Purkinje cells at 4.25 (p=8.3×10⁻²¹) and 5.25 dpf (p=3.7×10−42) by two-sided unpaired t-test. Histograms that compare firing frequencies in control and iR4H-expressing cells are provided in Figure 1—figure supplement 2A. The fold-change in firing frequencies of iR4H-expressing cells compared to control cells is shown in Figure 1—figure supplement 2B. Average firing frequencies in control cells are shown on an expanded frequency scale in Figure 1—figure supplement 3.
Figure 1—figure supplement 1
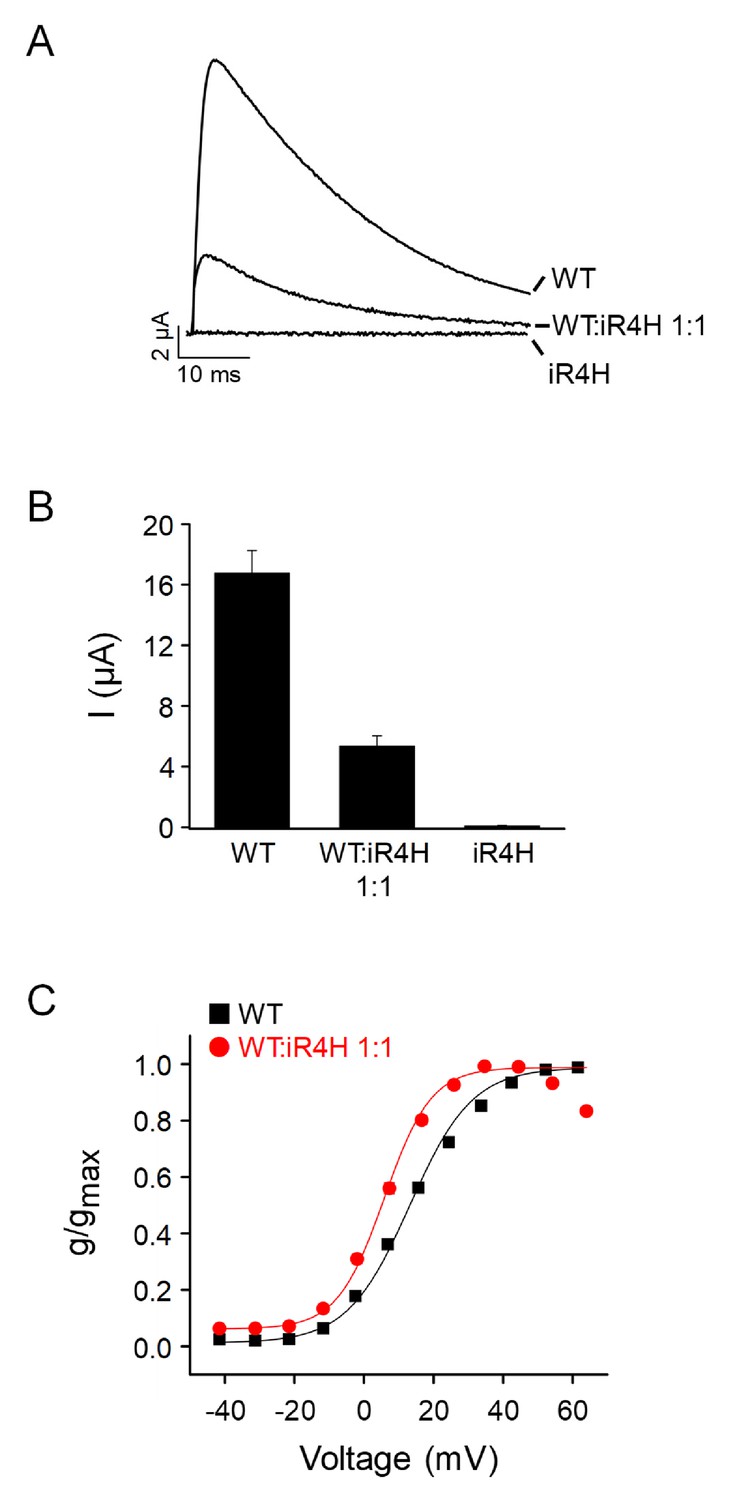
Functional effects of iR4H mutation are conserved in zebrafish Kv3.3.
Wild-type zebrafish Kv3.3a, iR4H, or a 1:1 mixture of wild type and iR4H RNAs were expressed in Xenopus oocytes for voltage clamp analysis. (A) iR4H is inactive when expressed alone and suppresses current amplitude when co-expressed with the wild type subunit. Currents were evoked by pulsing from a holding potential of –90 mV to +60 mV for 50 ms. Representative traces are shown for wild type alone, a 1:1 mixture of wild type and iR4H, or iR4H alone. (B) Average current amplitudes measured at +60 mV are shown after expression of wild type alone, a 1:1 mixture of wild type and iR4H, or iR4H alone. Values are provided as mean ± SEM. Note that the level of suppression at a 1:1 ratio, with 32.1% of the wild-type current amplitude remaining, is consistent with the prediction of the binomial distribution (31.2% wild-type current amplitude remaining) for the hypothesis that a channel formed from one mutant and three wild type subunits is active and expressed on the cell surface, whereas additional mutant subunits in the tetramer abolish activity (Minassian et al., 2012; Mock et al., 2010). (C) Incorporation of an iR4H mutant subunit results in a dominant shift in the voltage dependence of activation in the hyperpolarized direction. Normalized conductance for wild type expressed alone (black squares) or for wild type and iR4H expressed at a 1:1 ratio (red circles) has been plotted as a function of voltage. Data are provided as mean ± SEM. If error bars are not visible, they are smaller than the size of the symbol. Data were fitted with a Boltzmann function to estimate the midpoint voltage, V0.5, and the slope factor. Values of V0.5: wild type alone (n = 14), 13 ± 1 mV; 1:1 mixture (n = 14), 7 ± 1 mV. Values of slope factor: wild type alone (n = 14) 11 ± 1; 1:1 mixture (n = 14) 7 ± 0.3.
Figure 1—figure supplement 2
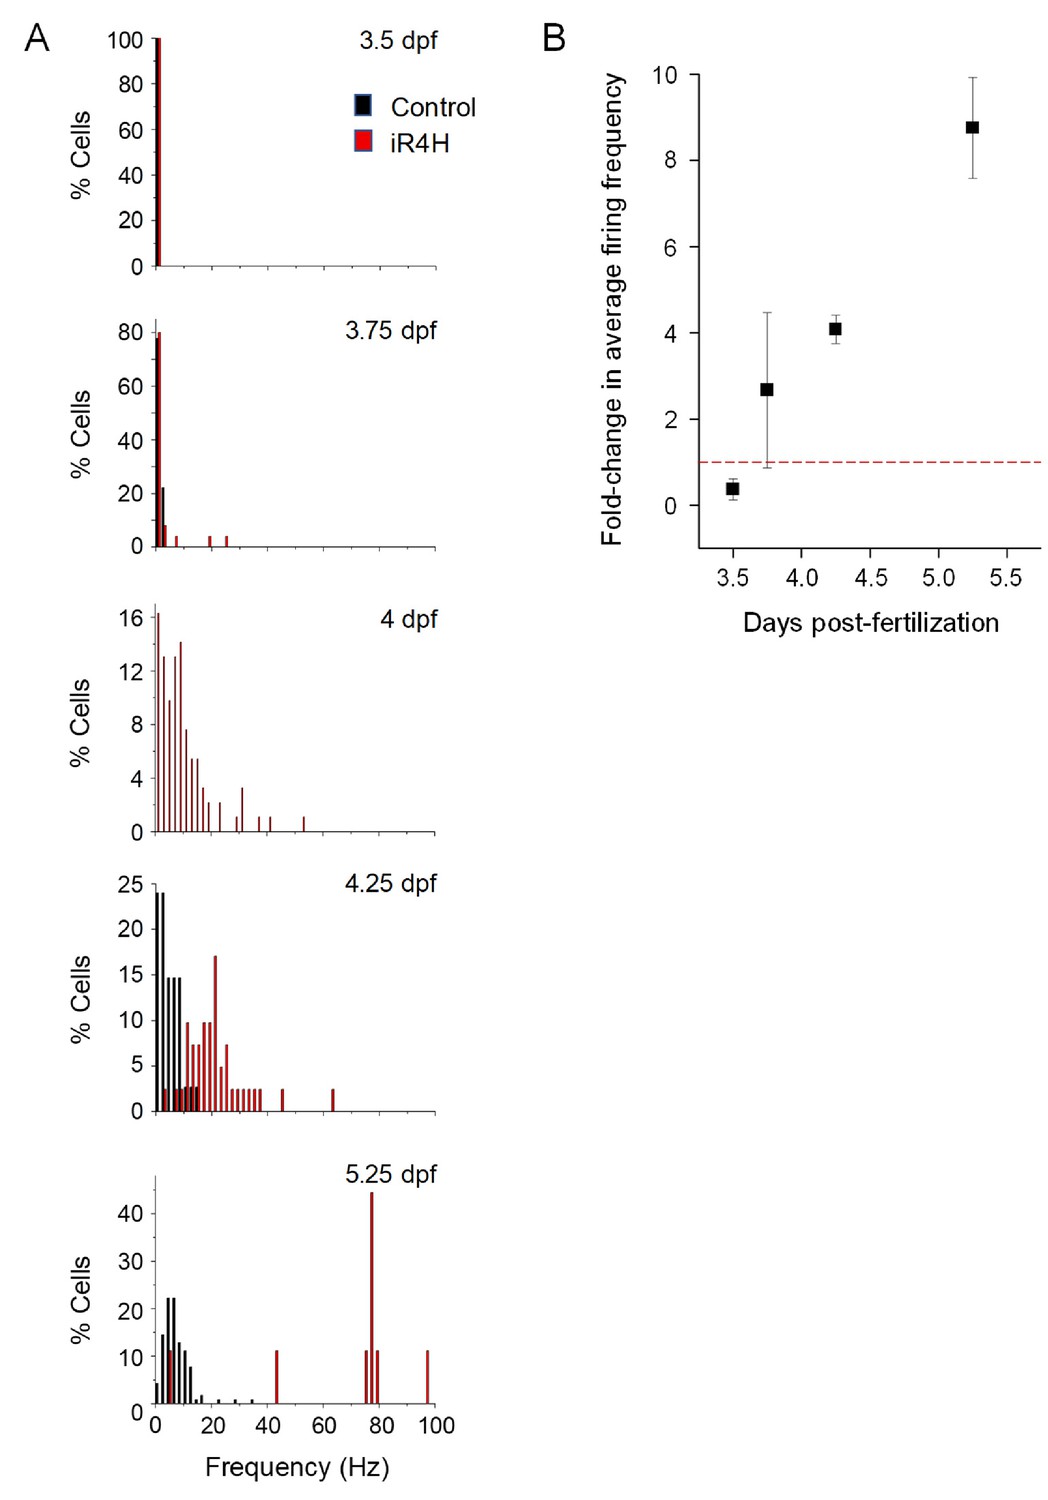
Expression of iR4H in Purkinje cells results in hyperexcitability.
(A) Histograms show the percentage of cells with the indicated average firing frequencies in 2 Hz bins at different times postfertilization. Black bars, control cells. Red bars, iR4H-expressing cells. Data are the same as shown in Figure 1C. No recordings were made from control cells at the four dpf time point. (B) The fold-change in average firing frequency in iR4H-expressing cells compared to control cells is shown as a function of time postfertilization time. Data are provided as mean ± SEM.
Figure 1—figure supplement 3
Average frequency of simple spikes in control Purkinje cells is shown as a function of time postfertilization.
Figure 2 with 3 supplements

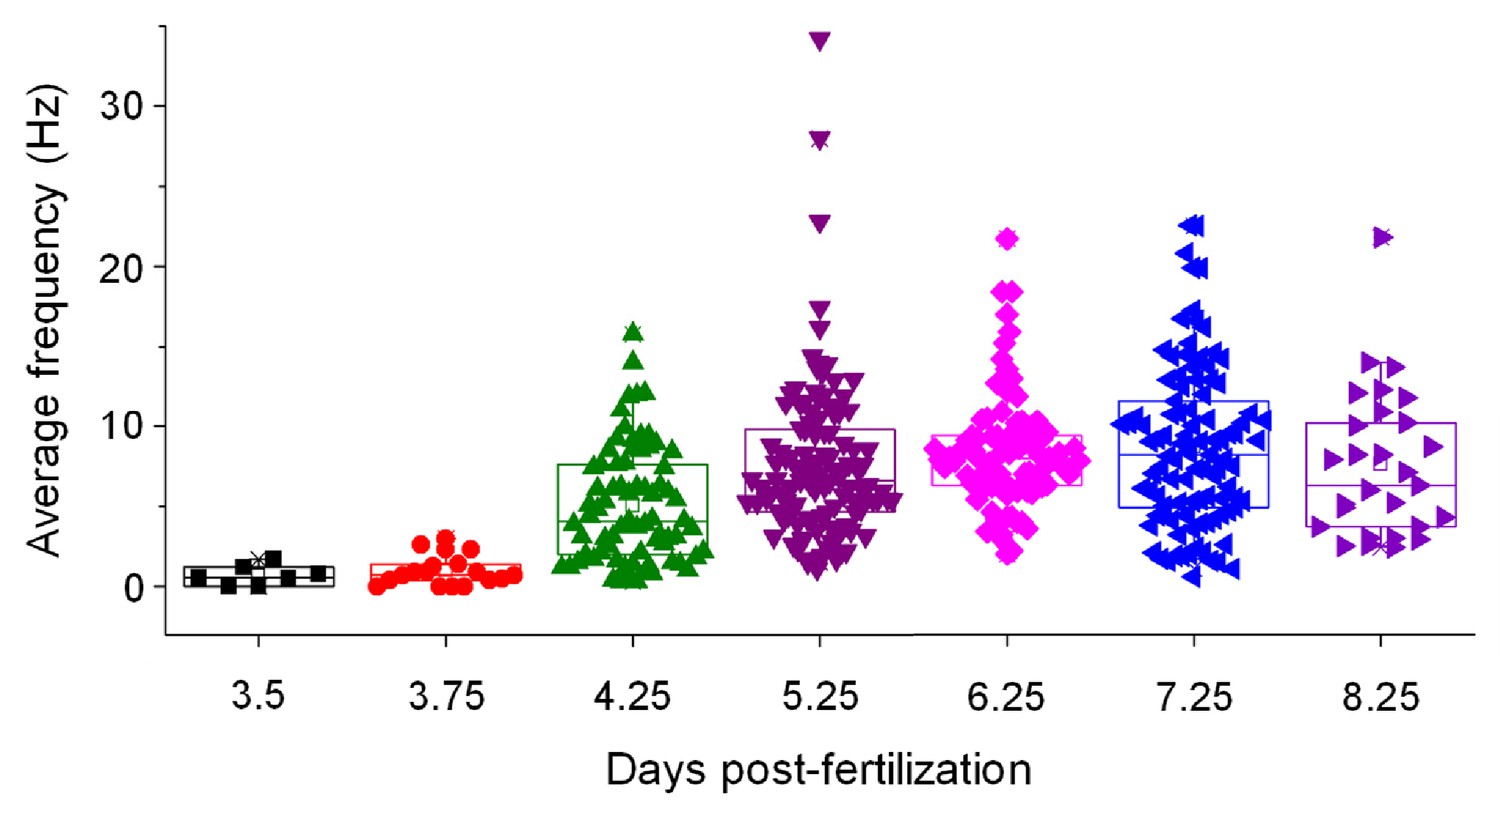
aR3H expression does not significantly alter Purkinje cell excitability under basal conditions.
(A) Representative loose patch recordings of spontaneous firing in Purkinje cells at 4.25, 5.25, and 6.25 dpf, as indicated (Hsieh et al., 2014). Upper row: Purkinje cells expressing aR3H. Lower row: control Purkinje cells. Red dots: complex spikes. (B) Average frequency of simple spikes was calculated from individual 10 s traces and plotted versus the recording time post-fertilization between 4.25 and 8.25 dpf, as indicated. Each symbol represents a trace. For control cells, mean firing frequencies ± SEM were 5.1 ± 0.4, 7.7 ± 0.5, 8.5 ± 0.4, 8.7 ± 0.5, and 7.6 ± 0.9 Hz at 4.25, 5.25, 6.25, 7.25, and 8.25 dpf, respectively (n = 29–117). Control data obtained at 4.25 and 5.25 dpf are the same as shown in Figure 1C and are repeated here for comparison to aR3H data. For aR3H-expressing cells, mean firing frequencies ± SEM were 3.8 ± 0.5, 6.5 ± 0.6, 10.1 ± 1.2, 7.8 ± 0.5, and 8.7 ± 6.2 Hz at 4.25, 5.25, 6.25, 7.25, and 8.25 dpf, respectively (n = 3–25). Values in control and aR3H-expressing cells did not differ significantly. Histograms that compare firing frequencies in control and aR3H-expressing cells are provided in Figure 2—figure supplement 1. The regularity of tonic firing was assessed by calculating CV2. The mean values ± SEM were 0.77 ± 0.04, 0.58 ± 0.02, 0.47 ± 0.02, 0.53 ± 0.02, and 0.63 ± 0.03 for control cells (n = 29–117) and 0.58 ± 0.06, 0.47 ± 0.12, 0.23 ± 0.05, 0.61 ± 0.2, and 0.52 for aR3H-expressing Purkinje cells (n = 2–25) at 4.25, 5.25, 6.25, 7.25, and 8.25 dpf, respectively. CV2 values in control versus aR3H cells differed significantly at 4.25 dpf (p=9.5×10⁻³) and 6.25 dpf (p=6.1×10⁻⁷) but not at other time points (p>0.05) by two-sided unpaired t-test.
Figure 2—figure supplement 1
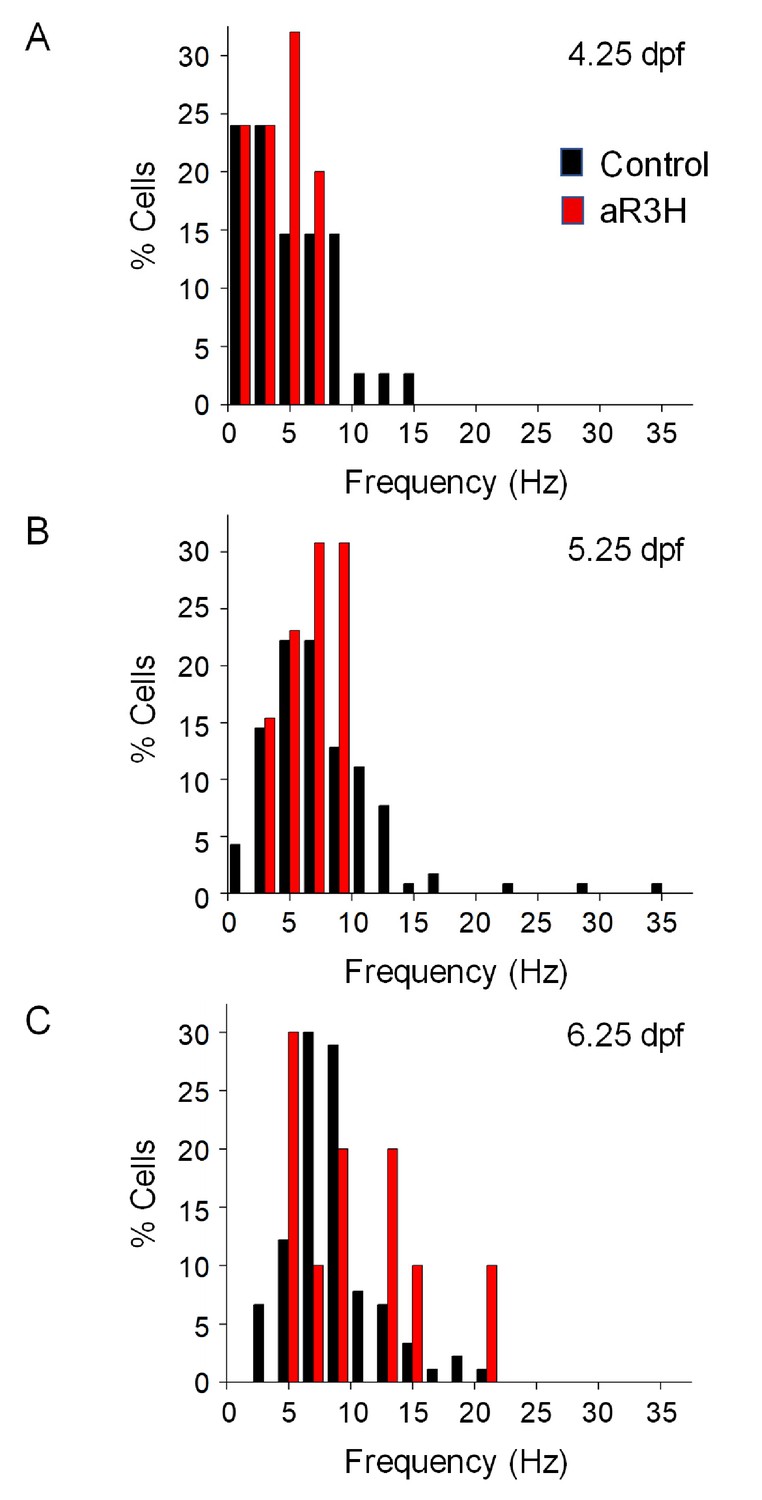
Expression of aR3H in Purkinje cells does not alter basal excitability.
Histograms show the percentage of cells with the indicated average firing frequencies in 2 Hz bins at different times postfertilization. Black bars, control cells. Red bars, aR3H-expressing cells. Data are the same as shown in Figure 2B.
Figure 2—figure supplement 2
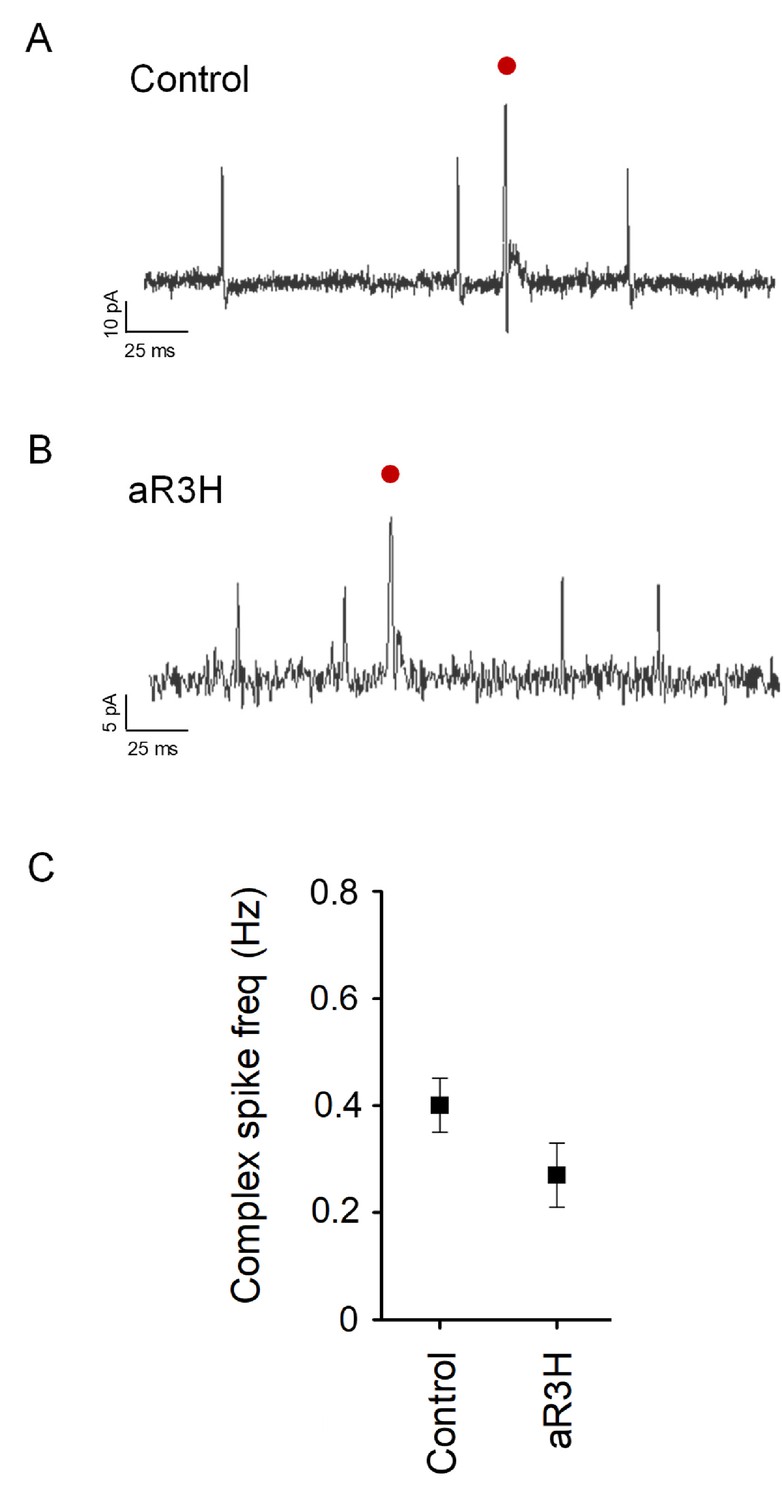
Average frequency of complex spiking is not significantly altered by expression of aR3H.
(A) and B) Representative complex spikes recorded in control (A) and aR3H-expressing (B) Purkinje cells are shown (red dots). (C) Graph shows mean complex spike frequency ± SEM at 5.25 dpf in control Purkinje cells and cells expressing aR3H. Mean frequencies were 0.40 ± 0.05 Hz in control cells (n = 20) and 0.27 ± 0.06 Hz in aR3H cells (n = 3). Values do not differ significantly by unpaired t-test (p=0.32).
Figure 2—figure supplement 3
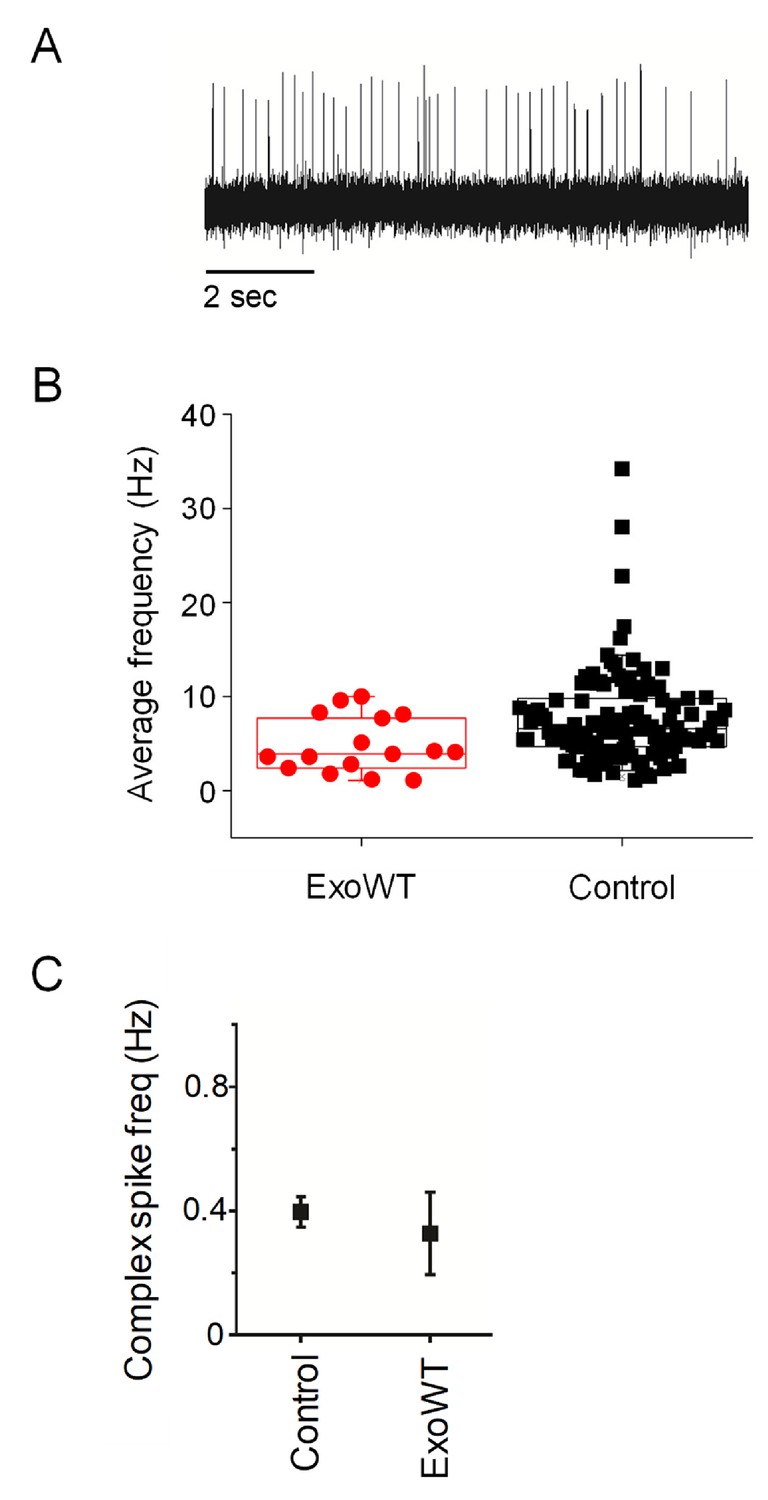
Expression of exogenous wild-type Kv3.3 (exoWT) does not significantly alter Purkinje cell excitability.
(A) A representative trace recorded at 5.25 dpf in a Purkinje cell expressing exoWT is shown. (B) Average frequency of simple spikes at 5.25 dpf was calculated from individual 10 s traces for control Purkinje cells and cells expressing exoWT. Each symbol represents a trace. Control data obtained at 5.25 dpf are the same as shown in Figure 1C and are repeated here for comparison to exoWT. For control cells, the mean firing frequency ± SEM was 7.7 ± 0.5 Hz (n = 117). For exo-WT-expressing cells, the mean firing frequency ± SEM was 4.8 ± 0.7 Hz (n = 16). (C) Average frequency of complex spiking is shown for control and exoWT-expressing Purkinje cells at 5.25 dpf. Values, provided as mean ± SEM, were 0.4 ± 0.05 Hz in control cells and 0.3 ± 0.1 Hz in exo-WT expressing cells. Control data obtained at 5.25 dpf are the same as shown in Figure 2—figure supplement 2C and are repeated here for comparison to exoWT.
Figure 3

aR3H expression results in frequency-dependent hypoexcitability in Purkinje cells.
At 5 dpf, live zebrafish were adapted to a LED light, which was turned off at time 0 s (Hsieh et al., 2014). (A) Representative recordings from a control Purkinje cell (left) and a Purkinje cell expressing aR3H (right) before and after turning off the LED are shown. Time 0 s is indicated by dashed vertical lines. (B) Raster plots show firing of simple spikes (black) and complex spikes (red) before and after turning off the LED at time 0 s (dashed vertical lines) for control cells (left) and aR3H-expressing cells (right). Each row represents a different trial. Data were obtained from 8 control cells in 5 animals and 8 aR3H-expressing cells in 4 animals. (C) The average frequency of tonic firing per 100 ms interval was normalized to the average frequency calculated over the 10 s period before turning the LED off at time 0 s (dashed vertical lines). The fold-change in frequency from all trials was averaged and plotted versus time for control (left) and aR3H-expressing (right) Purkinje cells (blue lines; n = 8 control cells, n = 8 aR3H-expressing cells). The gray shaded areas represent the SEM. The solid red horizontal line indicates the original firing frequency before the imposition of sudden darkness.
Figure 4 with 1 supplement
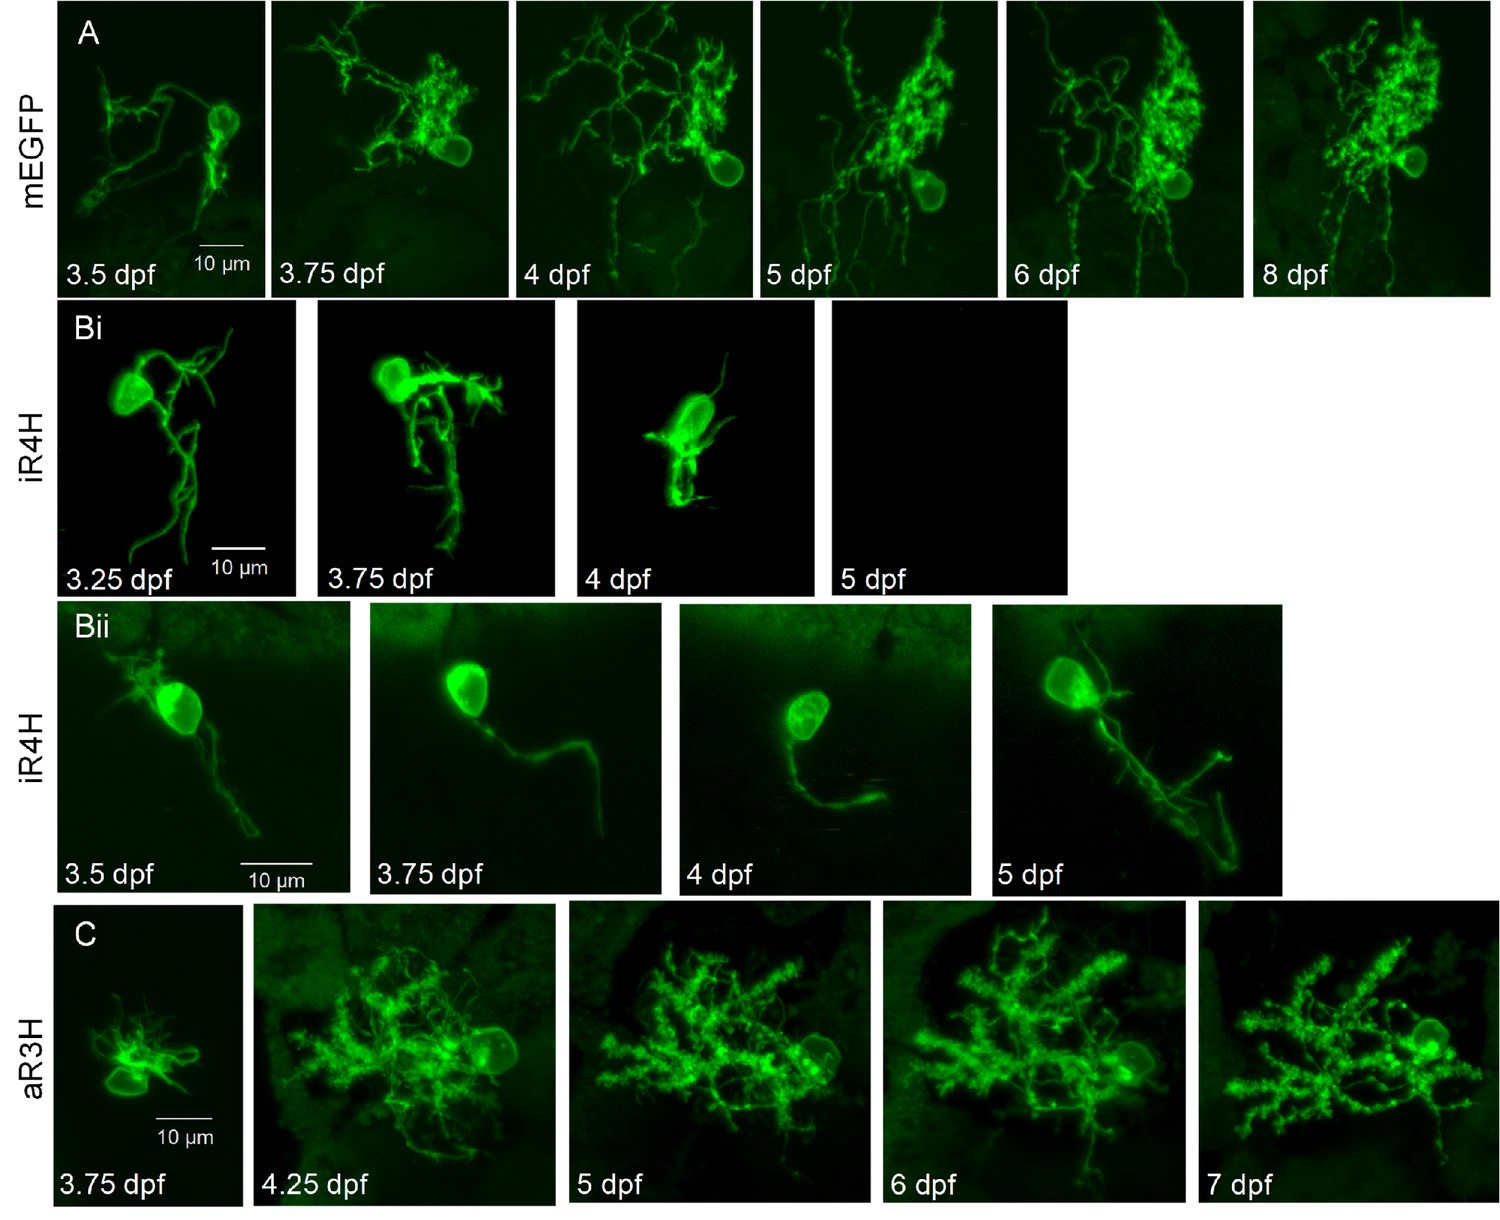
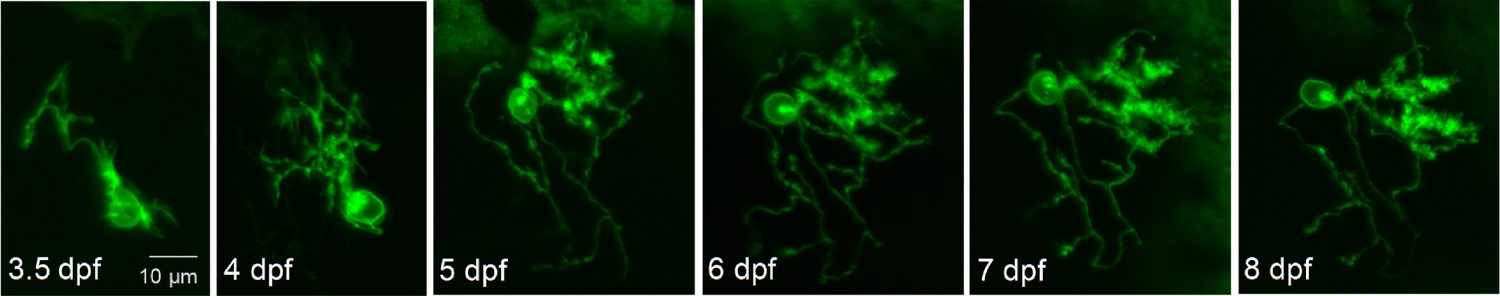
Expression of iR4H but not aR3H dramatically disrupts Purkinje cell maturation during cerebellar development in vivo.
Live images of individual Purkinje cells during cerebellar development in vivo were acquired using a laser scanning confocal microscope at different times post-fertilization as indicated. Shown are maximum intensity projections of stacks of 1 μm optical sections for A) a control Purkinje cell expressing mEGFP, Bi and Bii) two examples of Purkinje cells expressing iR4H and mEGFP, and C) a Purkinje cell expressing aR3H and mEGFP. In Bi, the cell was no longer visible at 5 dpf. Scale bar: 10 μm.
Figure 4—figure supplement 1
Expression of exogenous wild-type Kv3.3 (exoWT) does not significantly alter Purkinje cell maturation.
Live images of a Purkinje cell expressing exogenous wild type Kv3.3 were acquired during cerebellar development in vivo using a laser scanning confocal microscope at different times post-fertilization as indicated. Maximum intensity projections of stacks of 1 μm optical sections are shown. Scale bar: 10 μm.
Figure 5 with 2 supplements
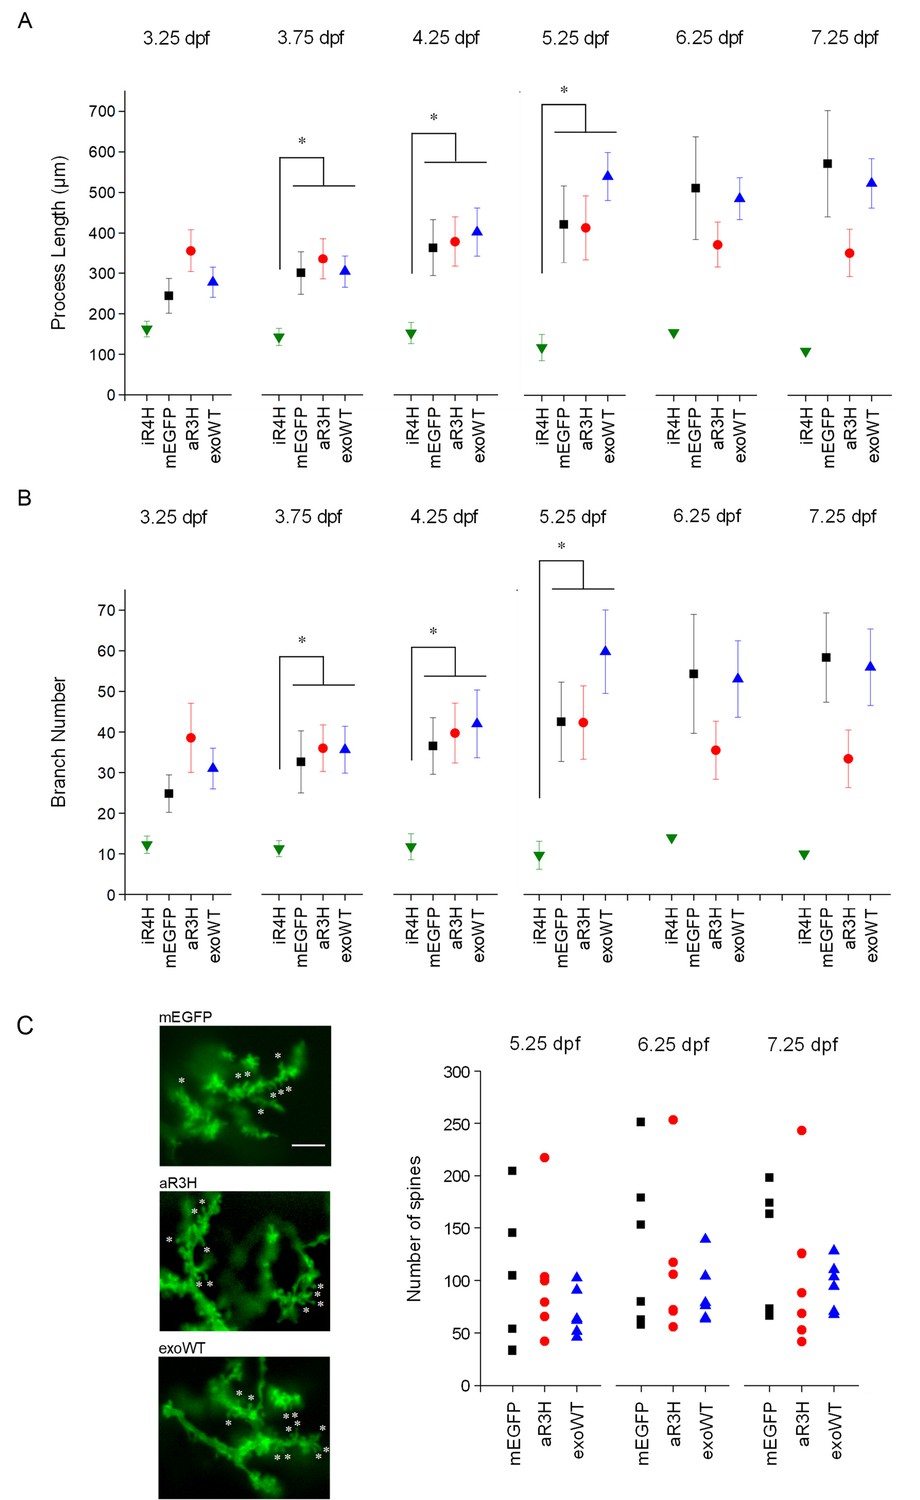
iR4H but not aR3H or exoWT significantly alters Purkinje cell maturation and postsynaptic development during cerebellar development in vivo.
Images of individual Purkinje cells expressing mEGFP alone (mEGFP) (n = 11) or in combination with iR4H (n = 12), aR3H (n = 11), or exogenous wild type Kv3.3 (exoWT) (n = 11) were traced and quantified using Imaris software. (A) Total process length at different times post-fertilization is shown. Data are provided as mean ± SEM. Note that there were too few iR4H-expressing cells to calculate SEM values after 5.25 dpf (see Figure 6A). (B) The total number of branches at different times post-fertilization is shown. Data are provided as mean ± SEM. Note that there were too few iR4H-expressing cells to calculate SEM values after 5.25 dpf (see Figure 6A). In A and B, statistical analyses were performed using SPSS software (IBM, Armonk NY). Linear mixed model was applied to log10-transformed data followed by Bonferroni post-hoc test. *, p<0.05. At 3.75, 4.25, and 5.25 dpf, values for iR4H-expressing cells differed significantly from those for mEGFP-, aR3H-, and exoWT-expressing cells. Values for mEGFP-, aR3H-, and exoWT-expressing cells did not differ significantly from each other. Statistical analysis for iR4H was not performed at 6.25 and 7.25 dpf due to the small number of surviving cells. (C) Left: Images acquired at 7.25 dpf show dendritic spines in Purkinje cells expressing mEGFP alone (top) or with aR3H (middle) or exoWT (bottom). A subset of spines is marked with ‘*’. Scale bar = 5 μm. Right: Dendritic spines were counted in triplicate using ImageJ at 5.25, 6.25, and 7.25 dpf for cells expressing mEGFP alone (n = 6) or with aR3H (n = 6) or exoWT (n = 6). The three values were averaged to estimate the number of spines in individual cells. Each symbol indicates the averaged spine count for a single cell. Mean spine numbers from all the cells in each group ± SEM were: mEGFP-expressing cells, 96 ± 28 at 5.25 dpf, 130 ± 32 at 6.25 dpf, 124 ± 25 at 7.25 dpf; aR3H-expressing cells, 101 ± 25 at 5.25 dpf, 112 ± 30 at 6.25 dpf, 103 ± 30 at 7.25 dpf; exoWT-expressing cells, 69 ± 9 at 5.25 dpf, 87 ± 12 at 6.25 dpf, 96 ± 10 at 7.25 dpf. The mean number of spines did not differ significantly at any time point in cells expressing mEGFP alone or with aR3H or exoWT. iR4H-expressing cells were not included in this analysis because of the scarcity of dendritic spines (see Figure 4B).
Figure 5—figure supplement 1
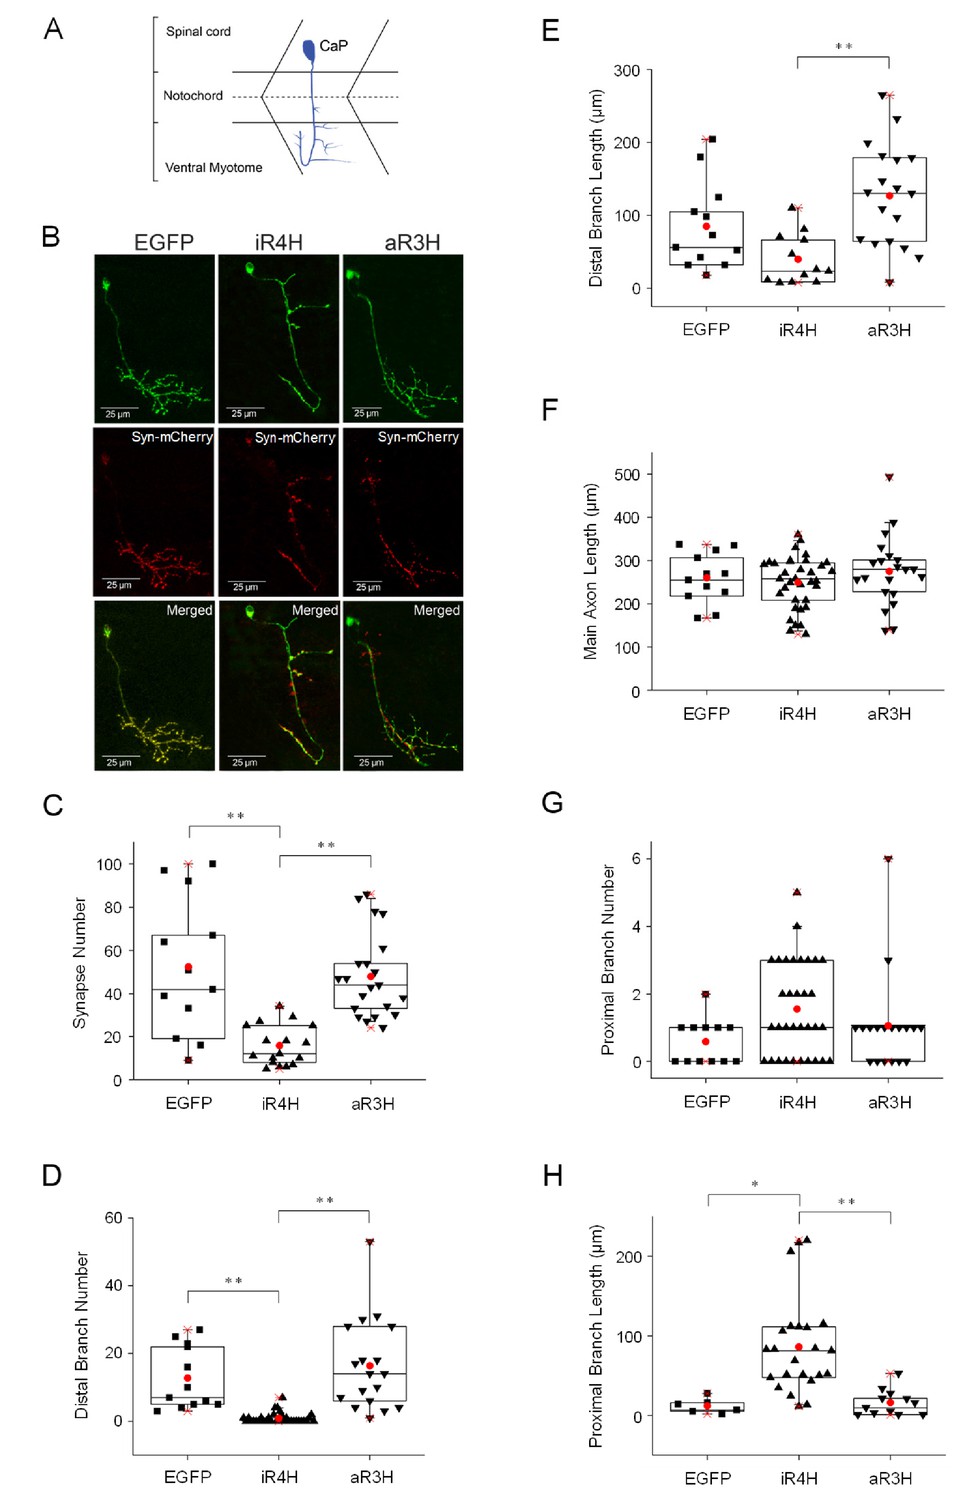
iR4H but not aR3H significantly impairs presynaptic development.
(A) The cartoon illustrates the stereotyped morphology of CaP motor neurons, which have a large cell body located dorsally in the spinal cord and an axon that grows into the ventral myotome where it branches and forms synapses on fast twitch muscle fibers (Myers et al., 1986; Westerfield et al., 1986). (B) EGFP (left column), or iR4H (middle column) or aR3H (right column) fusion proteins with EGFP (green) were co-expressed in motor neurons with a presynaptic marker, synaptophysin-mCherry (Syn-mCherry, red). Live images of CaP motor neurons were obtained at 48 hpf using a laser scanning confocal microscope. Representative maximum intensity projections are shown. Top row, EGFP fluorescence; middle row, mCherry fluorescence; bottom row, merged images. Images were traced for three-dimensional reconstruction and synapses were counted using Imaris software. (C–H) Panels show mean values ± SEM obtained from traced images for (C) synapse number; (D) distal branch number, where distal indicates below the midline (dashed line in cartoon shown in part A); (E) distal branch length; (F) length of the main axon shaft; (G) proximal branch number, where proximal indicates at or above the midline (dashed line shown in cartoon in part A); and (H) proximal branch length. Statistical significance was assessed by one-way ANOVA Kruskal-Wallis test, followed by Dunn’s multiple comparison test. *, p<0.05; **, p<0.01. EGFP, n = 12 neurons; iR4H, n = 33 neurons; aR3H, n = 19 neurons.
Figure 5—figure supplement 2
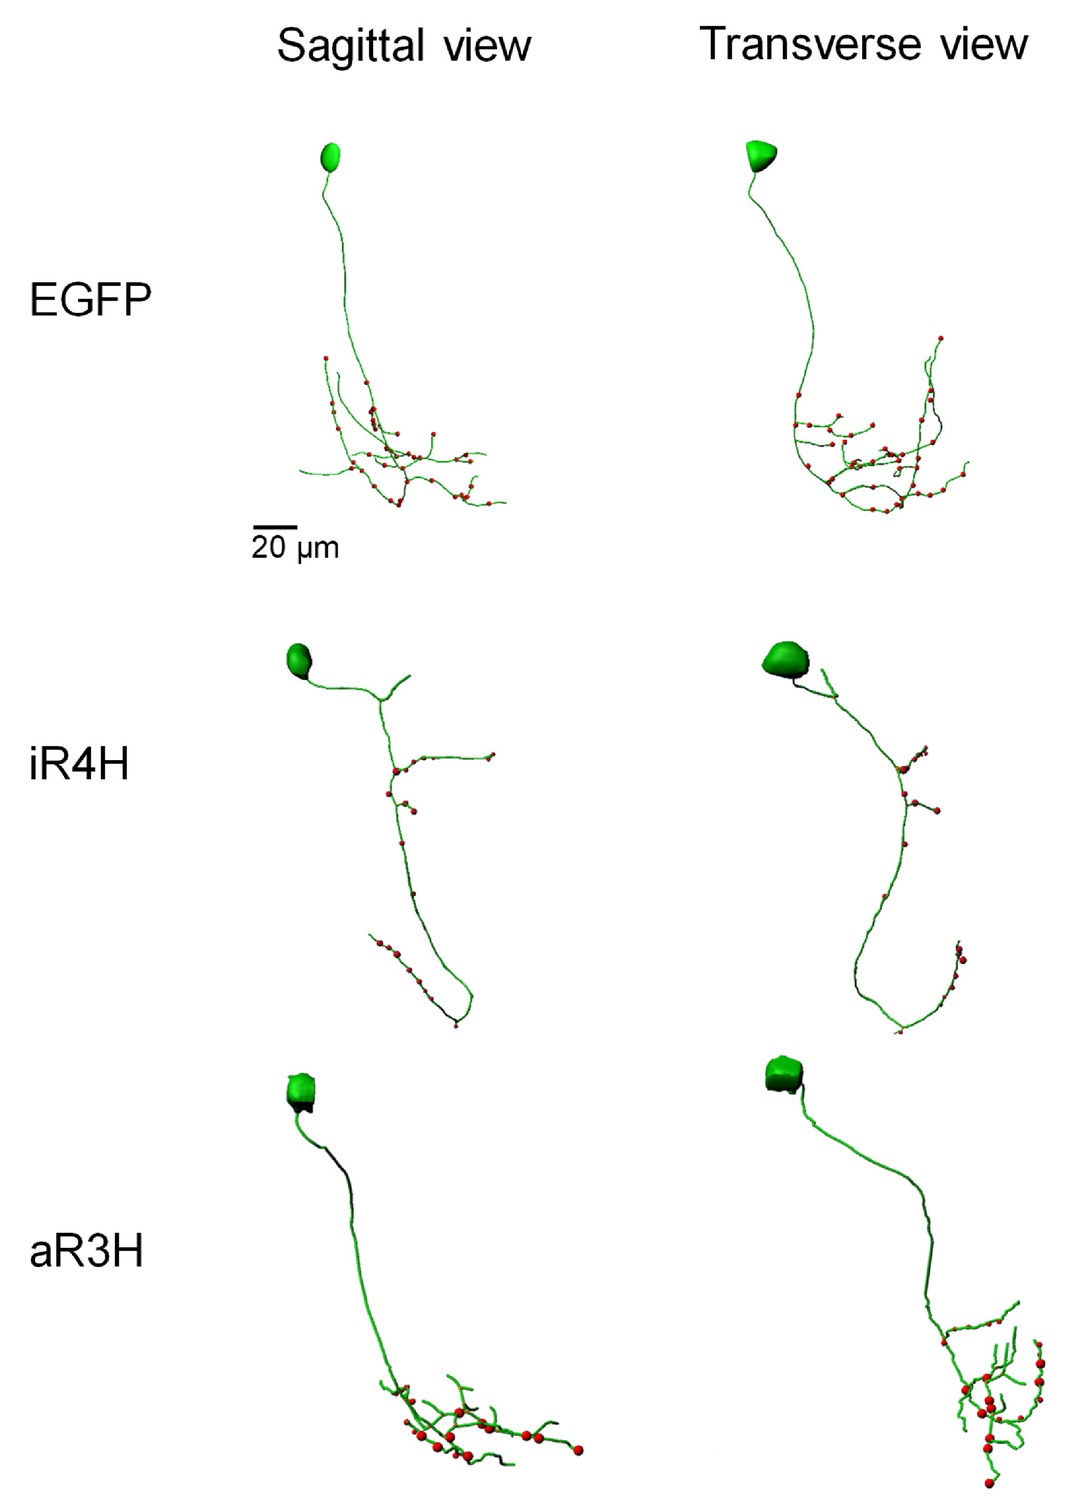
iR4H disrupts distal branching and synaptogenesis in the axonal compartment of CaP motor neurons.
Representative confocal image stacks of CaP neurons expressing EGFP, or EGFP fusion proteins of iR4H or aR3H were traced using Imaris software. Projected traces are shown from sagittal and transverse perspectives. Red dots indicate presynaptic specializations labeled by a co-expressed synaptophysin-mCherry fusion protein.
Figure 6 with 1 supplement

Suppression of hyperexcitability increases the early survival of iR4H-expressing Purkinje cells.
(A) Individual Purkinje cells expressing (from left to right) mEGFP alone or with iR4H, aR3H, or exogenous wild-type Kv3.3 (exoWT) were repeatedly imaged in living zebrafish at different times post-fertilization as indicated. Each row corresponds to an individual cell. Each symbol indicates the persistence of individual cells at different observation times during cerebellar development. (B) Acute application of 10 or 20 μM NS13001 during patch clamp recording decreased firing frequency in control Purkinje cells at 6 dpf. Left, representative traces recorded in the absence (top) or presence of 10 μM (middle) or 20 μM (bottom) NS13001 are shown. Red dots: complex spikes. Right, average frequencies of tonic firing in control cells in 0, 10, and 20 μM NS13001 are shown. Each symbol represents a trace. Mean firing frequencies ± SEM were 8.5 ± 0.4 (n = 90), 3.2 ± 0.8 (n = 12), and 0.3 ± 0.1 (n = 24) in 0, 10, or 20 µM drug, respectively. Firing rates in 0, 10, and 20 µM NS13001 differed significantly by one-way ANOVA (F = 69.68, p=5.57×10⁻²¹) with post-hoc analysis by t-test (p values: 0 μM vs. 10 μM, 3.64 × 10⁻⁶; 0 μM vs. 20 μM, 1.04 × 10⁻¹⁹; 10 μM vs. 20 μM, 1.42 × 10⁻⁵). (C) Acute application of 10 μM NS13001 during patch clamp recording decreased firing frequency in iR4H-expressing Purkinje cells at 4 dpf. Left, representative traces recorded in the absence (top) or presence of 10 μM (bottom) NS13001 are shown. Right, average frequencies of tonic firing in iR4H-expressing cells in 0 and 10 μM NS13001 are shown. Each symbol represents a trace. Mean firing frequencies ± SEM were 9.7 ± 1 (n = 92) and 3.9 ± 0.6 (n = 25) in 0 and 10 µM NS13001, respectively. Firing rates in 0 and 10 µM NS13001 differed significantly by two-sided unpaired t-test, p=by 3.78 × 10⁻³. Firing frequencies in control and iR4H-expressing cells are not directly comparable because they were measured at different times post-fertilization. (D) and (E) Zebrafish were injected with plasmids encoding D) iR4H and mEGFP or E) mEGFP alone. Animals were chronically treated with 20 μM NS13001 (red symbols) or an equivalent amount of DMSO, the drug vehicle (black symbols), added to the aquarium water starting at 3.25 dpf. The number of Purkinje cells expressing (D) iR4H and mEGFP or (E) mEGFP alone was counted in each animal at different times post-fertilization as indicated. Data are presented as the mean number of expressing cells per animal ± SEM. Treatment with NS13001 significantly increased the number of iR4H-expressing Purkinje cells compared to DMSO treatment alone. *, p<0.05 by SPSS linear mixed model with Bonferroni post-hoc test. (F) Representative images of iR4H-expressing Purkinje cells in animals chronically treated with NS13001 (upper) or DMSO alone (lower) at different times post-fertilization, as indicated. (G) Representative images of mEGFP-expressing Purkinje cells in animals chronically treated with NS13001 (upper) or DMSO alone (lower) at different times post-fertilization, as indicated.
Figure 6—figure supplement 1
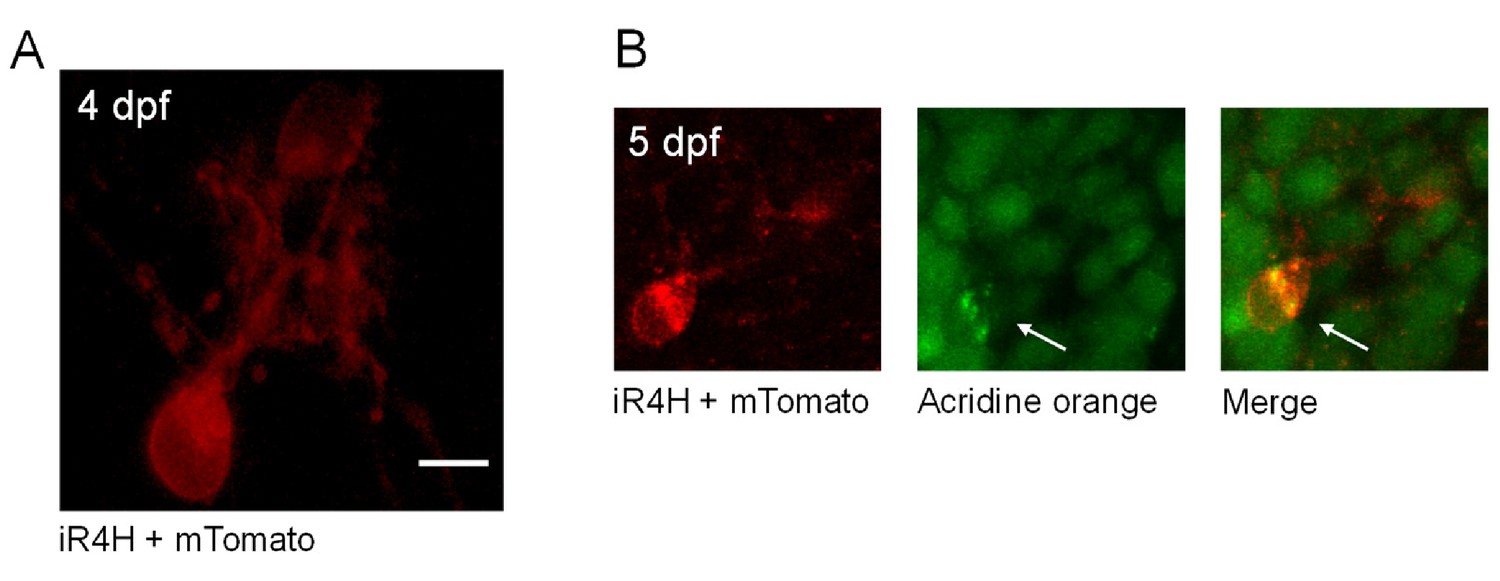
iR4H-expressing Purkinje cells die during cerebellar development in vivo.
(A) A live image of a Purkinje cell expressing iR4H and membrane-bound tdTomato (mTomato) is shown at 4 dfp. Scale bar = 5 μm. (B) At 5 dpf, the zebrafish was incubated in acridine orange and the cell was re-imaged. Left, mTomato; middle, acridine orange; right, merged image. In apoptotic cells, acridine orange appears as green puncta, which corresponds to the dye binding to condensed, fragmented chromatin (arrows) (Atale et al., 2014). Less intense green staining is present in nearby healthy cells that are not expressing iR4H and do not contain condensed, fragmented chromatin (Atale et al., 2014). Scale bar: 5 μm.
Videos
Video 1
Purkinje cell expressing mEGFP alone.
Live images of a representative Purkinje cell expressing mEGFP were acquired at different times post-fertilization and traced with Imaris software for three-dimensional digital reconstruction. Video shows rotating traces. Dendritic spines are not shown.
Video 2
Purkinje cell expressing iR4H and mEGFP.
Live images of a representative Purkinje cell expressing iR4H and mEGFP were acquired at different times post-fertilization and traced with Imaris software for three-dimensional digital reconstruction. Video shows rotating traces. Dendritic spines are not shown.
Video 3
Purkinje cell expressing aR3H and mEGFP.
Live images of a representative Purkinje cell expressing aR3H and mEGFP were acquired at different times post-fertilization and traced with Imaris software for three-dimensional digital reconstruction. Video shows rotating traces. Dendritic spines are not shown.
Video 4
Purkinje cell expressing exogenous wild-type Kv3.3 (exoWT) and mEGFP.
Live images of representative Purkinje cell expressing exoWT and mEGFP were acquired at different times post-fertilization and traced with Imaris software for three-dimensional digital reconstruction. Video shows rotating traces. Dendritic spines are not shown.
Tables
Key resources table
| Reagent type (species) or resource | Designation | Source or reference | Identifiers | Additional information |
|---|---|---|---|---|
| Gene (Dario rerio) | kcnc3a | GenBank | HQ118212.1 | |
| Strain, strain background (Dario rerio) | Tüpfel long fin nacre | Herwig Baier laboratory hbaier@neuro.mpg.de | Unpigmented wild type strain | |
| Genetic reagent (Dario rerio) | la118Tg:Tg(aldoca:gap43-Venus) | Hsieh et al., 2014 | Transgenic line | |
| Recombinant DNA reagent | pBluescript Kv3.3a wild type (plasmid) | Mock et al., 2010 | ||
| Recombinant DNA reagent | pBluescript Kv3.3a aR3H (plasmid) | Mock et al., 2010 | ||
| Recombinant DNA reagent | pBluescript Kv3.3a iR4H (plasmid) | This paper | See Materials and methods, section 2 | |
| Recombinant DNA reagent | pminiTol2-aldoca-Kv3.3a wild type-2A-mCherry (plasmid) | This paper | See Materials andmethods, section 2 | |
| Recombinant DNA reagent | pminiTol2-aldoca-Kv3.3a aR3H-2A-mCherry (plasmid) | This paper | See Materials and methods, section 2 | |
| Recombinant DNA reagent | pminiTol2-aldoca-Kv3.3a iR4H-2A-mCherry (plasmid) | This paper | See Materials and methods, section 2 | |
| Recombinant DNA reagent | pminiTol2-aldoca-mbEGFP (plasmid) | This paper | See Materials and methods, section 2 | |
| Recombinant DNA reagent | pminiTol2-aldoca-Kv3.3a wild type-2A-mbEGFP (plasmid) | This paper | See Materials and methods, section 2 | |
| Recombinant DNA reagent | pminiTol2-aldoca-Kv3.3a aR3H-2A-mbEGFP (plasmid) | This paper | See Materials and methods, section 2 | |
| Recombinant DNA reagent | pminiTol2-aldoca-Kv3.3a iR4H-2A-mbEGFP (plasmid) | This paper | See Materials and methods, section 2 | |
| Recombinant DNA reagent | pminiTol2-aldoca-Kv3.3a iR4H-2A-mbtdTomato (plasmid) | This paper | See Materials and methods, section 2 | |
| Recombinant DNA reagent | pTol2-gata2 min-(Mnx1 mne)3-EGFP (plasmid) | Issa et al., 2012 | ||
| Recombinant DNA reagent | pTol2-gata2 min-(Mnx1 mne)3-Kv3.3a aR3H-EGFP fusion (plasmid) | Issa et al., 2012 | ||
| Recombinant DNA reagent | pTol2-gata2 min-(Mnx1 mne)3-Kv3.3a iR4H-EGFP fusion (plasmid) | This paper | See Materials and methods, section 2 | |
| Recombinant DNA reagent | pminiTol2-gata2 min-(Mnx1 mne)3-Synaptophysin-mCherry fusion (plasmid) | This paper | See Materials and methods, section 2 | |
| Chemical compound, drug | NS13001 | ChemShuttle, Hayward CA | Cat. #: 104258 | SK channel agonist |
| Chemical compound, drug | Tricaine-S | Syndel, Ferndale WT | MS-222 | Pharmaceutical grade anesthetic |
| Chemical compound, drug | (+)-Tubocurarine hydrochloride pentahydrate | Sigma-Aldrich | T2379 | Paralytic drug |
Additional files
Download links
A two-part list of links to download the article, or parts of the article, in various formats.
Downloads (link to download the article as PDF)
Open citations (links to open the citations from this article in various online reference manager services)
Cite this article (links to download the citations from this article in formats compatible with various reference manager tools)
Infant and adult SCA13 mutations differentially affect Purkinje cell excitability, maturation, and viability in vivo
eLife 9:e57358.
https://doi.org/10.7554/eLife.57358


