ReporterSeq reveals genome-wide dynamic modulators of the heat shock response across diverse stressors
- Department of Biochemistry, Stanford University, United States
- Department of Biology, Stanford University, United States
- Department of Computer Science, Stanford University, United States
Figures
Figure 1 with 1 supplement
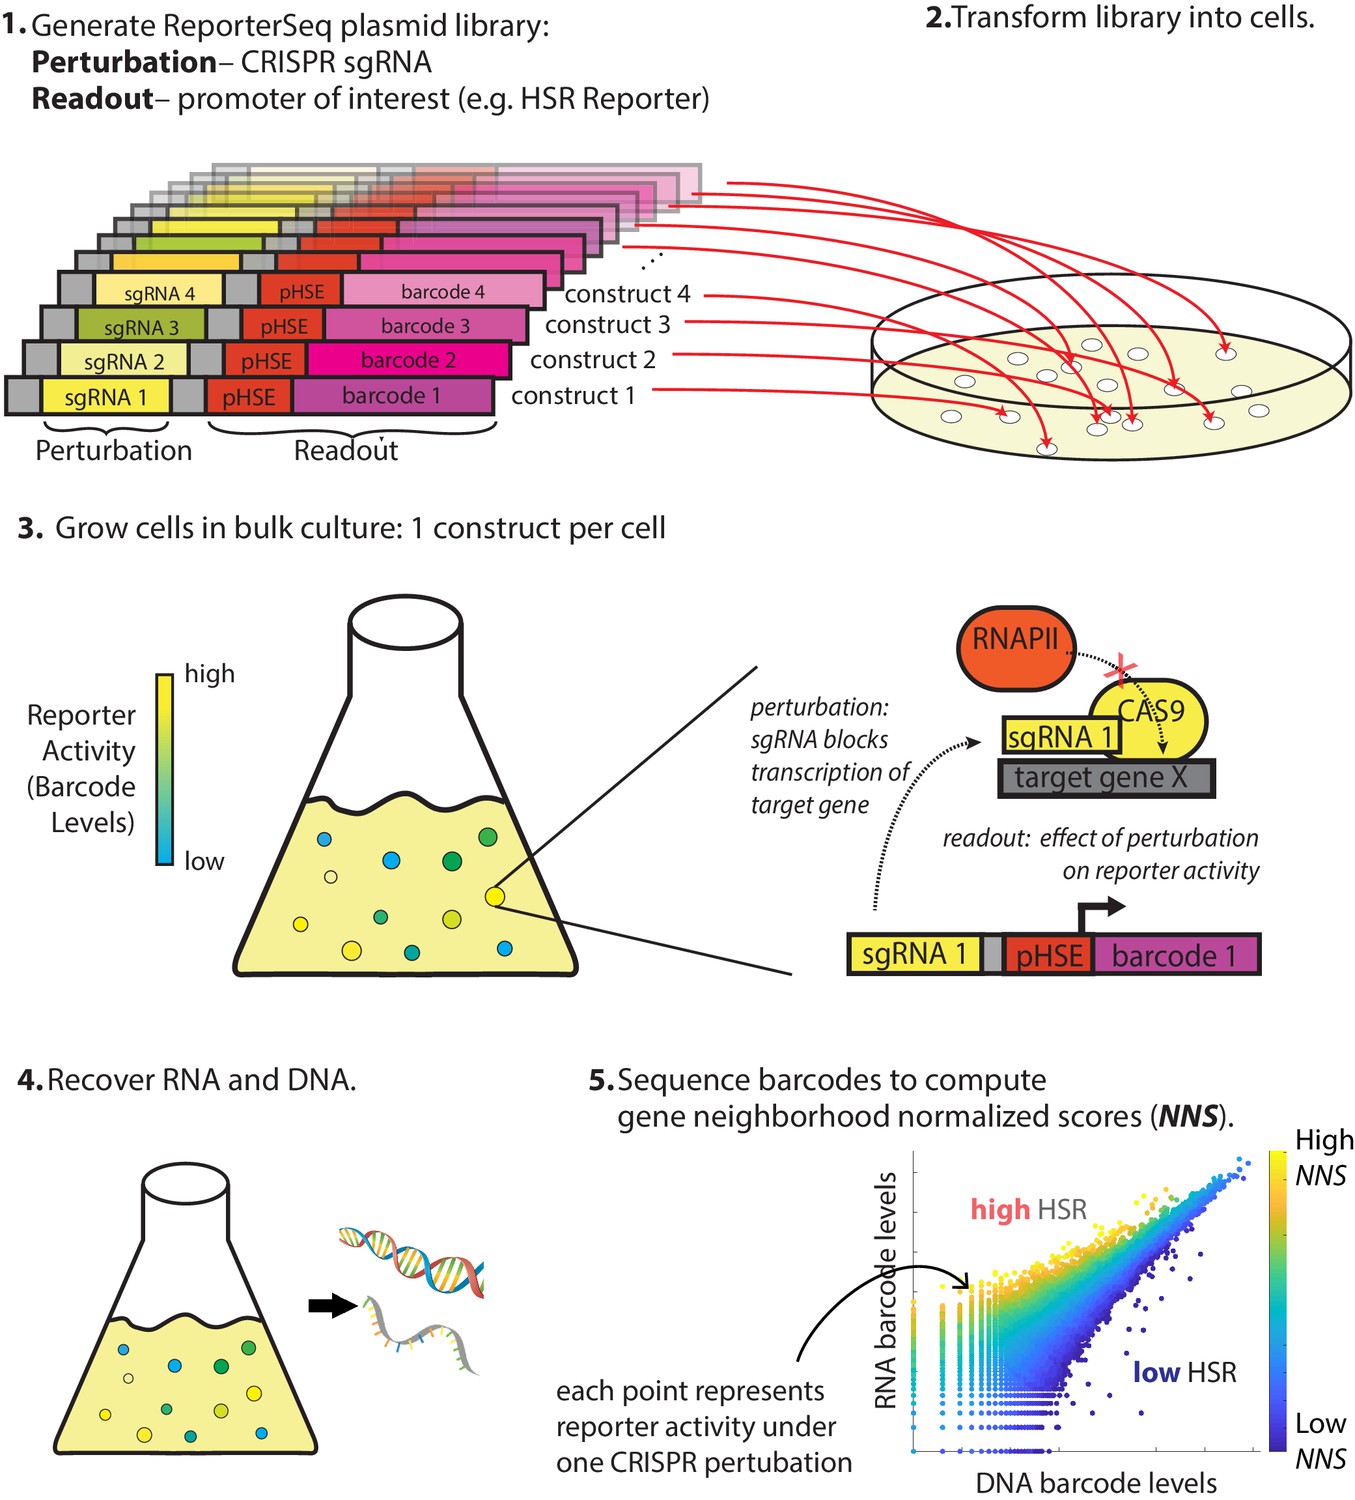
Overview of ReporterSeq method.
Example given for measuring the heat shock response (HSR) using a heat shock element (HSE)-driven promoter and CRISPRi to perturb gene expression. ReporterSeq measures the effect of genetic perturbations with the throughput of pooled screens and the precision of pathway-specific, transcriptional readouts.
Figure 1—figure supplement 1
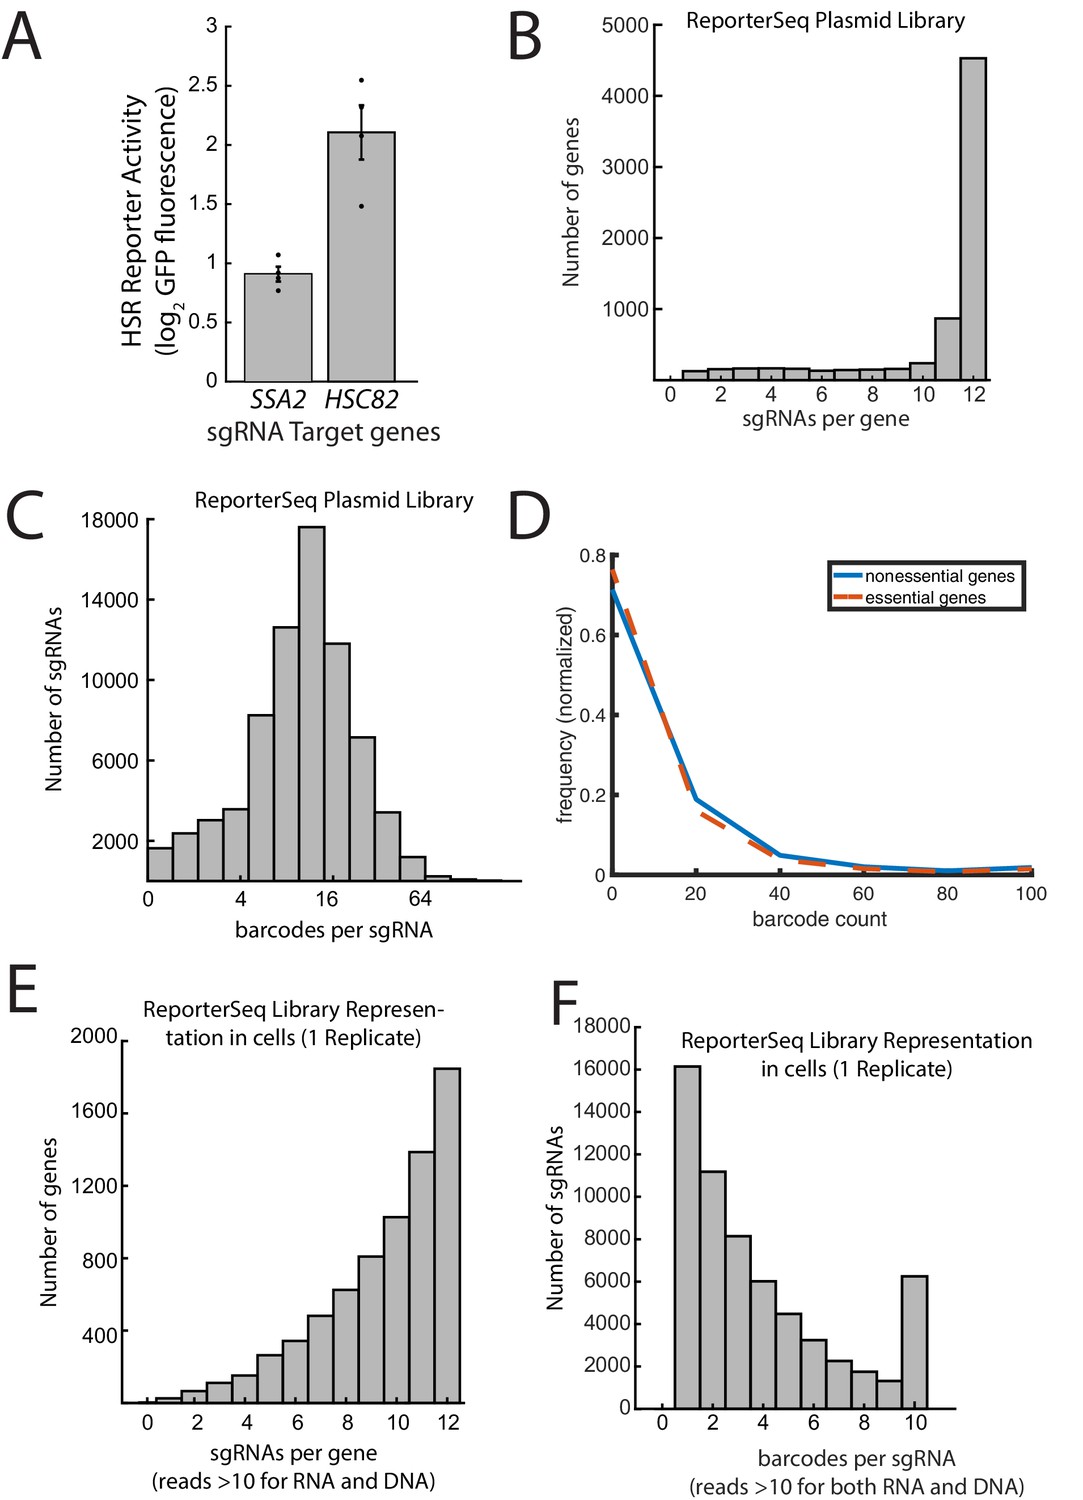
Diversity of ReporterSeq library.
(A) GFP fluorescence of yeast containing the pHSE-GFP synthetic Hsf1 reporter with the sgRNAs targeting the indicated genes. The fluorescence is relative to a non-targeting sgRNA. Error bars are standard errors of 4replicates. (B) Histogram of the number of sgRNAs targeting each gene found in the plasmid library through paired-end sequencing. The y-axis is a log base-2 scale of barcode counts. (D) Histogram of barcode counts for essential and nonessential genes. (E) Histogram of sgRNAs per gene in transfected cells with both DNA and RNA counts 10 or above. (F) Histogram of barcodes per sgRNA with both DNA and RNA counts 10 or above.
Figure 2 with 3 supplements
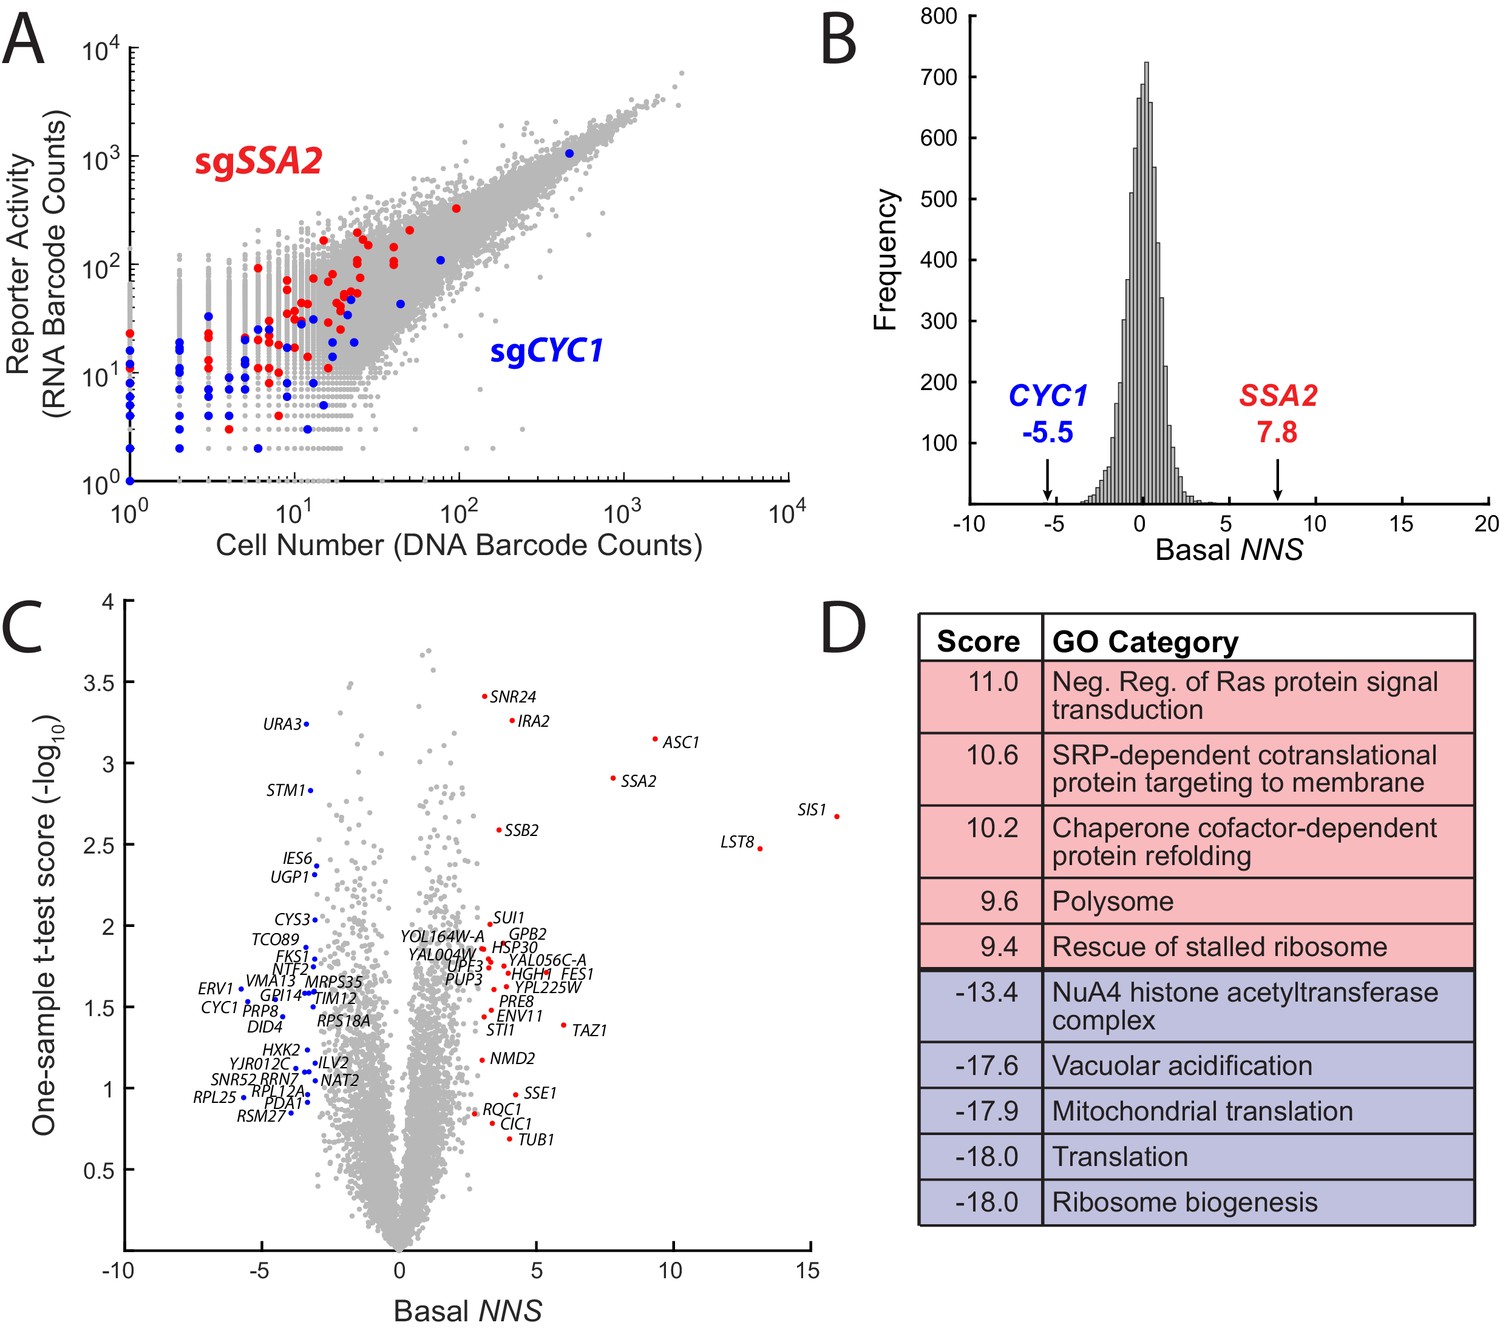
ReporterSeq reveals genome-wide basal regulators of the heat shock response.
(A) Comparison of DNA and RNA barcode counts from wild-type, untreated yeast. Red dots indicate barcodes that correspond to sgRNAs targeting the Hsp70 chaperone, SSA2. Blue dots indicate barcodes that correspond to sgRNAs targeting CYC1, a gene that shares significant homology with the Hsf1-driven synthetic reporter. (B) Histogram of the basal NNS for sgRNAs targeting each gene. NNS for SSA2 and CYC1 gene targets are indicated. (C) Plot of the basal NNS for every genetic knockdown. Outliers and genes mentioned in the text are labeled. (D) Table of the gene ontology (GO) categories with the five highest and five lowest scores in the basal screen.
Figure 2—figure supplement 1
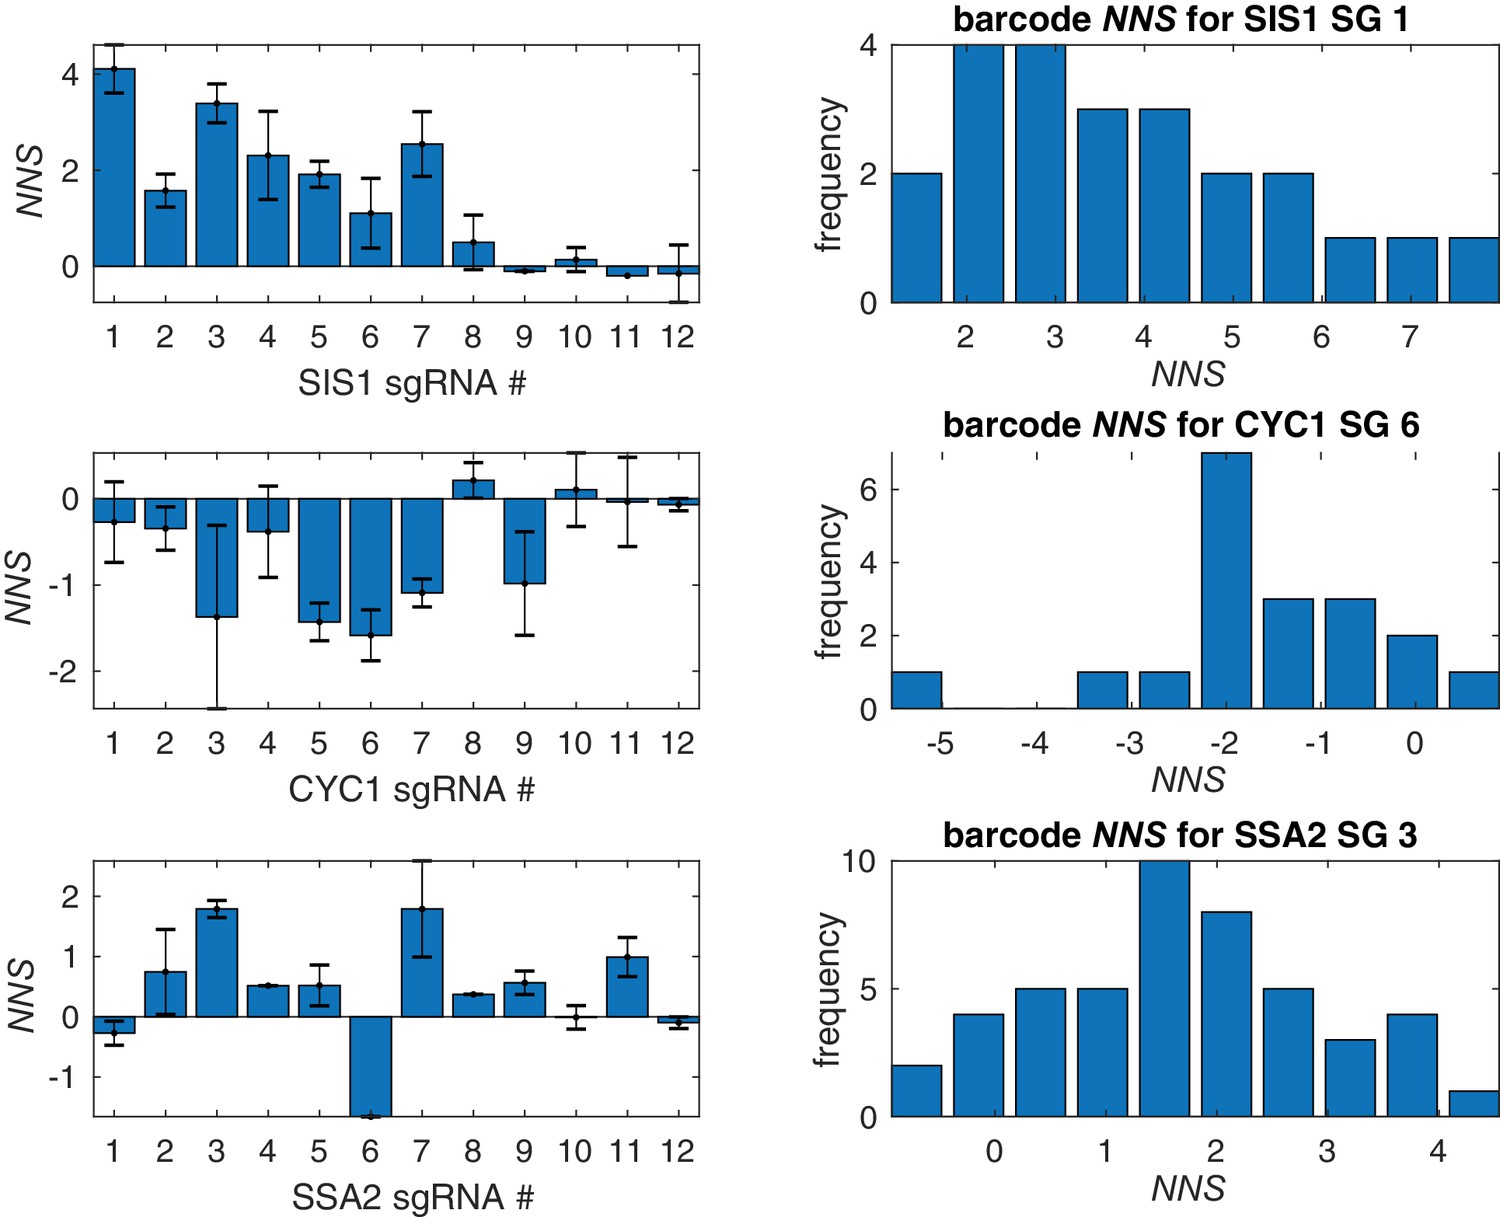
Barcode and sgRNA specific effects on HSR reporter.
Average HSR NNS for each of 12 sgRNAs for three top screen hits, SIS1, SSA2, and CYC1. For each gene, a histogram of barcode NNS for the top scoring sgRNA is shown. Error bars represent S.E.M.
Figure 2—figure supplement 2

Top hits are dependent upon HSE sequence of HSR reporter.
Levels of HSR reporter and matched control with HSE sequences removed, leaving only a cryppled CYC1 sequence, in selected deletion strains. Error bars represent S.E.M. of triplicates.
Figure 2—figure supplement 3
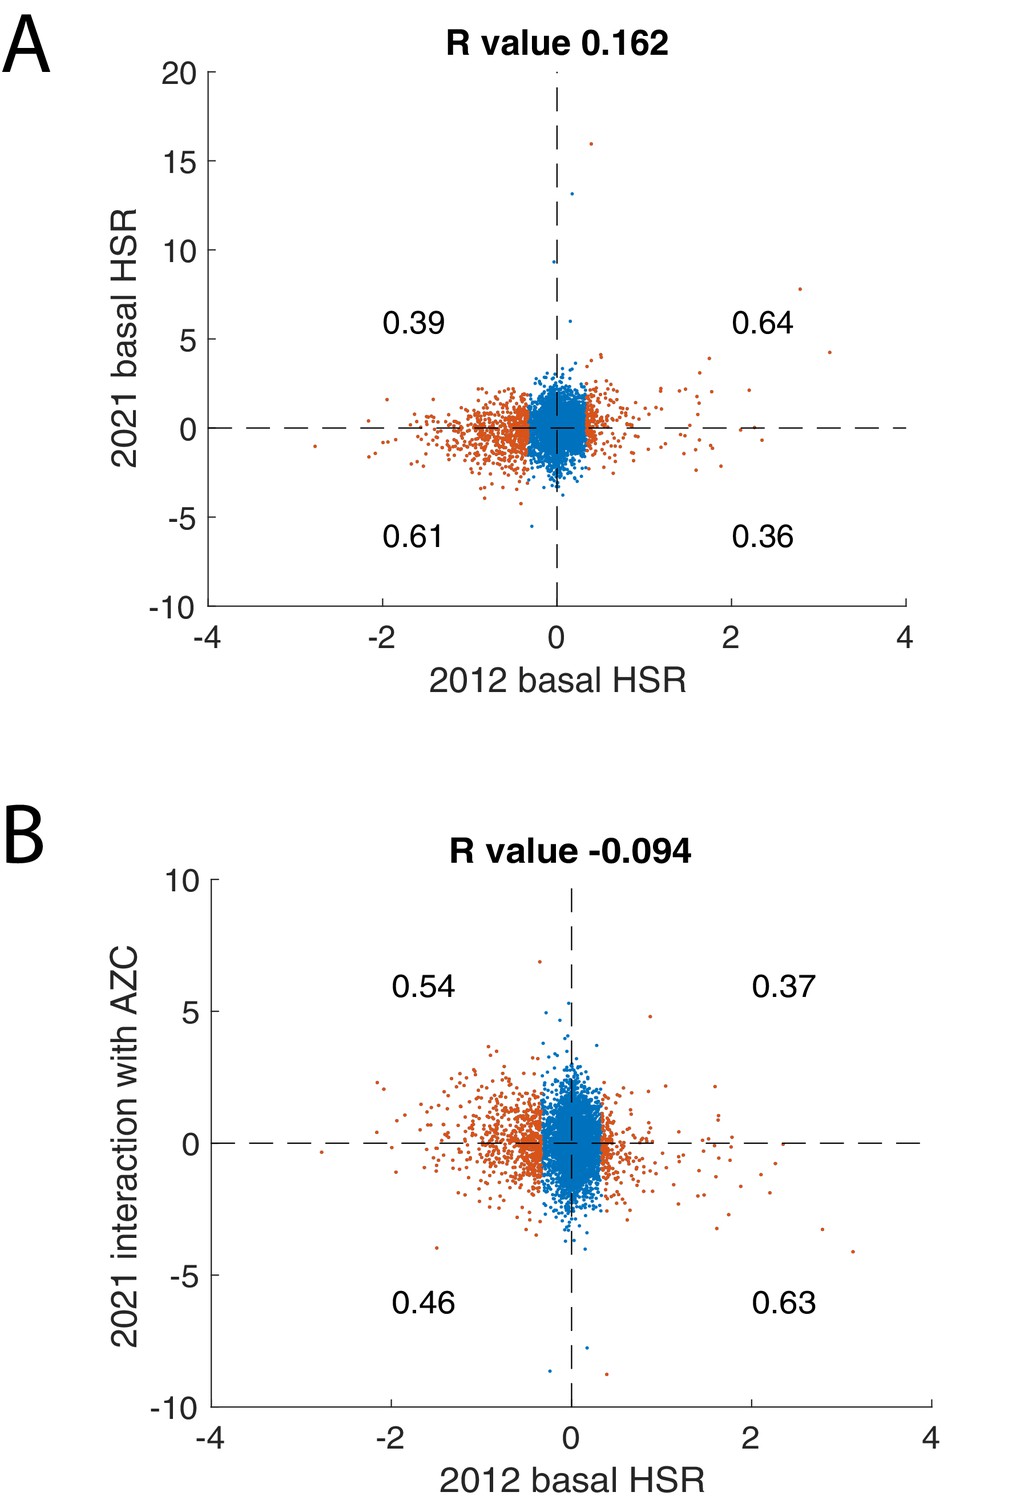
Comparisons of ReporterSeq screen with previous HSR screen.
(A) Comparison between basal regulators of the HSR from Brandman et al., 2012 on the x-axis (log2 Hsf1 reporter – measured as GFP/RFP) versus ReporterSeq basal NNS on the y-axis. (B) Comparison between basal regulators of the HSR from Brandman et al., 2012 on the x-axis versus ReporterSeq interaction NNS with AZC on the y-axis. Blue points represent genes below one standard deviation from the mean and red points represent genes above one standard deviation from the mean in 2012 screen. Proportion of red points above and below zero in 2021 screen is written in each quadrant. R values from Spearman correlation appear in panel titles.
Figure 3
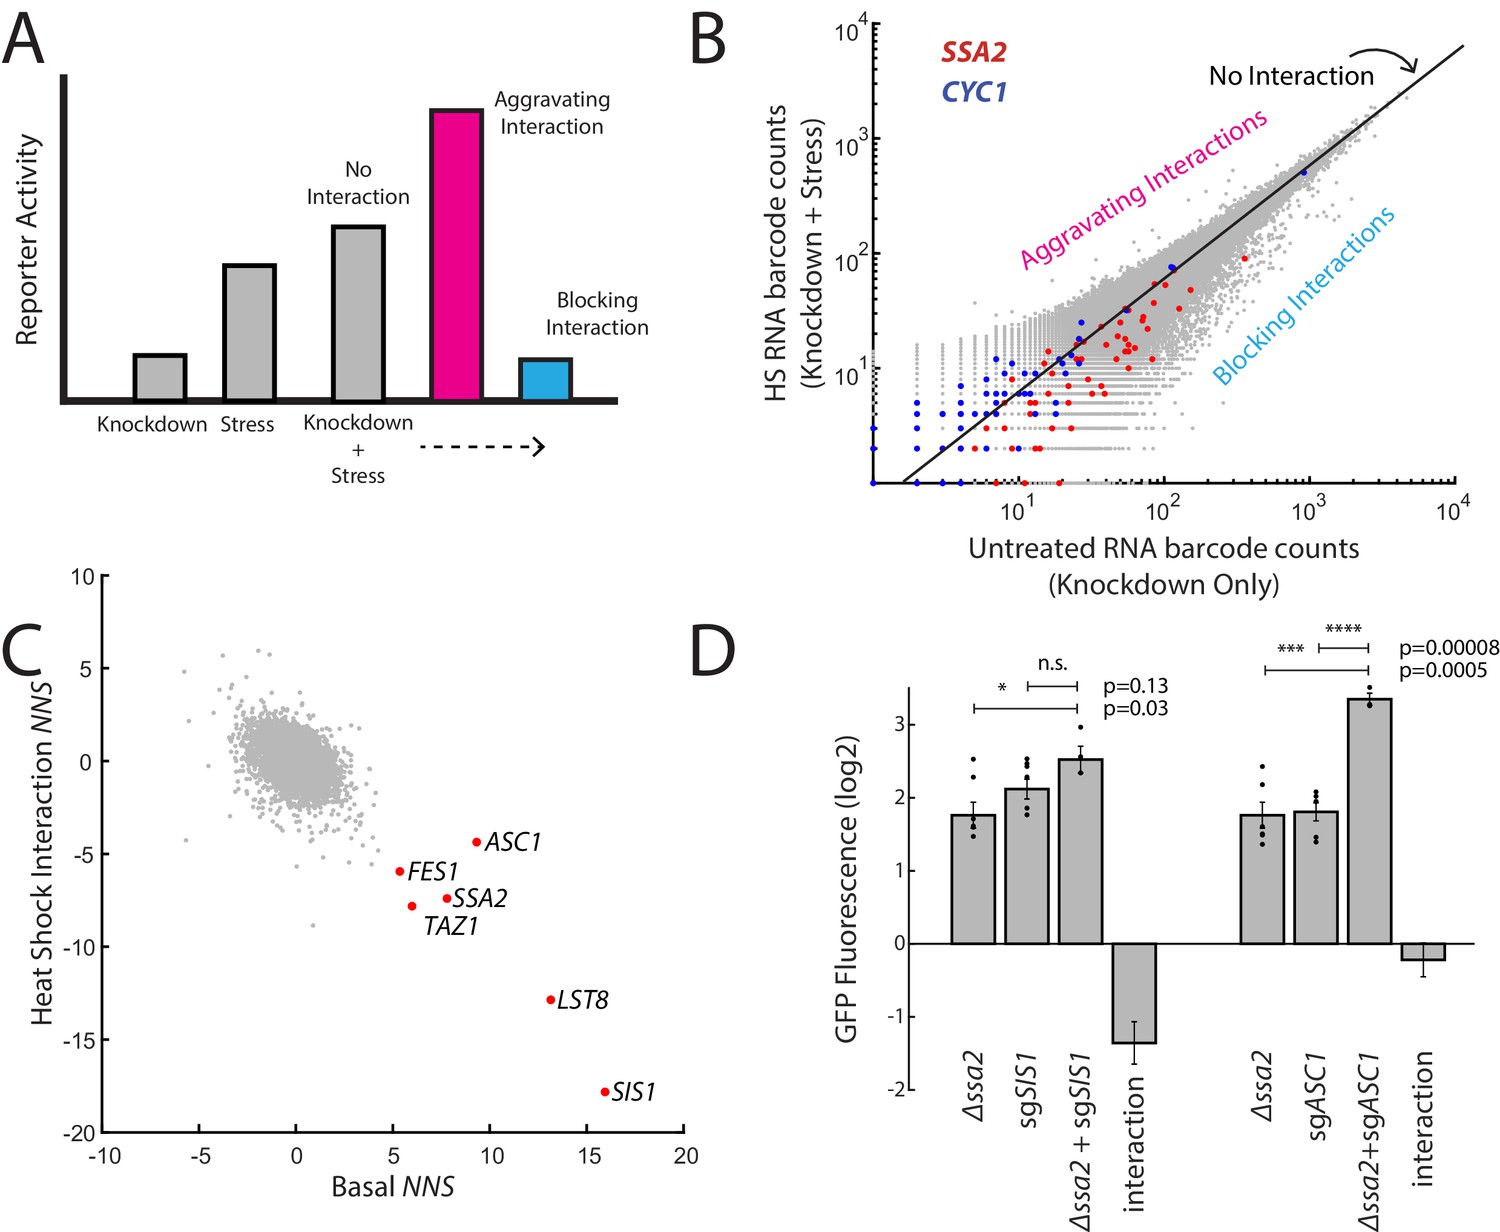
ReporterSeq reveals how genes interact with heat stress.
(A) A schematic of gene–stressor interactions. The combination of a gene perturbation and stressor can be additive (no interaction, suggesting independence), higher than expected (an aggravating interaction), or lower than expected (a blocking interaction). (B) RNA barcode counts of untreated yeast compared to those of heat-stressed yeast from the same sample. No interaction, aggravating, and blocking interactions are indicated. Red dots indicate barcodes that correspond to sgRNAs targeting SSA2. Blue dots indicate barcodes that correspond to sgRNAs targeting CYC1. (C) Basal NNS for each gene versus the heat shock interaction NNS for each gene. Genes with high basal NNS are labeled. (D) Genetic interactions for Δssa2-sgSIS1 and Δssa2-sgASC1 gene pairs. GFP fluorescence of the HSR reporter in the ssa2 knockout alone, an sgRNA alone, and both perturbations together are displayed, each relative to wild-type cells containing the reporter. The genetic interaction is the observed combined log2 reporter activity minus the reporter activity in each individual genetic perturbation. Error bars are standard errors of three to six replicates. p-values are calculated based on an unpaired t-test: n.s.p>0.05; *p<0.05; **p<0.01; ***p<0.001; ****p<0.0001.
Figure 4 with 1 supplement
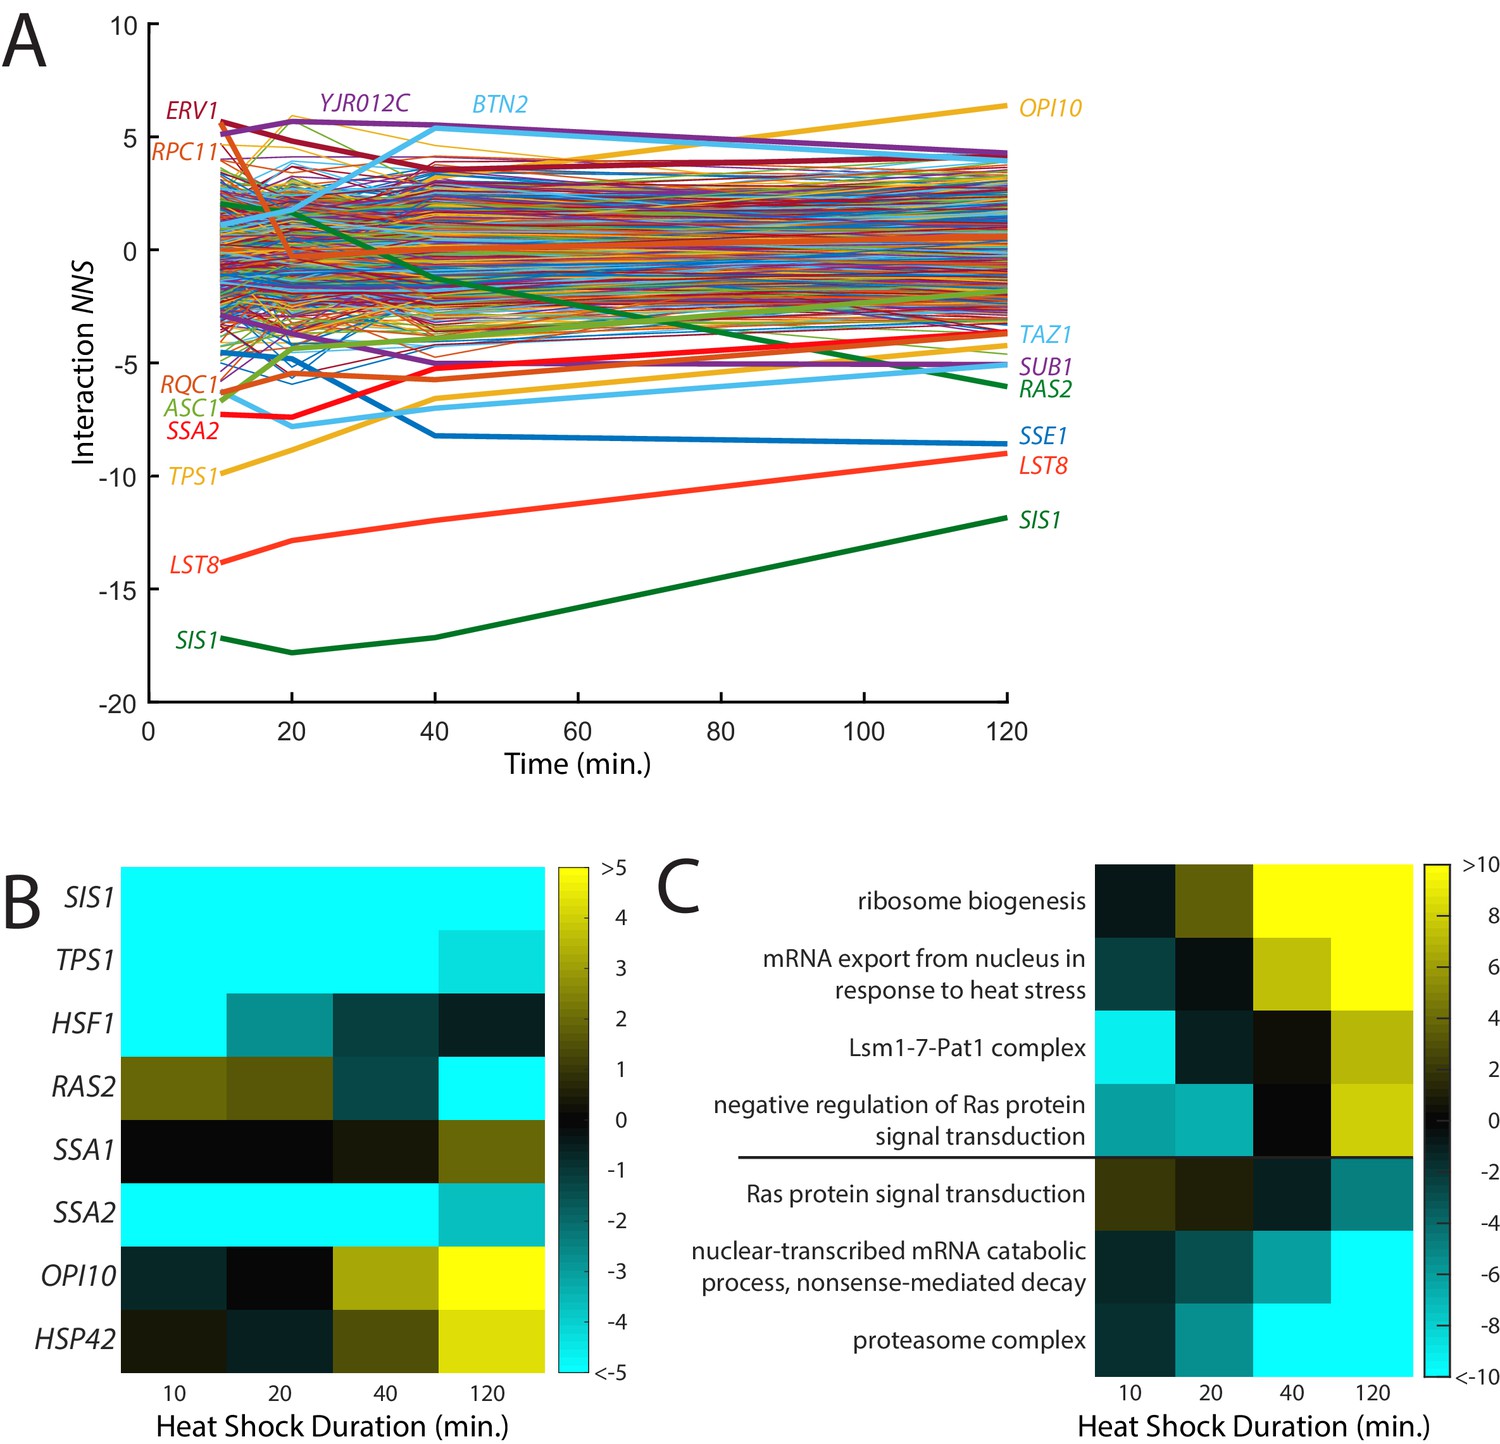
Time-resolved interactions between genetic knockdowns and heat stress.
(A) Time course of interaction NNS for each gene with 39°C heat shock. Time points were measured at 10, 20, 40, and 120 min. (B) Heat map of interaction NNS for selected genes in the screen. (C) Heat map of GO category scores for selected categories with differential effects in early and late time points.
Figure 4—figure supplement 1

Effect of heat shock on CRISPR knockdown efficiency.
Changes in SIS1 and SSA2 mRNA levels after 39°C heat shock in strains expressing dCas9-Mxi1 and guide sequences targeting SIS1 or SSA2 vs a scrambled control. Y-axis shows the log2 difference in mRNA levels obtained using qPCR in SIS1/SSA2 vs scramble. Results are shown for ACT1 normalized mRNA levels (A) and non-normalized mRNA levels. Note that the drop in mRNA levels at the 120 min time point is caused by an increase in ACT1 levels and thus is not recapitulated in non-normalized data. (B) Error bars represent S.E.M. of triplicates.
Figure 5 with 3 supplements
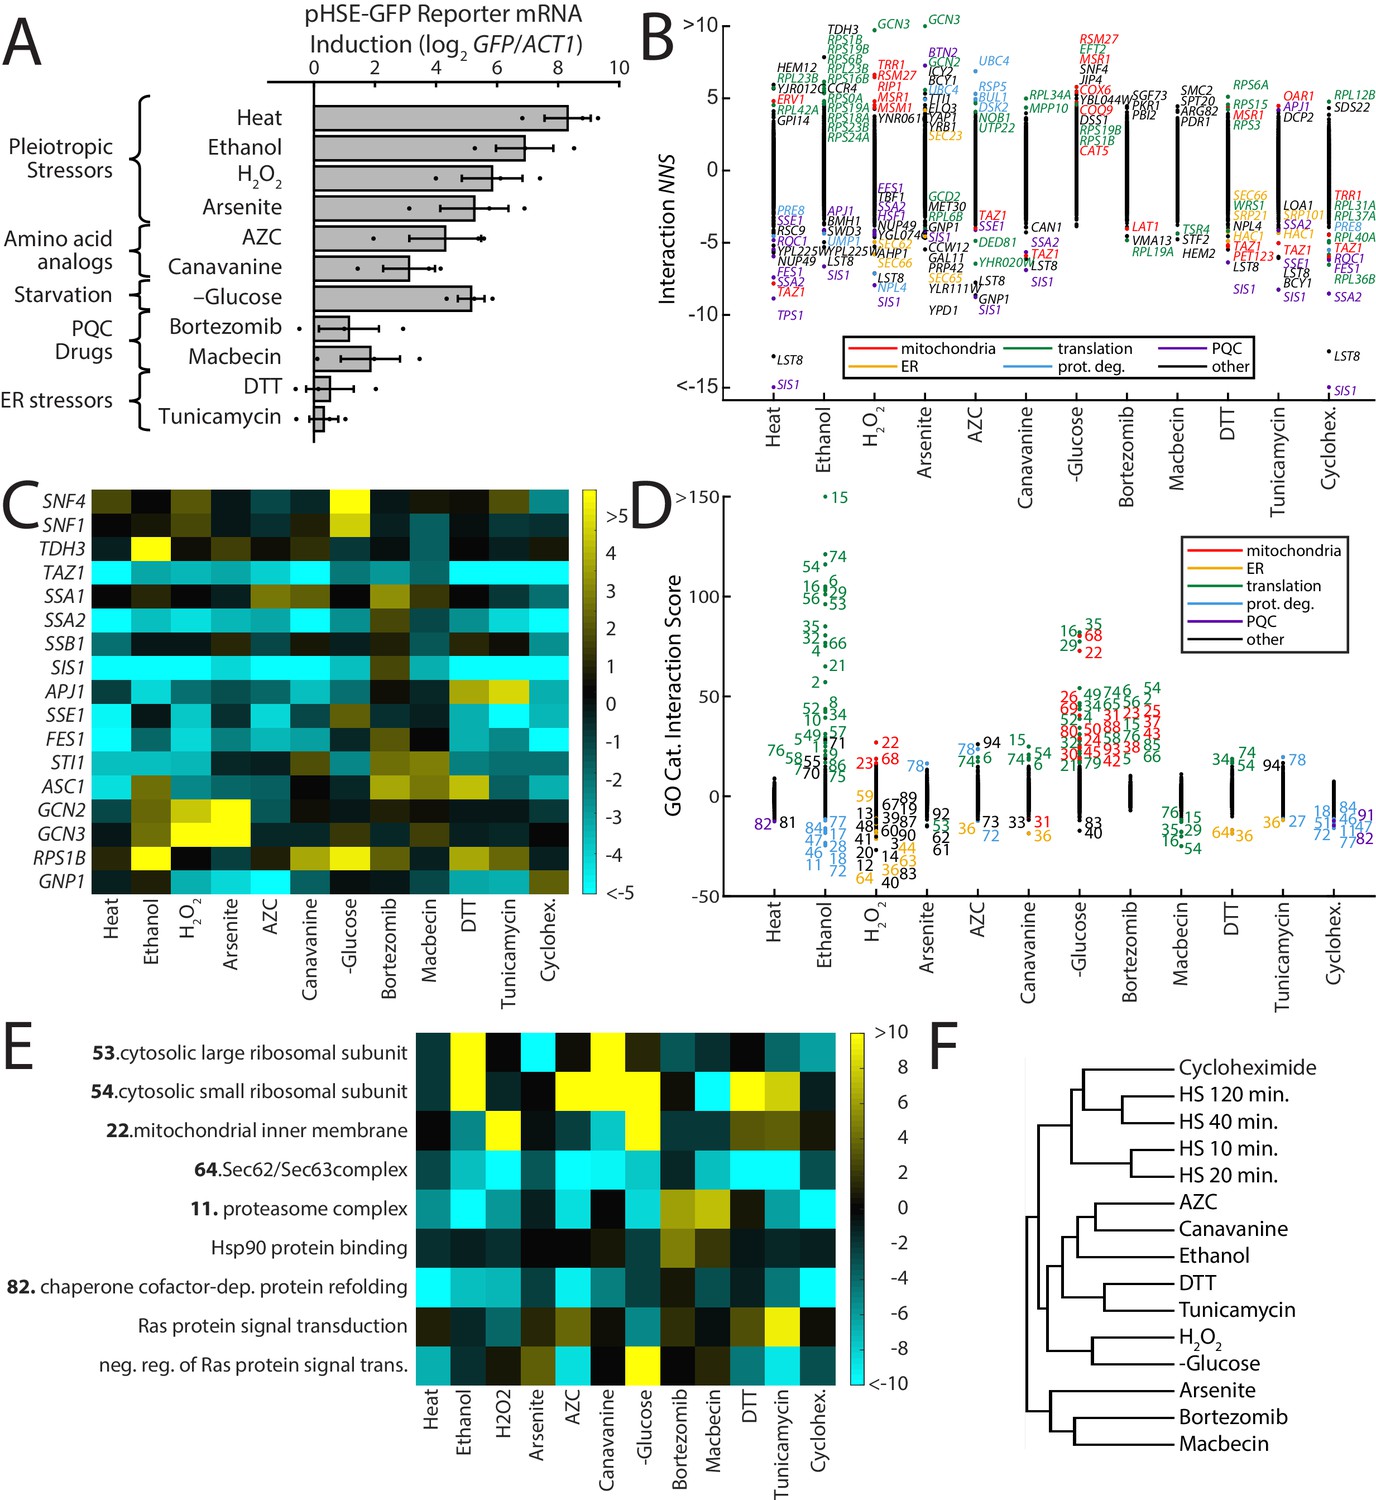
ReporterSeq reveals the diversity of responses to different stress conditions.
(A) HSR reporter mRNA induction based as measured by qPCR in 13 stressors (see Supplementary file 6 for details of treatments). mRNA levels are relative to ACT1 mRNA levels, and the results are normalized such that untreated yeast have an induction of 0. Error bars are standard errors of three replicates. (B) Interaction NNS for each gene under each stressor. Genes with a score magnitude greater than four are labeled (with no more than 12 per condition) and colored based on annotated function. (C) Heat map of interaction NNS for select genes with each stressor. (D) GO category scores for each gene under each stressor. Category ID number key is provided in Supplementary file 7. Outlier categories are colored based on function. (E) Heat map of GO category scores for selected GO categories and each stressor. (F) Hierarchical clustering tree based on gene-stressor interactions. Relatedness between each pair of stressors is quantified by the horizontal length from the branch point.
Figure 5—figure supplement 1
Replicates of gene–stressors interactions.
For each stressor, gene NNS for replicates are shown. R values appear in panel titles.
Figure 5—figure supplement 2

SSA1 and SSA2 have distinct effects on the HSR.
(A) Integrated HSR reporter activity in ssa1Δ and ssa2Δ strains subject to AZC at the indicated concentration for 3 hr. (B) Interactions between AZC and Δssa1/2. Interactions between conditions are calculated as the measured result minus the expected results (sum of log scores for individual conditions). Error bars represent S.E.M. of triplicates.
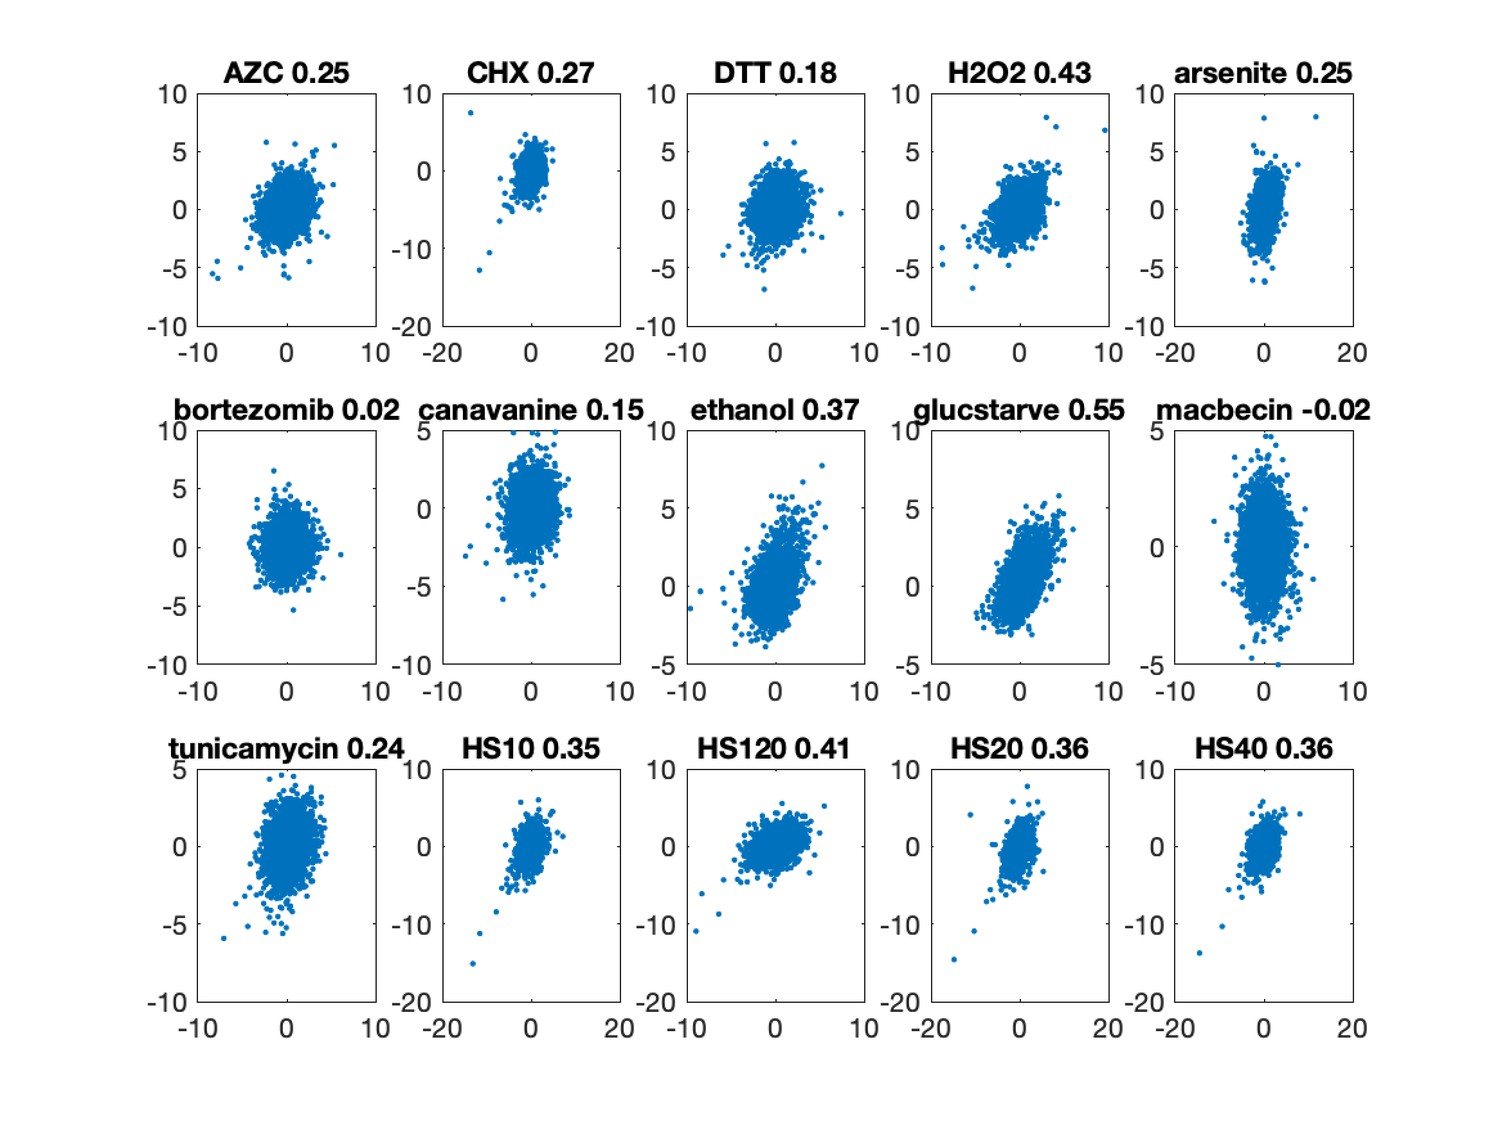
Figure 5—figure supplement 3
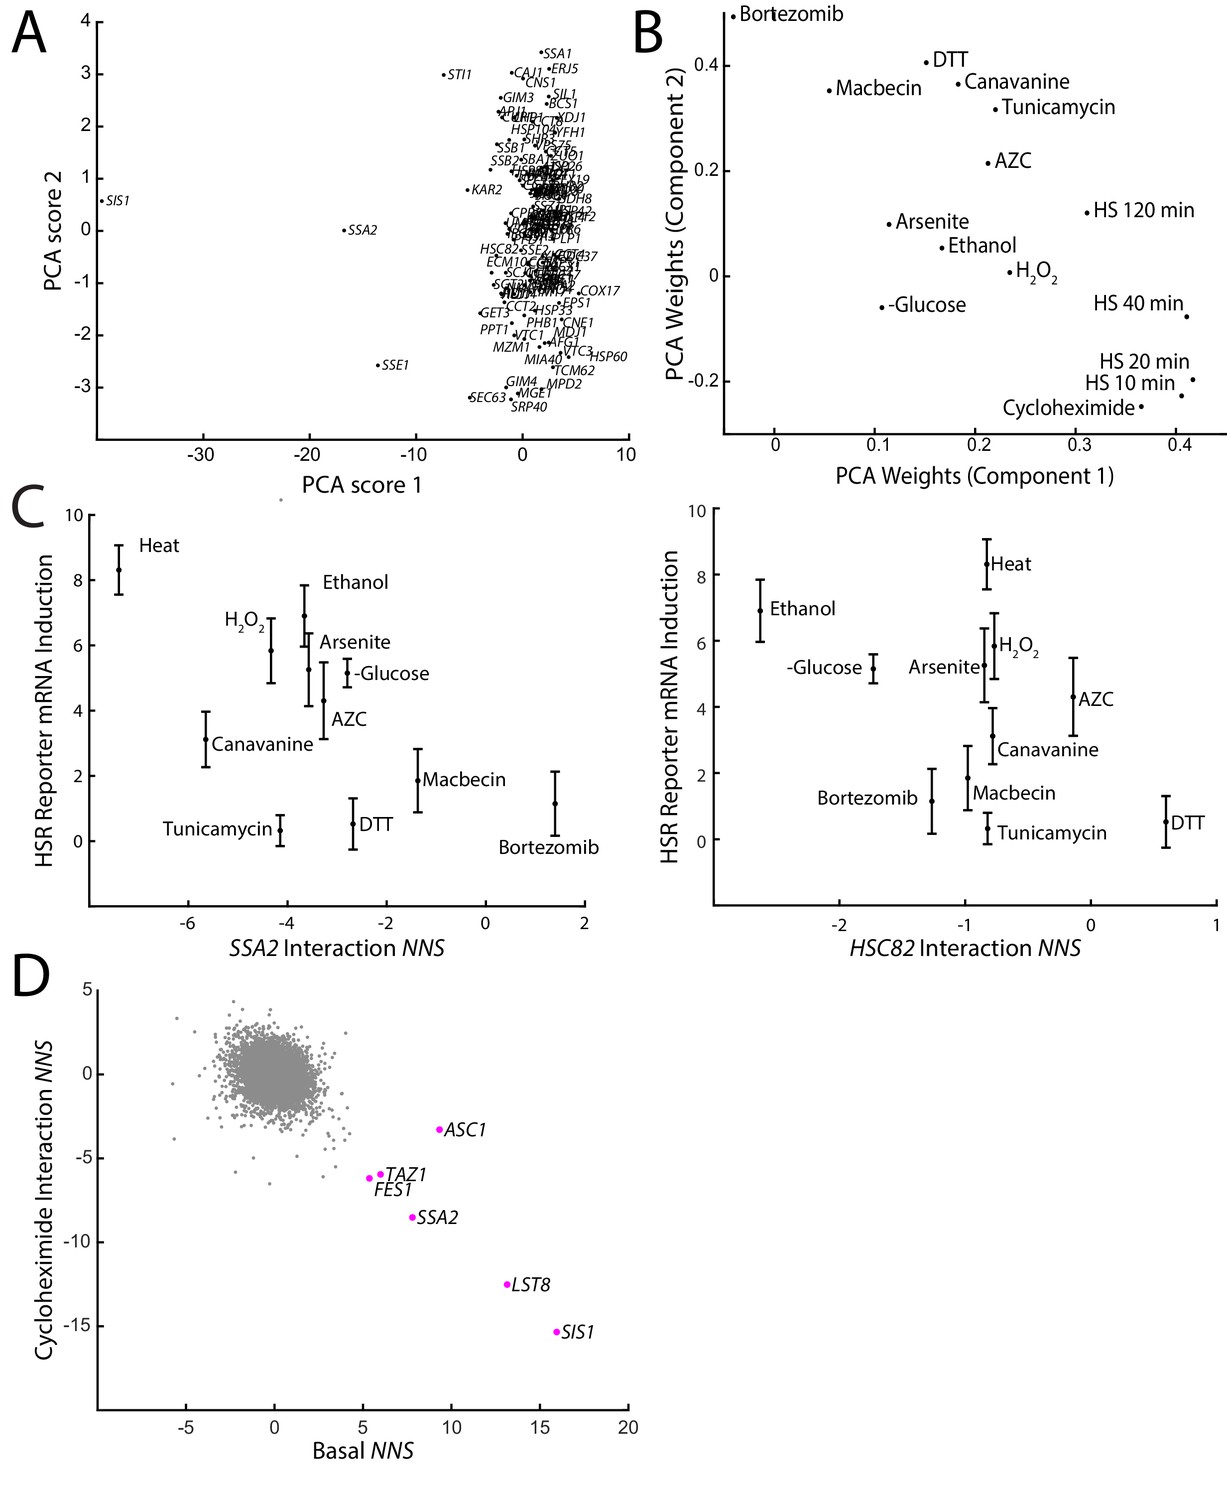
Comparisons of proteotoxic stressor effects on the HSR.
(A) Principal component analysis (PCA) scores 1 and 2 of the interaction NNS of chaperones with all 15 stress conditions. (B) PCA weights of each stress condition for principal components 1 and 2 in PCA analysis from (A). (C) HSR reporter mRNA induction versus the interaction NNS of SSA2 (left) and HSC82 (right) with each stressor. (D) Basal NNS versus cycloheximide interaction NNS for each gene. Genes with a high basal NNS are labeled. Error bars represent S.E.M. of triplicates.
Figure 6

GCN3 is required for the efficient translation of stress-induced genes under arsenite stress.
(A) mRNA levels versus protein levels of the HSR reporter as measured by qPCR and GFP fluorescence with the indicated conditions and sgRNAs. (B) Translation efficiency, normalized to control untreated. Error bars are standard errors of six independent biological replicates. sgCTRL targets no gene. p-values are calculated based on an unpaired t-test: n.s.p>0.05; *p<0.05; **p<0.01; ***p<0.001.
Additional files
-
Supplementary file 1
Basal gene NNS for and gene–stress interaction NNS for all stressors used in this study.
- https://cdn.elifesciences.org/articles/57376/elife-57376-supp1-v1.txt
-
Supplementary file 2
Fold change analysis of the top and bottom 20 basal NNS and stress interaction NNS genes identified in this study (average fold change for all barcodes).
- https://cdn.elifesciences.org/articles/57376/elife-57376-supp2-v1.txt
-
Supplementary file 3
NNS for individual sgRNAs (average of all barcodes) for all genes of this study.
- https://cdn.elifesciences.org/articles/57376/elife-57376-supp3-v1.txt
-
Supplementary file 4
Individual sgRNA counts and NNS for all the genes in every stress condition used in this study.
- https://cdn.elifesciences.org/articles/57376/elife-57376-supp4-v1.txt
-
Supplementary file 5
Gene ontology (GO) category scores for basal and stress conditions.
- https://cdn.elifesciences.org/articles/57376/elife-57376-supp5-v1.txt
-
Supplementary file 6
Description of stressors used in this study.
- https://cdn.elifesciences.org/articles/57376/elife-57376-supp6-v1.txt
-
Supplementary file 7
ID-value key for gene ontology (GO) categories used in Figure 5D.
- https://cdn.elifesciences.org/articles/57376/elife-57376-supp7-v1.txt
-
Supplementary file 8
List of chaperones used in principle components analysis of Figure 5—figure supplement 2.
- https://cdn.elifesciences.org/articles/57376/elife-57376-supp8-v1.txt
-
Supplementary file 9
Total read counts matching barcodes for all conditions used in this study.
- https://cdn.elifesciences.org/articles/57376/elife-57376-supp9-v1.txt
-
Supplementary file 10
sgRNAs sequences used in the CRISPR library used in this study.
- https://cdn.elifesciences.org/articles/57376/elife-57376-supp10-v1.txt
-
Supplementary file 11
Library design strategy with primer and library sequences.
- https://cdn.elifesciences.org/articles/57376/elife-57376-supp11-v1.zip
-
Supplementary file 12
Zip file containing raw read count data, matlab code to generate scores, and library construction schematic and sequences.
- https://cdn.elifesciences.org/articles/57376/elife-57376-supp12-v1.zip
-
Transparent reporting form
- https://cdn.elifesciences.org/articles/57376/elife-57376-transrepform-v1.docx
Download links
A two-part list of links to download the article, or parts of the article, in various formats.
Downloads (link to download the article as PDF)
Open citations (links to open the citations from this article in various online reference manager services)
Cite this article (links to download the citations from this article in formats compatible with various reference manager tools)
ReporterSeq reveals genome-wide dynamic modulators of the heat shock response across diverse stressors
eLife 10:e57376.
https://doi.org/10.7554/eLife.57376


