In vivo transcriptomic profiling using cell encapsulation identifies effector pathways of systemic aging
- Nestlé Institute of Health Sciences, Nestlé Research, Switzerland
- School of Life Sciences École Polytechnique Fédérale de Lausanne (EPFL), Switzerland
- Vascular Pathophysiology Area, Centro Nacional de Investigaciones Cardiovasculares, Spain
- Département de Pharmacologie-Physiologie, Institut de Pharmacologie de Sherbrooke, Centre de Recherche du Centre Hospitalier Universitaire de Sherbrooke, Faculté de Médecine et des Sciences de la Santé, Université de Sherbrooke, Canada
- Department of Experimental and Health Sciences, Pompeu Fabra University, CIBERNED and ICREA, Barcelona, Spain, Spain
Figures
Figure 1 with 1 supplement
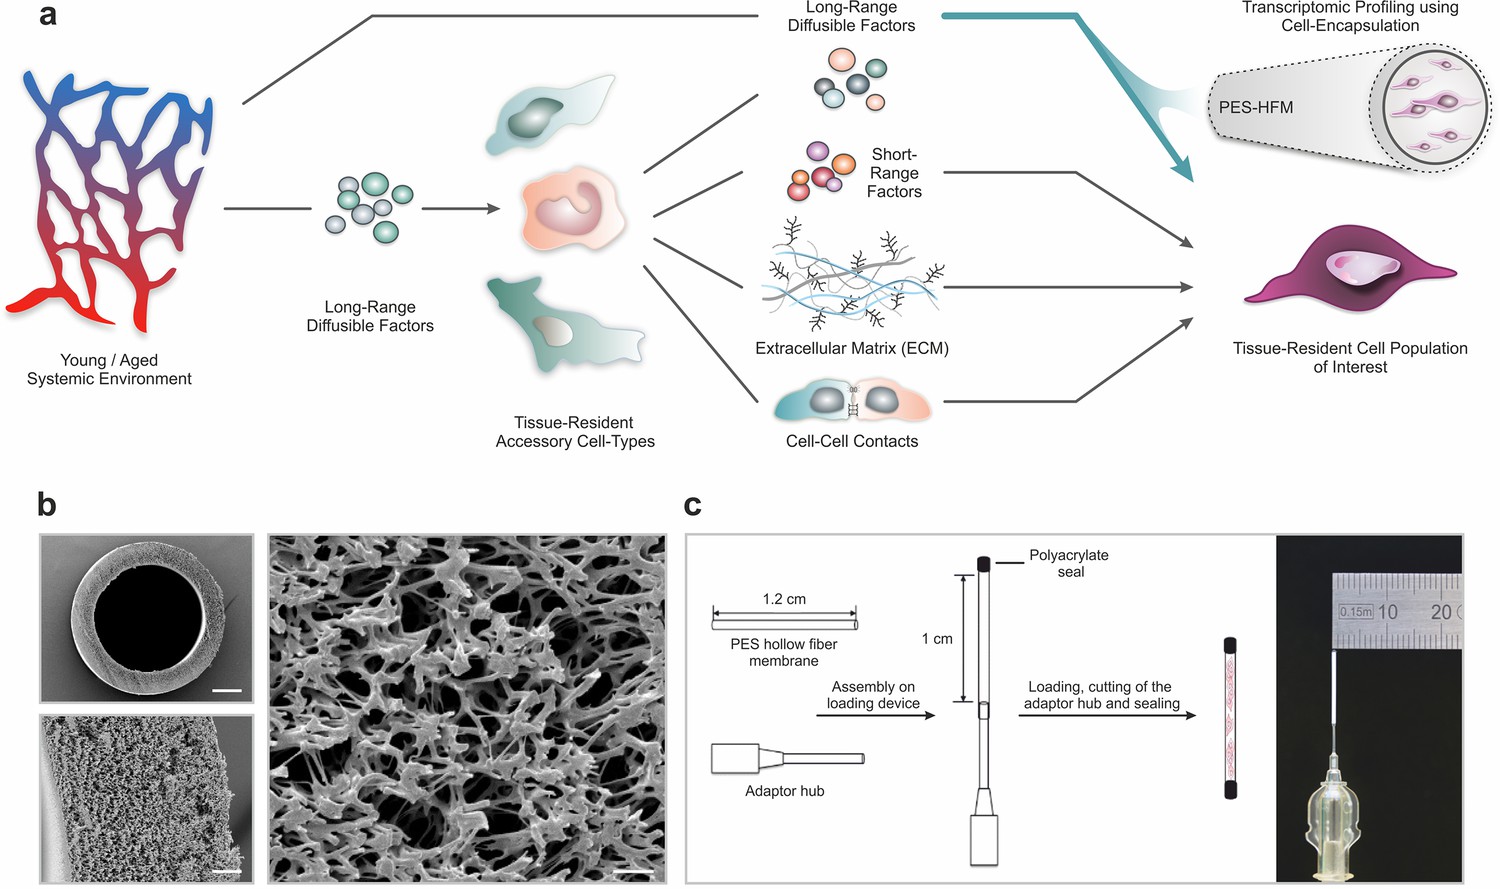
Polyethersulfone (PES) hollow fiber capsules for transcriptomic profiling of long-range systemic signals.
(a) Scheme outlining interactions in the tissue niche in the context of the systemic circulation. Using cell encapsulation in PES hollow fiber membranes (PES-HFM), direct effects of long-range diffusible factors, including growth factors, nutrients, gases, and ions, on maintenance and differentiation of defined cell types of interest can be assessed independent of the influence of accessory cells presenting cell-cell adhesion receptors or secreting extracellular matrix and short-range signaling factors. (b) Scanning electron micrographs of a PES hollow fiber capsule. Scale bars: 200 µm (top left), 20 µm (bottom left), and 5 µm (right). (c) Schematic outlining the capsule loading procedure and photograph of a PES hollow fiber capsule mounted to the adaptor hub.
Figure 1—figure supplement 1

Description of the capsule loading and sealing platform and cellular characterization.
(a) Flow cytometry strategy used to identify live and apoptotic cells. CytoCalcein is sequestered in the cytoplasm of live cells, while apoptosis is measured by labeling of cell surface phosphatidylserine using Apopxin. (b) Quantification of live and apoptotic human (hskMPs) or mouse (mskMPs) skeletal muscle progenitors embedded into different biomaterials and maintained in growth media for 4 or 10 days. A = Growth factor reduced Matrigel, B = Hydrogel, C = MaxGel extracellular matrix. Values were obtained from pooled cells of n = 6 replicates. (c) Schematic outlining the construction of the adaptor hub used for mounting and loading of the PES hollow fiber capsules. (d, e) Schematics and graphical representations of the parts of the 3D printed capsule cutting and sealing platform. The photograph in the upper left of (f) shows the assembled platform loaded with a capsule mounted to the adaptor hub. (g) Quantification of Pax7 and MyoD positive hskMPs over a time course of 10 days in 2D culture. Graphs represent means ± s.e.m. n = 6 replicates for each time point. ****p < 0.0001, ***p < 0.001 by one-way ANOVA followed by Bonferroni post hoc test.
Figure 2 with 1 supplement
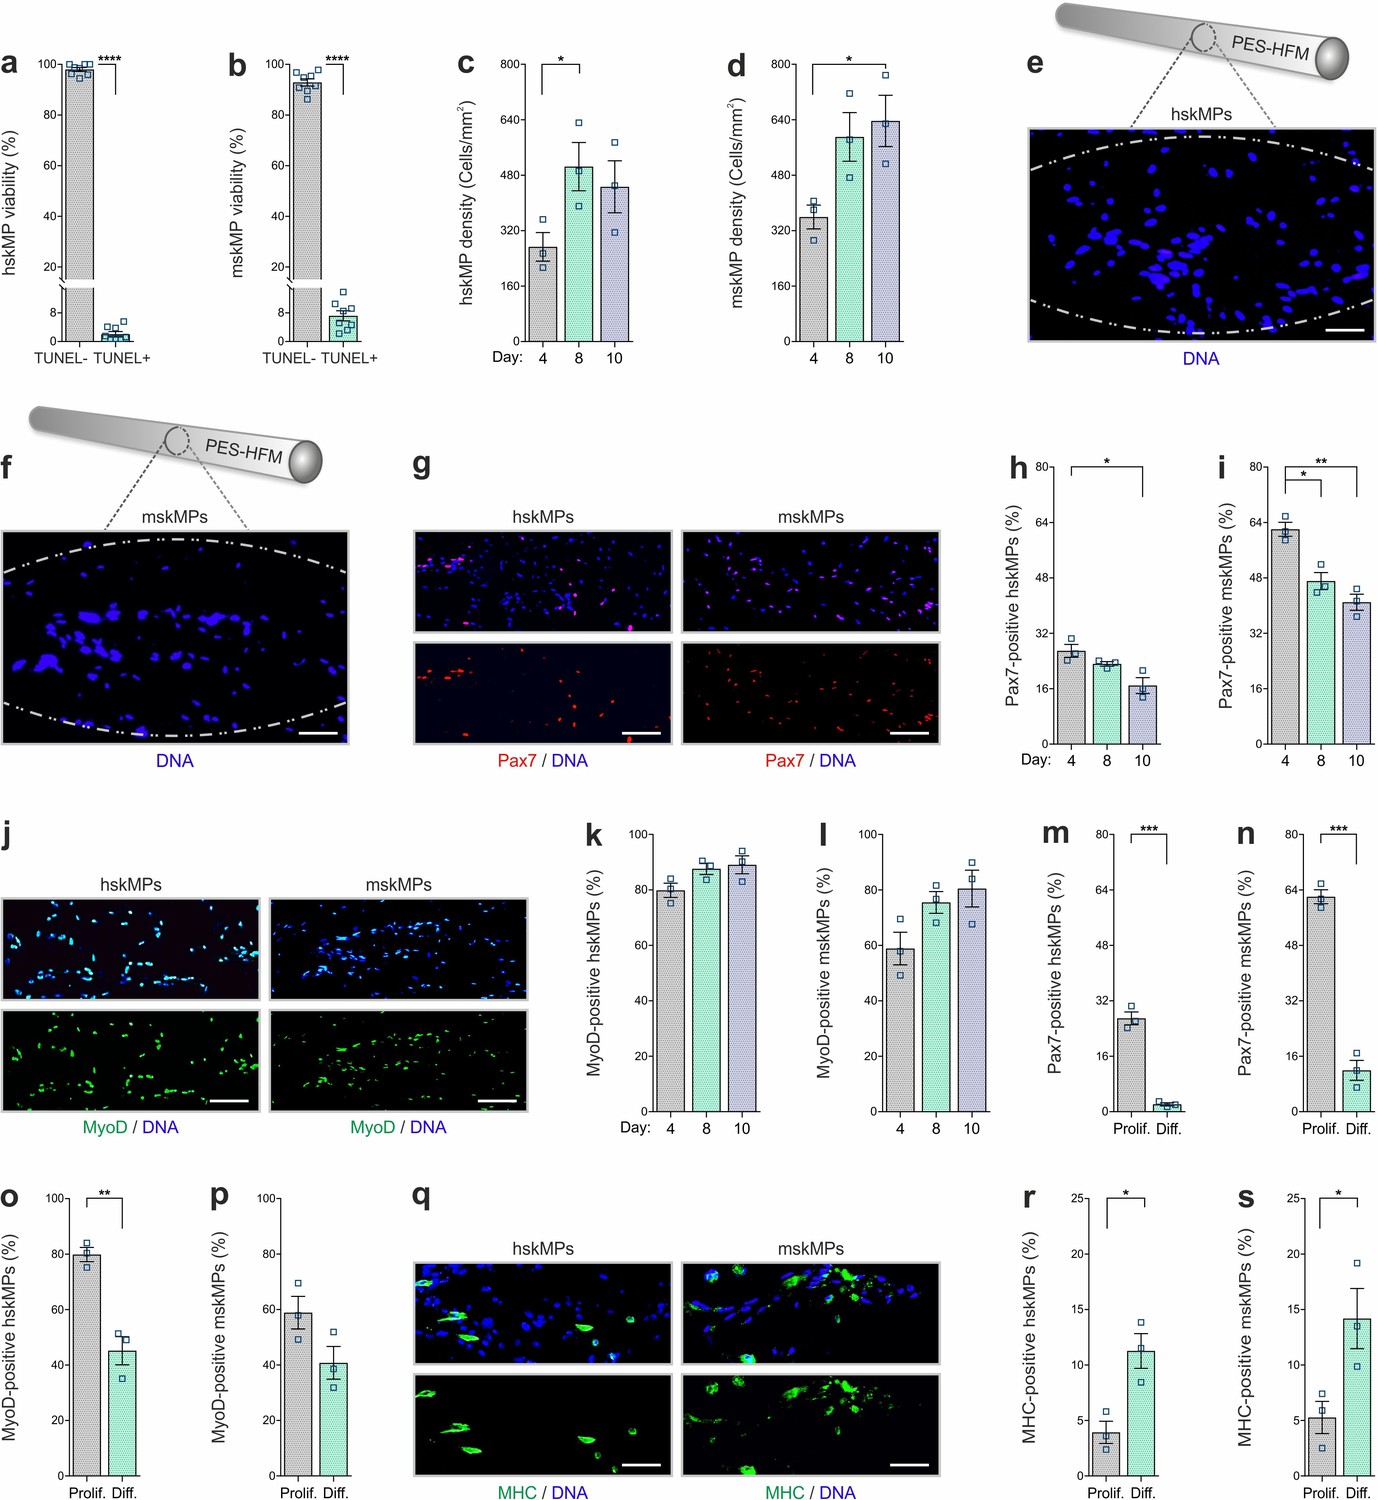
In vitro characterization of encapsulated myogenic progenitors.
(a, b) Terminal deoxynucleotidyl transferase dUTP nick end labeling (TUNEL)-based quantification of apoptosis in encapsulated human (hskMPs) or mouse (mskMPs) skeletal muscle progenitors maintained in growth media for 10 days. (c, d) DNA staining-based quantification of hskMP or mskMP numbers in cross sections of capsules maintained for 4, 8, or 10 days in growth media. (e, f) Representative DNA stainings of cross sections from a capsule containing hskMPs or mskMPs maintained 10 days in growth media. Scale bars: 75 µm. (g) Representative Pax7 immunostainings of cross sections from capsules containing hskMPs or mskMPs maintained 10 days in growth media. Scale bars: 150 µm. (h, i) Quantification of Pax7 positive cells in capsules containing hskMPs or mskMPs maintained for 4, 8, or 10 days in growth media. (j) Representative MyoD immunostainings of cross sections from capsules containing hskMPs or mskMPs maintained 10 days in growth media. Scale bars: 150 µm. (k, l) Quantification of MyoD positive cells in capsules containing hskMPs or mskMPs maintained for 4, 8, or 10 days in growth media. (m–p) Quantification of Pax7 and MyoD in cross sections from capsules maintained for 4 days under proliferative (Prolif.) conditions in growth media or in differentiation (Diff.) media. (q) Representative myosin heavy chain (MHC) immunostainings of cross sections from capsules containing hskMPs or mskMPs maintained for 4 days in differentiation media. Scale bars: 75 µm. (r, s) Quantification of MHC positive cells in capsules containing hskMPs or mskMPs maintained for 4 days in growth media compared to differentiation media. All graphs represent means ± s.e.m. n ≥ 3 cross sections from different capsules were quantified for each experiment and time point. ****p < 0.0001, ***p < 0.001, **p < 0.01, *p < 0.05. Two-way comparisons were made with a Student’s t-test and multiple comparisons by one-way ANOVA followed by Bonferroni post hoc test.
Figure 2—figure supplement 1
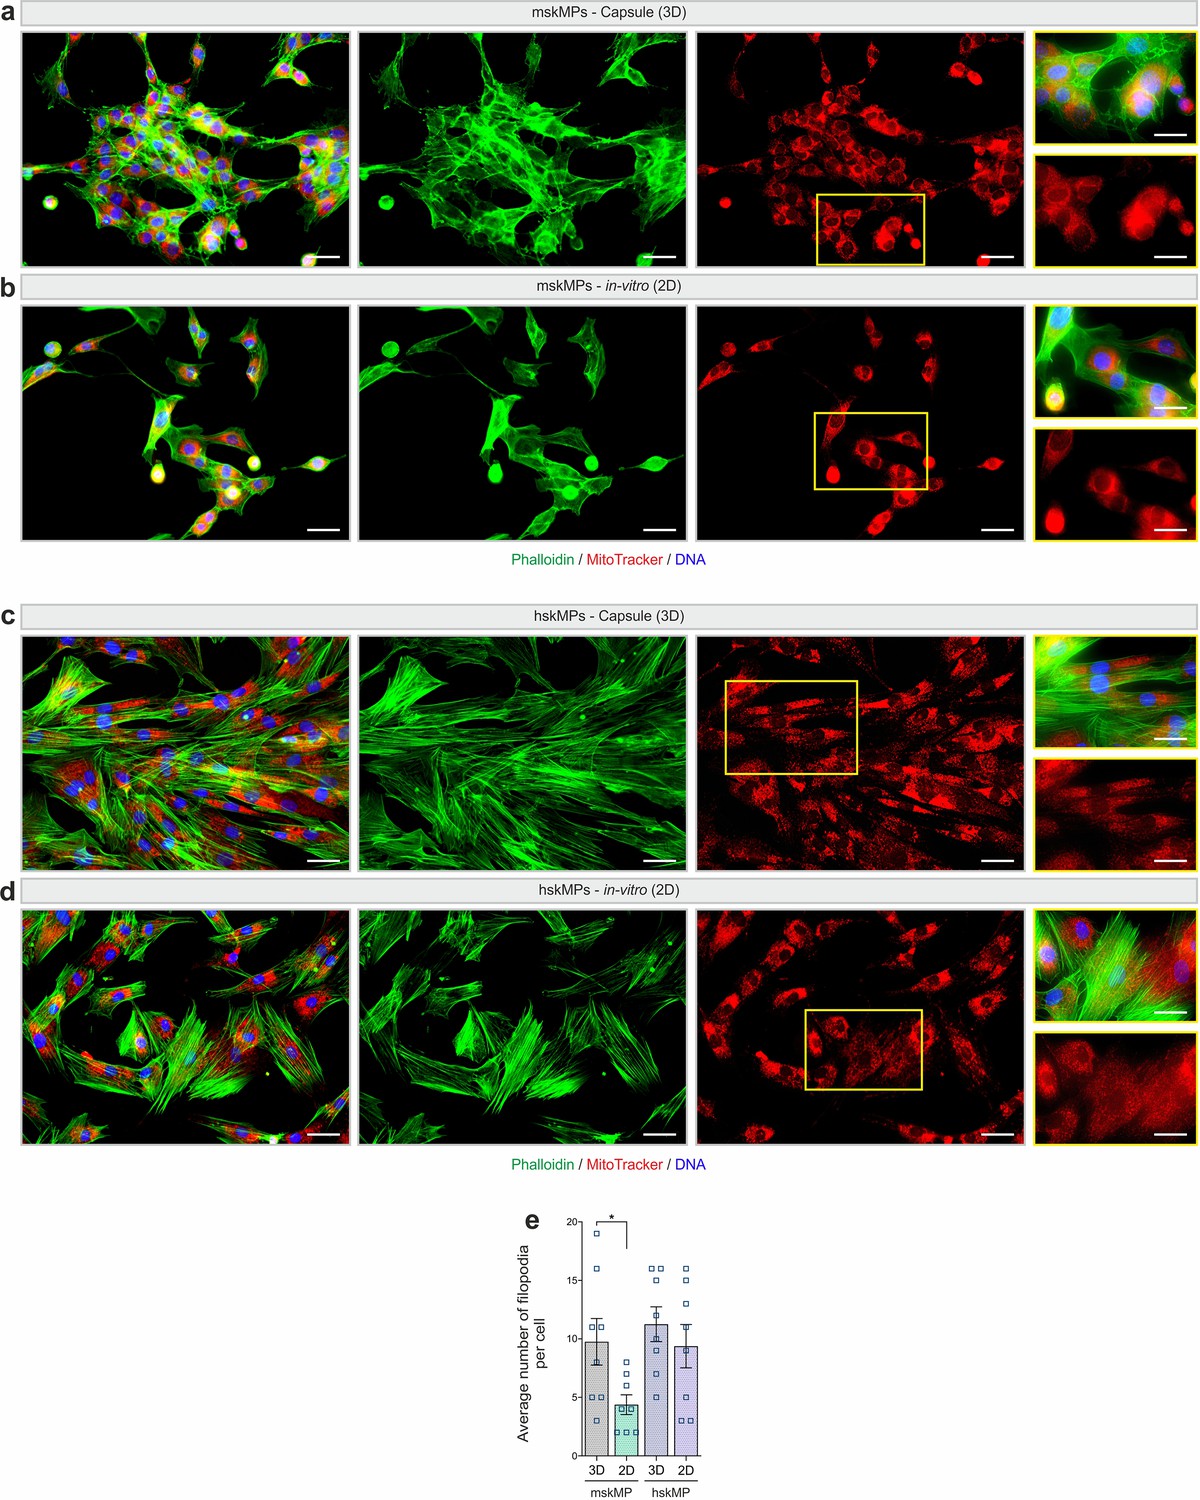
Comparison of encapsulated cells to 2D culture.
(a-d) Representative phalloidin and MitoTracker stainings of hskMPs and mskMPs in cross sections of capsules (3D) and in 2D culture. Scale bars: 50 µm and 25 µm for inserts. (e) Quantification of the number of filopodia in hskMPs and mskMPs in capsules and in 2D culture. n = 8 replicates for each condition. Graphs represent means ± s.e.m. *p < 0.05 by one-way ANOVA followed by Bonferroni post hoc test.
Figure 3 with 2 supplements
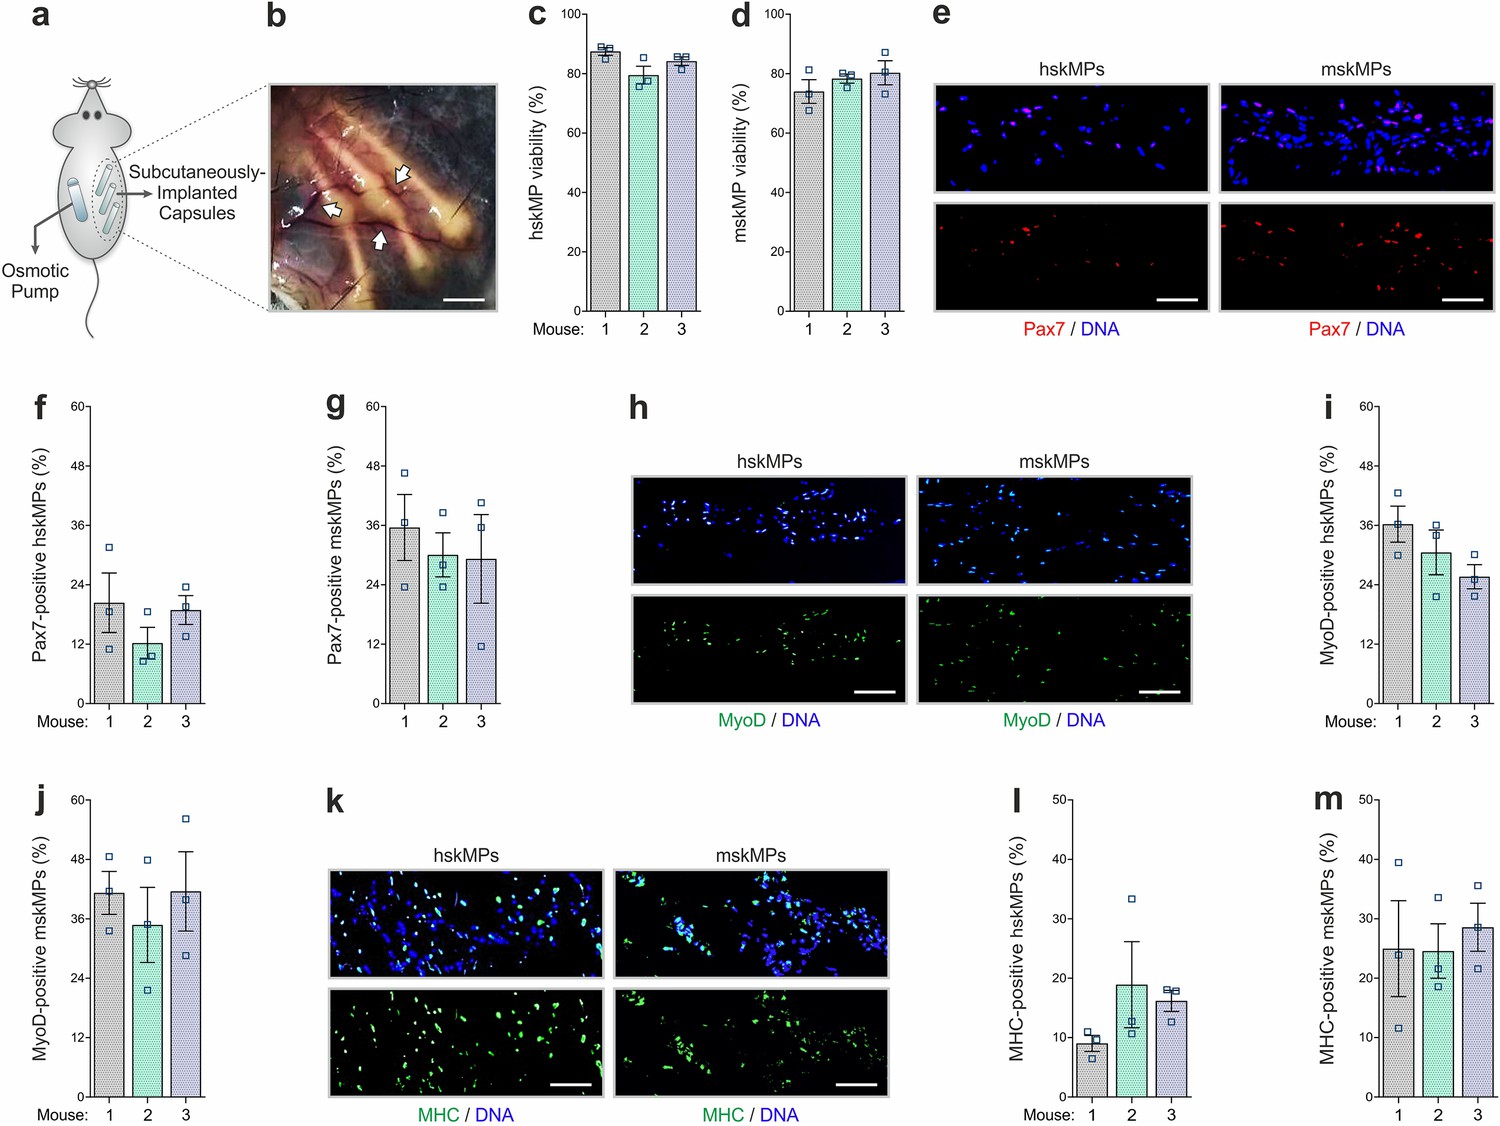
In vivo characterization of encapsulated myogenic progenitors.
(a) Schematic of the capsule implantation strategy in mice. In case of hskMPs, an osmotic pump supplying immunosuppressant was implanted at the contralateral flank. (b) Photograph of the capsules in the connective tissue under the skin of mice 10 days after implantation. Arrows are pointing at blood vessels in proximity of the capsules. Scale bar: 0.2 cm. (c, d) Quantification of TUNEL negative hskMPs or mskMPs after 10 days of encapsulation in vivo. (e) Representative Pax7 immunostainings of cross sections from capsules containing hskMPs or mskMPs after 10 days in vivo. (f, g) Quantification of Pax7 positive cells in capsules containing hskMPs or mskMPs after 10 days in vivo. (h) Representative MyoD immunostainings of cross sections from capsules containing hskMPs or mskMPs after 10 days in vivo. (i, j) Quantification of MyoD positive cells in capsules containing hskMPs or mskMPs after 10 days in vivo. (k) Representative MHC immunostainings of cross sections from capsules containing hskMPs or mskMPs after 10 days in vivo. (l, m) Quantification of MHC positive cells in capsules containing hskMPs or mskMPs after 10 days in vivo. (c, d, f, g, i, j, l, m) Cross sections of capsules explanted from n = 3 mice were analyzed for each experiment. Graphs represent means ± s.e.m. (e, h, k) Scale bars: 150 µm. Comparisons were made by one-way ANOVA followed by Bonferroni post hoc test.
Figure 3—figure supplement 1
Enzymatically liberated encapsulated cells and staining for infiltration.
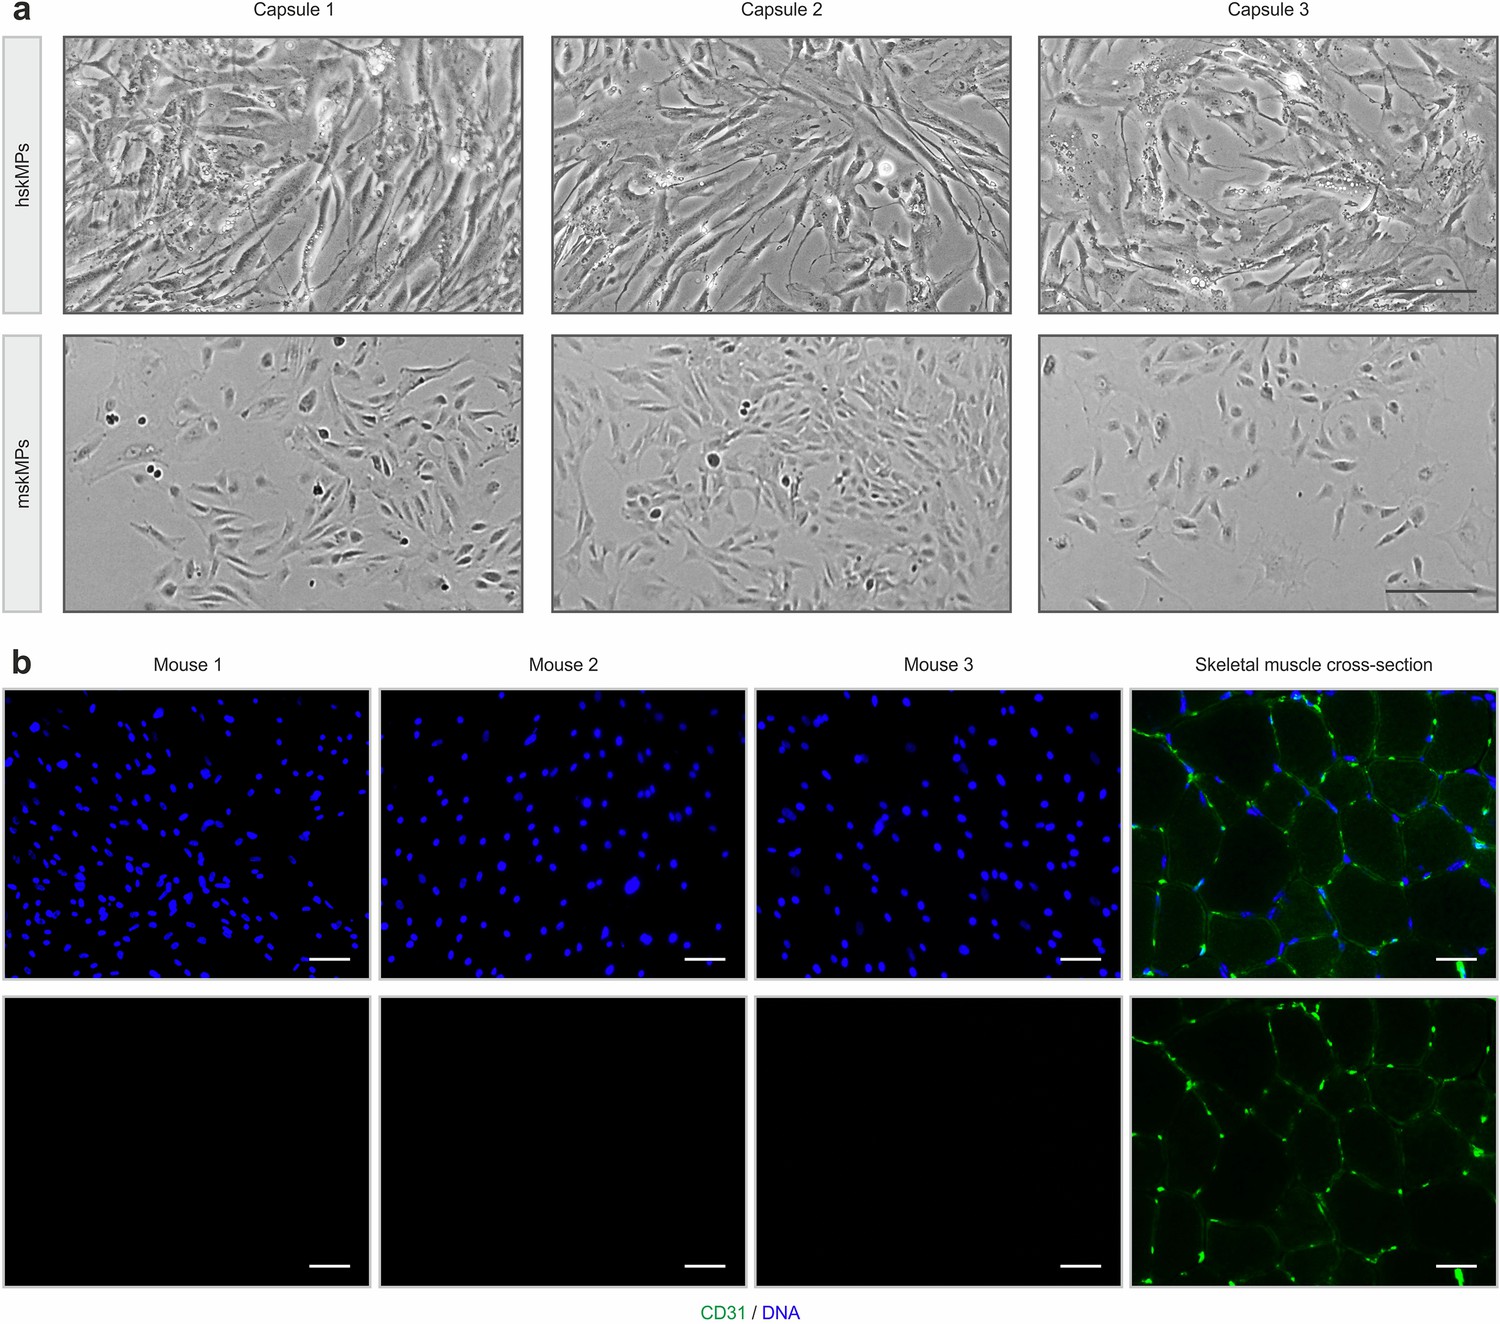
(a) Representative bright field images of hskMPs and mskMPs in 2D culture after enzymatic liberation from capsules. Scale bars: 40 µm. (b) Representative CD31 immunostainings of cross sections of capsules after 10 days in vivo. Each image was taken from capsules explanted from different animals. As a positive control, CD31 staining of a mouse tibialis anterior muscle cross section is shown. Scale bars: 75 µm.
Figure 3—figure supplement 2
Inflammatory profiling after capsule implantation.
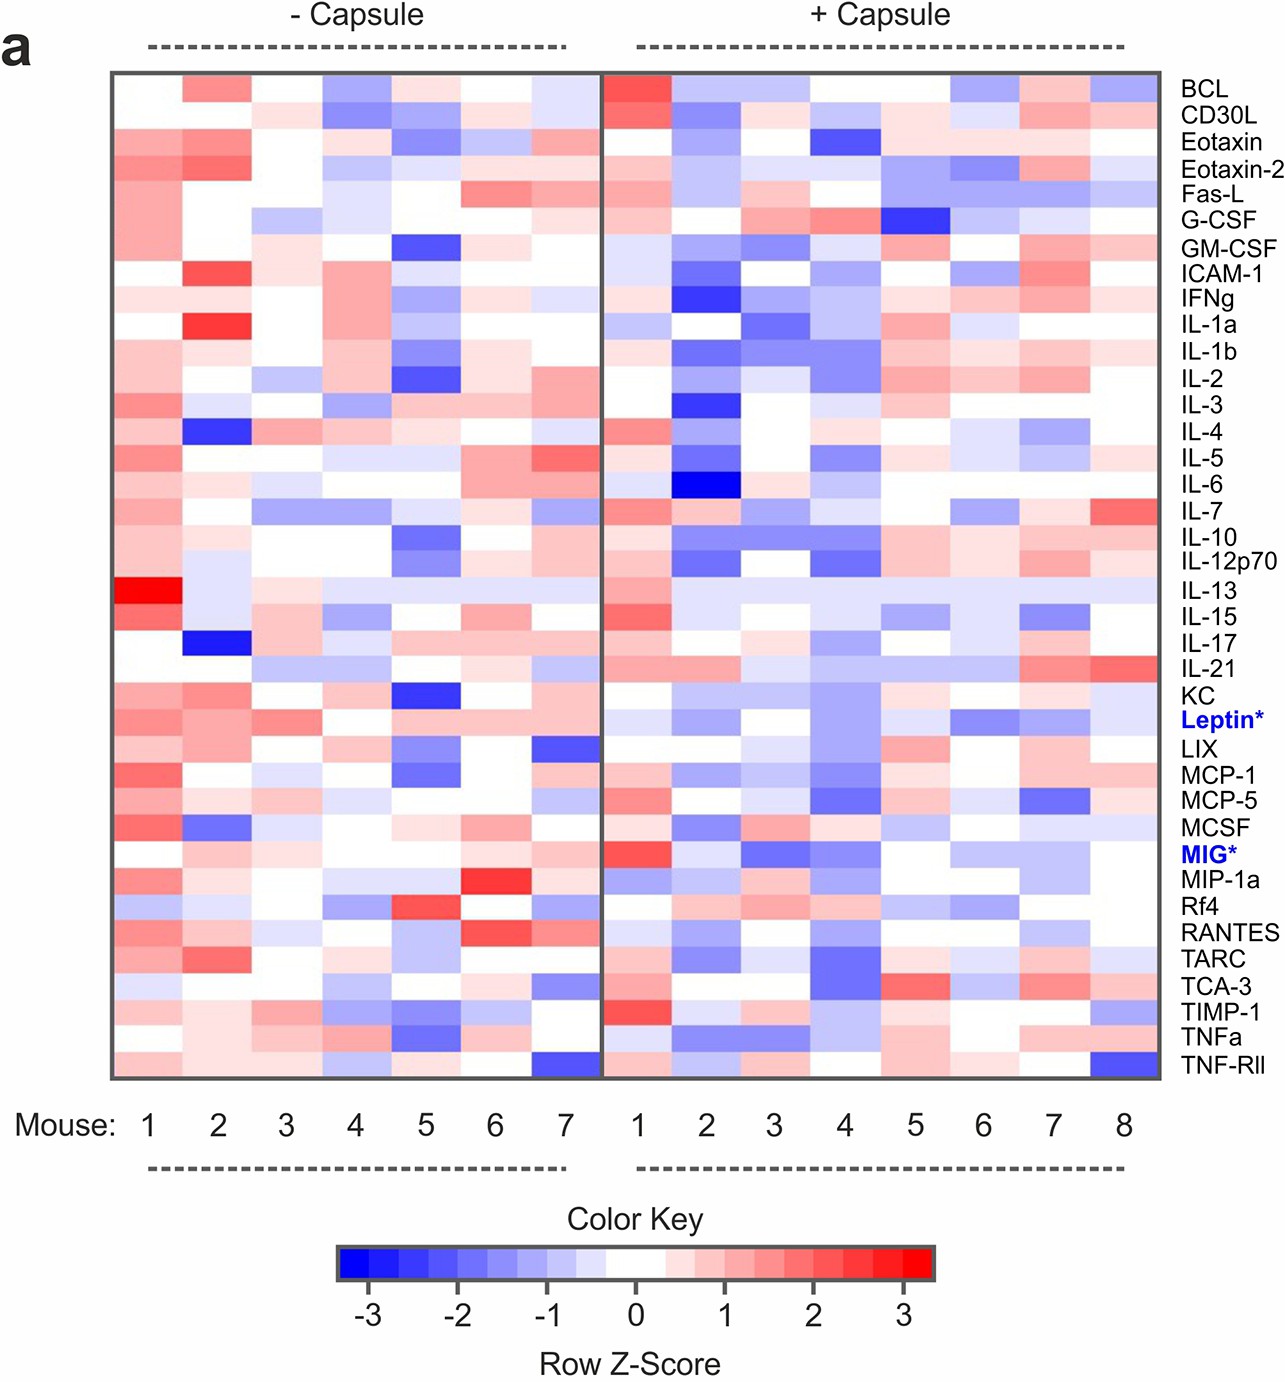
(a) Multiplexed enzyme-linked immunosorbent assay (ELISA) array signal heatmaps for levels of inflammatory factors in serum of mice that underwent surgical implantation of polyethersulfone (PES) hollow fiber capsules compared to untreated controls 10 days after the procedure. n ≥ 7 mice. Asterisks indicate factors changed with a p-value of ≤0.05 in a two-sample Wilcoxon test. TNF-Rl and MIP-1g were excluded from the analysis since signals were outside of the detection range.
Figure 4 with 5 supplements
Transcriptomic profiling of systemic aging.
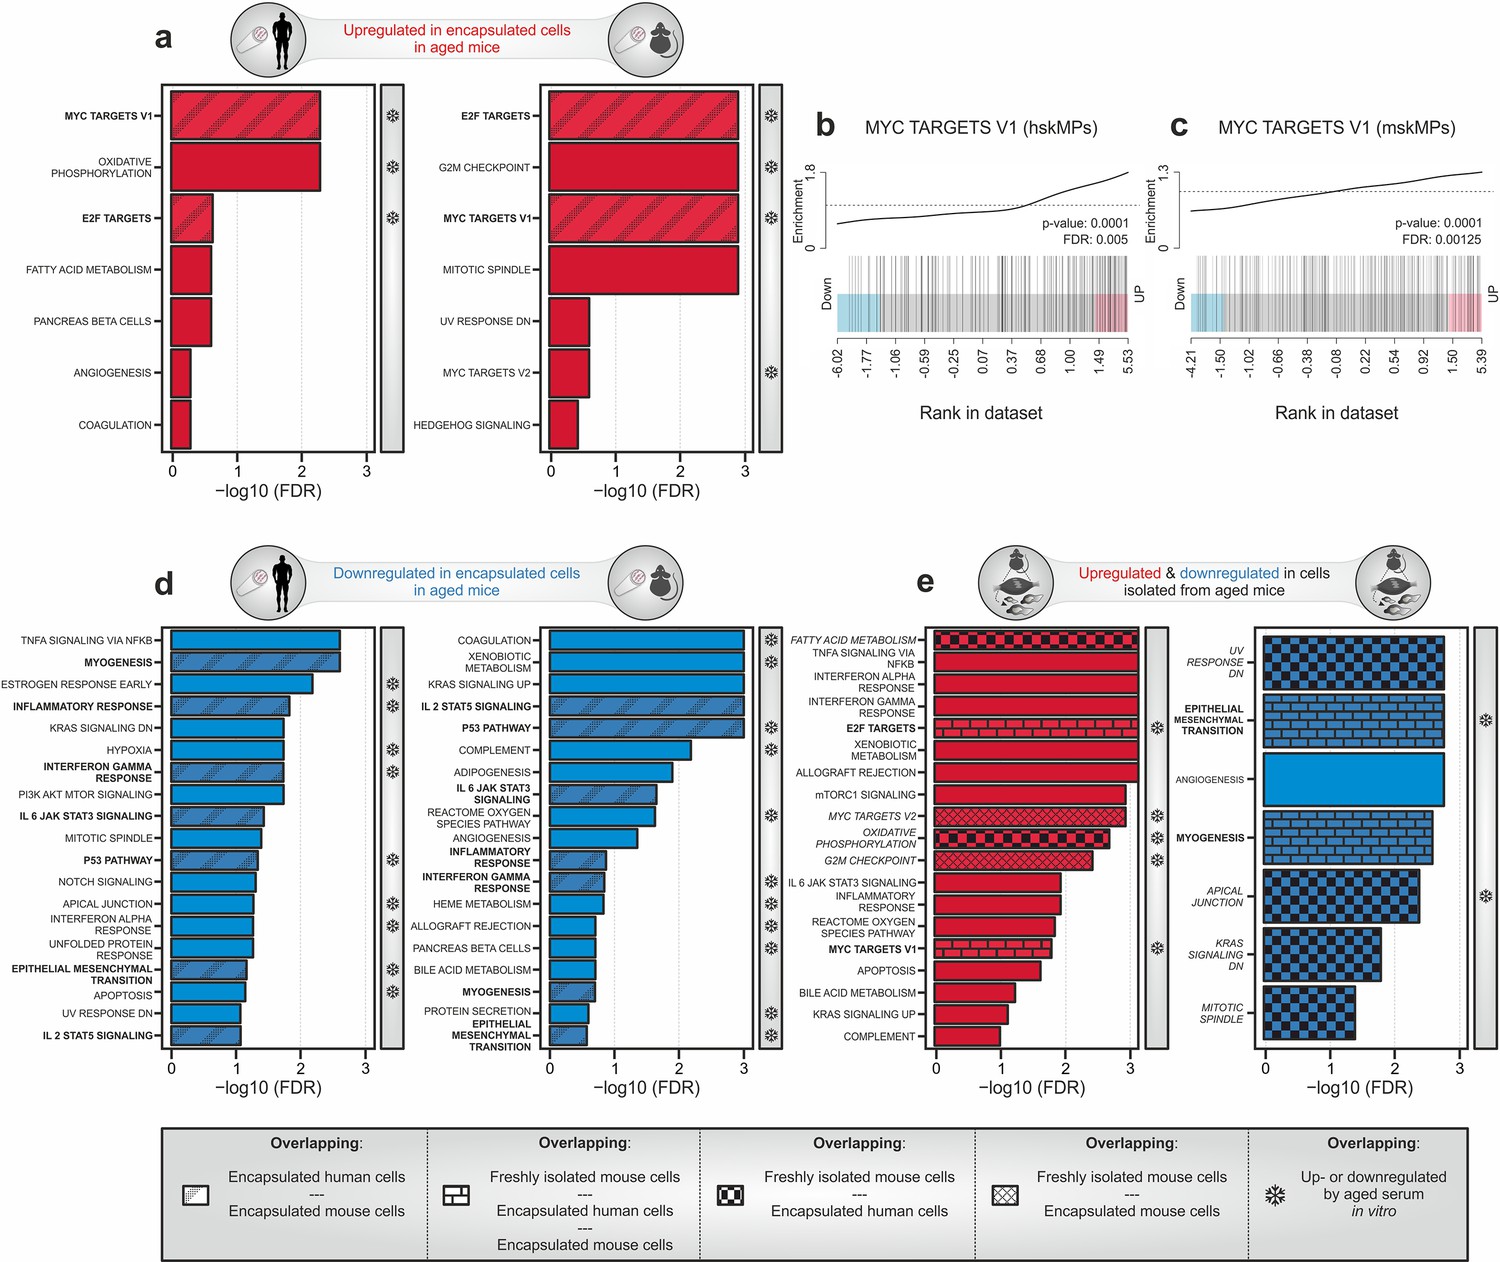
(a) Gene set enrichment analysis (GSEA) of age-induced genes in encapsulated hskMPs or mskMPs compared to the young control after 10 days in vivo. Shaded bars represent gene sets overlapping between human and mouse cells. Snowflakes indicate gene sets that are also upregulated by aged serum in vitro (Figure 4—figure supplement 4a). (b, c) GSEA barcode plots depicting enrichment of Myc targets with age in encapsulated hskMPs or mskMPs compared to the young control after 10 days in vivo. (d) GSEA of genes downregulated with age in encapsulated hskMPs or mskMPs compared to the young control after 10 days in vivo. Shaded bars represent gene sets overlapping between human and mouse cells. Snowflakes indicate gene sets that are also downregulated by aged serum in vitro (Figure 4—figure supplement 4b). (e) GSEA of genes up- or downregulated with age in freshly isolated niche-resident skeletal muscle stem cells. Shaded bars represent gene sets overlapping with encapsulated hskMPs or mskMPs in young and aged mice. Snowflakes indicate gene sets that are also up- or downregulated by aged serum in vitro (Figure 4—figure supplement 4a, b). Data from n = 8 young or aged mice. (a–e) Samples and data are derived from capsules of n ≥ 5 mice in each age group. False discovery rate (FDR) = Adjusted p-value using Benjamini-Hochberg procedure.
Figure 4—figure supplement 1
RNA yield from capsules and validation of Myc and E2F target genes.
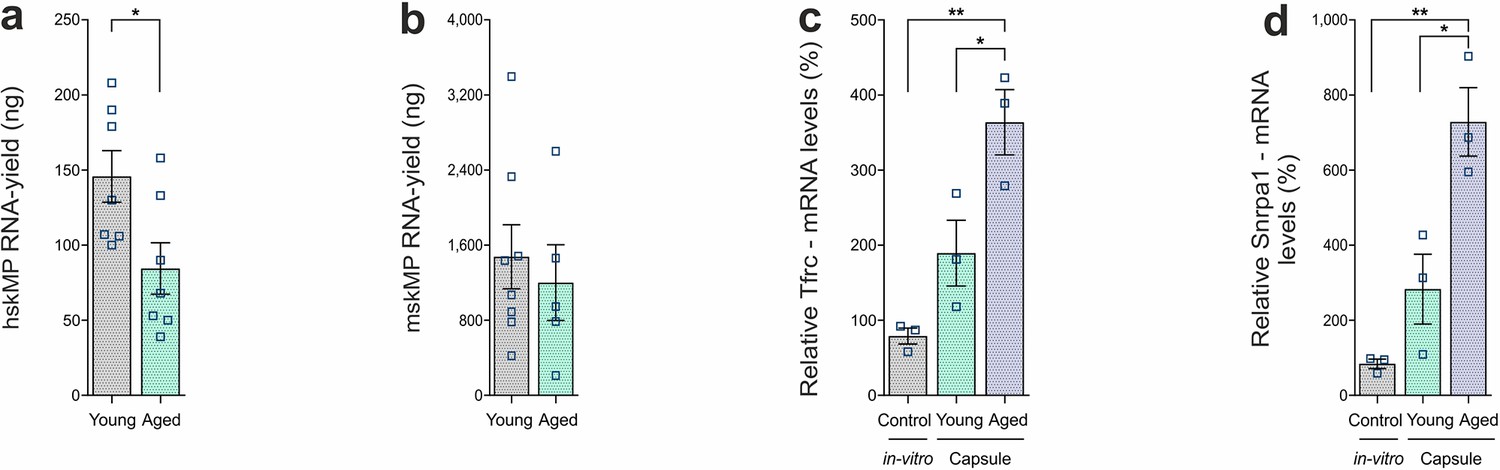
(a, b) RNA yield from capsules containing hskMPs or mskMPs after 10 days in vivo in young and aged mice. For each replicate two capsules from one mouse were pooled. Graphs represent means ± s.e.m. Data is derived from capsules of n ≥ 5 mice in each group. *p < 0.05 by Student’s t-test. (c, d) mRNA levels of the E2F target gene Tfrc and the Myc target Snrpa1 in hskMPs after 10 days of encapsulation in young and aged mice. hskMPs in 2D culture were included as an expression control (in vitro). Graphs represent means ± s.e.m. n = 3 mice (young and aged) or replicates (in vitro) for each condition. **p < 0.01, *p < 0.05 by one-way ANOVA followed by Bonferroni post hoc test.
Figure 4—figure supplement 2
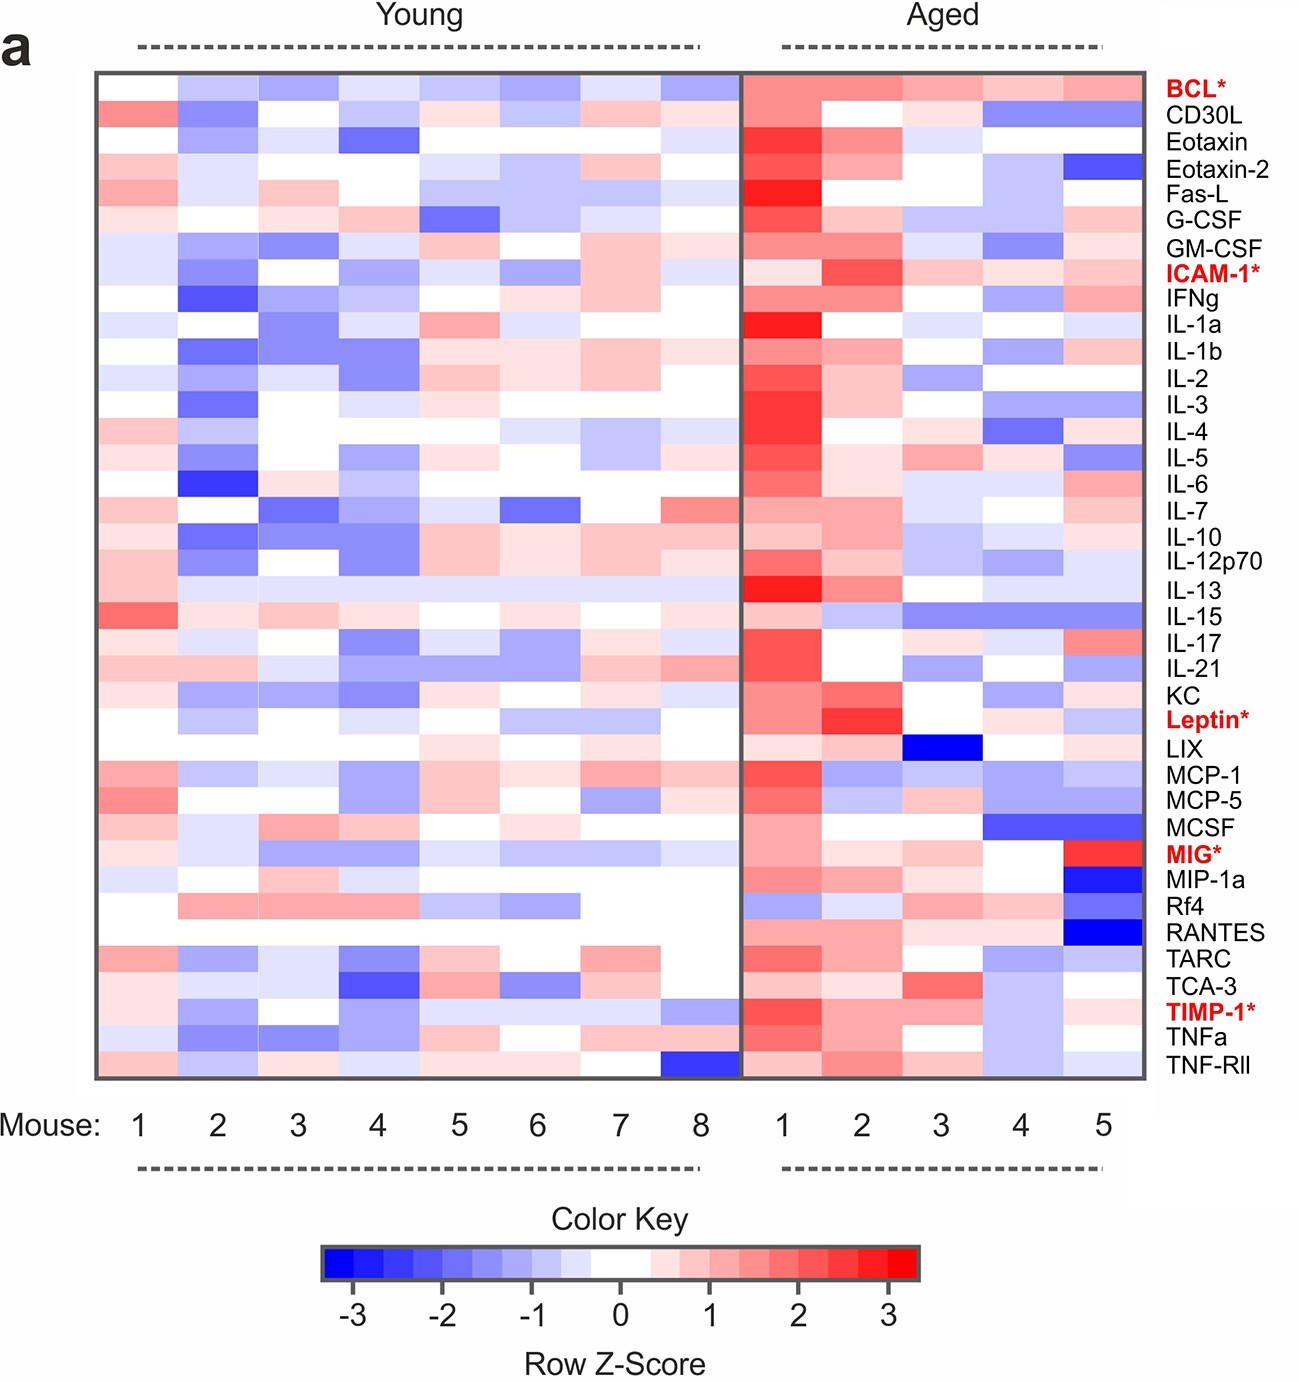
Inflammatory profiling in young and aged mice.
(a) Multiplexed enzyme-linked immunosorbent assay (ELISA) array heatmaps for levels of inflammatory factors in plasma of young and aged mice. n ≥ 5 mice. Asterisks indicate factors changed with a p-value of ≤0.05 in a two-sample Wilcoxon test. TNF-Rl and MIP-1g were excluded from the analysis since signals were outside of the detection range.
Figure 4—figure supplement 3
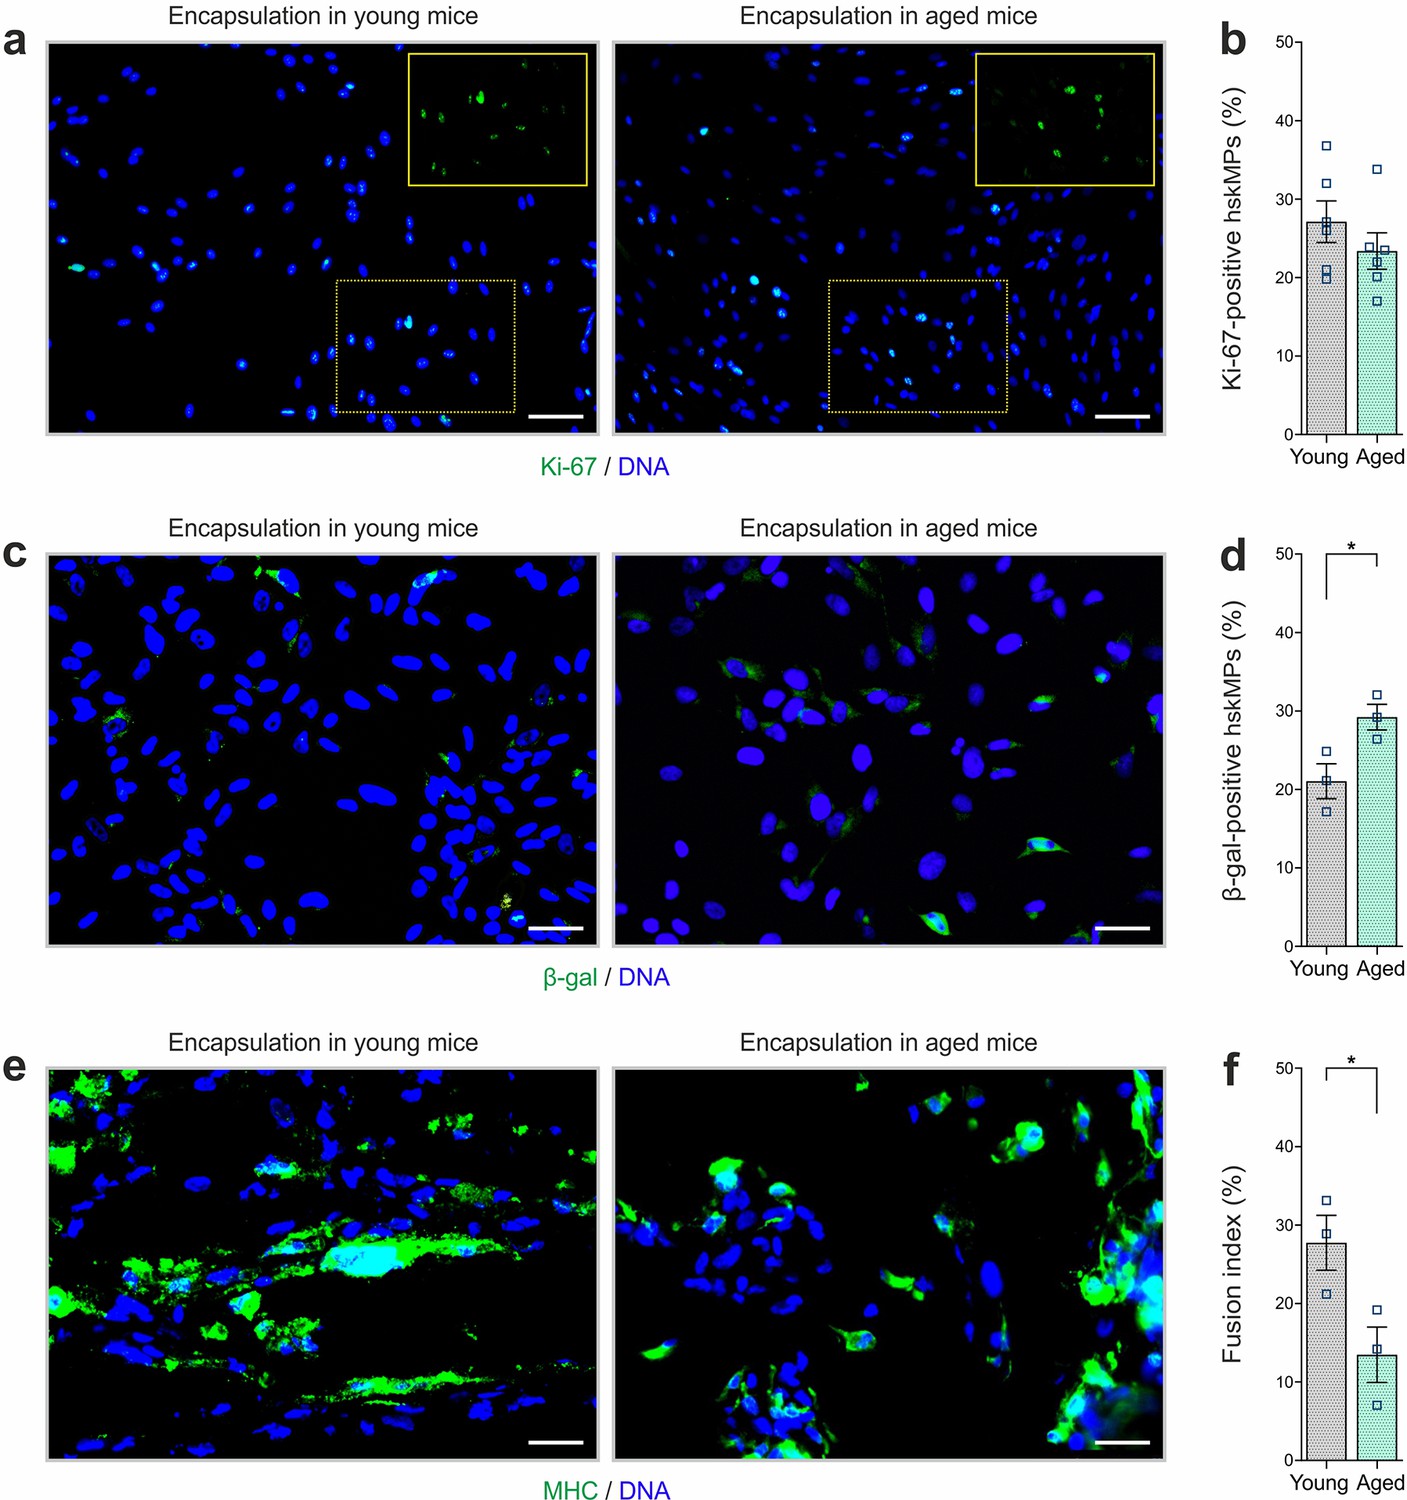
Proliferation, senescence, and differentiation of encapsulated cells after implantation in young and aged mice.
(a, b) Representative Ki-67 immunostainings and quantification of cross sections of capsules containing hskMPs after 10 days of exposure to the systemic environment in young and aged mice. (c, d) Representative β-galactosidase (β-gal) immunostainings and quantification of cross sections of capsules containing hskMPs after 10 days of exposure to the systemic environment in young and aged mice. (e, f) Representative MHC immunostainings and quantification of the fusion index in cross sections of capsules containing hskMPs after 10 days of exposure to the systemic environment in young and aged mice. Scale bars: 70 µm (a), 40 µm (c, e). Graphs represent means ± s.e.m. Data is derived from n ≥ 3 mice in each group. *p < 0.05 by Student’s t-test.
Figure 4—figure supplement 4
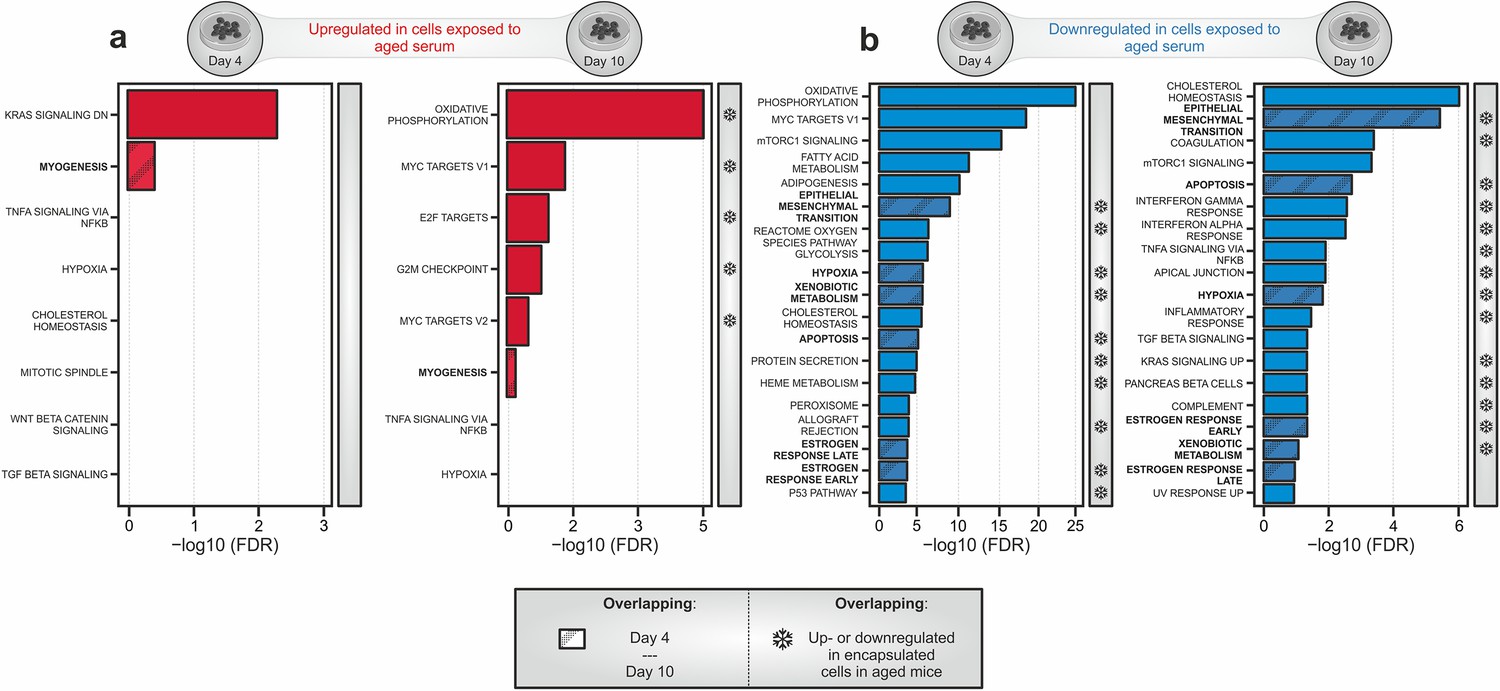
Transcriptomic profiling of cells exposed to young and aged serum in 2D culture.
(a) Gene set enrichment analysis (GSEA) of genes induced in hskMPs in 2D culture in the presence of aged human serum for 4 or 10 days compared to the young condition. Gene sets that were also induced in encapsulated cells in aged mice (Figure 4a) are marked by snowflakes. (b) GSEA of genes downregulated in hskMPs in 2D culture in the presence of aged human serum for 4 or 10 days compared to the young condition. Gene sets that were also downregulated in encapsulated cells in aged mice (Figure 4d) are marked by snowflakes. Samples and data are derived from hskMPs exposed to human serum from n = 3 different young or aged donors. False discovery rate (FDR) = Adjusted p-value using Benjamini-Hochberg procedure.
Figure 4—figure supplement 5
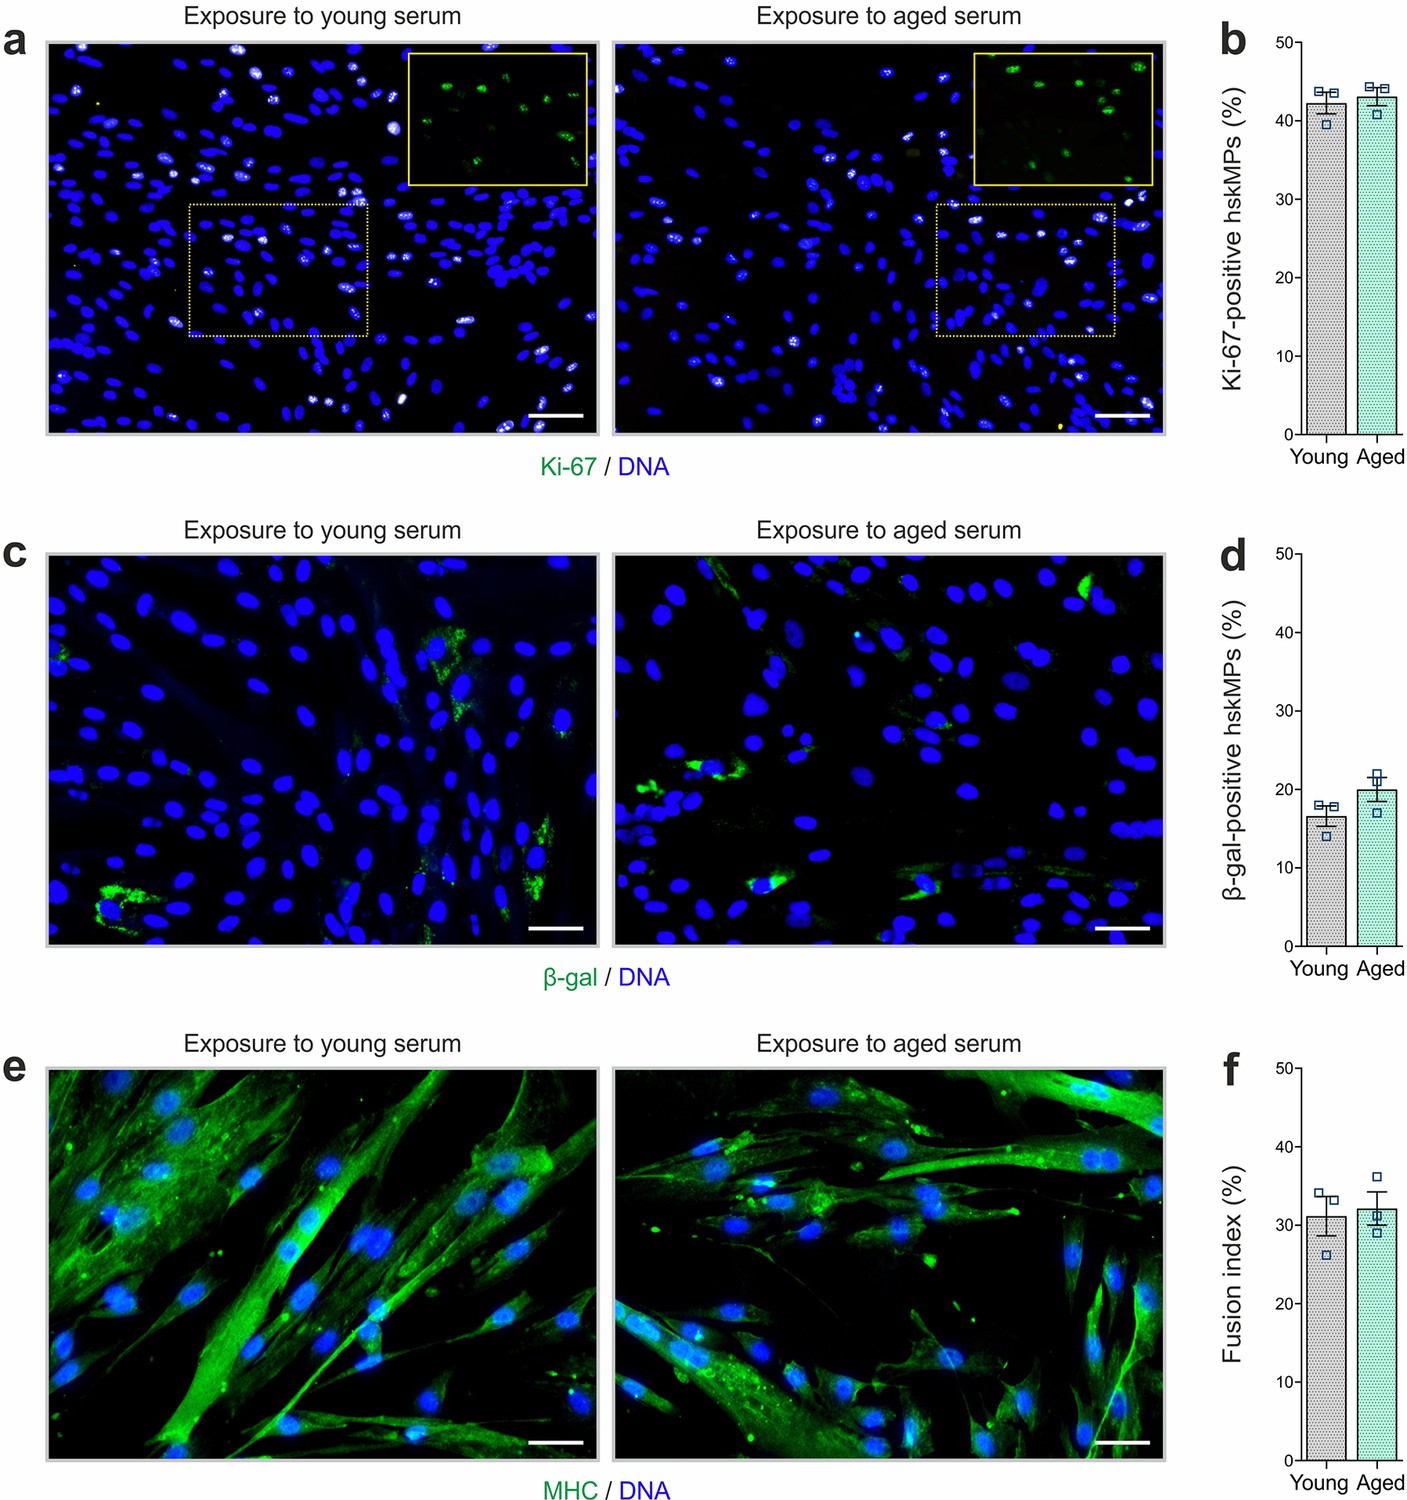
Proliferation, senescence, and differentiation of cells after exposure to young and aged serum in 2D culture.
(a, b) Representative Ki-67 immunostainings and quantification of 2D cultured hskMPs exposed to young and aged human serum for 4 days. (c, d) Representative β-gal immunostainings and quantification of 2D cultured hskMPs exposed to young and aged human serum for 4 days. (e, f) Representative MHC immunostainings and quantification of the fusion index of 2D hskMPs exposed to young and aged human serum under differentiation conditions for 4 days. Scale bars: 70 µm (a), 40 µm (c, e). Graphs represent means ± s.e.m. Data is derived from n = 3 replicates in young or aged serum. Significance was determined using Student’s t-test.
Additional files
-
Supplementary file 1
Tables.
(a) Multiplexed enzyme-linked immunosorbent assay (ELISA) quantification of inflammatory factors in serum of mice that underwent surgical implantation of polyethersulfone (PES) hollow fiber capsules compared to untreated controls 10 days after the procedure. n ≥ 7 mice. Each value represents averages in pg/ml from n = 4 technical replicates for each factor. TNF-Rl and MIP-1g were excluded from the analysis since signals were outside of the detection range. (b) Gene sets increased with age in encapsulated human skeletal muscle progenitors (hskMPs) compared to the young control after 10 days in vivo. Data are derived from capsules of n ≥ 5 mice in each age group. GST p-value (Pval) = Wilcoxon gene set test p-value. GST FDR = Adjusted p-value using the Benjamini-Hochberg procedure. GST FDR = Wilcoxon gene set test false discovery rate. (c) Gene sets increased with age in encapsulated mouse skeletal muscle progenitors (mskMPs) compared to the young control after 10 days in vivo. Data are derived from capsules of n ≥ 5 mice in each age group. GST Pval = Wilcoxon gene set test p-value. GST FDR = Adjusted p-value using the Benjamini-Hochberg procedure. (d) Significantly enriched Hallmark Myc V1 target genes when comparing encapsulated hskMPs in aged mice to the young control after 10 days in vivo. Data are derived from capsules of n ≥ 5 mice in each age group. Pval < 1%. (e) Significantly enriched Hallmark E2F target genes when comparing encapsulated hskMPs in aged mice to the young control after 10 days in vivo. Data are derived from capsules of n ≥ 5 mice in each age group. Pval < 1%. (f) Multiplexed ELISA array quantification of levels of inflammatory factors in plasma of mice young and aged mice. n ≥ 5 mice. Each value represents averages in pg/ml from n = 4 technical replicates for each factor. TNF-Rl and MIP-1g were excluded from the analysis since signals were outside of the detection range. (g) Gene sets decreased with age in encapsulated hskMPs compared to the young control after 10 days in vivo. Data are derived from capsules of n ≥ 5 mice in each age group. GST Pval = Wilcoxon gene set test p-value. GST FDR = Adjusted p-value using the Benjamini-Hochberg procedure. (h) Gene sets decreased with age in encapsulated mskMPs compared to the young control after 10 days in vivo. Data are derived from capsules of n ≥ 5 mice in each age group. GST Pval = Wilcoxon gene set test p-value. GST FDR = Adjusted p-value using the Benjamini-Hochberg procedure. (i) Gene sets increased with age in niche-resident freshly isolated mouse muscle stem cells compared to the young control. Data from n = 8 young or aged mice. GST Pval = Wilcoxon gene set test p-value. GST FDR = Adjusted p-value using the Benjamini-Hochberg procedure. (j) Gene sets decreased with age in niche-resident freshly isolated mouse muscle stem cells compared to the young control. Data from n = 3 young or aged mice. GST Pval = Wilcoxon gene set test p-value. GST FDR = Adjusted p-value using the Benjamini-Hochberg procedure. (k) Gene sets increased after 4 days in 2D hskMP culture exposed to aged human serum compared to the young human serum. GST Pval = Wilcoxon gene set test p-value. Data are derived from hskMPs exposed to human serum from n = 3 different young or aged donors. GST FDR = Adjusted p-value using the Benjamini-Hochberg procedure. (l) Gene sets increased after 10 days in 2D hskMP culture exposed to aged human serum compared to the young human serum. Data are derived from hskMPs exposed to human serum from n = 3 different young or aged donors. GST Pval = Wilcoxon gene set test p-value. GST FDR = Adjusted p-value using the Benjamini-Hochberg procedure. (m) Gene sets decreased after 4 days in 2D hskMP culture exposed to aged human serum compared to the young human serum. Data are derived from hskMPs exposed to human serum from n = 3 different young or aged donors. GST Pval = Wilcoxon gene set test p-value. GST FDR = Adjusted p-value using the Benjamini-Hochberg procedure. (n) Gene sets decreased after 10 days in 2D hskMP culture exposed to aged human serum compared to the young human serum. Data are derived from hskMPs exposed to human serum from n = 3 different young or aged donors. GST Pval = Wilcoxon gene set test p-value. GST FDR = Adjusted p-value using the Benjamini-Hochberg procedure.
- https://cdn.elifesciences.org/articles/57393/elife-57393-supp1-v3.doc
-
Transparent reporting form
- https://cdn.elifesciences.org/articles/57393/elife-57393-transrepform1-v3.docx
Download links
A two-part list of links to download the article, or parts of the article, in various formats.
Downloads (link to download the article as PDF)
Open citations (links to open the citations from this article in various online reference manager services)
Cite this article (links to download the citations from this article in formats compatible with various reference manager tools)
In vivo transcriptomic profiling using cell encapsulation identifies effector pathways of systemic aging
eLife 11:e57393.
https://doi.org/10.7554/eLife.57393


