Integration of IL-2 and IL-4 signals coordinates divergent regulatory T cell responses and drives therapeutic efficacy
- Department of Pathology, Case Western Reserve University School of Medicine, United States
Figures
Figure 1 with 4 supplements
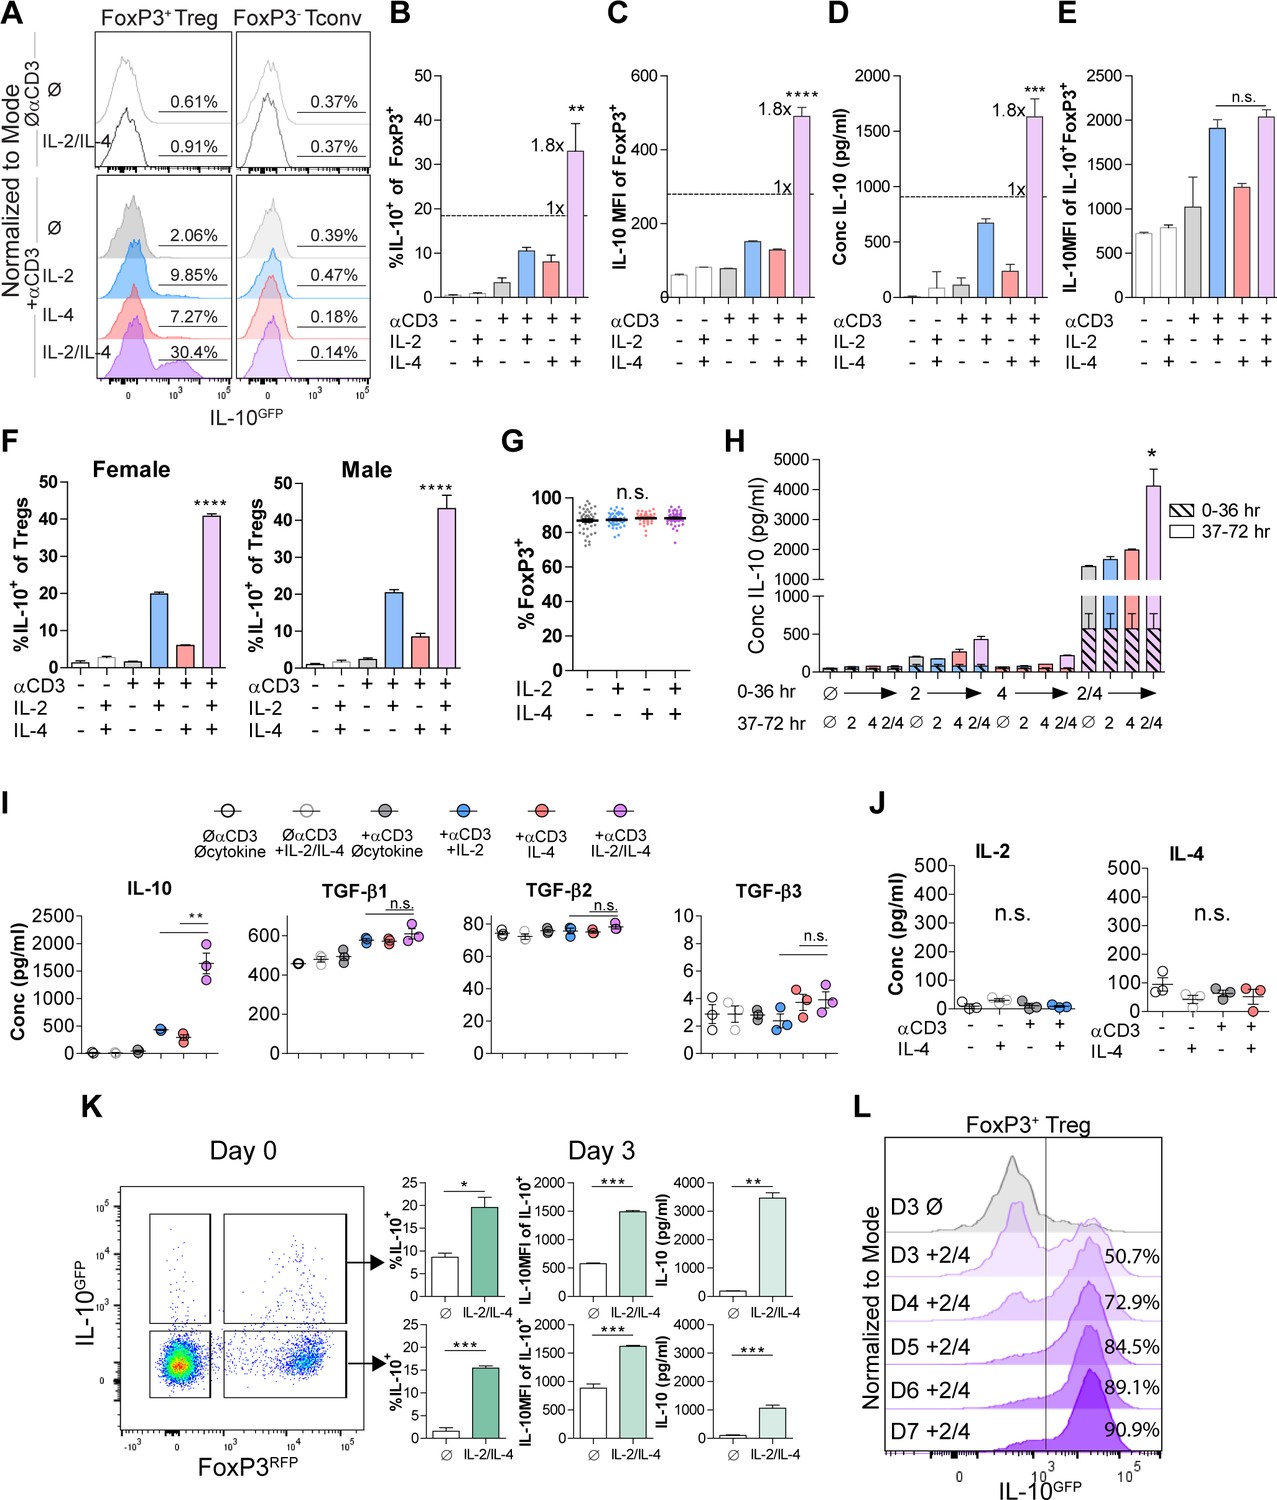
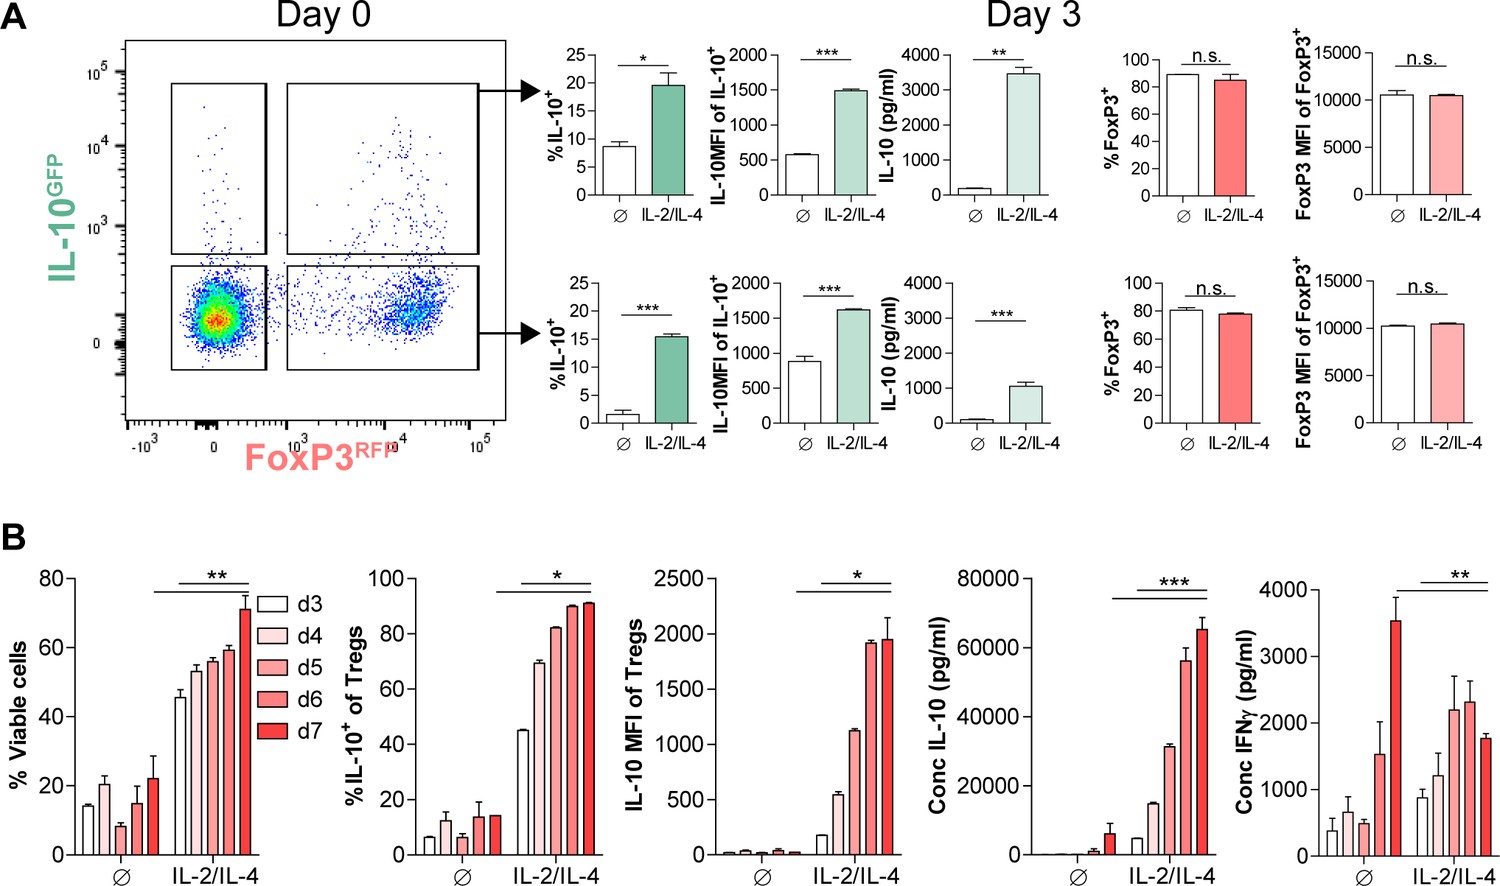
IL-2 and IL-4 synergistically promote IL-10 production by Tregs.
(A–C) IL-10 expression of Tregs purified from Foxp3RFP/Il10GFP dual reporter mice (see also Figure 1—figure supplement 1) cultured for 3 days with the designated stimulants as analyzed by flow cytometry. The IL-2/IL-4 condition is twofold the concentration of the single cytokines. For all panels, N ≥ 3 for all bar graphs and histograms are representative. (D) IL-10 production of Tregs cultured with the designated stimulation as quantified by ELISA of the culture supernatants. N = 3. (E) IL-10 expression of purified IL-10+ Tregs cultured with the designated stimulation as quantified by flow cytometry. N = 3. (F) Female and male responses to combinatorial cytokine stimulation after 3 days, as measured by flow cytometry for IL-10 expression. N = 3. (G) FoxP3 expression by purified Tregs stimulated in culture for 3 days with the designated conditions, as analyzed by flow cytometry. N ≥ 27. (H) IL-10 expression of purified Tregs stimulated for 36 hr in culture, washed, and then subsequently stimulated for another 36 hr in culture with the indicated conditions, as analyzed by flow cytometry. All samples received αCD3ε activation (see also Figure 1—figure supplement 2C). N = 3. (I) Cytokine production following 3 days of Treg culture as quantified by multianalyte Luminex of the culture supernatants (see also Figure 1—figure supplement 3). N = 3. (J) IL-2 and IL-4 production by Tregs following 3 days of stimulation with the designated conditions, as quantified by ELISA of the culture supernatants. N = 3. (K) IL-10 production of purified IL-10+ or IL-10- Tregs following 3 days of culture with αCD3ε and combined IL-2/IL-4, as analyzed by flow cytometry (see also Figure 1—figure supplement 4A). N = 3. (L) IL-10 production of purified Tregs cultured with αCD3ε and combined IL-2/IL-4 for 3–7 days as analyzed by flow cytometry (see also Figure 1—figure supplement 4B). Histograms are representative of three independent experiments. Mean ± SEM are indicated. *p<0.05, **p<0.01, ***p<0.001, ****p<0.0001.
Figure 1—figure supplement 1
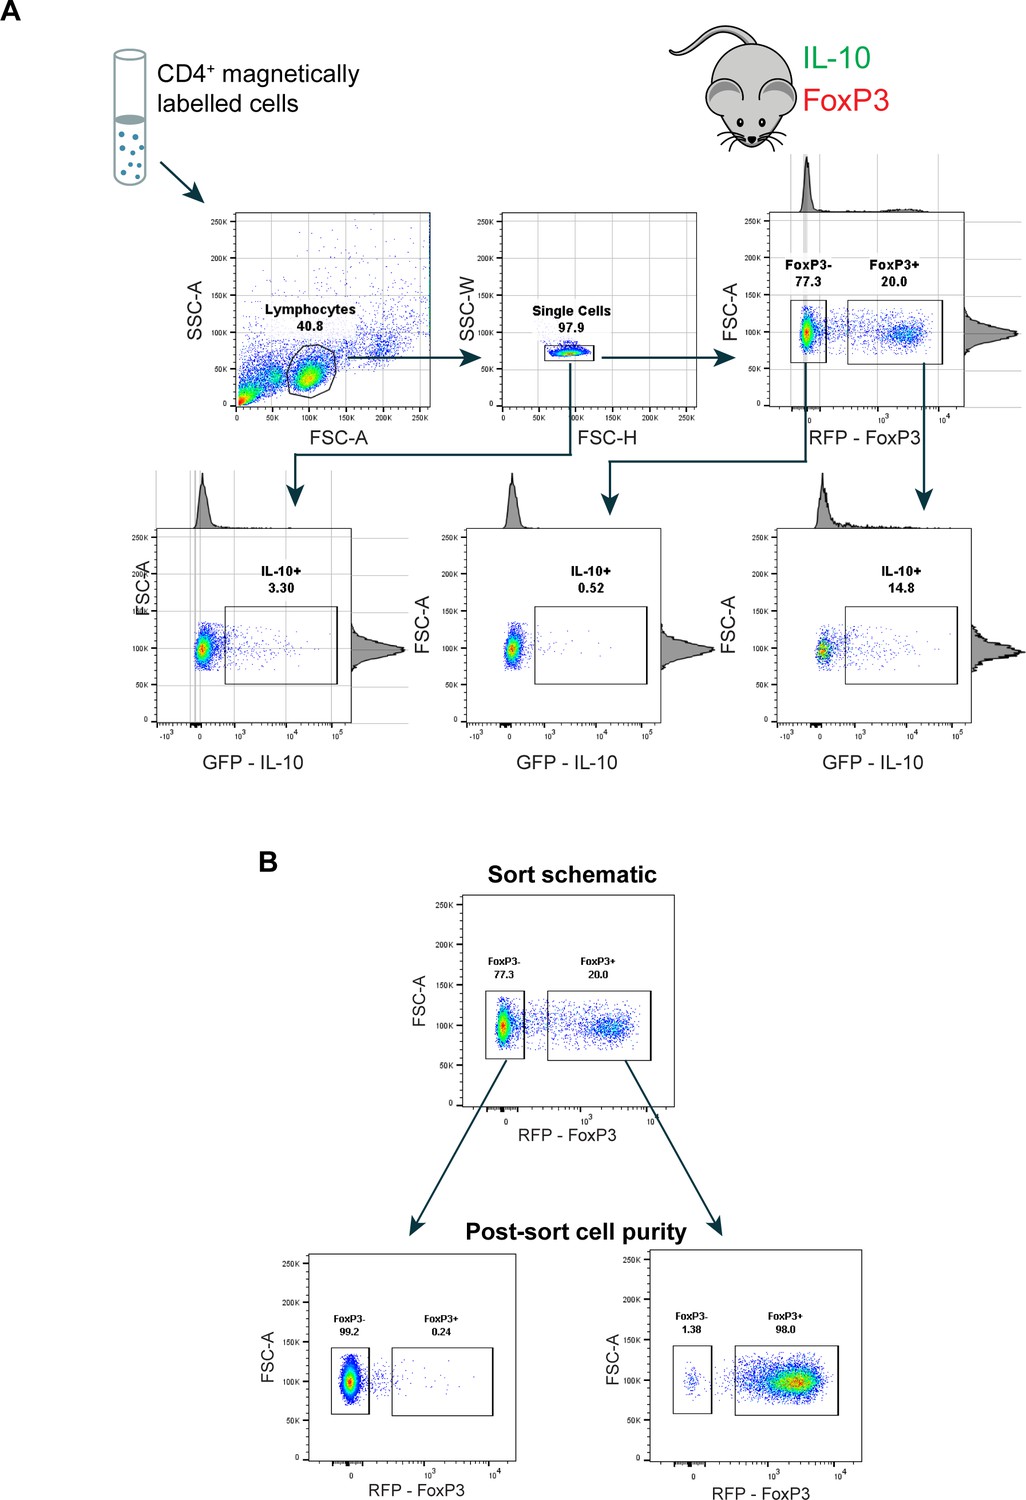
Cell sorting gating strategy and post-sort purity.
(A) Gating strategy for flow cytometry sorting and analyzing IL-10+/- Tregs from Foxp3RFP/Il10GFP dual-reporter mice. Freshly harvested spleens underwent CD4+ magnetic bead selection prior to fluorescence-activated cell sorting. Related to Figure 1. (B) Sorted cells were immediately analyzed by flow cytometry to determine purity. Related to Figure 1.
Figure 1—figure supplement 2
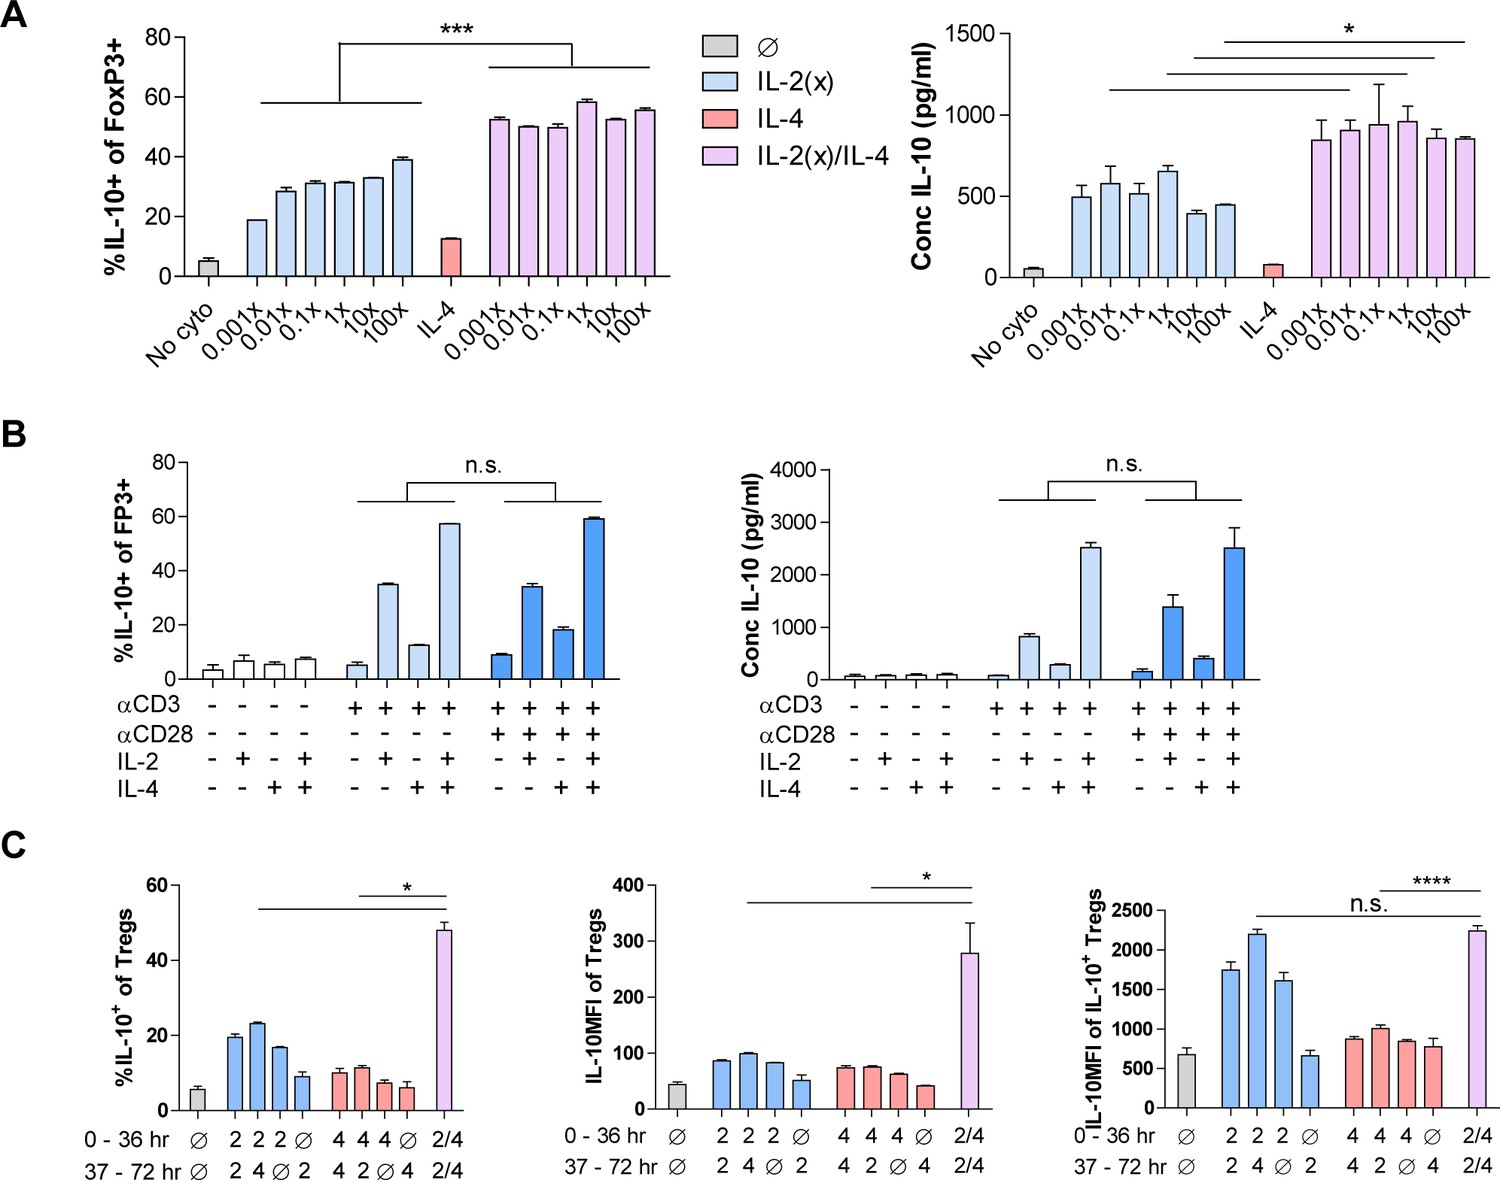
Dosing and time-dependency of combinatorial cytokine stimulation in Tregs.
(A) IL-10 expression and production by purified Tregs stimulated for 3 days with the indicated cytokines while titrating IL-2 and analyzed by flow cytometry and ELISA, respectively. 1× IL-2 = 728 pM. (B) IL-10 expression and production by purified Tregs stimulated for 3 days with the indicated T cell receptor activation, co-stim, and cytokine conditions, analyzed by flow cytometry and ELISA, respectively. (C) IL-10 expression of purified Tregs stimulated for 36 hr in culture with the first set of conditions, washed, and subsequently stimulated for another 36 hr in culture with the second set of conditions, as analyzed by flow cytometry. All samples received αCD3ε activation. N = 3. Related to Figure 1H. For all panels, mean ± SEM are indicated. *p<0.05, **p<0.01, ***p<0.001, ****p<0.0001.
Figure 1—figure supplement 3
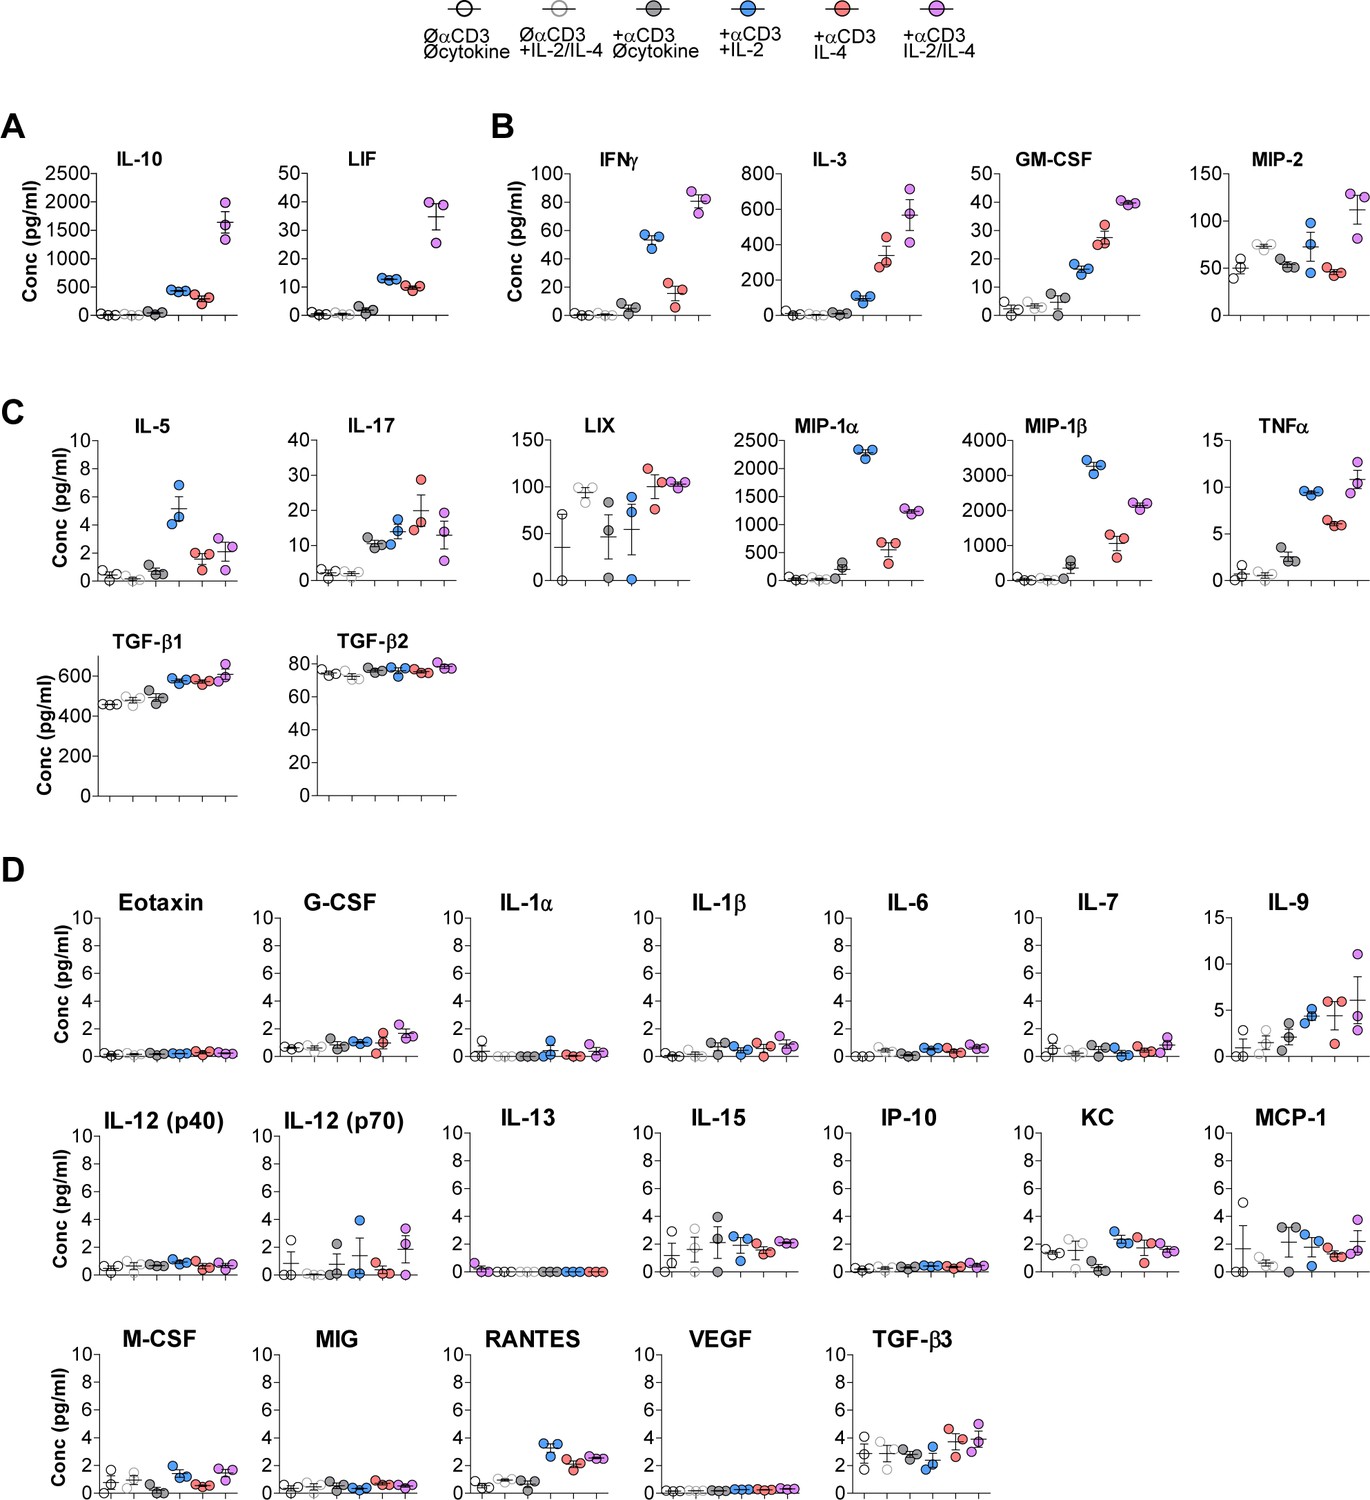
IL-10 is the only synergistic and robust analyte produced by Tregs following combinatorial cytokine stimulation 31-plex.
Luminex analysis of cytokines secreted into the media following the designated stimulation conditions grouped in cytokines that (A) synergistically increase with combinatorial cytokine stimulation, (B) are summative, (C) show no change compared to single cytokine stimulation, and (D) are not highly expressed. Related to Figure 1I and J. N = 3. For all panels, mean ± SEM are indicated.
Figure 1—figure supplement 4
Dynamics of combinatorial cytokine stimulation of Tregs over time.
(A) IL-10 and FoxP3 expression of purified IL-10+/- Tregs that underwent culture with αCD3ε and combined IL-2/IL-4for 3 days, as analyzed by flow cytometry. N = 3. Related to Figure 1K. (B) Analysis of viability and IL-10 expression of purified Tregs cultured with αCD3ε and combined IL-2/IL-4 for 3–7 days, as analyzed by flow cytometry. IL-10 and IFNγ contents in the culture media were analyzed by ELISA. Related to Figure 1L. For all panels, mean ± SEM are indicated. *p<0.05, **p<0.01, ***p<0.001, ****p<0.0001.
Figure 2 with 1 supplement
IL-2/IL-4 enhances Treg proliferation and selectively drives the expansion of IL-10+ Tregs.
(A and B) Treg proliferation as measured by CellTrace signal following 3 days of culture with αCD3ε and all combinations of IL-2 and IL-4, with division and proliferation indices indicated. N = 3 for all bar graphs and histograms are representative. (C) IL-10 expression of purified Tregs cultured for 3 days with αCD3ε and the designated cytokines, and gated by CellTrace generation, as measured by flow cytometry (panel A). N = 3. The IL-10 expression of all IL-2/IL-4-induced Treg generations are statistically significant (p<0.05) compared to the other cytokine-stimulated conditions. (D) Proliferation and viability of purified IL-10+ and IL-10- Tregs cultured for 3 days with αCD3ε and both IL-2 and IL-4, as flow cytometry analysis of CellTrace and Sytox Red signal. The histograms are representative. N = 3. (E and F) Proliferation of purified Tregs cultured for 3 days with αCD3ε and all cytokine combinations, gated on IL-10+/- expression, as analyzed by flow cytometry. N = 3 for all bar graphs and histograms are representative. (G) Division index of wild type (FoxP3creYFP) and IL-10 cKO (IL-10fl/fl× FoxP3creYFP) purified Tregs that were stimulated with the indicated conditions for 3 days, as analyzed by flow cytometry. N = 3 for all bars. (H) Cell count of IL-10+ Tregs following 3–7 days of culture with αCD3ε and all combinations of IL-2 and IL-4, as analyzed by flow cytometry. N = 3. The cell counts of all IL-2/IL-4-induced conditions are statistically significant (p<0.05) compared to the other cytokine-stimulated conditions. For all panels, mean ± SEM are indicated. *p<0.05, **p<0.01, ***p<0.001.
Figure 2—figure supplement 1
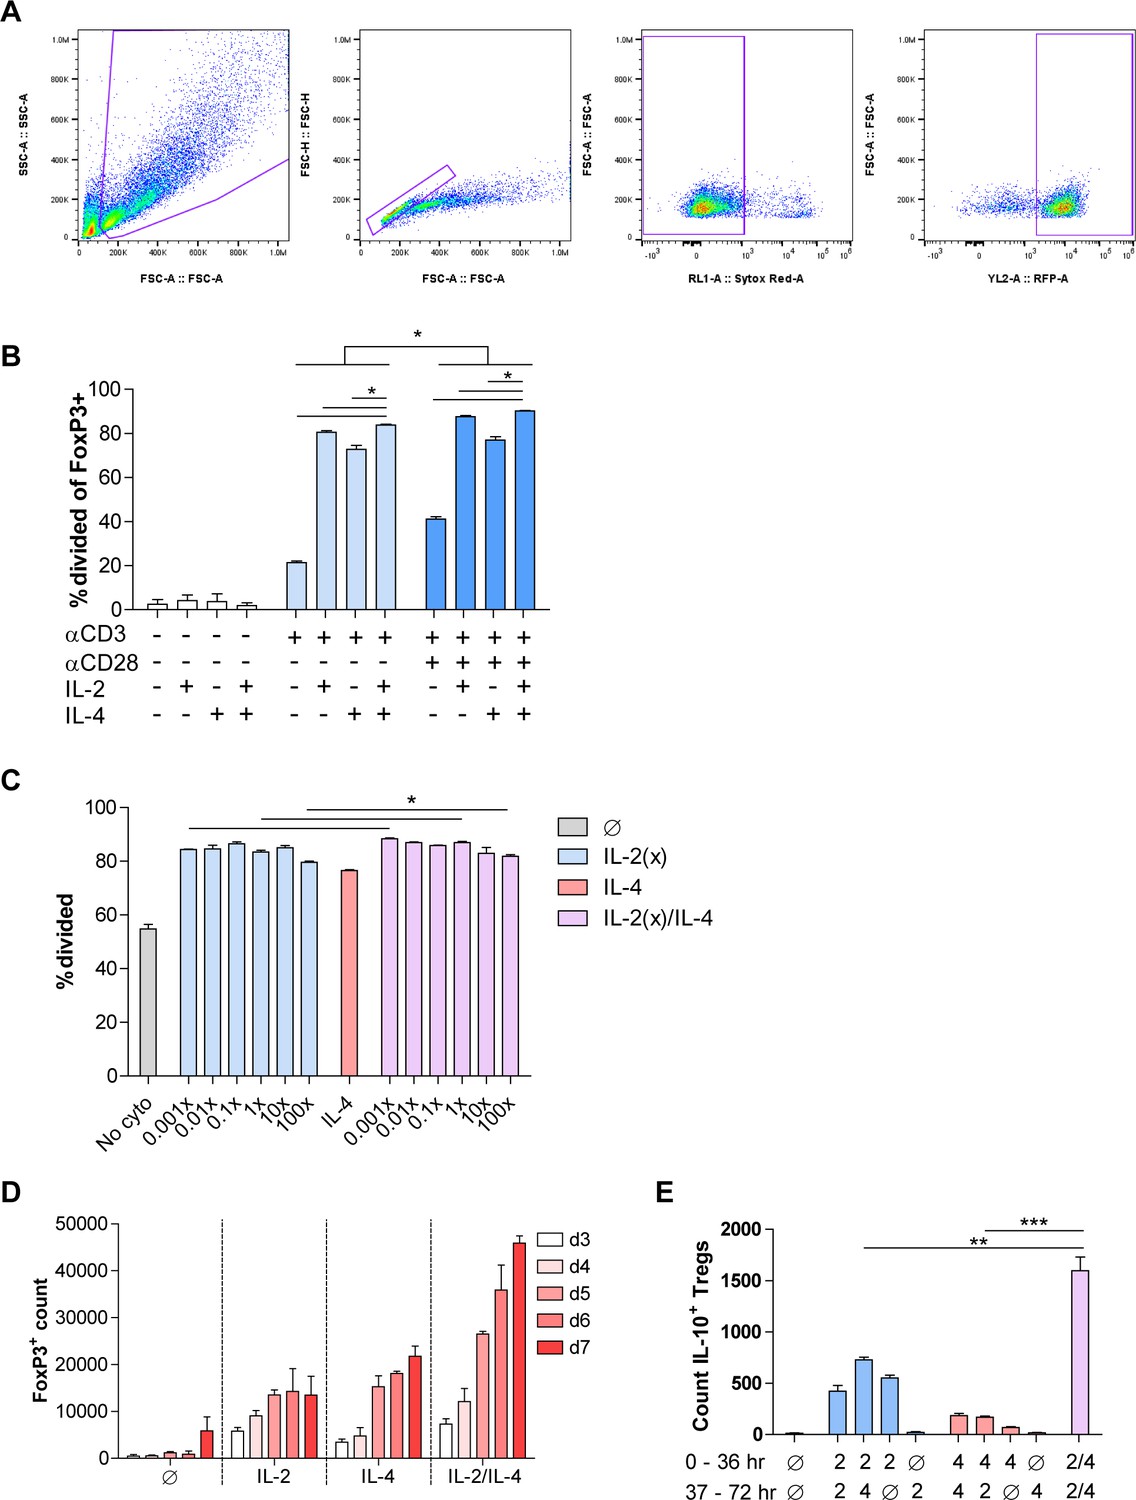
Dosing and time-dependency of combinatorial cytokine stimulation on Treg proliferation.
(A) Flow cytometry gating schematic for FoxP3+ Treg proliferation analyses. Cells are first gated on FSC-A and SSC-A, then a single cell gate made on FSC-A and FSC-H. Sytox red negative events represent live cells, and then FoxP3-RFP positive events are gated. (B) Proliferation of Tregs stimulated for 3 days with the indicated T cell receptor, co-stim, and cytokine conditions, analyzed by flow cytometry. (C) Analysis of cellular division of Tregs stimulated for 3 days with the indicated cytokines while titrating IL-2 and analyzed by flow cytometry. 1× IL-2 = 728 pM. (D) Treg count following culture with αCD3ε and combined IL-2/IL-4 for 3–7 days, as analyzed by flow cytometry. Related to Figure 2I. (E) Enumeration of purified Tregs that underwent stimulation with αCD3ε and all cytokine combinations for 36 hr in culture with the first stimulation conditions, and another 36 hr with the second stimulation conditions after washing. Cells underwent flow cytometry. N = 3. For all panels, mean ± SEM are indicated. *p<0.05, **p<0.01, ***p<0.001, ****p<0.0001.
Figure 3 with 1 supplement

Combined IL-2 and IL-4 increase the suppressive ability of Tregs.
(A–C) Proliferation (flow cytometry) and cytokine output (ELISA) of freshly isolated and Celltrace-stained Tconv co-cultured with αCD3ε and the indicated ratios of WT Tregs separately and previously stimulated with αCD3ε and all cytokine conditions for 3 days, washed, and normalized for cell number at the time of co-culture. The flow histograms were gated on Tconv cells. N = 3 for all graphs and histograms are representative. (D–F) Proliferation (flow cytometry) and cytokine production (ELISA) of freshly isolated Tconv cells co-cultured with αCD3ε and the indicated ratios of IL-10-/- Tregs separately and previously stimulated with αCD3ε and all cytokine conditions for 3 days, washed, and normalized for cell number at the time of co-culture. The flow histograms were gated on Tconv cells. N = 3 for all graphs and histograms are representative. (G–I) Proliferation (flow cytometry) and cytokine production (ELISA) of freshly isolated Tconv cells from WT mice co-cultured with αCD3ε and the indicated ratios of IL-10 cKO Tregs separately and previously stimulated with αCD3ε and all cytokine conditions for 3 days, then washed. The flow histograms were gated on Tconv cells. N = 3 for all graphs and histograms are representative. (J–L) Proliferation (flow cytometry) and cytokine production (ELISA) of freshly isolated Tconv cells co-cultured with αCD3ε and the indicated ratios of WT Tregs separately and previously stimulated with αCD3ε and all cytokine conditions for 7 days. Co-culture ratio was based on the number of Tregs prior to cytokine stimulation to incorporate their proliferation. The flow histograms were gated on Tconv cells. N = 3 for all graphs and histograms are representative. (M) Percentage of the overall culture comprising of WT or IL-10 cKO Tregs and Tconv over the course of time as determined by flow cytometry. The Tregs were purified and stimulated with αCD3ε and all cytokine conditions for 3 days, washed, then placed in co-culture with freshly isolated Tconv cells at a 1:8 Treg:Tconv starting ratio (line). N = 3. For all panels, mean ± SEM are indicated. *p<0.05, ****p<0.0001.
-
Figure 3—source data 1
Numeric values of the heatmaps in Figure 3B–C (A), Figure 3E–F (B), Figure 3H–I (C), and Figure 3K–L (D).
Values were obtained by analyzing the suppression assay supernatants by ELISA.
- https://cdn.elifesciences.org/articles/57417/elife-57417-fig3-data1-v1.xlsx
Figure 3—figure supplement 1
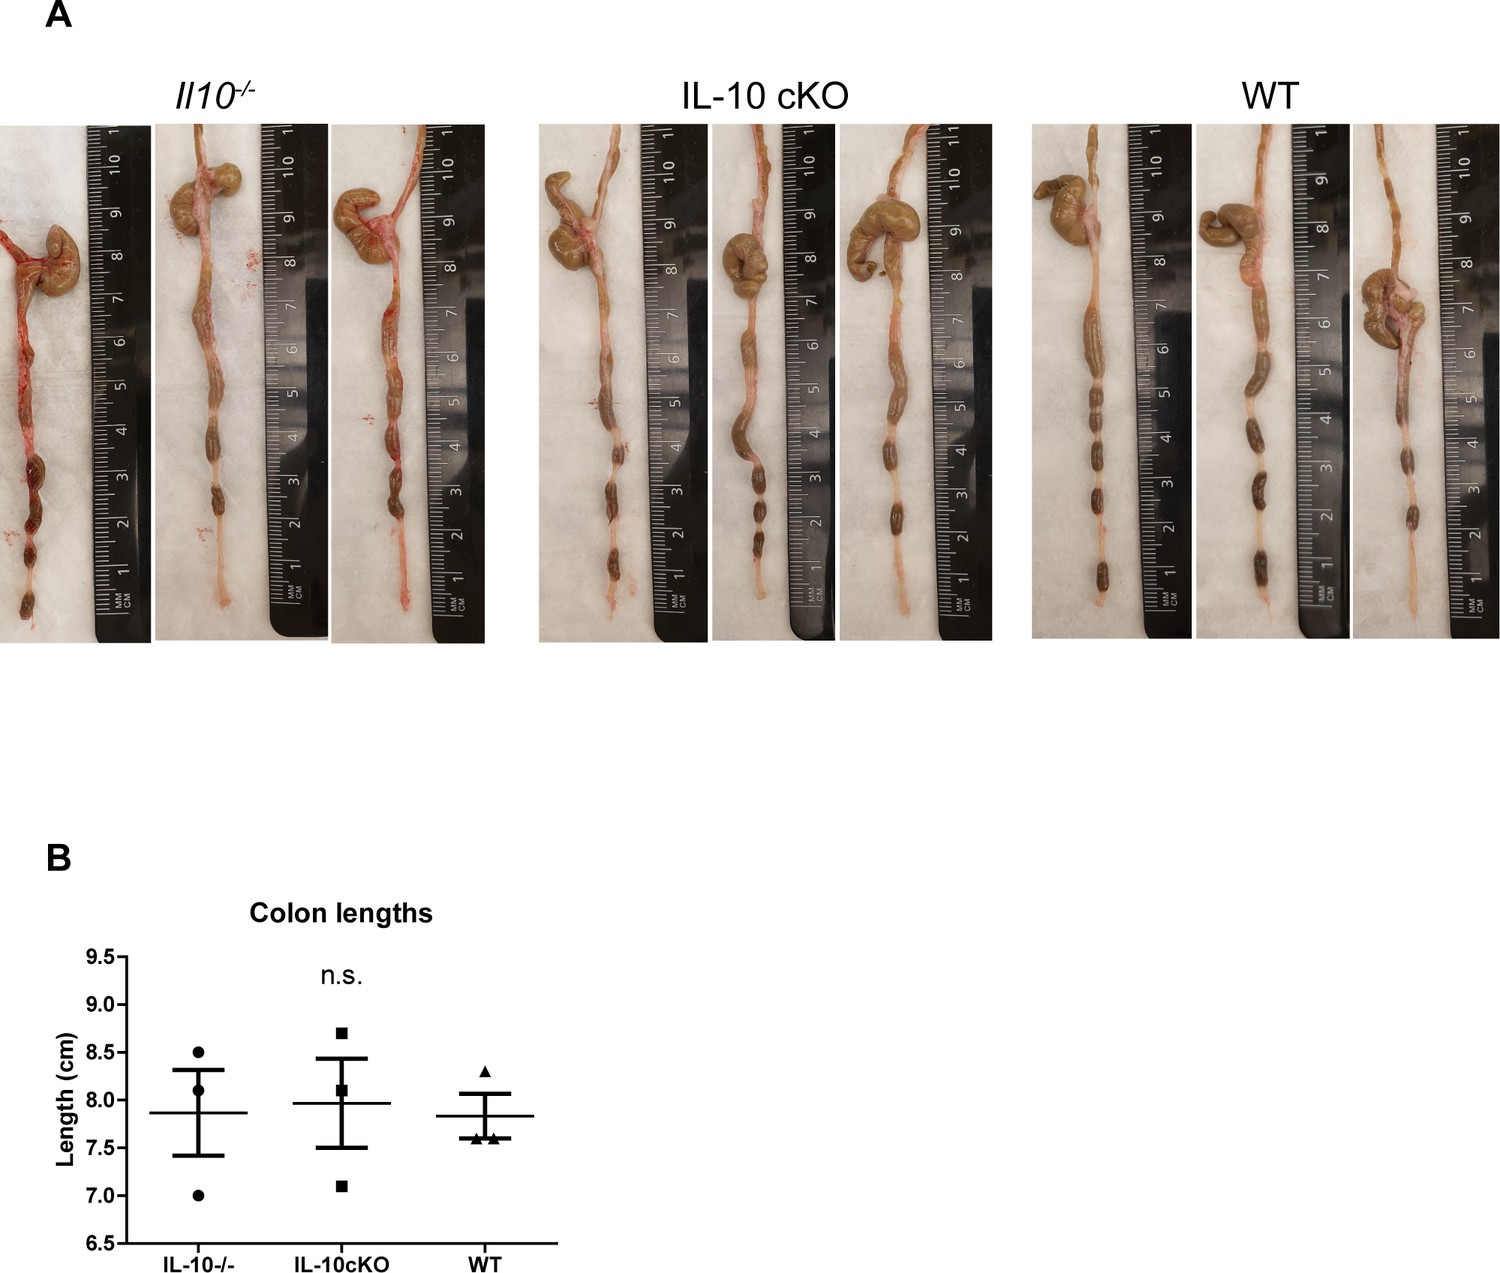
Colon lengths of conditional and global Il10 knockout mice.
(A and B) Mouse colon photographs and their lengths as measured by the distance between anus (at 0) and cecum.
Figure 4 with 1 supplement
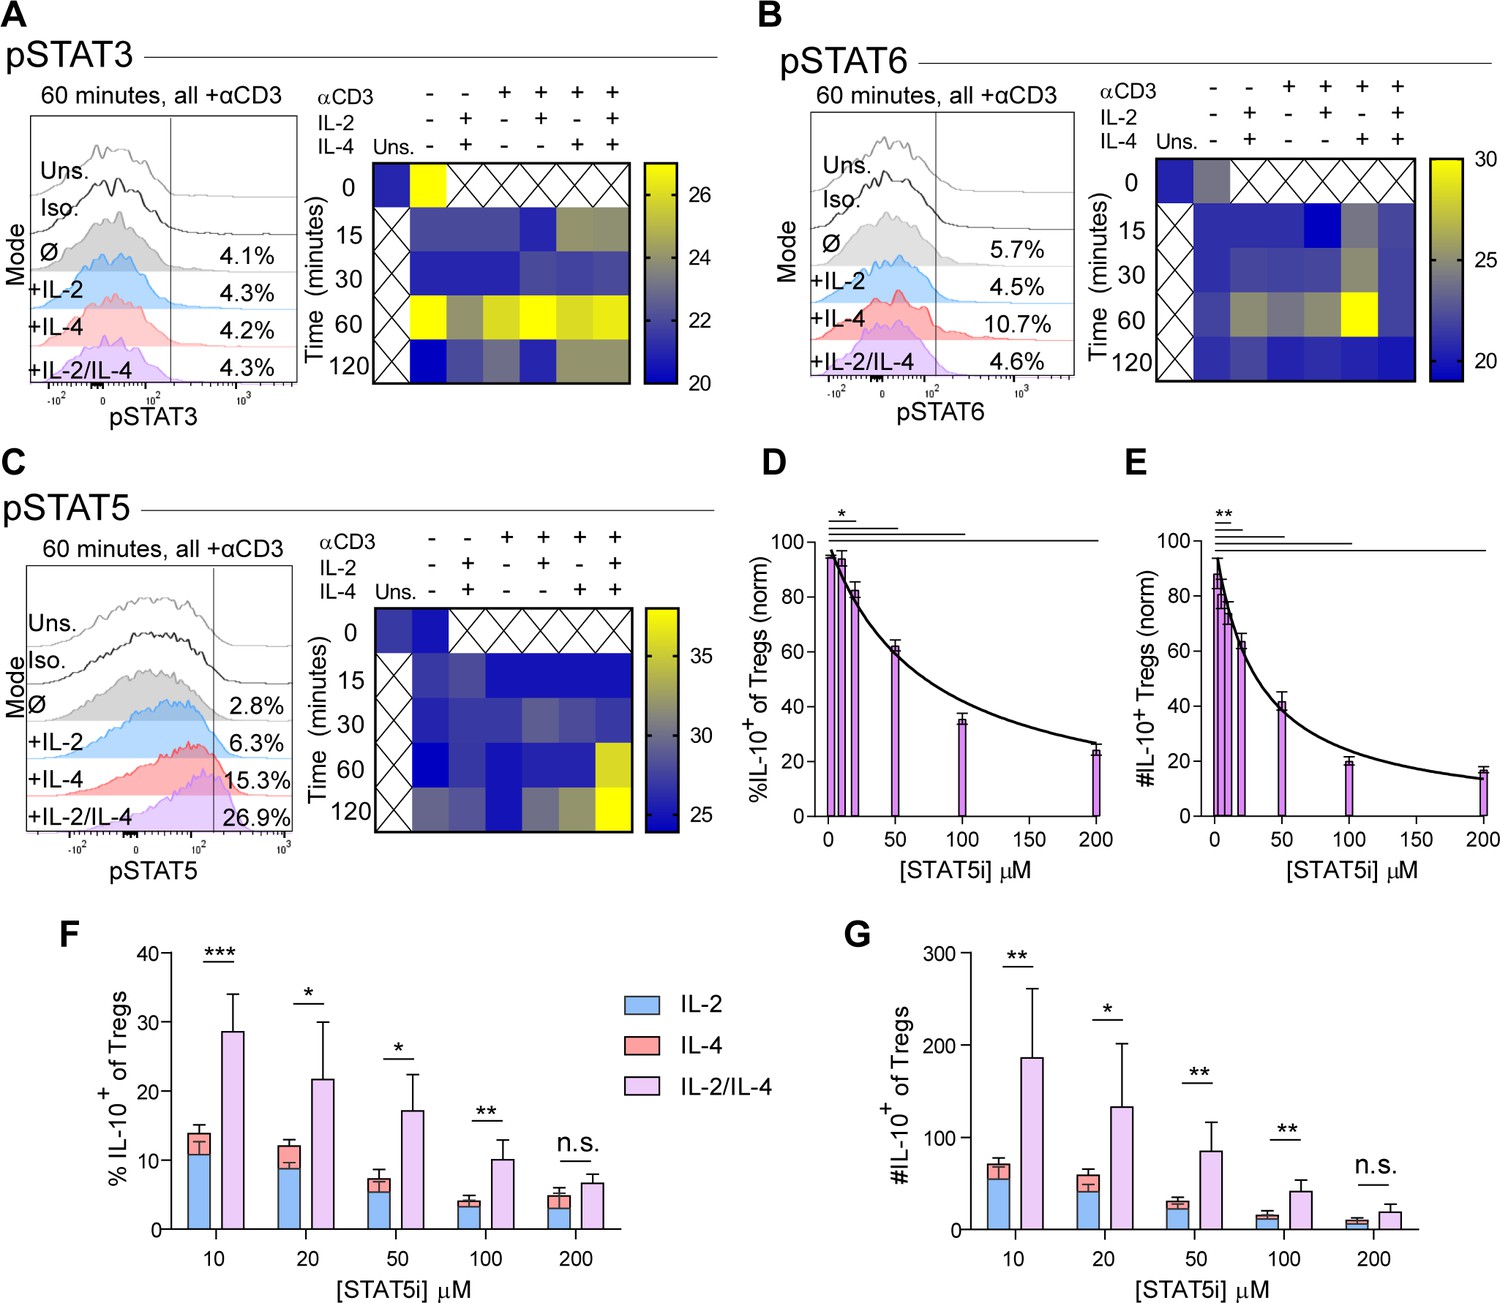
Synergistic IL-10 production and proliferation is STAT5-dependent.
(A–C) pSTAT3, pSTAT6, and pSTAT5 expression of purified Tregs stimulated with the indicated culture conditions as analyzed by flow cytometry. The histograms are representative and heatmaps of median fluorescence intensity (MFI) represent N ≥ 3 experiments. (D and E) Treg expression of IL-10 and enumeration of IL-10+ Tregs following αCD3ε, combined IL-2/IL-4, and STAT5i supplementation in 3-day culture, as analyzed by flow cytometry (see also Figure 4—figure supplement 1). N = 3. (F and G) IL-10 expression in Tregs and IL-10+ Tregs counts following αCD3ε, all combinations of IL-2 and IL-4, and STAT5i supplementation in 3-day culture, as analyzed by flow cytometry. N = 3. For all panels, mean ± SEM are indicated. *p<0.05, **p<0.01, ***p<0.001.
Figure 4—figure supplement 1
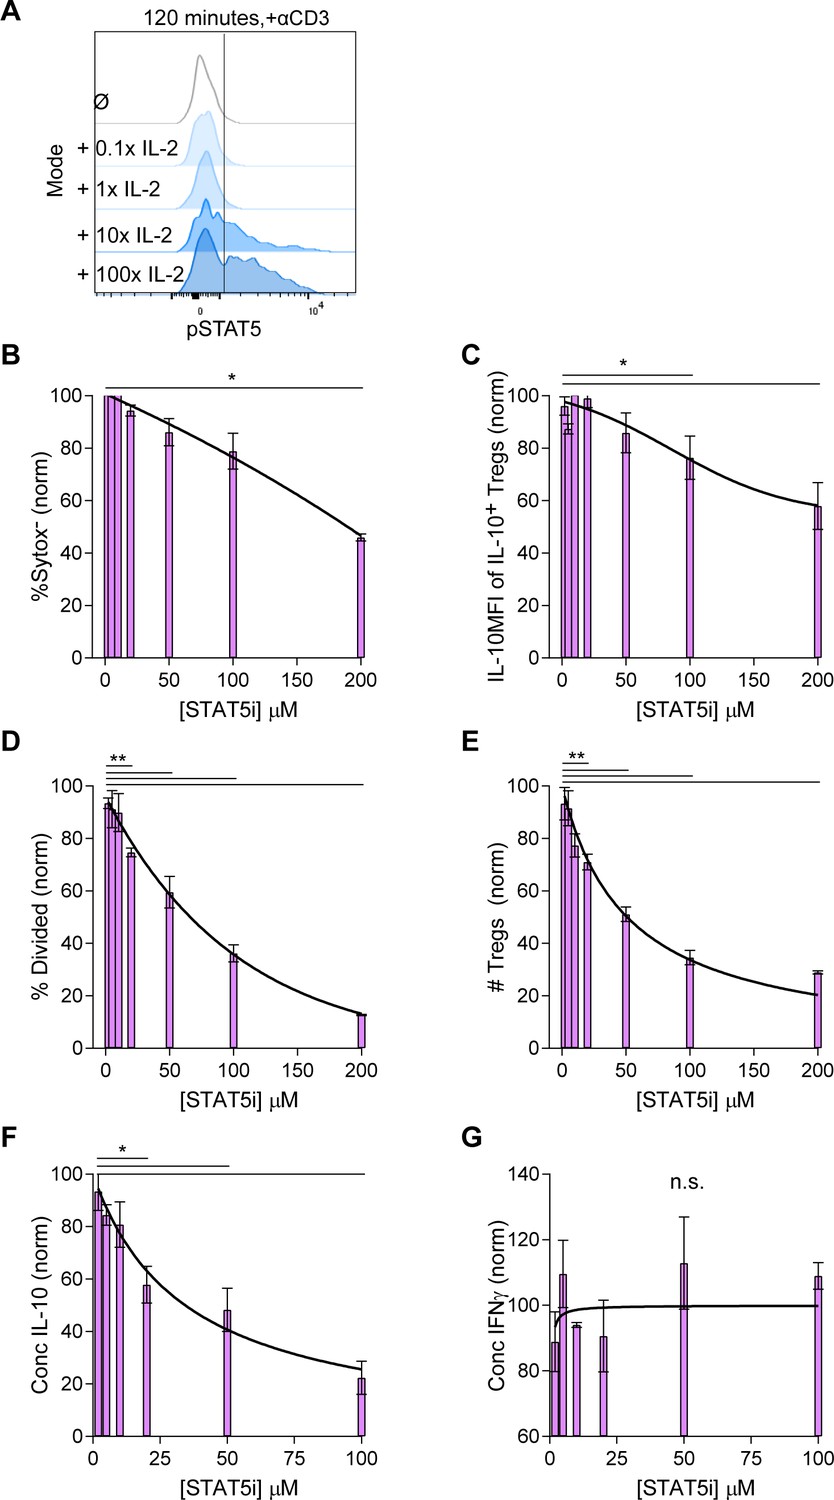
The IL-10 and proliferative response following combined IL-2 and IL-4 stimulation is dependent on STAT5 signaling.
(A) pSTAT5 expression following IL-2 stimulation at the indicated concentrations, with 1× = 728 pM, and as analyzed by flow cytometry. (B–E) Analysis of viability (Sytox Red), IL-10 expression, and proliferation of purified Tregs that were cultured with αCD3ε, combined IL-2 and IL-4, and STAT5i (resuspended in DMSO) in the indicated concentrations for 3 days, as analyzed by flow cytometry. The values are normalized to Tregs cultured with the same stimulation conditions but with DMSO only and no STAT5i. (F and G) Quantification of IL-10 and IFNγ secreted by the cells in the culture setup above as analyzed by ELISA. N = 3. Related to Figure 4. For all panels, mean ± SEM are indicated. *p<0.05, **p<0.01.
Figure 5 with 1 supplement
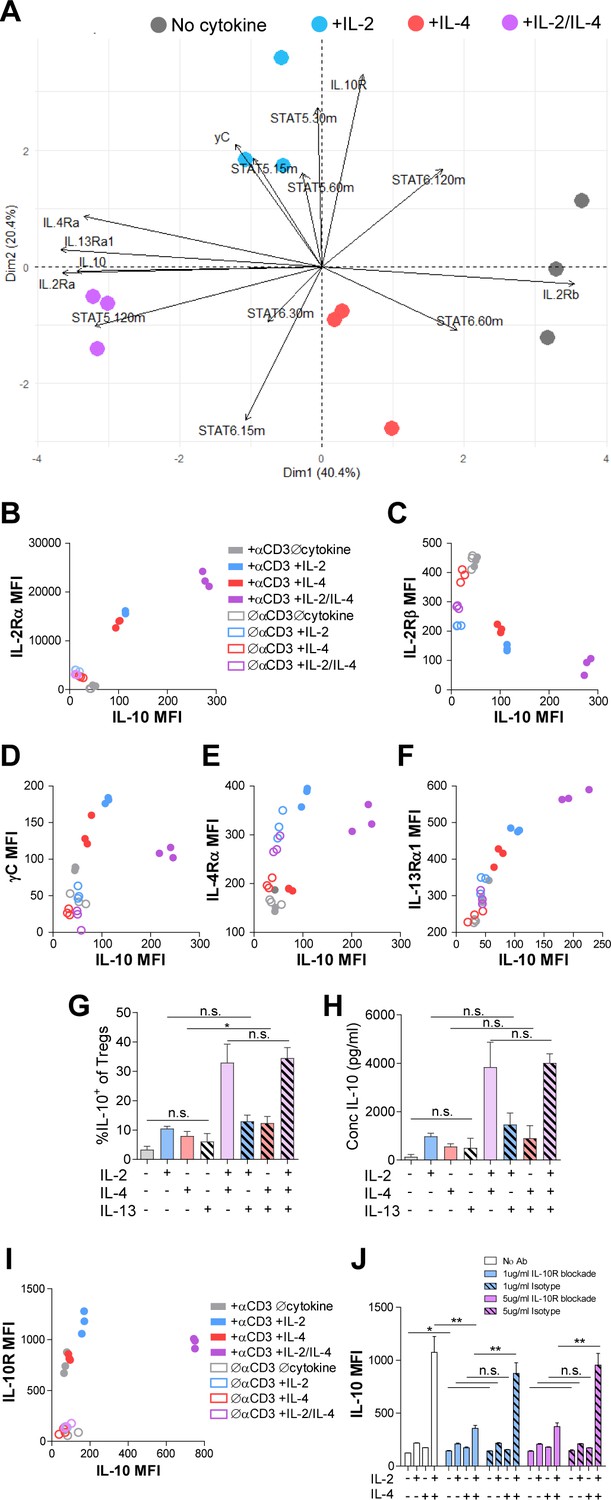
Combinatorial IL-2 and IL-4 signaling promotes the expression of the Type 2 IL-4 receptor.
(A) Expression of 14 parameters as shown in an unpaired principle component analysis of Tregs purified and stimulated with αCD3ε and all cytokine conditions for 3 days unless otherwise noted in the vectors. N = 3. (B–F) Surface expression of receptor subunits that comprise the multiple forms of the IL-2R and IL-4 on purified Tregs from Foxp3RFP/Il10GFP dual reporter mice that were stimulated for 3 days with or without αCD3ε and with all cytokine combinations. Expression of receptor subunits is plotted as a function of IL-10 expression. N = 3. (G and H) Quantification of IL-10 expression and protein concentration secreted by Tregs that were purified and cultured for 3 days with αCD3ε and all combinations of IL-2, IL-4, and IL-13, as analyzed by flow cytometry and ELISA, respectively. N = 3. (I) Surface expression of IL-10R on purified Tregs from Foxp3RFP/Il10GFP dual reporter mice that were stimulated for 3 days with or without αCD3ε and with all cytokine combinations. Expression of receptor subunits is plotted as a function of IL-10 expression. N = 3. (J) IL-10 expression of purified Tregs stimulated with αCD3ε and all cytokine conditions for 3 days with or without neutralizing IL-10R monoclonal antibody or isotype control blockade, as analyzed by flow cytometry (see also Figure 5—figure supplement 1). N = 3. For all panels, mean ± SEM are indicated. *p<0.05.
Figure 5—figure supplement 1
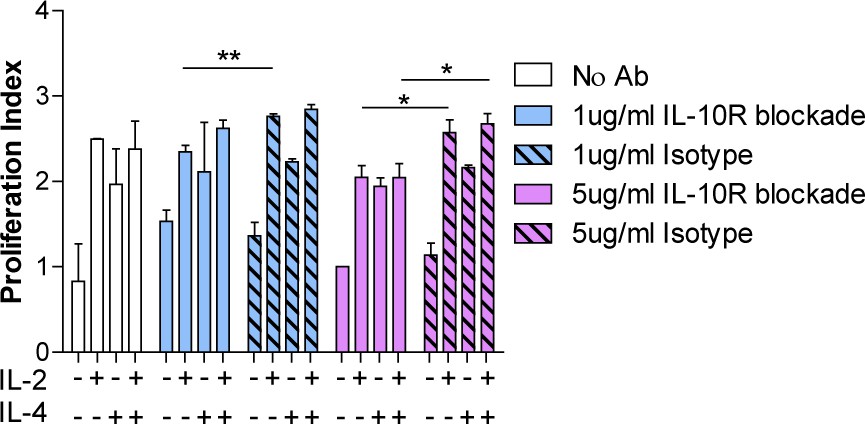
IL-10R blockade modestly reduces IL-2/IL-4-induced Treg proliferation.
Proliferation of purified Tregs stimulated with αCD3ε and all cytokine conditions for 3 days with or without neutralizing IL-10R monoclonal antibody or isotype control blockade, as analyzed by CellTrace dilution and flow cytometry. N = 3. Related to Figure 5J. Mean ± SEM are indicated. *p<0.05, **p<0.01.
Figure 6 with 3 supplements
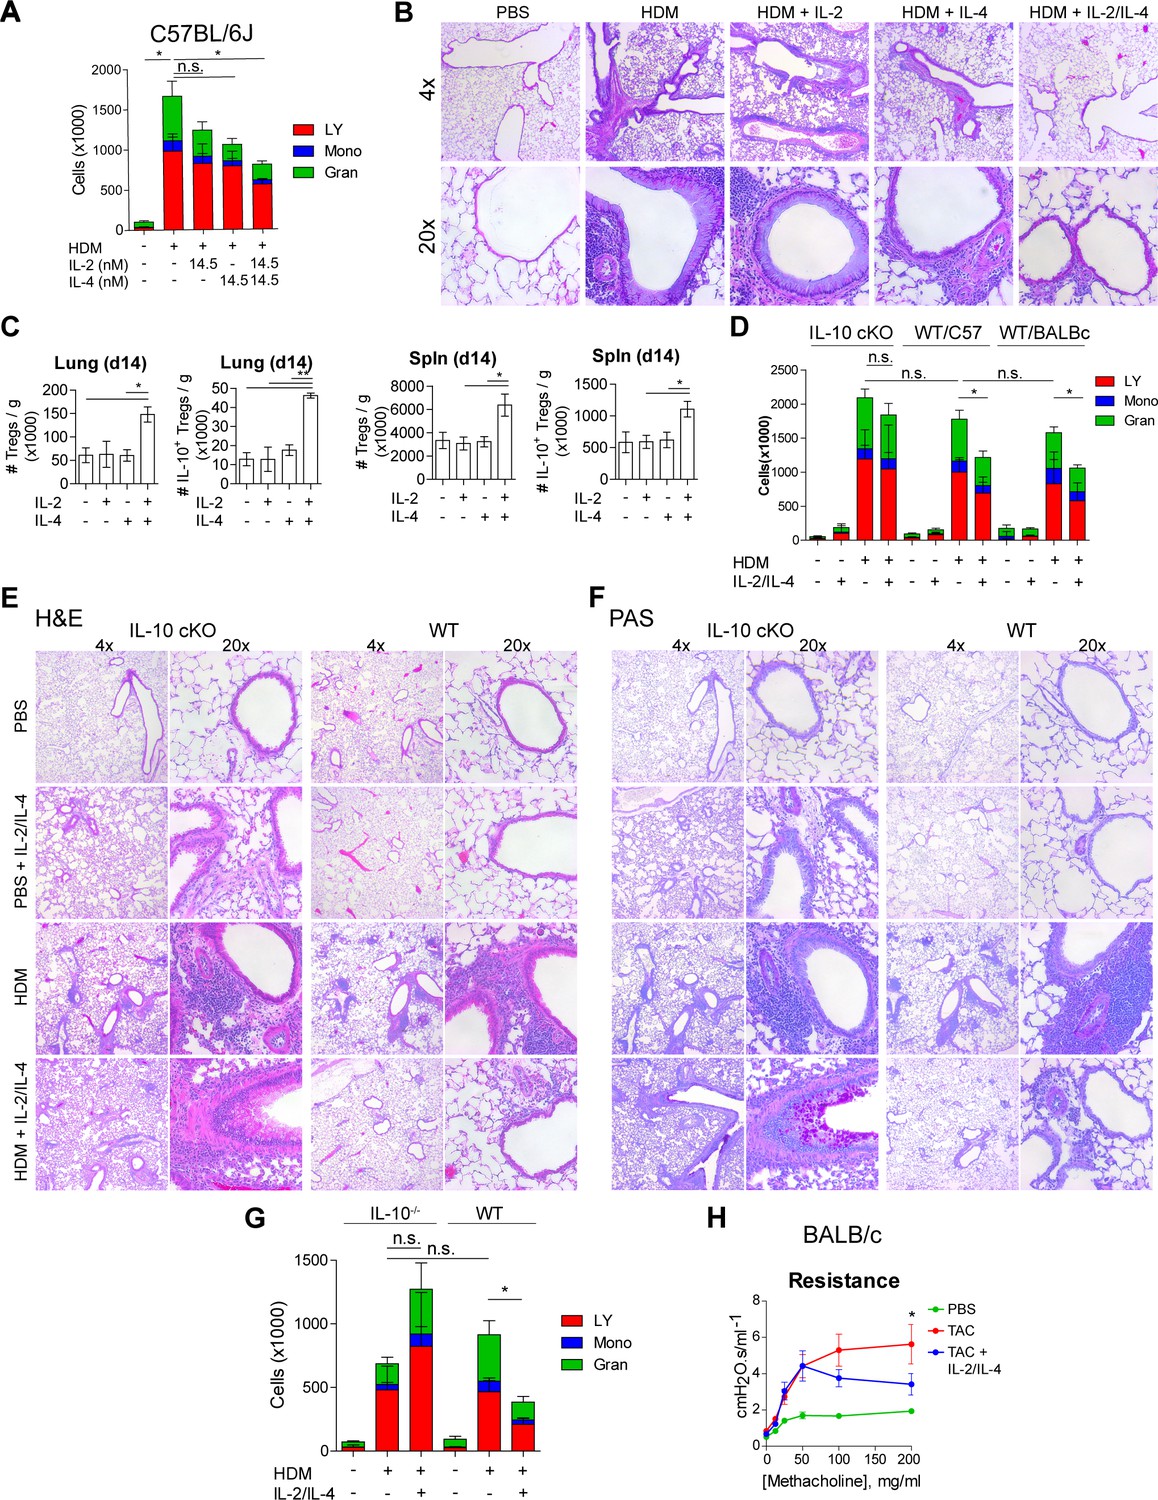
IL-2 and IL-4 in combination suppress the severity of HDM-induced asthma.
(A and B) Analysis of HDM-induced airway inflammation in WT C57Bl/6J mice by cell differentials of the Bronchial Alveolar Lavage (BAL, LY = lymphocytes, Mono = monocytes, Gran = granulocytes) and hematoxylin and eosin (H&E) staining of FFPE-processed pulmonary tissues. IL-2 and IL-4 were administered i.n. on days 7–11 of the acute therapeutic trial (see also A). N = 6. Histological images are representative. (C) Quantification of Treg and IL-10+ Treg numbers in naïve mice following i.n. administration of combined IL-2 and IL-4 on days 0–5. Mice were harvested at day 14 for flow cytometric analysis. N = 6. (D–F) Assessment of HDM-induced airway inflammation in IL-10 cKO C57Bl/6J mice, WT C57Bl/6J mice, and WT BALB/c mice by cell differential analysis of the BAL and H and E and PAS staining of FFP3-processed pulmonary tissues. Mice received i.n. challenge with HDM and i.n. administration of combined IL-2 and IL-4 in an acute therapeutic regimen on days 7–11 (see also A–D). N = 6. (G) Analysis of HDM-induced airway inflammation in Il10-/- C57Bl/6J mice and WT C57Bl/6J mice by cell differentials of the Bronchial Alveolar Lavage fluid. IL-2 and IL-4 were administered i.n. on days 0–5 according to the acute preventative trial regimen (see also Figure 6—figure supplement 2). N = 6. (H) Airway resistance in chronic triple antigen-challenged (TAC; HDM/CRA/OVA) BALB/c mice treated or not with i.n. IL-2 and IL-4 starting in week 3 (see also Figure 6—figure supplement 3). Airway resistance was measured by Flexivent as a dose response to methacholine. N ≥ 2. For all panels, mean ± SEM are indicated. *p<0.05, **p<0.01, ***p<0.001.
Figure 6—figure supplement 1
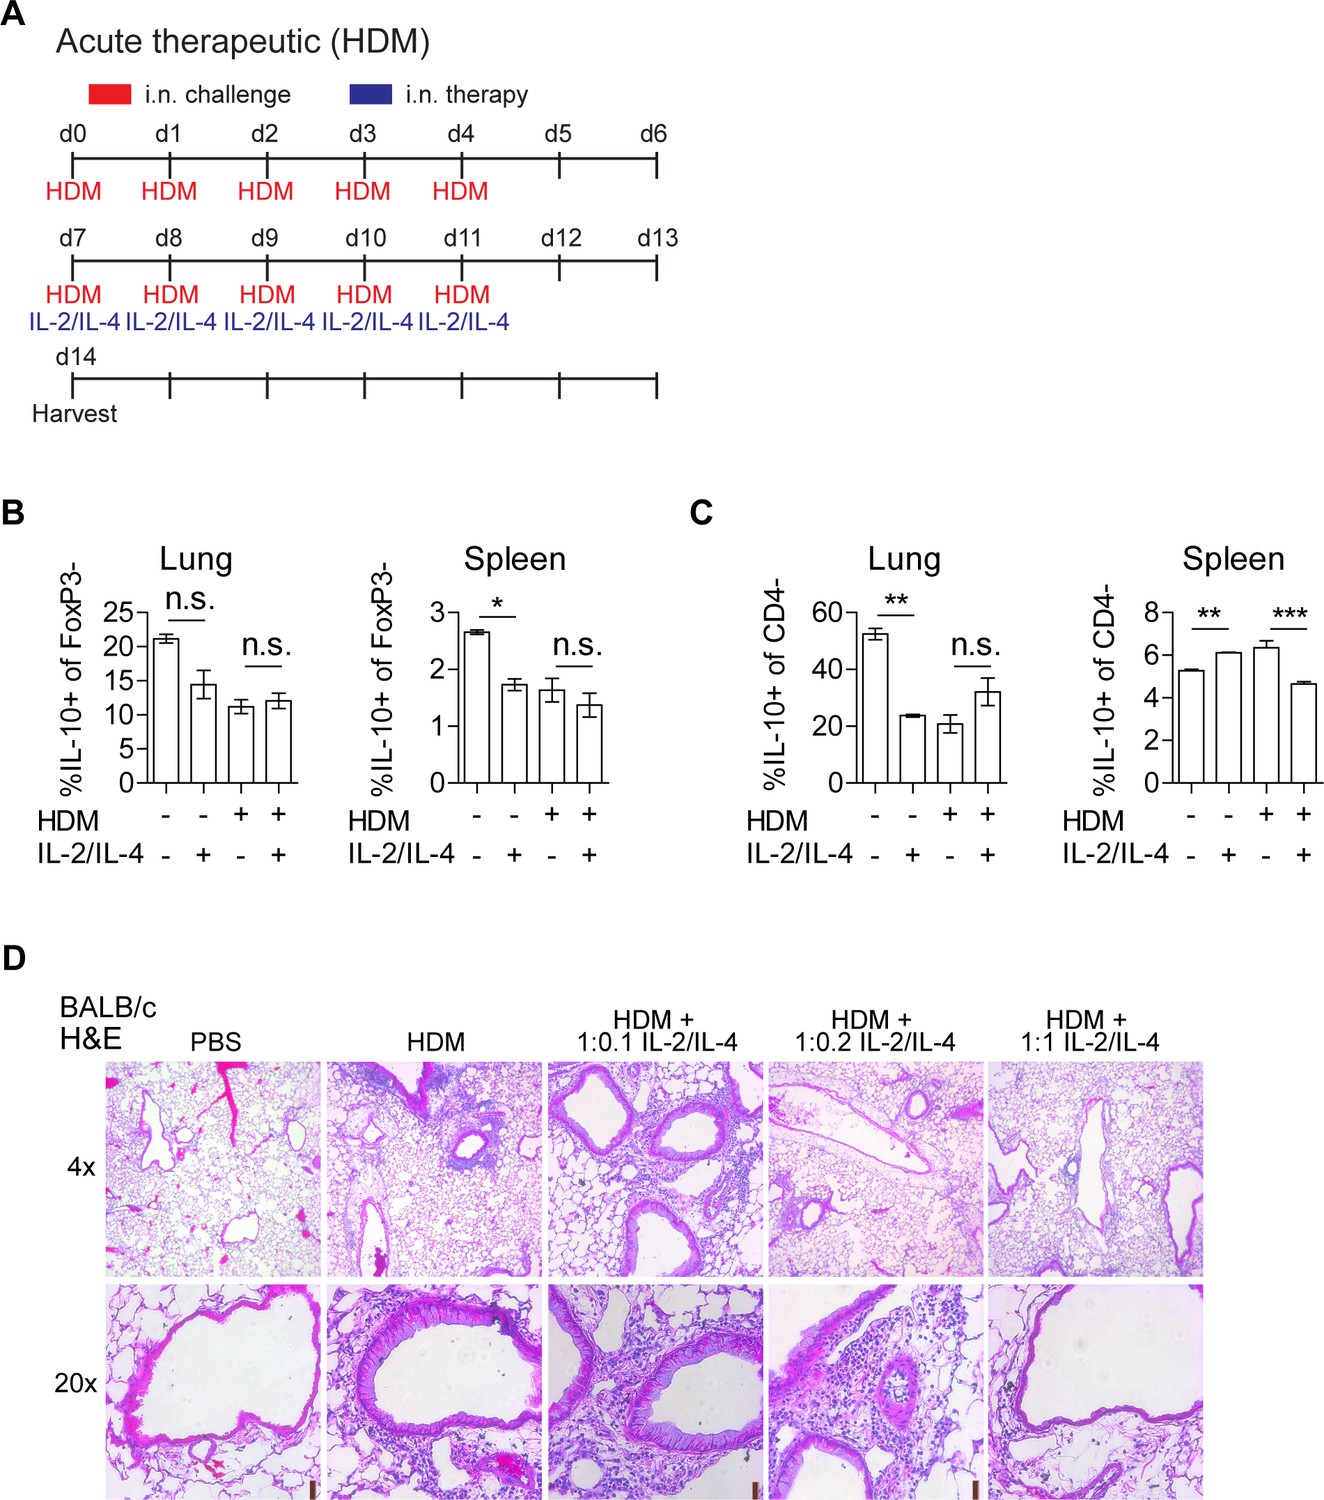
Administration of IL-2 and IL-4 suppresses HDM-induced acute asthma and is dependent on IL-10.
(A) Challenge and treatment schedule for the therapeutic HDM-induced acute asthma trials in Figure 6A and B,D–F. Mice were challenged with HDM (or PBS) for 2 weeks (d7-11, d14-18). IL-2/IL-4 was administered i.n. for 5 days starting on d7. (B and C) Analysis of IL-10 expression in FoxP3- Tconv and CD4- populations in the lung and spleen compartments of HDM-challenged and IL-2/IL-4-treated mice by flow cytometry. (D) Analysis of HDM-induced airway inflammation in WT BALB/c mice by H and E staining of sectioned FFPE-processed pulmonary tissues. Mice were challenged with HDM (or PBS) for 2 weeks (d7-11, d14-18). IL-2/IL-4 was administered i.n. for 5 days starting on d7 (see also Figure 6D, A). N = 6. Representative H and E histology for Figure 6D. For all panels, mean ± SEM are indicated. *p<0.05, **p<0.01, ***p<0.001.
Figure 6—figure supplement 2

Administration of prophylactic IL-2/IL-4 suppresses HDM-induced acute asthma.
(A) Challenge and treatment schedule for the preventative HDM-induced acute asthma trials in Figure 6G. IL-2/IL-4 was delivered i.n. for five consecutive days (d0–5), followed by 2 weeks of HDM (or PBS) challenge through i.n. challenge (d7–11, d14–18). (B) Analysis of HDM-induced airway inflammation in WT C57Bl/6J mice by H and E and PAS staining of sectioned FFPE-processed pulmonary tissues. IL-2 and IL-4 were administered i.n. on days 0–5 of the acute preventative trial (see also Figure 6G, A). N = 6. (C) Analysis of HDM-induced airway inflammation in WT or IL-10-/- C57Bl/6J mice by H and E stained FFPE-processed sections of pulmonary tissues. IL-2 and IL-4 were administered i.n. on days 0–5 of the acute preventative trial (see also Figure 6G, A). N = 6.
Figure 6—figure supplement 3
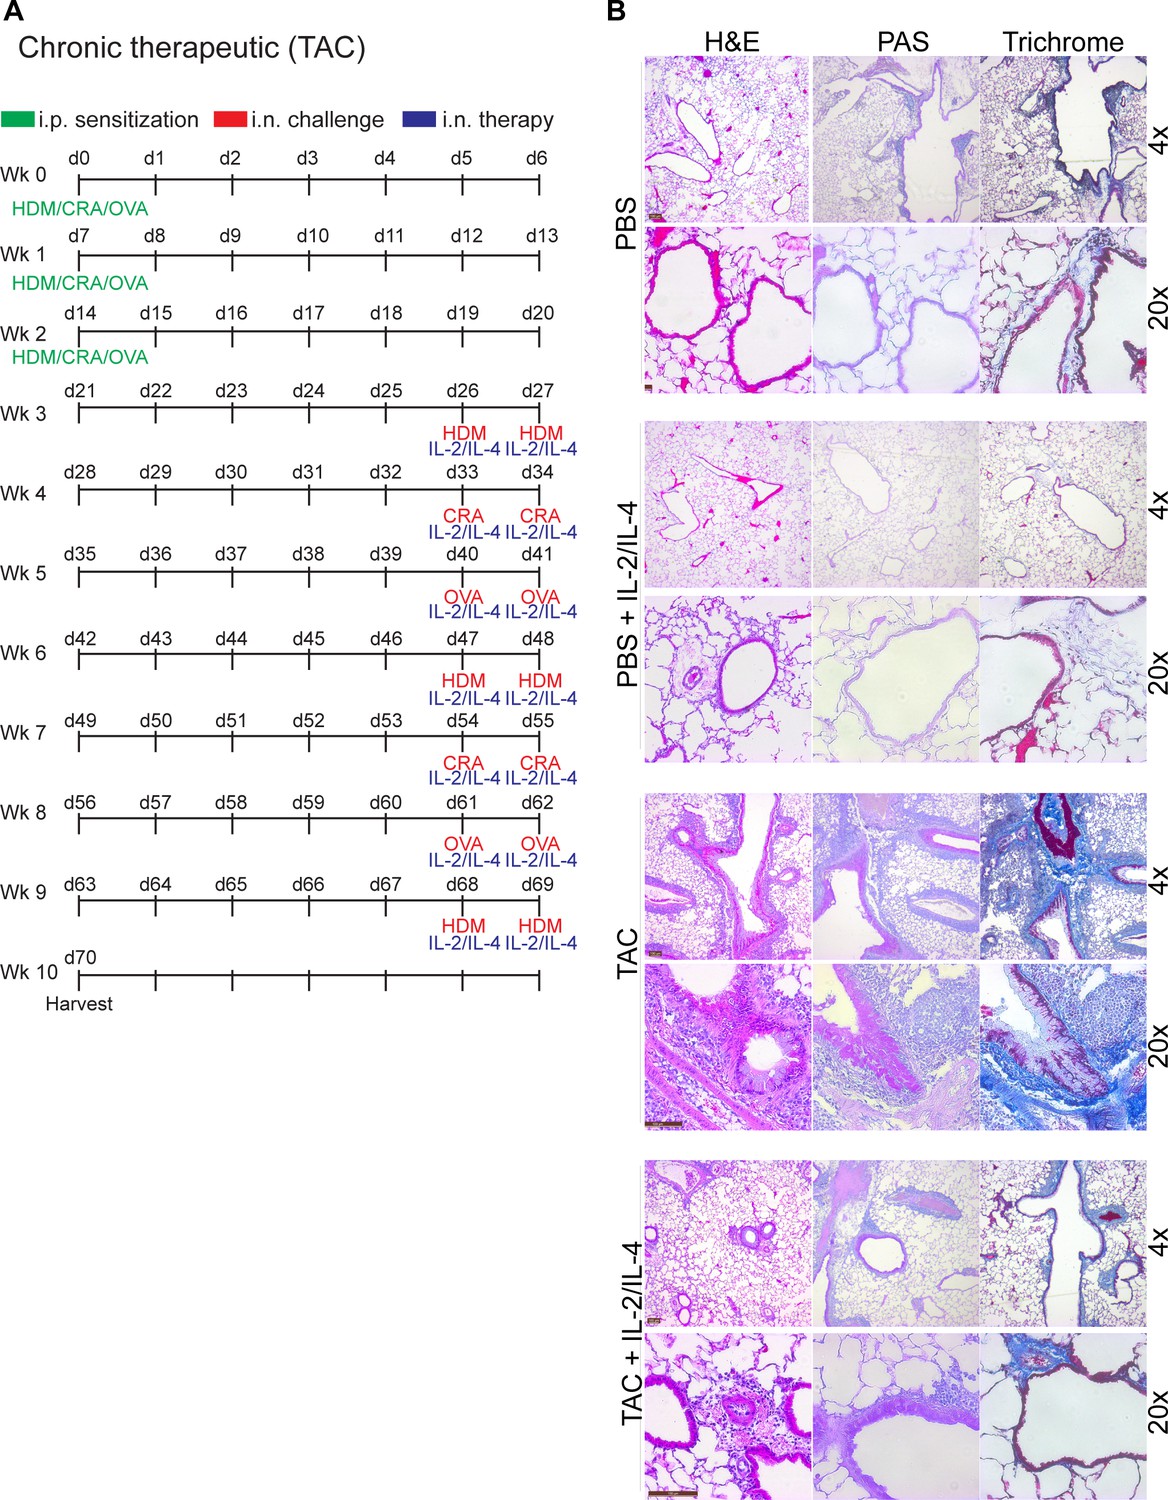
Administration of IL-2 and IL-4 therapeutically suppresses TAC-induced chronic asthma.
(A) Challenge and treatment schedule for therapeutic TAC-induced chronic asthma trial in Figure 6H. Mice were sensitized to the triple antigens once weekly for the first 3 weeks. Afterwards, all challenges and treatments were delivered i.n. Mice received HDM, CRA, and OVA in a rotating weekly schedule, and also received IL-2 and IL-4 in combination following the challenge. (B) Pulmonary disease severity was analyzed by FFPE tissues that underwent H and E, PAS, Trichrome staining and imaged at 4× and 20×. N ≤ 5. Representative H and E histology for Figure 6H.
Figure 7 with 3 supplements
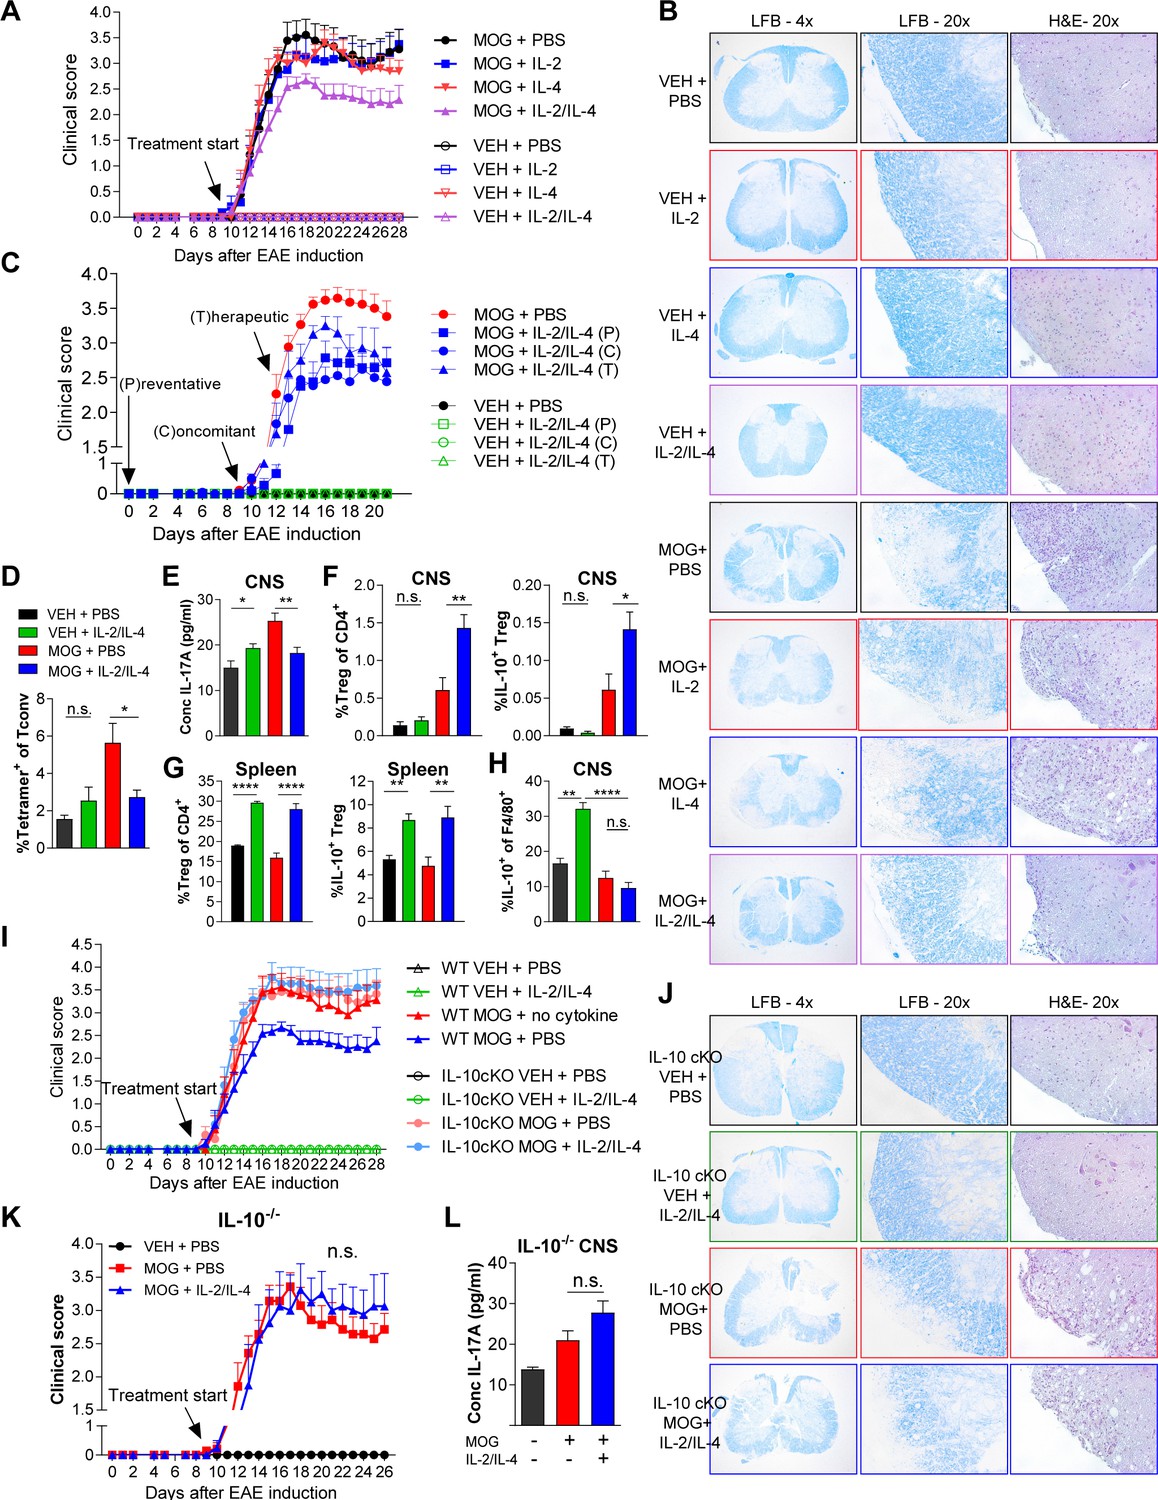
Combined IL-2 and IL-4 reduces the severity of experimental autoimmune encephalomyelitis (EAE).
(A and B) EAE clinical score and FFPE-processed spinal cords sectioned and stained with H and E and LFB from mice challenged with myelin oligodendrocyte glycoprotein (MOG) peptide with and without combined IL-2/IL-4 and subclinically effective doses of the individual cytokines (For statistical analyses, see Figure 7—figure supplement 1). Histological images of H and E and Luxol Fast Blue (LFB) staining represent a mouse of the mean disease score of each condition. N = 10–12 for EAE mice; N = 4 for vehicle control mice. (C) EAE clinical score and FFPE-processed spinal cords sectioned and stained with H and E and LFB from mice challenged with MOG peptide with and without the combined cytokines according to the indicated dosing schedule (for statistical analyses, see Figure 7—figure supplement 2A and B). N = 10–12 for EAE mice; N = 4 for vehicle control mice. (D) Analysis of MOG-loaded MHCII tetramer positive Tconv cells in the CNS as determined by flow cytometry. The color legend is indicated for panels D–H. N = 3 (E) Quantification of IL-17A secreted by CNS leukocytes isolated by Percoll gradient and incubated overnight in media, as quantified by ELISA. The conditions are described by the key in 7C. N = 3. (F and G) Analysis of Treg abundance and IL-10-expression in Tregs isolated from the CNS or spleen of Foxp3RFP/Il10GFP mice in the EAE trials by flow cytometry. The conditions are described by the key in 7C. N = 3. (H) Analysis of IL-10 expression of F4/80+ CNS macrophages from Foxp3RFP/Il10GFP mice in the EAE trials by flow cytometry. The conditions are described by the key in 7C. N = 3. (I and J) Assessment of EAE severity in IL-10 cKO mice quantified by daily clinical scoring (For statistical analyses, see Figure 7—figure supplement 3B) and FFPE-processing of spinal cords stained with H and E and LFB. Images represent a mouse of the mean disease score of each condition. N = 10–12 for EAE mice; N = 4 for negative control mice for disease. N = 10–12 for EAE mice; N = 4 for vehicle control mice. (K) Assessment of EAE severity in Il10-/- mice as quantified by daily clinical scoring. N = 7–8 for EAE mice; N = 4 for negative control mice for disease (see also Figure 7—figure supplement 3C). (L) Quantification of IL-17A secreted by CNS leukocytes of Il10-/- mice isolated by Percoll gradient and incubated overnight in media, as quantified by ELISA. N = 3. For all panels, mean ± SEM are indicated. *p<0.05, **p<0.01, ****p<0.0001.
Figure 7—figure supplement 1
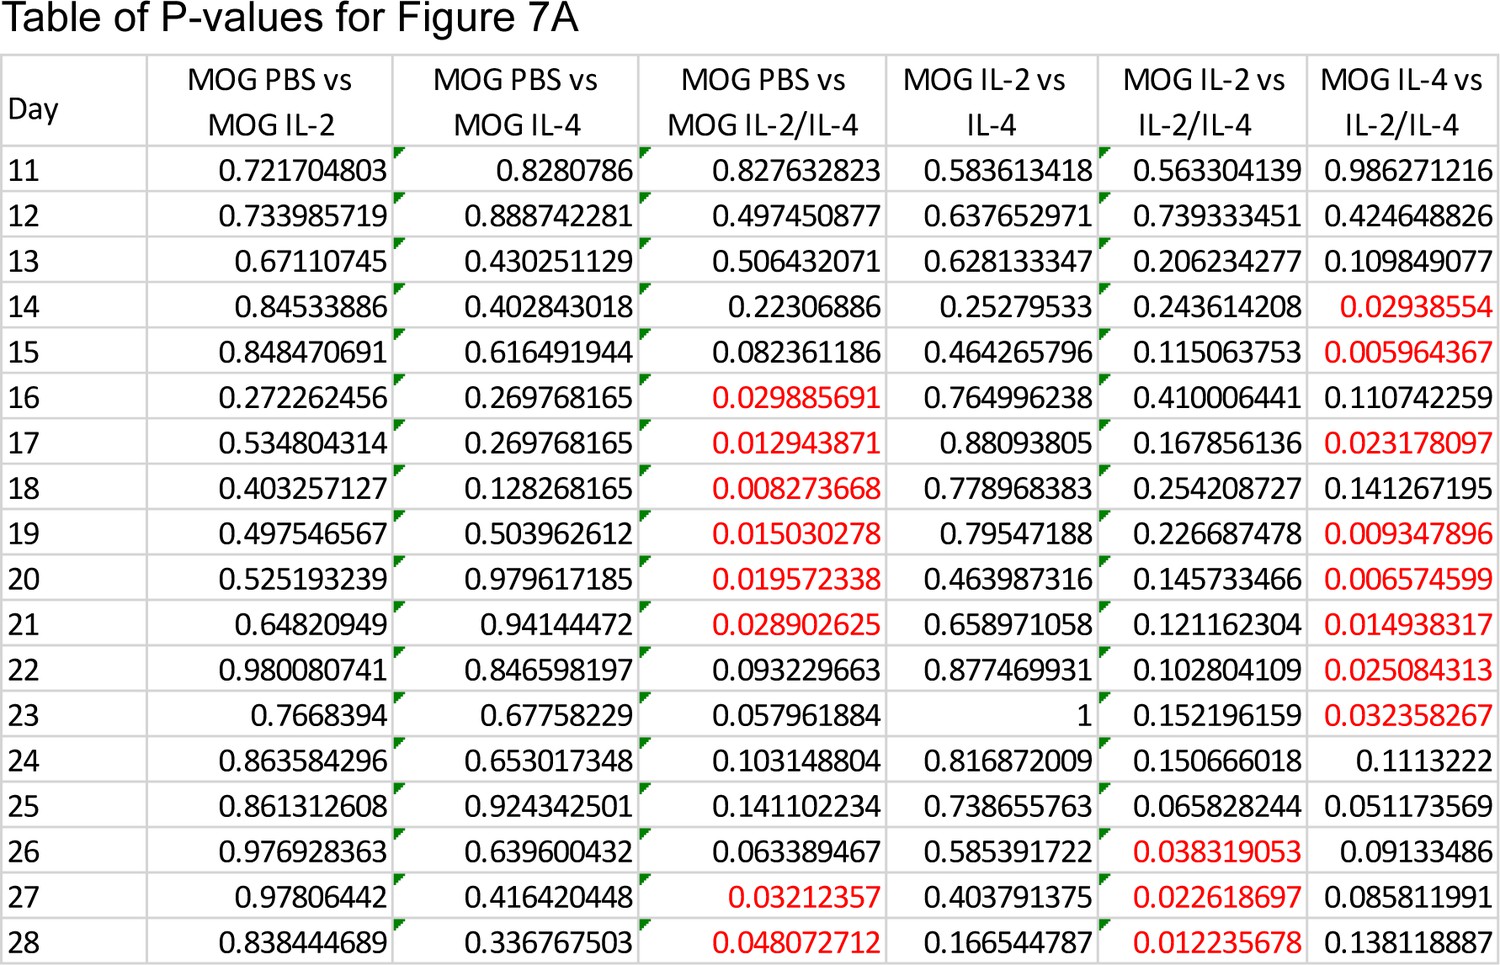
Combined IL-2 and IL-4 suppressed the severity of experimental autoimmune encephalomyelitis (EAE).
Figure 7—figure supplement 2
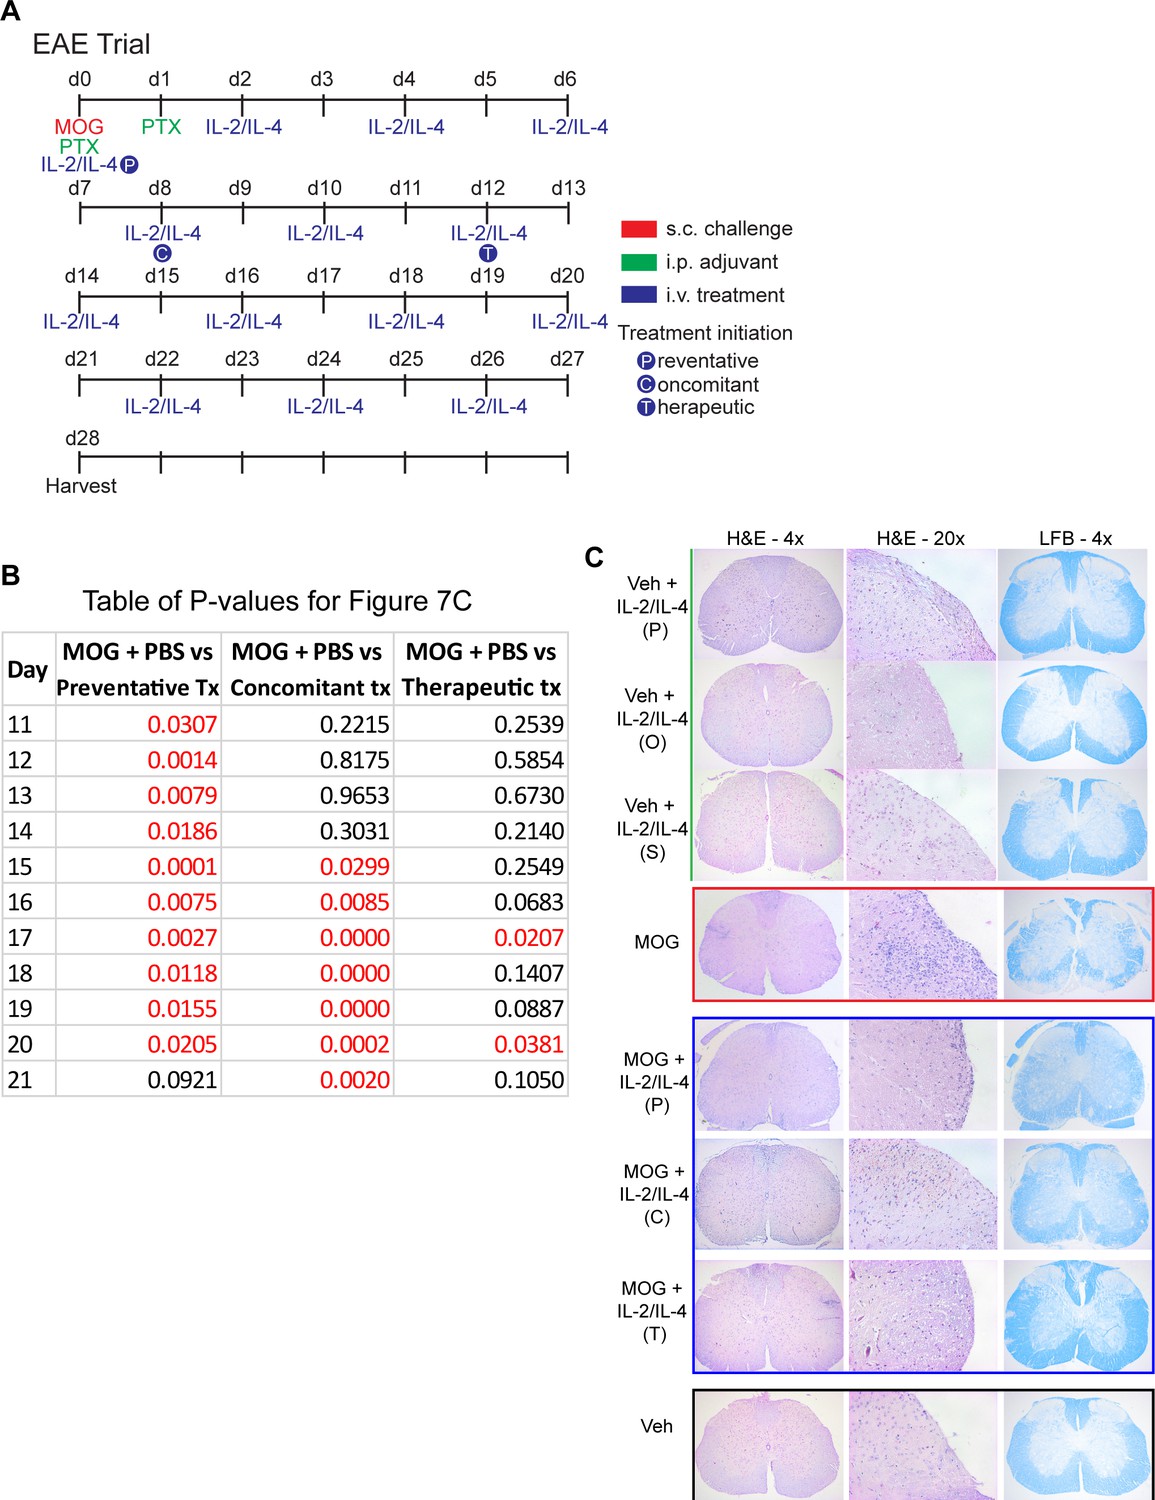
Combined IL-2 and IL-4 suppressed the severity of experimental autoimmune encephalomyelitis (EAE) in preventative, concomitant, and therapeutic dosing regiment.
(A) EAE was induced in mice with s.c. injections of myelin oligodendrocyte glycoprotein emulsified in Complete Freund’s Adjuvant (CFA) and d0. Pertussis toxin (PTX) was injected i.p. on days 0 and 1. Negative control mice received CFA only with PTX. The combinatorial cytokines were delivered i.v., with the Preventative regimen beginning on d0, Concomitant regimen on d8, and Therapeutic regimen on d12. Mice that did not receive the combinatorial cytokines received i.v. PBS as the vehicle control. Related to Figure 7. (B) Table of p-values for Figure 7C. Red font represents p≤0.05. Black font represents p>0.05. N = 10–12 for EAE mice, N = 4 for vehicle control mice. Related to Figure 7C. (C) Histological analysis of disease through FFPE-processed spinal cords undergoing H and E or LFB staining. Images represent a mouse of the mean disease score of each condition. N = 10–12 for EAE mice, N = 4 for vehicle control mice. Related to Figure 7C.
Figure 7—figure supplement 3
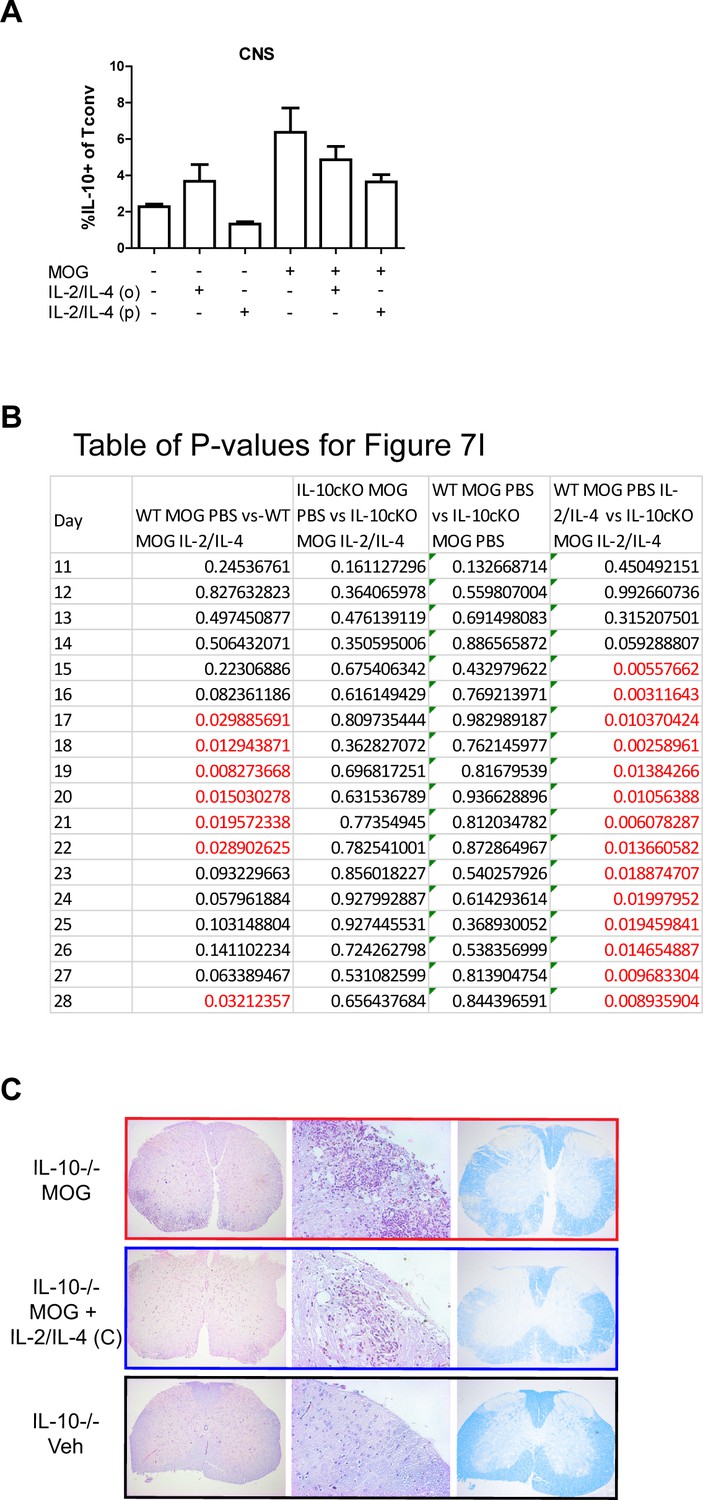
IL-10 is critical for suppression of experimental autoimmune encephalomyelitis (EAE) by IL-2/IL-4.
(A) Analysis of IL-10 expression in CNS FoxP3- Tconv cells of Foxp3RFP/Il10GFP mice in the EAE trials by flow cytometry. N = 3. (B) Table of p-values for Figure 7I. Red font represents p≤0.05. Black font represents p>0.05. N = 10–12 for EAE mice, N = 4 for vehicle control mice. Related to Figure 7I. (C) Analysis of disease in the Il10-/- mice through FFPE-processed spinal cords undergoing H and E or LFB staining. Images represent a mouse of the mean disease score of each condition. N = 7–8 for EAE mice, N = 4 for vehicle control mice. Related to Figure 7K.
Author response image 1

Tables
Key resources table
| Reagent type (species) or resource | Designation | Source or reference | Identifiers | Additional information |
|---|---|---|---|---|
| Strain, strain background (Mus musculus) | C56Bl/6J | JAX | JAX 000664, RRID:IMSR_JAX:000664 | |
| Strain, strain background (Mus musculus) | Il10-/- | JAX | JAX 002251, RRID:IMSR_JAX:002251 | |
| Strain, strain background (Mus musculus) | Il10fl/fl | PMID:15534372, PMID:28783045 | from Dr. Werner Muller via Dr. Asma Nusrat | |
| Strain, strain background (Mus musculus) | Foxp3creYFP | JAX | JAX 016959, RRID:IMSR_JAX:016959 | |
| Strain, strain background (Mus musculus) | Il10fl/fl x Foxp3creYFP (IL-10 cKO) | This paper | JAX 016959, RRID:IMSR_JAX:016959 and from Dr. Werner Muller via Dr. Asma Nusrat | We crossed IL-10fl/fl mice obtained from Dr. Asma Nusrat with commercially available FoxP3-creYFP mice. To obtain, contact the Cobb lab. |
| Strain, strain background (Mus musculus) | BALB/c Foxp3GFP | JAX | JAX 006769, RRID:IMSR_JAX:006769 | |
| Strain, strain background (Mus musculus) | Foxp3RFP | JAX | JAX 008374, RRID:IMSR_JAX:008374 | |
| Strain, strain background (Mus musculus) | Il10GFP | JAX | JAX 008379, RRID:IMSR_JAX:008379 | |
| Strain, strain background (Mus musculus) | Foxp3RFP x Il10GFP (Xmas) | This paper | JAX 008374, RRID:IMSR_JAX:008374 and JAX 008379, RRID:IMSR_JAX:008379 | We crossed two commercially available mouse lines. To obtain, contact the Cobb lab. |
| Antibody | αCD4-magnetic beads (rat, monoclonal) | Miltenyi Biotec | 130-049-201, RRID:AB_2722753 | (1:50–1:100), (50 µL) |
| Antibody | αCD3 (Armenian hamster, monoclonal) | eBioscience | 16-0031-85, RRID: AB_468848 | (1:400), (50 µL) |
| Antibody | αCD28 (Syrian hamster, monoclonal) | eBioscience | 16-0281-82, RRID: AB_468921 | (1:400), (50 µL) |
| Antibody | CD4-PE (rat, monoclonal) | eBioscience | 12-0042-82, RRID: AB_465510 | (1:250–1:500), (50 µL) |
| Antibody | CD4-AF647 (rat, monoclonal) | Biolegend | 100530, RRID: AB_389325 | (1:250–1:500), (50 µL) |
| Antibody | CD4-BV421 (rat, monoclonal) | BD | 740007, RRID: AB_2739779 | (1:250–1:500), (50 µL) |
| Antibody | F4/80-BV711 (rat, monoclonal) | BD | 565612, RRID: AB_2734769 | (1:250–1:500), (50 µL) |
| Antibody | CD25-PECy7 (rat, monoclonal) | BD | 561780, RRID: AB_10893596 | (1:250–1:500), (50 µL) |
| Antibody | CD25-PE (rat, monoclonal) | eBioscience | 12-0251-82, RRID: AB_465607 | (1:250–1:500), (50 µL) |
| Antibody | CD124-BB700 (rat, monoclonal) | BD | 742172, RRID: AB_2871410 | (1:250–1:500), (50 µL) |
| Antibody | CD122-APC (rat, monoclonal) | BD | 564924, RRID: AB_2739009 | (1:250–1:500), (50 µL) |
| Antibody | CD132-BV421 (rat, monoclonal) | BD | 740039, RRID: AB_2739809 | (1:250–1:500), (50 µL) |
| Antibody | CD213a1-Biotin (rabbit, polyclonal) | MyBioSource | MBS2001753 | (1:250–1:500), (50 µL) |
| Antibody | pSTAT3-AF647 (mouse, monoclonal) | BD | 557815, RRID: AB_647144 | (1:100–1:200), (25 µL) |
| Antibody | pSTAT5-AF647 (mouse, monoclonal) | BD | 612599, RRID: AB_399882 | (1:100–1:200), (25 µL) |
| Antibody | pSTAT6-AF647 (mouse, monoclonal) | BD | 558242, RRID: AB_647145 | (1:100–1:200), (25 µL) |
| Antibody | IL-10R biotin (rat, monoclonal) | Biolegend | 112704, RRID: AB_313517 | (1:250–1:500), (50 µL) |
| Antibody | SA-APCefluor780 | eBioscience | 47-4317-82, RRID: AB_10366688 | (1:250–1:500), (50 µL) |
| Antibody | SA-BV605 | BD | 563260, RRID: AB_2869476 | (1:250–1:500), (50 µL) |
| Peptide, recombinant protein | Recombinant IL-2 | R and D Systems | 402 ML-020 | |
| Peptide, recombinant protein | Recombinant IL-4 | R and D Systems | 404 ML-010 | |
| Peptide, recombinant protein | Recombinant IL-10 | R and D Systems | 417 ML | |
| Commercial assay, kit | IFNγ ELISA MAX | Biolegend | 430803 | |
| Commercial assay, kit | IL-4 ELISA MAX | Biolegend | 431102 | |
| Commercial assay, kit | IL-10 ELISA MAX | Biolegend | 431413 | |
| Commercial assay, kit | IL-17A ELISA MAX | Biolegend | 432501 | |
| Commercial assay, kit | MOG35-55/CFA Emulsion PTX | Hooke Laboratories | EK-2110 | |
| Chemical compound, drug | STAT5i | Stemcell | 73852 | |
| Chemical compound, drug | House dust mite | Greer | XPB8103A2.5 | |
| Chemical compound, drug | Ovalbumin | Sigma-Aldrich | A5503 | |
| Chemical compound, drug | Cockroach antigen | Greer | XPB46D3A4 | |
| Chemical compound, drug | Methacholine | Sigma-Aldrich | 62-51-1 | |
| Software, algorithm | Prism | Graphpad | Versions 5 and 7, RRID:SCR_002798 | |
| Software, algorithm | FlowJo | FlowJo | v10.7, RRID:SCR_008520 | |
| Other | FACS-ARIA SORP | BD | ||
| Other | Attune NxT | Thermo Fisher | ||
| Other | Sytox Red | Invitrogen | S34859 | |
| Other | Fixable Viability Stain 510 | BD | 564406 | |
| Other | MOG I-A(b) tetramer-BV421 | NIH Tetramer Core | GWYRSPFSRVVH | |
| Other | Control I-A(b) tetramer-BV421 | NIH Tetramer Core | PVSKMRMATPLLMQA | |
| Other | CellTrace Violet | Invitrogen | C34557 or C34571 | |
| Other | Europium-conjugated streptavidin | Perkin-Elmer | 1244–360 | |
| Other | DELFIA Enhancement solution | Perkin-Elmer | 4001–0010 | |
| Other | 10% formalin | Anachemia | 41916–700 | |
| Other | Hematoxylin | Ricca | 3536–32 | |
| Other | Eosin | EMD Harleco | 588X-75 | |
| Other | Solvent Blue 38 | Sigma-Aldrich | S3382 | |
| Other | Percoll | GE | 17-0891-02 |
Additional files
Download links
A two-part list of links to download the article, or parts of the article, in various formats.
Downloads (link to download the article as PDF)
Open citations (links to open the citations from this article in various online reference manager services)
Cite this article (links to download the citations from this article in formats compatible with various reference manager tools)
Integration of IL-2 and IL-4 signals coordinates divergent regulatory T cell responses and drives therapeutic efficacy
eLife 10:e57417.
https://doi.org/10.7554/eLife.57417


