What is the true discharge rate and pattern of the striatal projection neurons in Parkinson’s disease and Dystonia?
- Department of Medical Neurobiology, Institute of Medical Research Israel - Canada (IMRIC), The Hebrew University - Hadassah Medical School, Israel
- The Edmond and Lily Safra Center for Brain Sciences, The Hebrew University, Israel
- Department of Neurosurgery, Hadassah University Hospital, Israel
- University of Bordeaux, UMR 5293, IMN, France
- CNRS, UMR 5293, IMN, France
- CHU de Bordeaux, IMN Clinique, France
Figures
Figure 1

A 3D rendering of group-based microelectrode track trajectories in the posterior putamen.
(A) Posterior view of the microelectrode track trajectories from both PD and dystonic patients. An axial image from the normalized scan, at the level of the rostral midbrain, is shown as a backdrop. The image was acquired on a 7T MRI scanner with a 100 μm T1 scan of an ex-vivo human brain. The definition of the striatum (purple), GPe (light blue) and GPi (light green) boundaries are defined by the DISTAL atlas. (B) Same as (A) but with a coronal image. A total of 36 microelectrode track trajectories, 13 in PD (green) and 23 in Dystonia (red), are visualized for four PD and six dystonic patients.
Figure 2
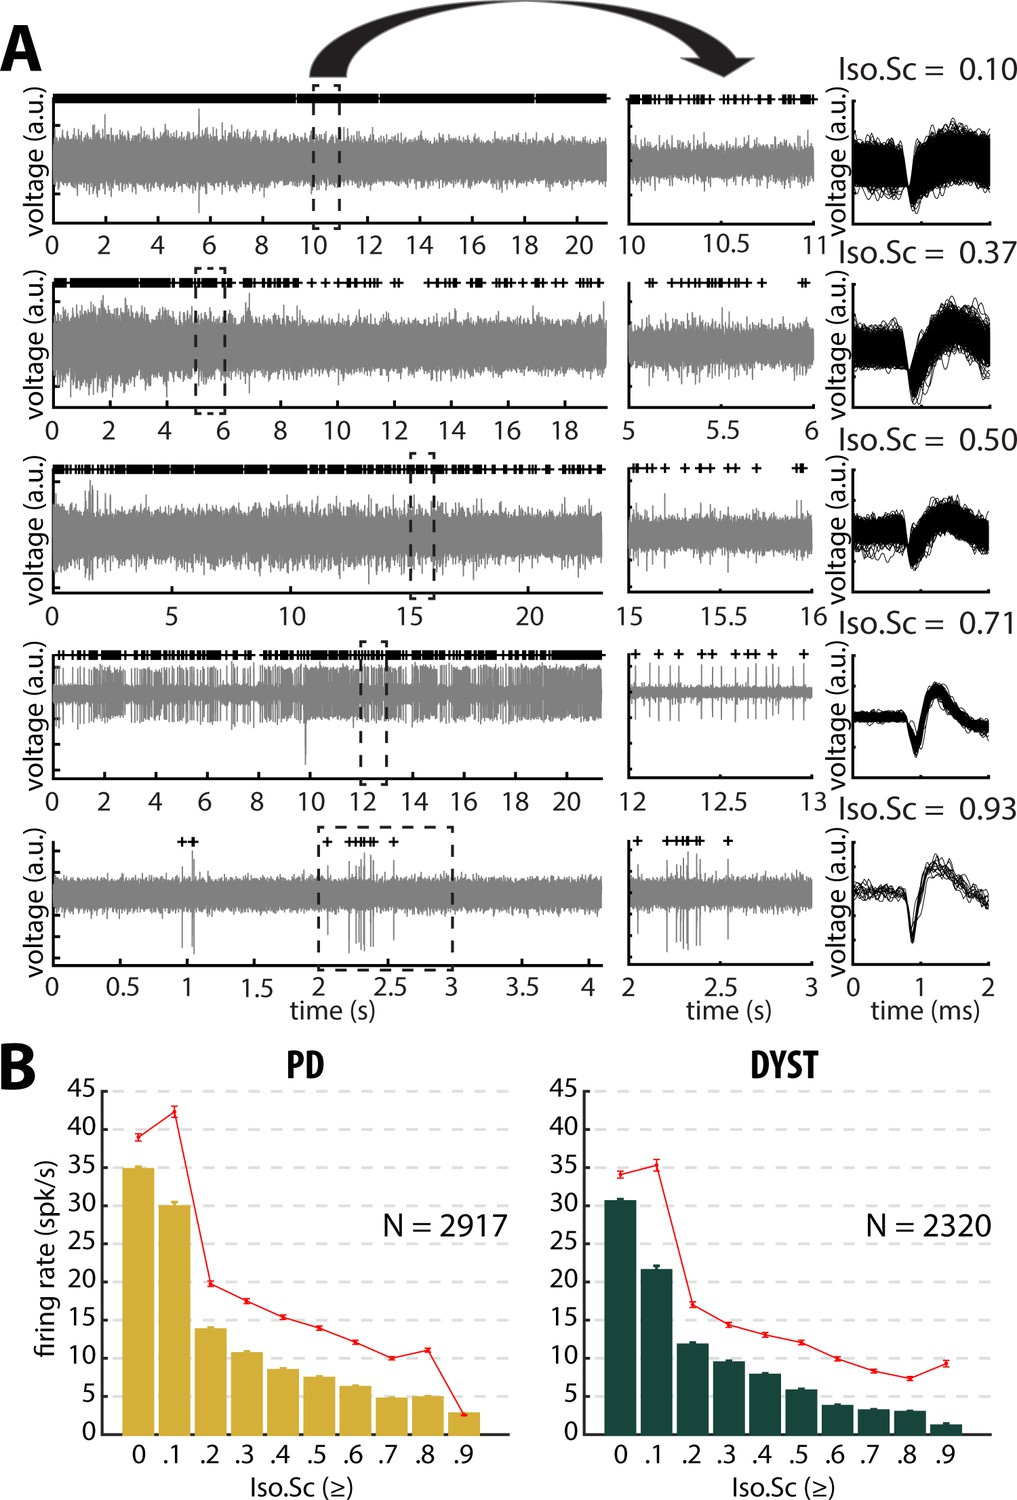
Striatal firing rate in parkinsonian (PD) and dystonic (DYST) patients decreases as isolation quality of the units increases.
(A) Examples of full-length (left panels) and 1 s (middle panels) striatal spiking recordings. Above the spiking activity is the digital display of the detection (spike train) of the sorted unit from the recording. Spike waveforms are superimposed (right panels). Isolation score (Iso.Sc) indicates the isolation quality of the sorted unit. (B) Evolution of the firing rate as a function of the isolation score. Each bar indicates the median firing rate of the sorted units with an isolation score greater than or equal to a certain value (i.e., the bin labelled 0.8 contains all the units with an isolation score ≥0.8). Error bars represent MADs (i.e., median absolute deviations). Means ± SEMs (i.e., standard errors of the mean) are shown in red. N is the number of sorted units.
-
Figure 2—source data 1
Firing rate and isolation score of all units in PD.
- https://cdn.elifesciences.org/articles/57445/elife-57445-fig2-data1-v2.xls
-
Figure 2—source data 2
Firing rate and isolation score of all units in Dystonia.
- https://cdn.elifesciences.org/articles/57445/elife-57445-fig2-data2-v2.xls
Figure 3 with 5 supplements
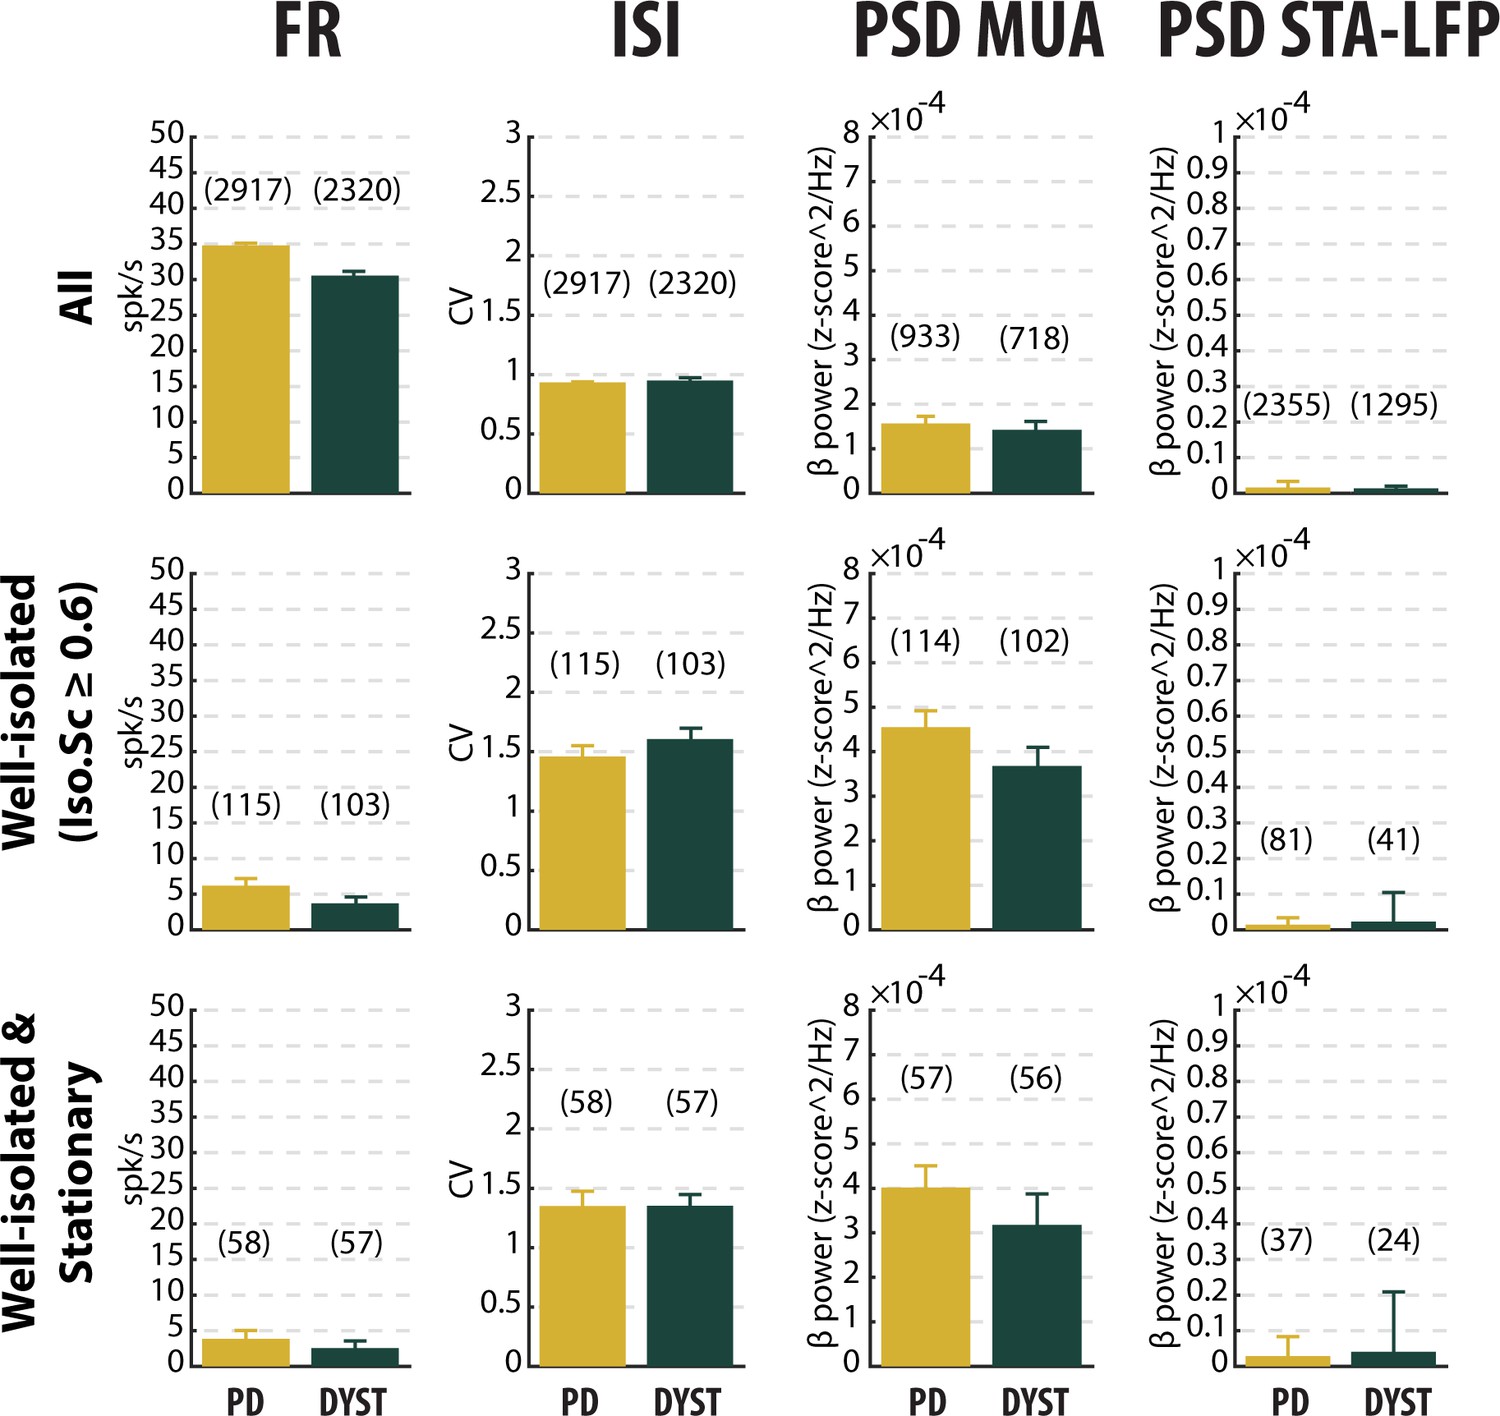
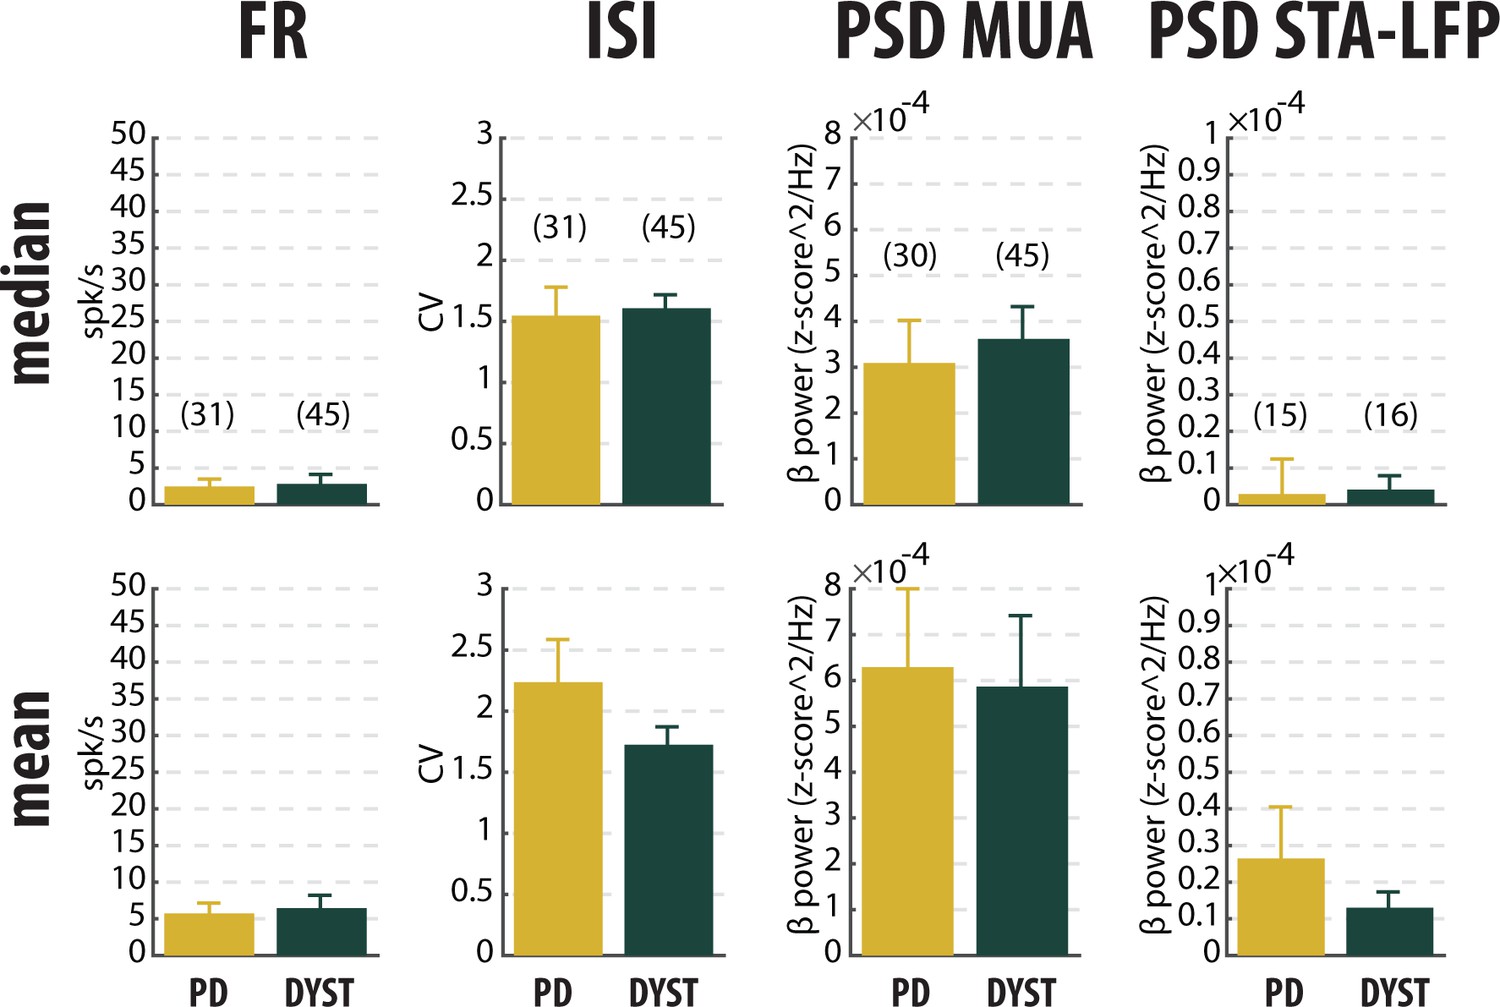
No drastic or specific change in the features (median ±MAD values) of striatal neuronal activity in parkinsonian (PD) and dystonic (DYST) patients.
Comparison of the firing rate (first column), the coefficient of variation (CV) of the inter-spike interval (ISI) (second column), the β power of the multi-unit activity (MUA, spiking activity) recorded in the vicinity of a sorted unit (third column) and the β power of the spike-triggered average (STA) of the local field potential (LFP) (fourth column) when considering all (upper panels), only the well-isolated (middle panels) and only the well-isolated stationary (lower panels) units. Since each signal was Z-score normalized (using its mean and SD) prior to PSD calculations, the β power of both the MUA (third column) and STA-LFP (fourth column) are expressed in z-score^2/Hz. Each bar indicates the median value and error bars represent MADs. Same y-axis scales as in Figure 3—figure supplement 1 and Figure 3—figure supplement 5. Numbers in parentheses indicate the sizes of the samples. Note that the sizes of the samples differ between the columns because (i) the number of sorted units from each MUA ranged from 1 to 5 and (ii) the LFPs were not systematically recorded.
-
Figure 3—source data 1
Spiking features of all units in PD.
- https://cdn.elifesciences.org/articles/57445/elife-57445-fig3-data1-v2.xls
-
Figure 3—source data 2
Spiking features of the well-isolated units in PD.
- https://cdn.elifesciences.org/articles/57445/elife-57445-fig3-data2-v2.xls
-
Figure 3—source data 3
Spiking features of the well-isolated and stationary units in PD.
- https://cdn.elifesciences.org/articles/57445/elife-57445-fig3-data3-v2.xls
-
Figure 3—source data 4
Spiking features of all units in Dystonia.
- https://cdn.elifesciences.org/articles/57445/elife-57445-fig3-data4-v2.xls
-
Figure 3—source data 5
Spiking features of the well-isolated units in Dystonia.
- https://cdn.elifesciences.org/articles/57445/elife-57445-fig3-data5-v2.xls
-
Figure 3—source data 6
Spiking features of the well-isolated and stationary units in Dystonia.
- https://cdn.elifesciences.org/articles/57445/elife-57445-fig3-data6-v2.xls
Figure 3—figure supplement 1
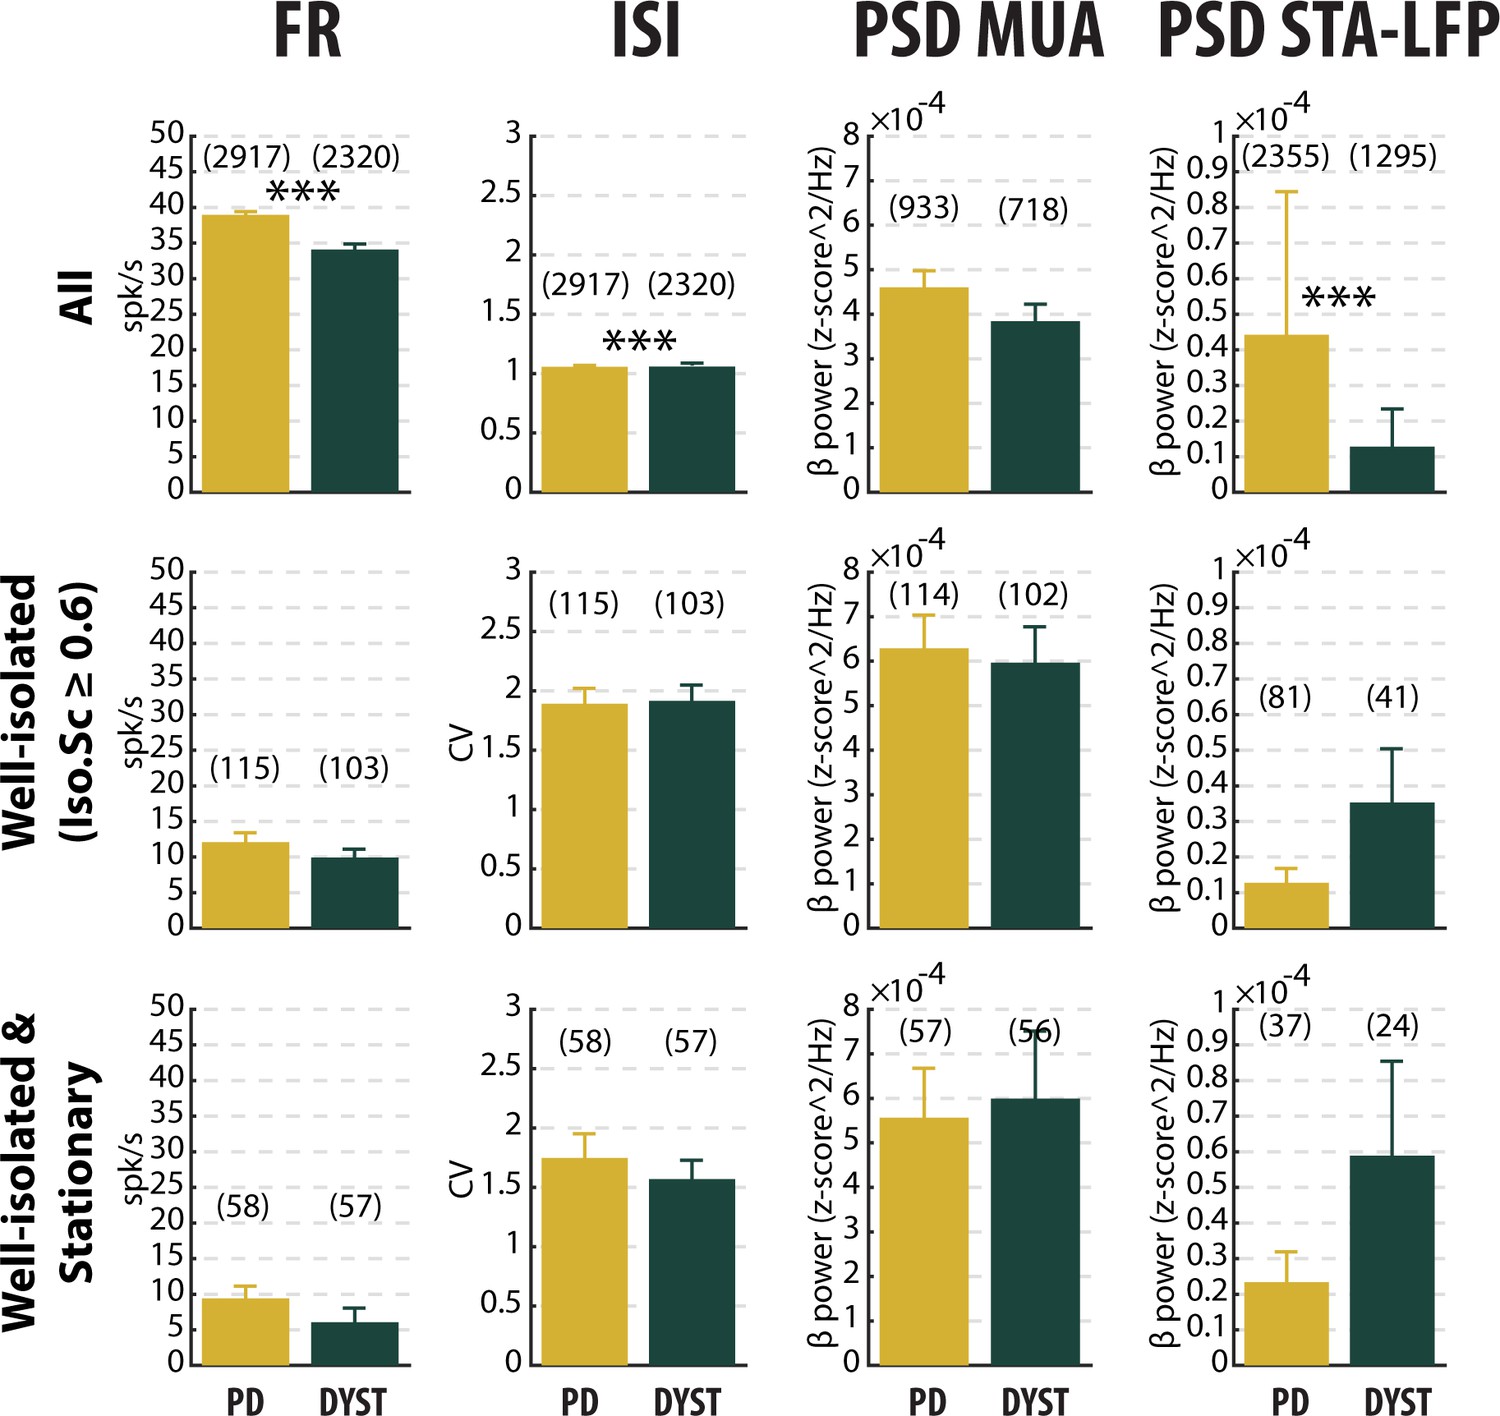
No drastic or specific change in the features (mean ± SEM values) of striatal neuronal activity in parkinsonian (PD) and dystonic (DYST) patients.
Same conventions as Figure 3, except that each bar indicates the mean value and error bars represent SEMs. Same y-axis scales as in Figure 3 and Figure 3—figure supplement 5. Numbers in parentheses indicate the sizes of the samples. Note that the sizes of the samples differ between the columns because (i) the number of sorted units from each MUA ranged from 1 to 5 and (ii) the LFPs were not systematically recorded. *** indicates significant differences (p<0.001, Mann-Whitney U-test).
Figure 3—figure supplement 2
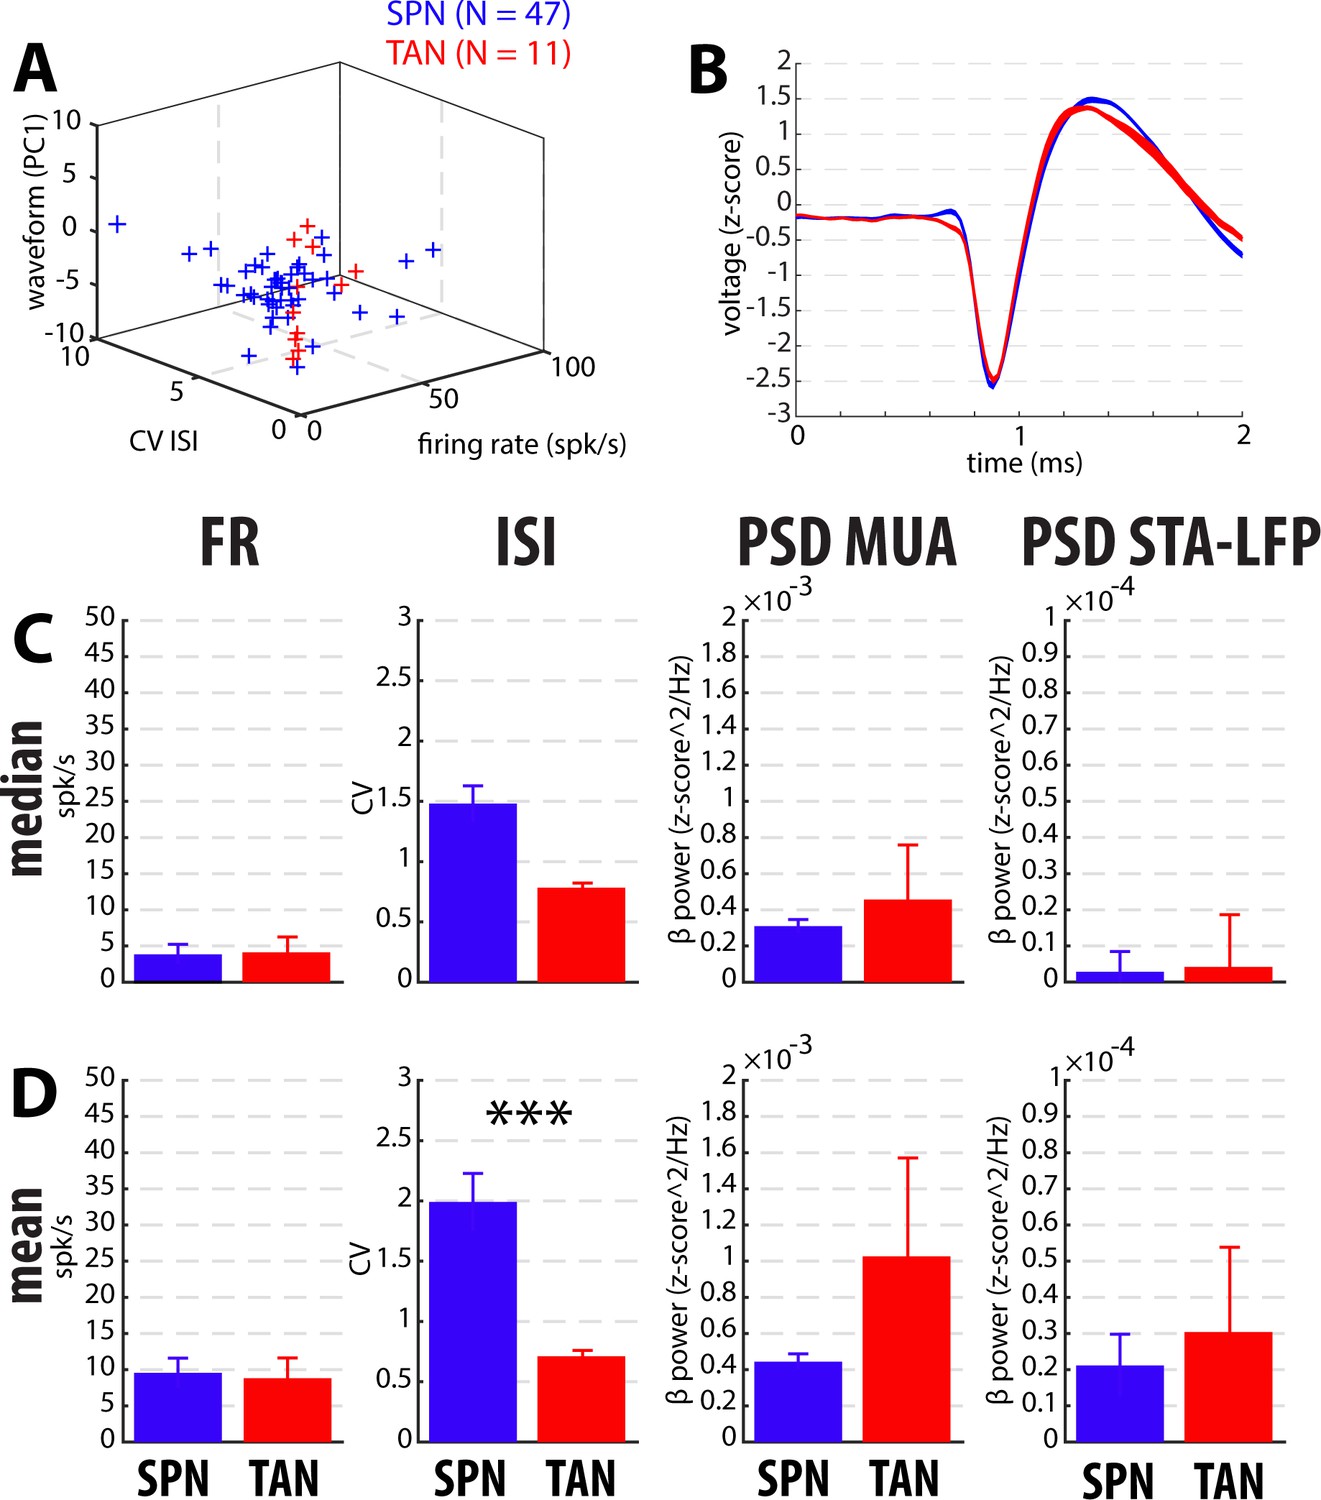
Comparison of the spiking features between the putative well-isolated and stationary SPNs and TANs in PD patients.
(A) Classification of striatal neuron subtypes. Each dot represents a single neuron colored according to its subtype. X-axis: firing rate in spk/s. Y-axis: CV of the ISI. Z-axis: score of the PC1 of the spike waveform. PC1 explained 65% and 58% of the variance in PD and Dystonia, respectively. N indicates the number of well-isolated and stationary units. (B) Average (Mean ± SD) spike waveform of all the putative human SPNs and TANs. (C) Median ±MAD values of the spiking features. (D) Mean ± SEM values of the spiking features. Since each signal was Z-score normalized (using its mean and SD) prior to PSD calculations, the β power of both the MUA and STA-LFP are expressed in z-score^2/Hz. *** indicates significant differences (p<0.001, Mann-Whitney U-test).
Figure 3—figure supplement 3

Comparison of the spiking features between the putative well-isolated and stationary SPNs and TANs in dystonic patients.
Same conventions as Figure 3—figure supplement 2.
Figure 3—figure supplement 4
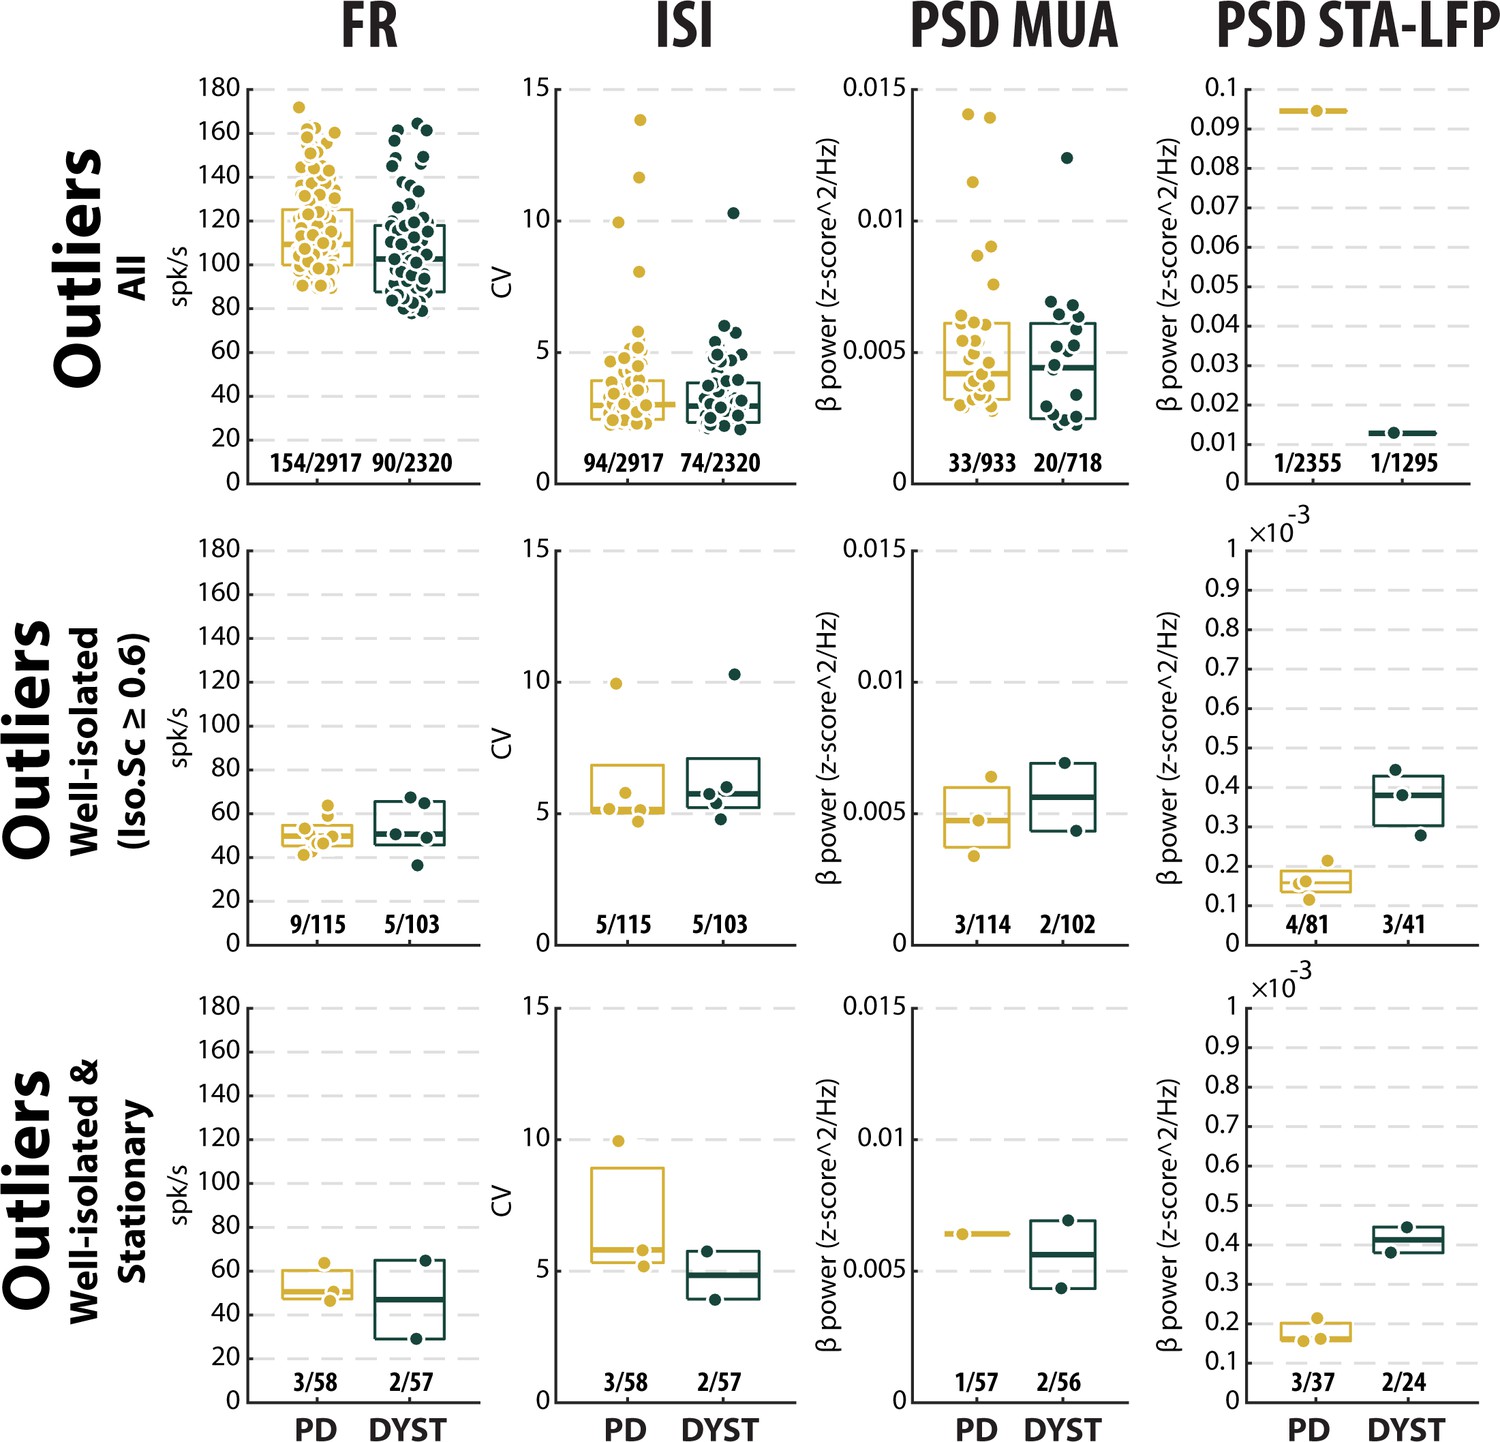
Disease effects on the outliers of the different features of striatal neuronal activity.
Box plots showing the maxima values (i.e., values ≥ 2 SDs of the mean value) of the firing rate (first column), the coefficient of variation (CV) of the inter-spike interval (ISI) (second column), the β power of the multi-unit activity (MUA, spiking activity) recorded in the vicinity of a sorted unit (third column) and the β power of the spike-triggered average (STA) of the local field potential (LFP) (fourth column) when considering all (upper panels), only the well-isolated (middle panels) and only the well-isolated stationary (lower panels) units. In each box, the central mark indicates the median, and the bottom and top edges of the box indicate the 25th and 75th percentiles, respectively. Fractions indicate the numbers of outliers out of the total numbers of units.
Figure 3—figure supplement 5
Median (upper panels) and mean (lower panels) values of the main features of striatal neuronal activity in parkinsonian (PD) and dystonic (DYST) patients.
Same conventions as Figure 3, except that the analysis was only conducted on the subset of ≥10 s-MER segments with striatal well-isolated stationary units. Same y-axis scales as in Figure 3 and Figure 3—figure supplement 1 Numbers in parentheses indicate the sizes of the samples. Note that the sizes of the samples differ between the columns because (i) the number of sorted units from each MUA ranged from 1 to 5 and (ii) the LFPs were not systematically recorded.
Figure 4
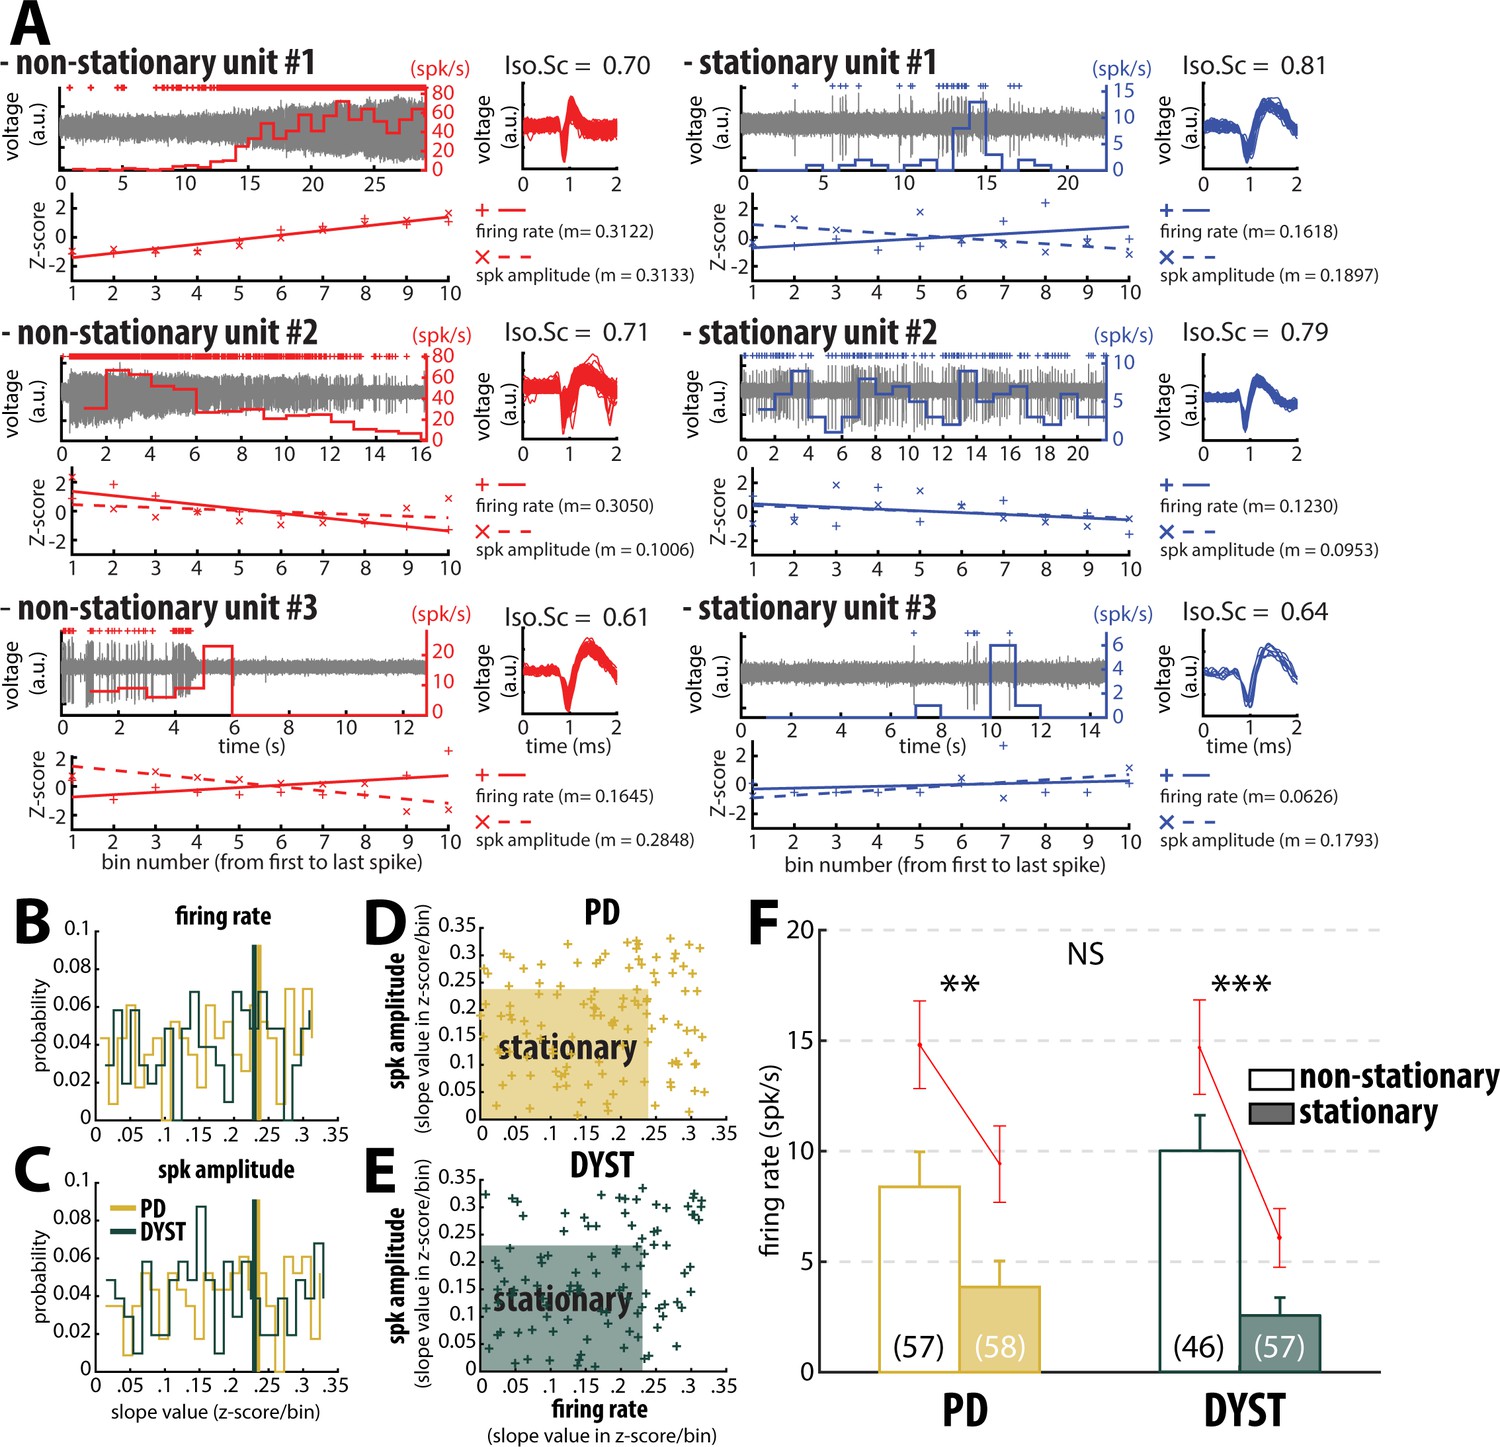
Inclusion of non-stationary units can erroneously increase the striatal firing rate in parkinsonian (PD) and dystonic (DYST) patients.
(A) Examples of well-isolated (non-stationary and stationary) units recorded in the striatum of PD patients. Grey trace is the band-pass filtered signal and depicts the spiking activity. Above the spiking activity is the digital display of the detection (spike train) of the sorted unit. The firing rate of the sorted unit overlays the spiking activity. The spike waveforms extracted from the spiking activity are superimposed and displayed on the right. The isolation score (Iso.Sc) indicates the isolation quality of the identified unit. Below the spiking activity panel is the assessment of the stationarity of the firing rate and spike amplitude. For each spike train, the data comprised between the first and the last spike of the spike train were segmented into 10 equal non-overlapping time bins. Then, the firing rate and the average spike amplitude in each bin were Z-score normalized using the mean and the SD of either the firing rate or the average spike amplitude calculated over the 10 bins. Solid and dotted lines represent the linear regression lines between the firing rate/spike amplitude of the sorted unit and bin number. Slope value (z-score/bin) of the linear regression line (m) was used to assess stationarity. (B–C) Distributions of the slope values of the linear regression line for the firing rate and the spike amplitude of the units. Vertical lines indicate the 70th percentile for the two diseases (PD: 0.2363 and 0.2344 z-score/bin for firing rate and spike amplitude, respectively; Dystonia: 0.2292 and 0.2294 z-score/bin for firing rate and spike amplitude, respectively). Units with slope values of the linear regression line for firing rate or spike amplitude greater than or equal to the 70th percentile were defined as non-stationary units. (D–E) Scatter plots showing the firing rate slope values and spike amplitude slope values of the well-isolated (non-stationary and stationary) units recorded in the striatum of PD and dystonic patients. Shaded areas represent the zones of the stationary units which are delineated by the 70th percentile of both the slope values and spike amplitude slope values. (F) Comparison of the firing rate of the non-stationary and stationary units. Each bar indicates the median firing rate of the sorted units. Error bars represent MADs. Means ± SEMs are shown in red. Numbers in parentheses indicate the numbers of non-stationary and stationary units. **, *** and NS indicate significant (p<0.01 and 0.001) and non-significant differences, respectively (Mann-Whitney U-test).
Figure 5
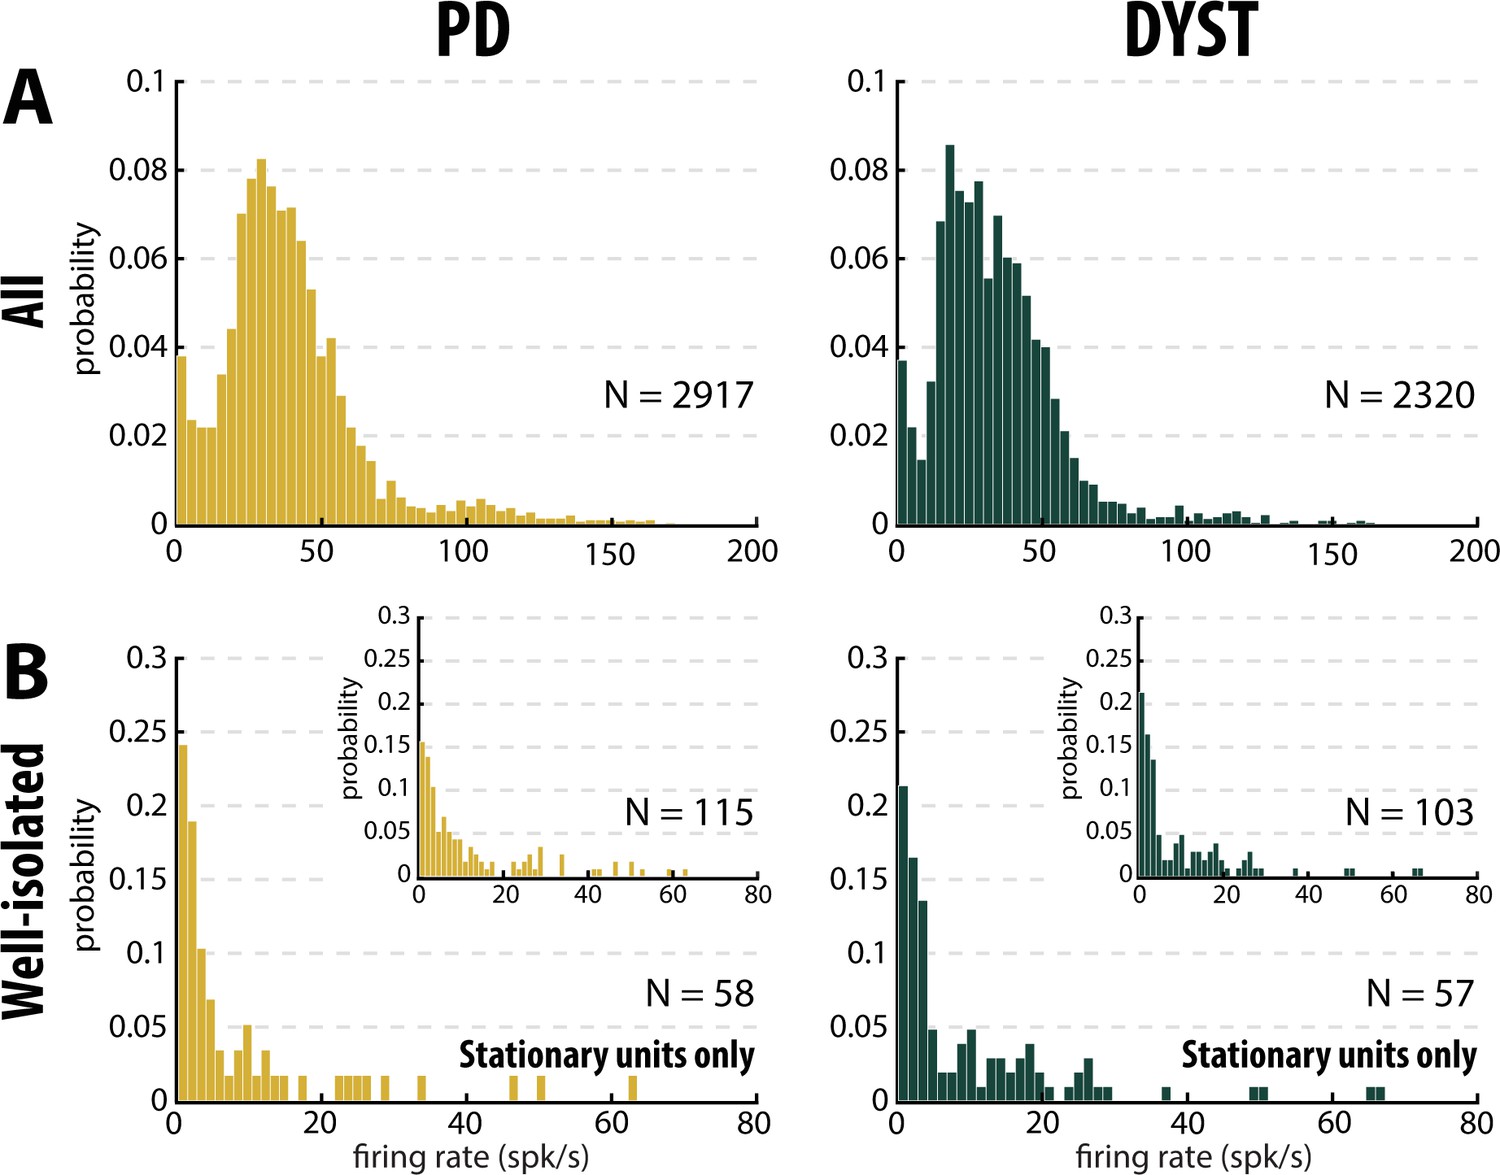
Distributions of the striatal firing rate are skewed to the right in parkinsonian (PD) and dystonic (DYST) patients.
(A) Firing rate of all sorted units regardless of their isolation quality. (B) Firing rate of the well-isolated stationary units only. Skewness = 2.34 and 3.94 for PD and dystonic patients, respectively. Insets: Firing rate of the well-isolated units (non-stationary and stationary units pooled). Skewness = 1.73 and 2.36 for PD and dystonic patients, respectively. N is the number of sorted units.
Figure 6 with 1 supplement
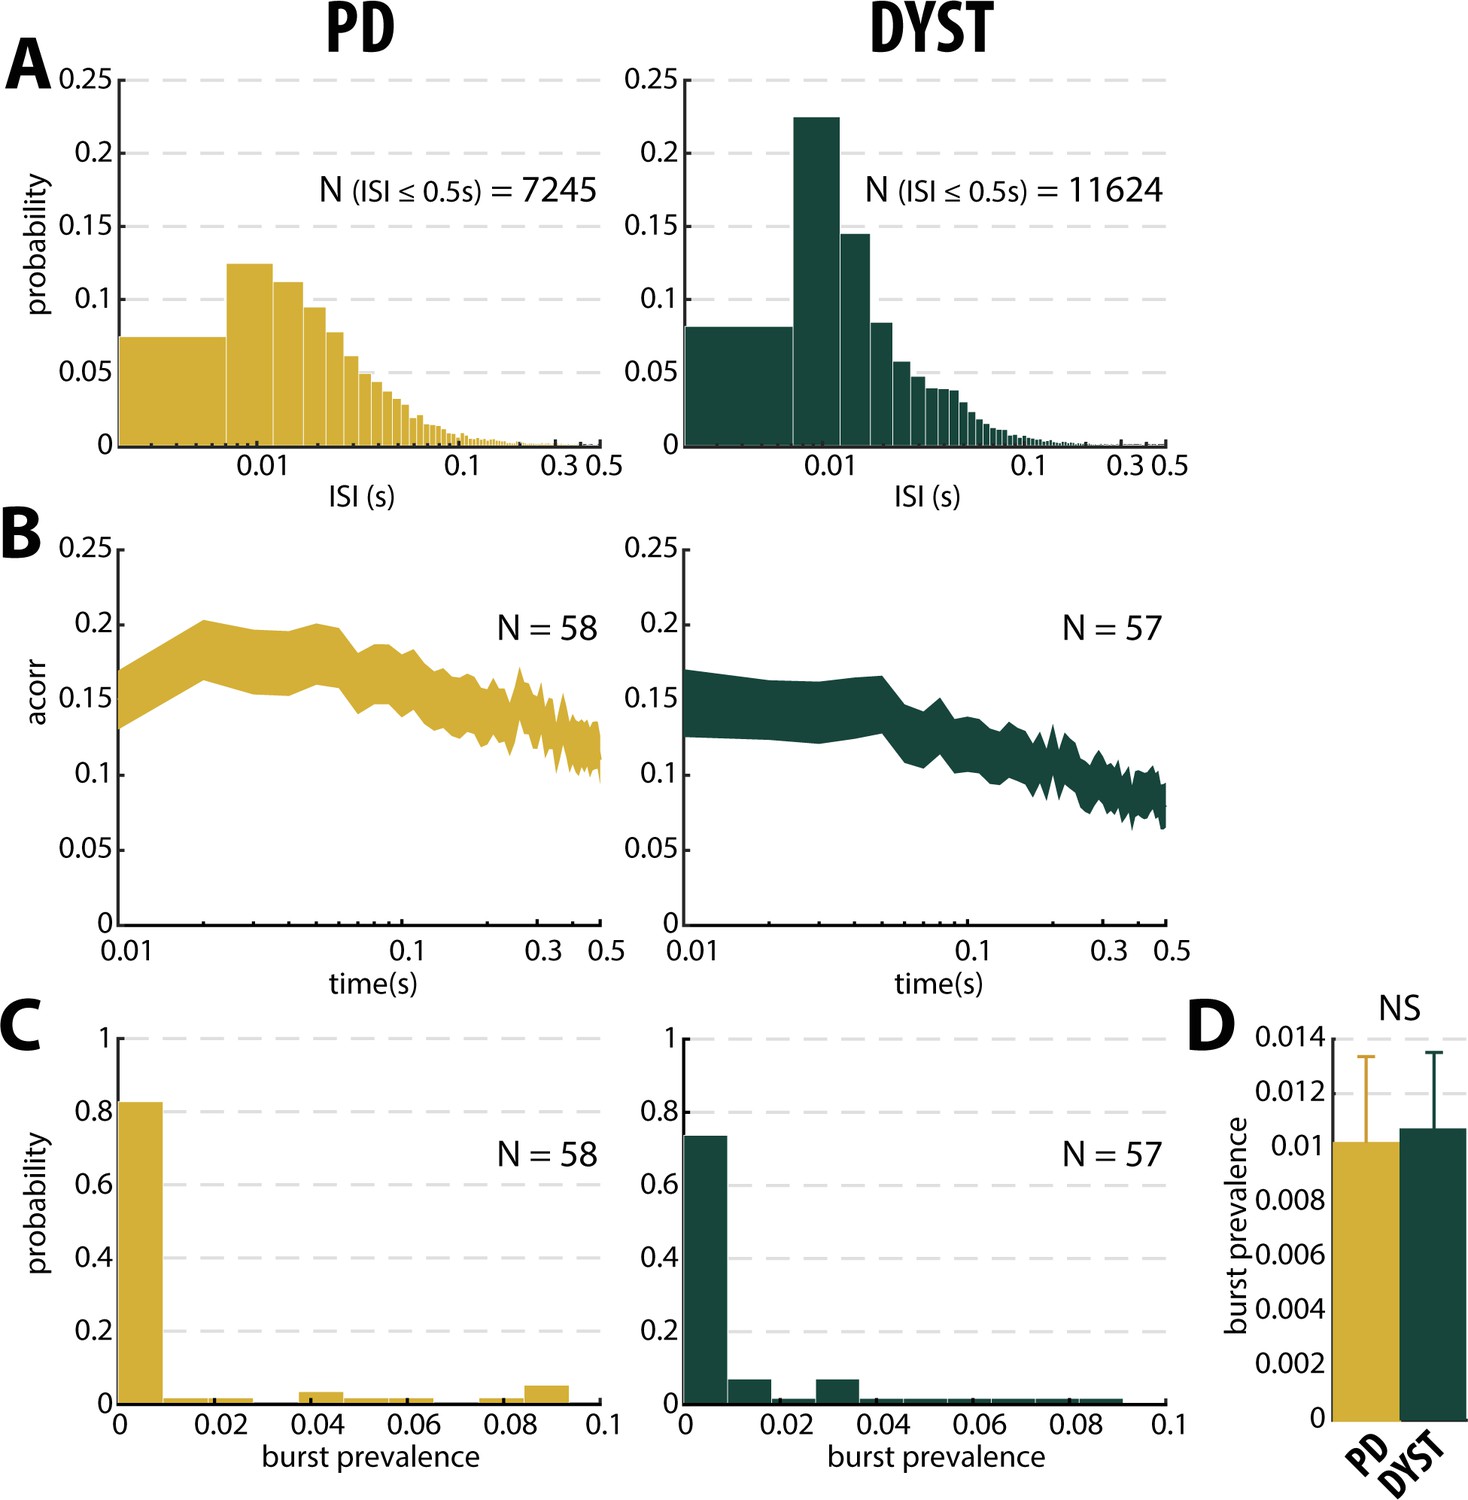
No evidence for burst patterns in the striatal spiking activity of parkinsonian (PD) and dystonic (DYST) patients.
(A) Time interval histograms of the inter-spike intervals (ISI) of the well-isolated (isolation score ≥0.6) stationary units. For better visualization, 191 and 292 ISIs > 0.5 s were removed from the PD and DYST striatal units, respectively. Abscissas are in log scale. (B) Average (mean ± SEM) autocorrelograms of the well-isolated stationary units. For each autocorrelogram, values were normalized so that the autocorrelation values ranged from 0 to 1. Abscissas are in log scale. N is the number of well-isolated stationary units averaged. (C) Distributions of the values of burst prevalence for the spike train of the well-isolated stationary units. For each unit, episode prevalence represents the probability that the discharge pattern was bursty. (D) Mean values of burst prevalence for the well-isolated stationary units recorded in the striatum of parkinsonian and dystonic patients. Error bars represent SEMs. N is the number of well-isolated stationary units averaged. NS: non-significant (Mann-Whitney U-test).
Figure 6—figure supplement 1

No evidence for burst patterns in the striatal spiking activity of parkinsonian (PD) and dystonic (DYST) patients.
Same conventions as Figure 6, except that the analysis was only conducted on the subset of ≥10 s-MER segments with striatal well-isolated stationary units.
Figure 7
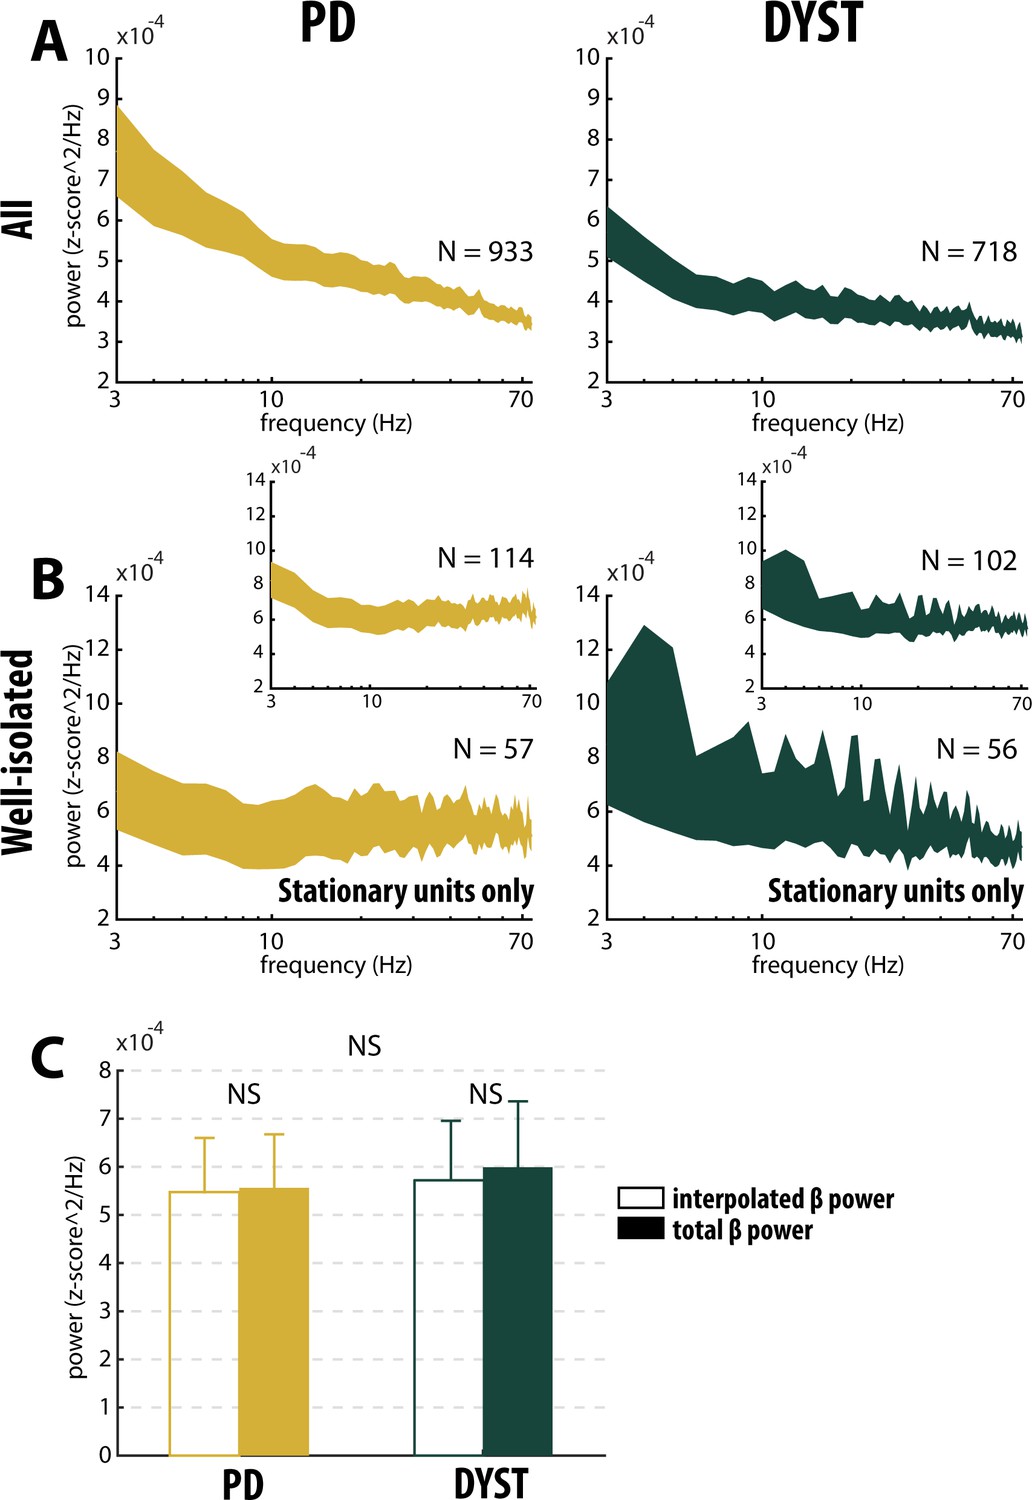
Absence of oscillatory spiking activity in the striatum of parkinsonian (PD) and dystonic (DYST) patients.
Average (mean ± SEM) power spectrum densities (PSDs) of (A) all spiking activities and (B) only spiking activities recorded in the vicinity of well-isolated stationary units. Insets: Average PSDs of the spiking activities recorded in the vicinity of the well-isolated units (non-stationary and stationary units pooled). Since each band-pass filtered spiking signal was Z-score normalized (using its mean and SD) prior to PSD calculations, PSDs are expressed in z-score^2/Hz. Abscissas are in log scale. N is the number of spiking activities averaged. (C) Average β (13–30 Hz) power of the spiking activities recorded in the vicinity of well-isolated stationary units. To interpolate the β power, PSDs were linearly interpolated [based on the two closest points that flanked the 13–30 Hz band - namely, the values at 12 and 31 Hz (spectral resolution of 1 Hz)]. Interpolated β power is the mean of the linearly interpolated values between 13 and 30 Hz. Total β power is the mean of the observed values between 13 and 30 Hz. Error bars represent SEMs. NS: non-significant (Wilcoxon signed rank test and Mann-Whitney U-test).
Figure 8

No locking between spike and β LFP oscillations in the striatum of parkinsonian (PD) and dystonic (DYST) patients.
(A) Average (mean ± SEM) PSDs of striatal LFPs. In the insets, the ordinates are truncated for better visualization of the power. Abscissas are in log scale. N is the number of LFPs averaged. (B) Population (mean ± SEM) spike-triggered averages (STAs) of LFP. LFP was recorded in the vicinity of well-isolated stationary units (i.e., spiking activity and LFP were recorded on the same electrode) and offline band-pass filtered from 4 to 12 Hz (upper panels) or from 13 to 30 Hz (lower panels). For comparison, STAs-LFP were also calculated after randomly shifting the timestamp of each spike of the spike train [i.e., random time (comprised between 0 and 1 s) was added to the timestamp of each spike of the spike train] in order to abolish any relationship between LFP and spiking activity (Shift predictor). Dashed grey vertical lines indicate the time of the spikes (time = 0). N is the number of STAs-LFP averaged. Since each LFP was Z-score normalized (using its mean and SD) prior to PSD and STA calculations, PSDs and magnitudes of the STA-LFPs are expressed in z-score^2/Hz and z-score, respectively.
Figure 9
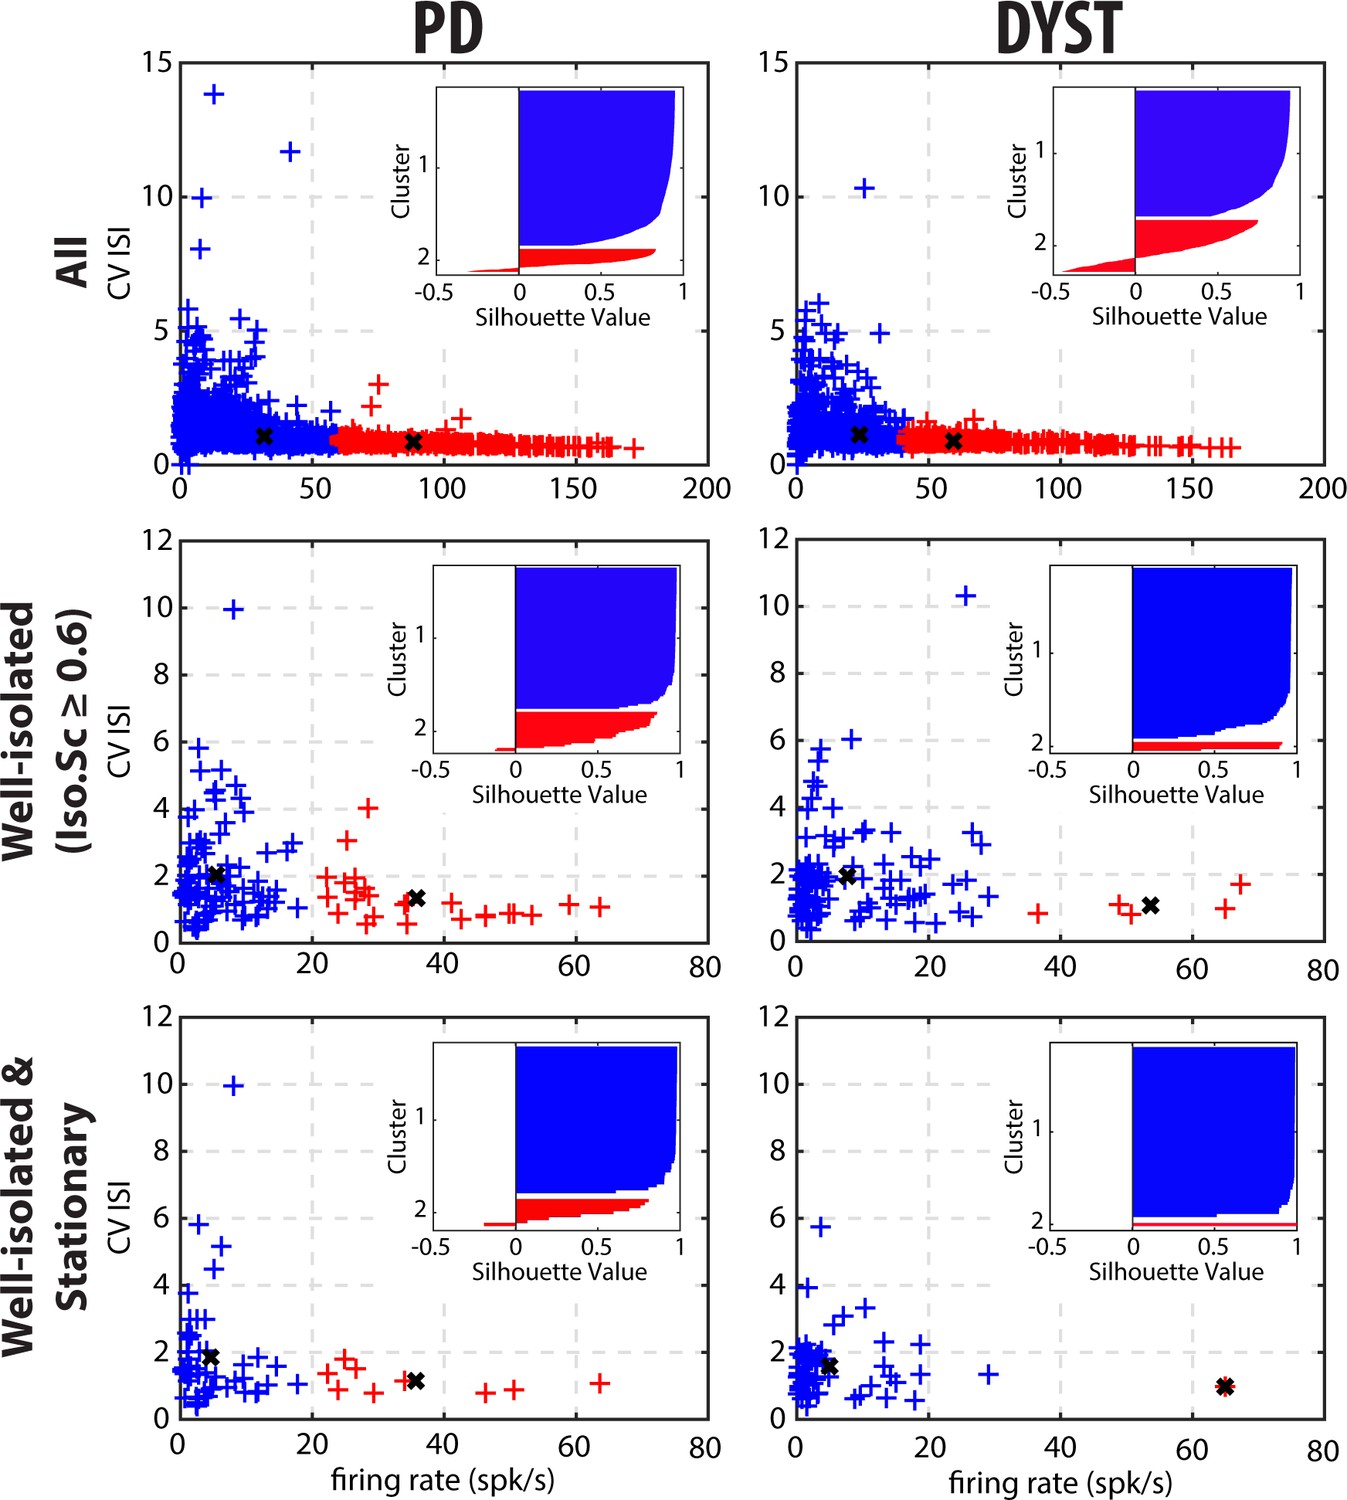
Cluster analysis using discharge properties does not reveal well-separated subpopulations of striatal units in parkinsonian (PD) and dystonic (DYST) patients.
2D k-means cluster analysis with k = 2, using the firing rate and the CV of the ISIs of each unit as input parameters. Analysis was performed when considering all (upper panels), only the well-isolated (middle panels) and only the well-isolated stationary (lower panels) units. Markers (x) represent cluster centroids. Inset: silhouette values were calculated for each clustering to assess how well-separated the two resulting clusters were. Silhouette values ranges from +1 (data points are very distant from other clusters), through 0 (data points are not distinctly in one cluster or another), to −1 (data points are assigned to the wrong cluster).
-
Figure 9—source data 1
2D k-means cluster analysis for all units in PD.
- https://cdn.elifesciences.org/articles/57445/elife-57445-fig9-data1-v2.xls
-
Figure 9—source data 2
2D k-means cluster analysis for the well-isolated units in PD.
- https://cdn.elifesciences.org/articles/57445/elife-57445-fig9-data2-v2.xls
-
Figure 9—source data 3
2D k-means cluster analysis for the well-isolated and stationary units in PD.
- https://cdn.elifesciences.org/articles/57445/elife-57445-fig9-data3-v2.xls
-
Figure 9—source data 4
2D k-means cluster analysis for all units in Dystonia.
- https://cdn.elifesciences.org/articles/57445/elife-57445-fig9-data4-v2.xls
-
Figure 9—source data 5
2D k-means cluster analysis for the well-isolated units in Dystonia.
- https://cdn.elifesciences.org/articles/57445/elife-57445-fig9-data5-v2.xls
-
Figure 9—source data 6
2D k-means cluster analysis for the well-isolated and stationary units in Dystonia.
- https://cdn.elifesciences.org/articles/57445/elife-57445-fig9-data6-v2.xls
Videos
Video 1
3D rotating view of group-based microelectrode trajectories.
Tables
Table 1
Patient demographic information.
| Patient no. | Disease | Surgery side | Trajectories | Gender | Age at onset | Age at surgery | Disease duration (y) |
|---|---|---|---|---|---|---|---|
| 1 | PD | bilateral | R(2) ; L(1) | M | 40 | 62 | 22 |
| 2 | PD | unilateral | R(1) | F | 45 | 62 | 17 |
| 3 | PD | bilateral | R(2) ; L(2) | F | 50 | 62 | 12 |
| 4 | PD | unilateral | L(1) | F | 45 | 62 | 17 |
| 5 | PD | unilateral | R(2) | F | 49 | 60 | 11 |
| 6 | PD | bilateral | R(2) ; L(2) | F | 66 | 72 | 6 |
| 7 | PD | bilateral | R(2) ; L(1) | F | 43 | 59 | 16 |
| 8 | PD | bilateral | R(2) ; L(2) | F | 54 | 68 | 14 |
| 9 | PD | bilateral | R(2) ; L(2) | F | 55 | 62 | 7 |
| 10 | PD | bilateral | R(2) ; L(2) | F | 46 | 58 | 12 |
| 11 | PD | bilateral | R(2) ; L(2) | F | 41 | 57 | 16 |
| 12 | PD | bilateral | R(2) ; L(2) | M | 53 | 66 | 13 |
| 13 | PD | unilateral | L(2) | F | 53 | 63 | 10 |
| 14 | PD | bilateral | R(2) ; L(2) | M | 35 | 44 | 9 |
| 15 | PD | bilateral | R(1) ; L(1) | M | 41 | 57 | 16 |
| 16 | PD | unilateral | R(2) | M | 50 | 57 | 7 |
| 17 | Dystonia (NG) | bilateral | R(1) ; L(2) | F | 36 | 56 | 20 |
| 18 | Dystonia (NG) | bilateral | R(2) ; L(2) | M | 44 | 49 | 5 |
| 19 | Dystonia (NG) | bilateral | R(1) ; L(2) | F | 45 | 65 | 20 |
| 20 | Dystonia (NG) | bilateral | R(2) ; L(1) | F | 58 | 60 | 2 |
| 21 | Dystonia (NG) | bilateral | R(2) ; L(2) | F | 13 | 19 | 6 |
| 22 | Dystonia (NG) | bilateral | R(1) ; L(1) | F | 60 | 63 | 2 |
| 23 | Dystonia (NG) | bilateral | R(2) ; L(2) | M | 60 | 62 | 2 |
| 24 | Dystonia(NG) | bilateral | R(2) ; L(2) | F | 69 | 71 | 2 |
| 25 | Dystonia (G) | bilateral | R(2) ; L(2) | M | 16 | 25 | 9 |
| 26 | Dystonia (G) | bilateral | R(2) ; L(2) | M | 12 | 18 | 6 |
| 27 | Dystonia (G) | bilateral | R(1) ; L(2) | M | 24 | 39 | 15 |
| 28 | Dystonia (G) | bilateral | R(2) ; L(2) | M | 39 | 54 | 15 |
| 29 | Dystonia (G) | bilateral | R(1) ; L(2) | M | 53 | 56 | 3 |
-
PD patients (5 males and 11 females) were 60.7 ± 6.1 years old and with a disease duration of 12.8 ± 4.4 years (mean ± standard deviation, SD). Dystonic patients (7 males and six females) were 49.0 ± 18.0 years old and with a disease duration of 8.2 ± 6.9 years (mean ± standard deviation, SD). NG: non-genetic; G: genetic; R: right; L: left; Numbers in parentheses indicate the number of microelectrode trajectories; M: male; F: female.
Additional files
Download links
A two-part list of links to download the article, or parts of the article, in various formats.
Downloads (link to download the article as PDF)
Open citations (links to open the citations from this article in various online reference manager services)
Cite this article (links to download the citations from this article in formats compatible with various reference manager tools)
What is the true discharge rate and pattern of the striatal projection neurons in Parkinson’s disease and Dystonia?
eLife 9:e57445.
https://doi.org/10.7554/eLife.57445


