Neural variability determines coding strategies for natural self-motion in macaque monkeys
- Department of Physiology, McGill University, Canada
- The Department of Otolaryngology- Head and Neck Surgery, Johns Hopkins University School of Medicine, United States
- The Department of Biomedical Engineering, Johns Hopkins University School of Medicine, United States
- The Department of Neuroscience, Johns Hopkins University School of Medicine, United States
- Kavli Neuroscience Discovery Institute, Johns Hopkins University, United States
Figures
Figure 1 with 2 supplements
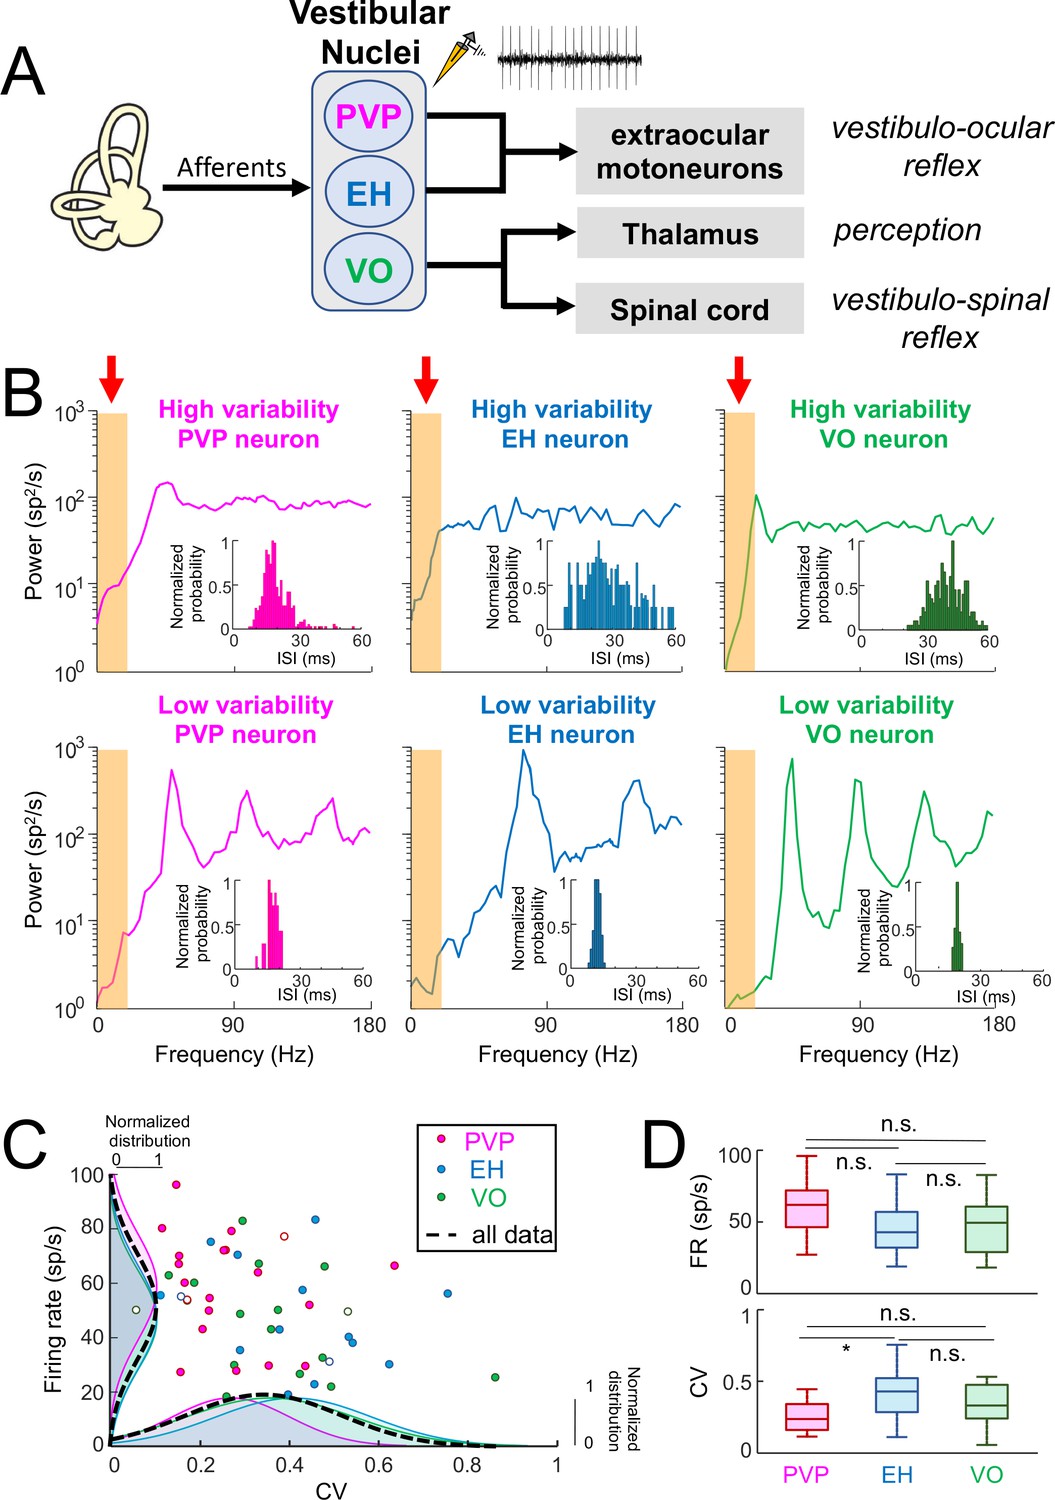
Central vestibular neurons display a wide range of variability in the absence of stimulation.
(A) Afferents from the vestibular periphery project to three classes of neurons found in the vestibular nuclei. Position-vestibular-pause (PVP, magenta) and eye-head (EH, blue) neurons project to extraocular motoneurons within the abducens nucleus and mediate reflexive behaviors such as the vestibulo-ocular reflex (VOR). Vestibular-only (VO, green) neurons project to the ventral posterolateral (VPL) nucleus of the Thalamus, thereby mediating self-motion perception, as well as to the spinal cord, mediating vestibulo-spinal reflexes. Recordings were made from PVP, EH and VO neurons. (B) Top: Spike train power spectra of example PVP (left), EH (middle), and VO (right) neurons that display high variability. Bottom: Spike train power spectra of example PVP (left), EH (middle), and VO (right) neurons that display low variability. The orange bands indicated by the red arrows show the frequency range of naturalistic head motion stimuli (0–20 Hz). The insets show the interspike interval (ISI) distribution for each example neuron. (C) Firing rate as a function of the ISI coefficient of variation (CV). In all three cases, there was no significant correlation (PVP: R = −0.08, p=0.71; EH: R = −0.29, p=0.29; VO: R = −0.38, p=0.13). The dashed black curves show the distributions for all data. The six example neurons shown in panel B are represented by open symbols. (D) Top: Population-averaged firing rates for PVP, EH, and VO neurons did not differ significantly from one another (one-way ANOVA, F(2,51) = 2.31, p=0.11). Bottom: Population-averaged CV values for PVP, EH, and VO neurons. The CV of VO neurons was more broadly distributed than that of PVP and EH neurons (Levene’s test F = 7.2, p=0.001) while the distribution of the firing rate was similar for all classes of neuron (Levene’s test F = 0.87, p=0.43). PVP neurons displayed lower CV values than VO and EH neurons on average (one-way ANOVA, F(2,51) = 3.58, p=0.03).
Figure 1—figure supplement 1
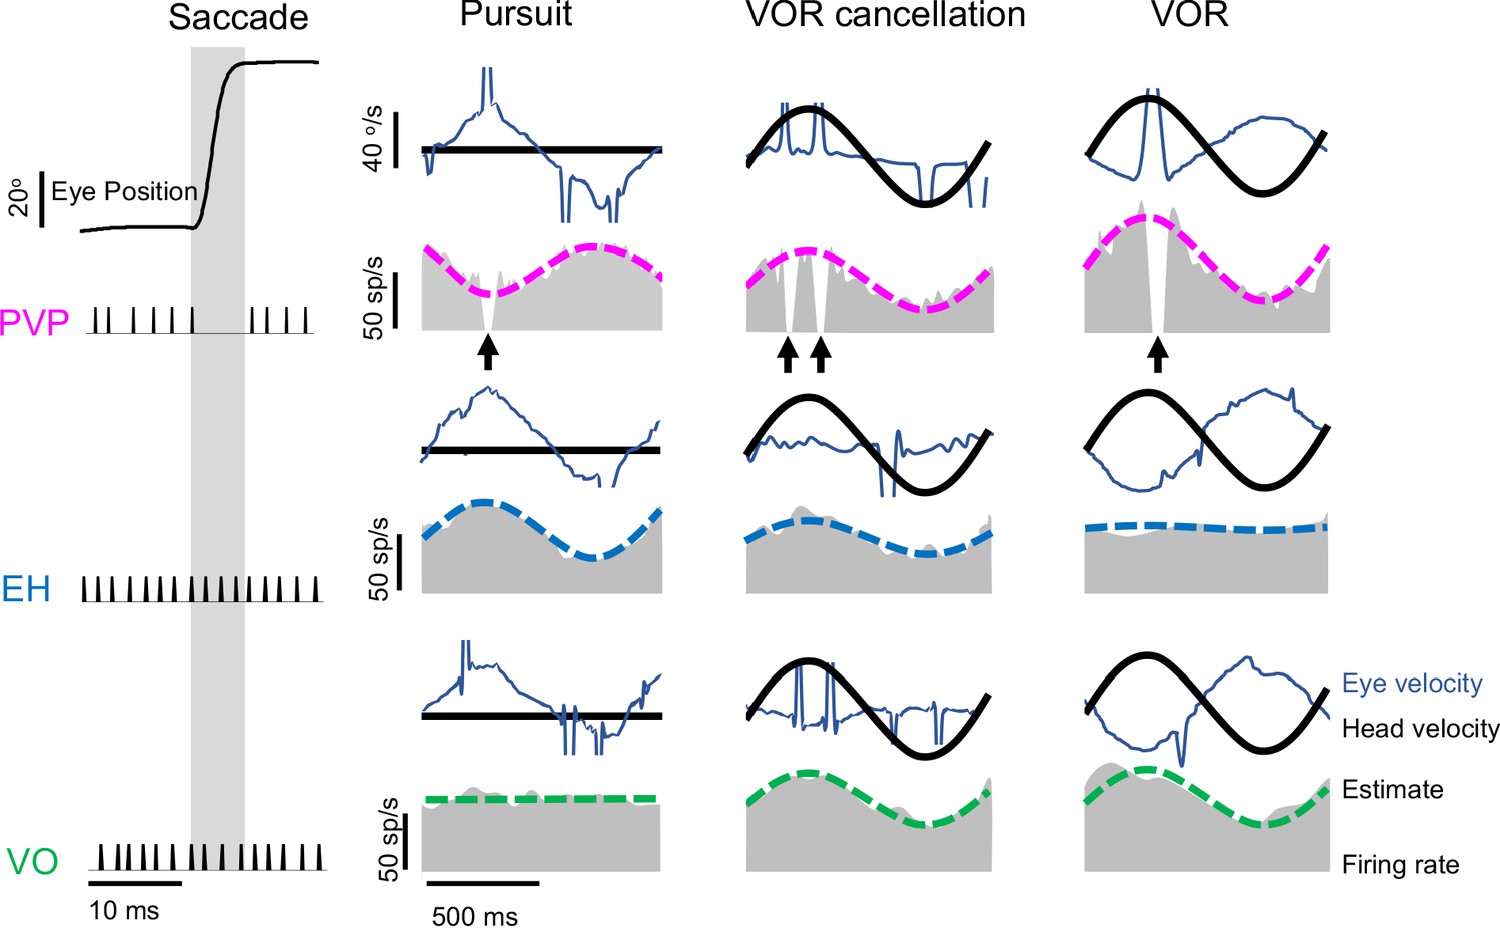
Neuronal classification.
Vestibular nuclei neurons were classified based on their responses to both eye and head movements consisting of saccades (left), smooth pursuit (middle left) where the head is fixed, VOR cancellation (middle right) and VOR (right). PVP neurons (top: example neuron, magenta) are inhibited during saccades (black arrows) and show opposite sensitivity to eye movement during pursuit than head movements during VOR cancellation. EH neurons (middle: example neuron, blue) respond in the same direction to eye movement during pursuit and head movements during VOR cancellation. VO neurons (bottom: example neuron, green) are not sensitive to eye movement and respond to head velocity.
Figure 1—figure supplement 2
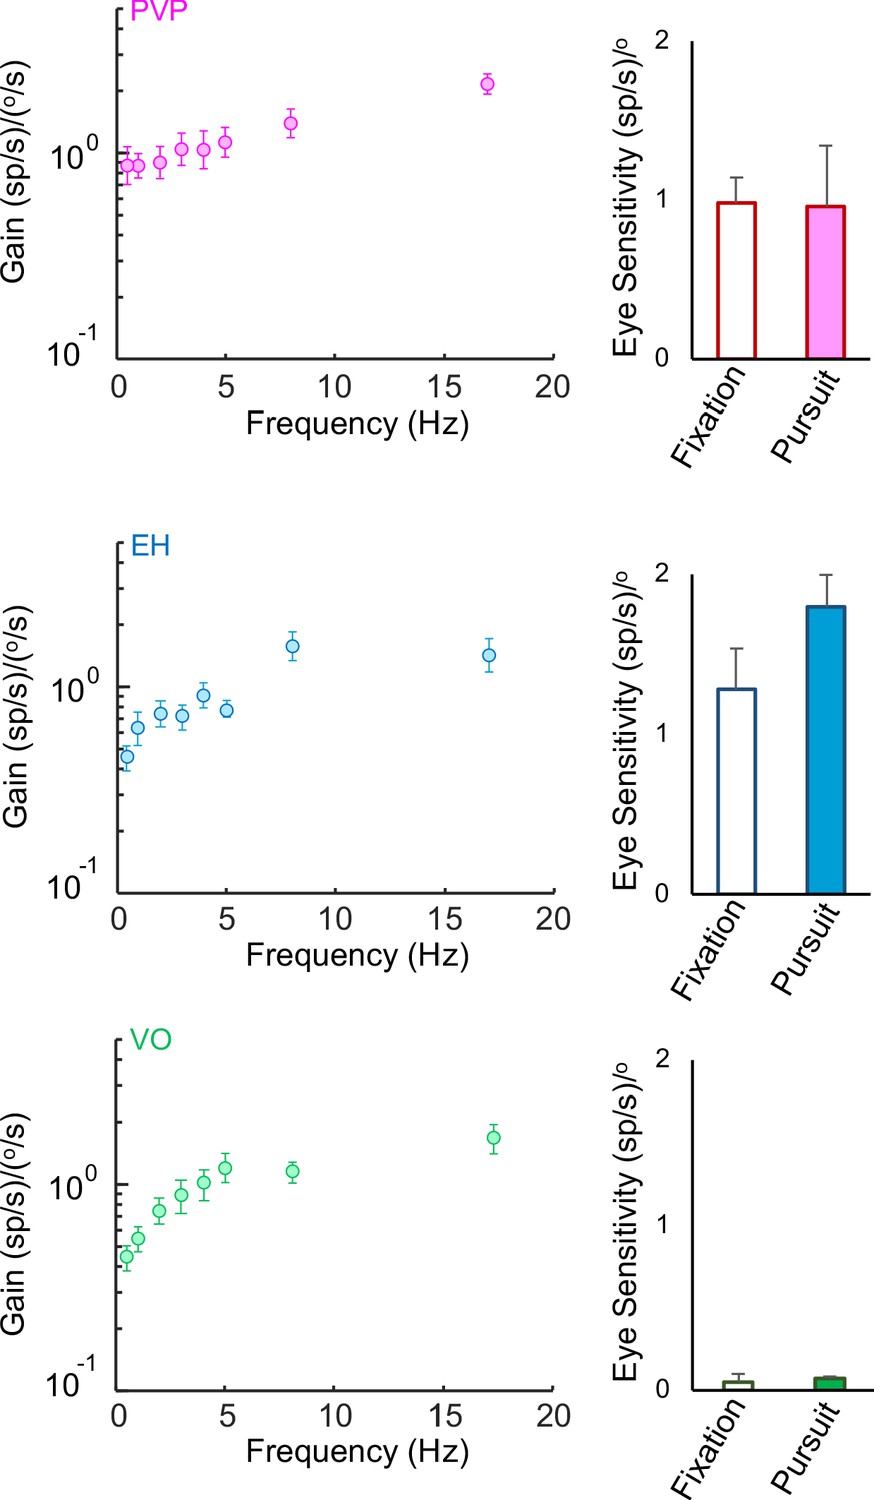
Sensitivities to head and eye movements for PVP, EH, and VO neurons.
Left: Population-averaged gains to head velocity for PVP (top, magenta), EH (middle, blue), and VO (bottom, green) neurons during artificial sinusoidal yaw rotations with frequencies 0.5, 1, 2, 3, 4, 5, 8, and 17 Hz. Right: Population-averaged sensitivities to eye position for PVP (top), EH (middle), and VO (bottom, green) neurons obtained during fixation (hollow) and smooth pursuit (filled). The error bars represent ±1 SEM.
Figure 2 with 7 supplements
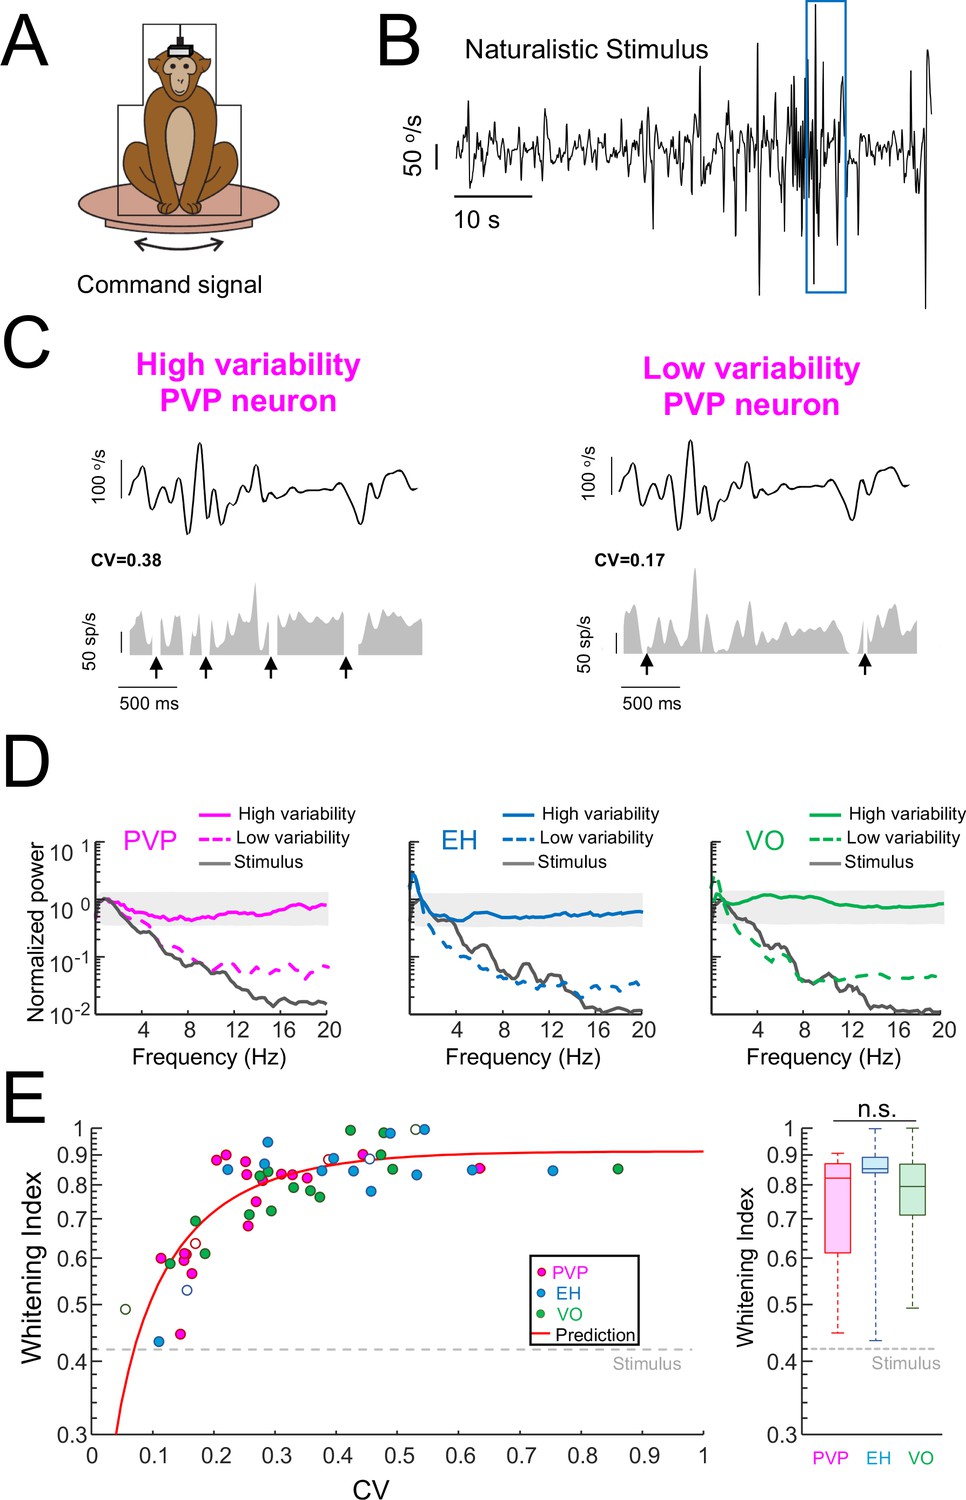
Variability strongly influences optimized coding via temporal whitening.
(A) The animal was head fixed within a chair that was mounted on top of a turn table whose command signal was adjusted to give rise to head movements that closely matched those seen under natural conditions. (B) Time series showing the entire time course of the naturalistic stimulus. (C) Segment of the naturalistic stimulus (top) corresponding to the blue rectangle in panel B together with time-dependent firing rate responses from the same example PVP neurons shown in Figure 1 with high (left) and low (right) variability. Black arrows indicate times at which vestibular quick phases occurred and during which the neurons paused. (D) Response power spectra of PVP (left), EH (middle), and VO (right) neurons with high (solid) and low (dashed) variability. The gray bands show the Poisson confidence interval. It is seen that, while the power spectra of neurons with high variability were always well within the confidence interval and were thus independent of frequency, this was not the case for neurons with low variability whose power spectra decayed as a function of increasing frequency similarly to that of the stimulus (black). (E) Left: Whitening index increases as a function of CV. Our model (red line) accurately fits experimental data (all data: R2 = 0.63; PVP: R2 = 0.53; EH: R2 = 0.63; VO: R2 = 0.78). The six example neurons shown in panel B are represented by open symbols. Right: Population-averaged whitening index values were similar for PVP, EH, and VO neurons (Kruskal-Wallis, H(2) = 2.63, p=0.26). The gray-dashed lines show the whitening index value computed when using the stimulus’ power spectrum.
Figure 2—figure supplement 1
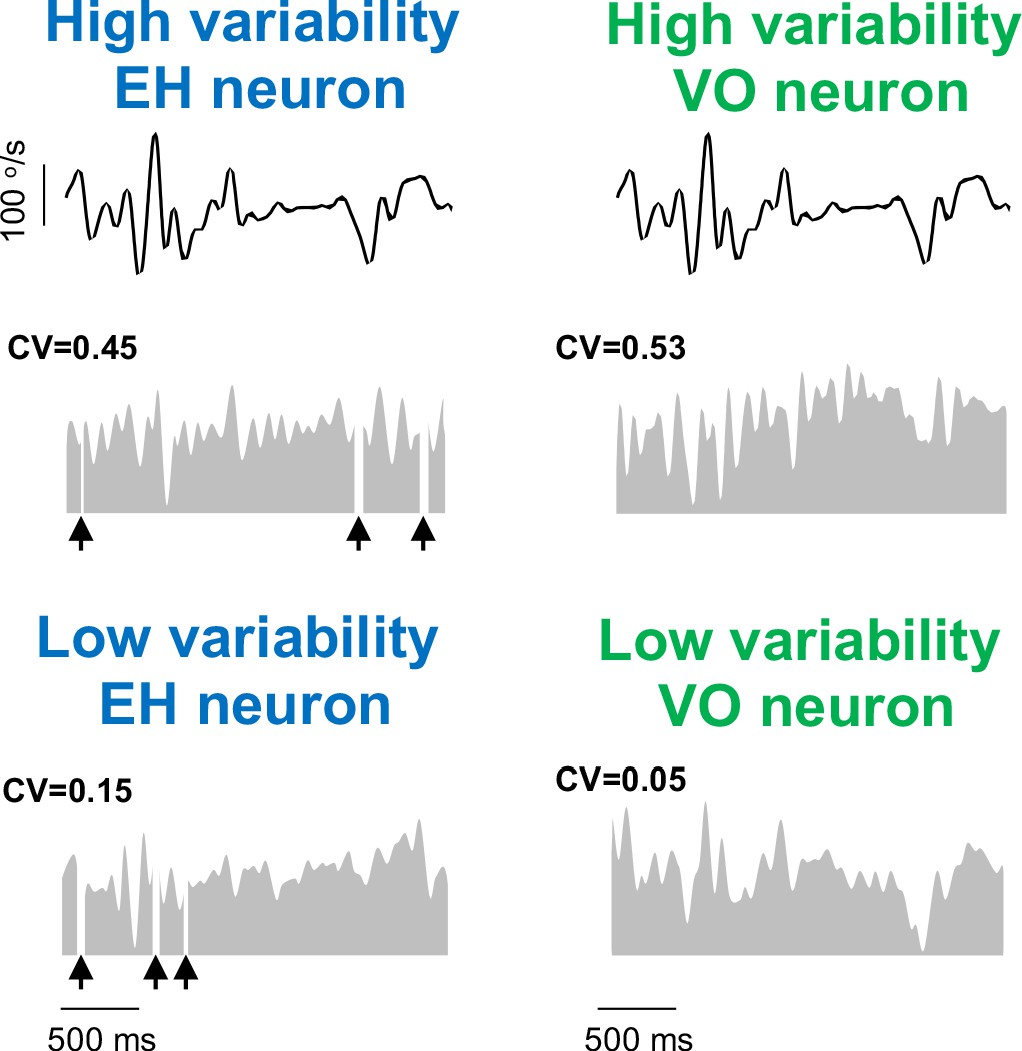
Example EH and VO neurons with high and low variability.
Segment of the naturalistic stimulus (top) together with time-dependent firing rate responses (gray) from example EH (left) and VO (right) neurons with high (middle) and low (bottom) variability. For EH neurons, black arrows indicate times at which vestibular quick phases occurred.
Figure 2—figure supplement 2
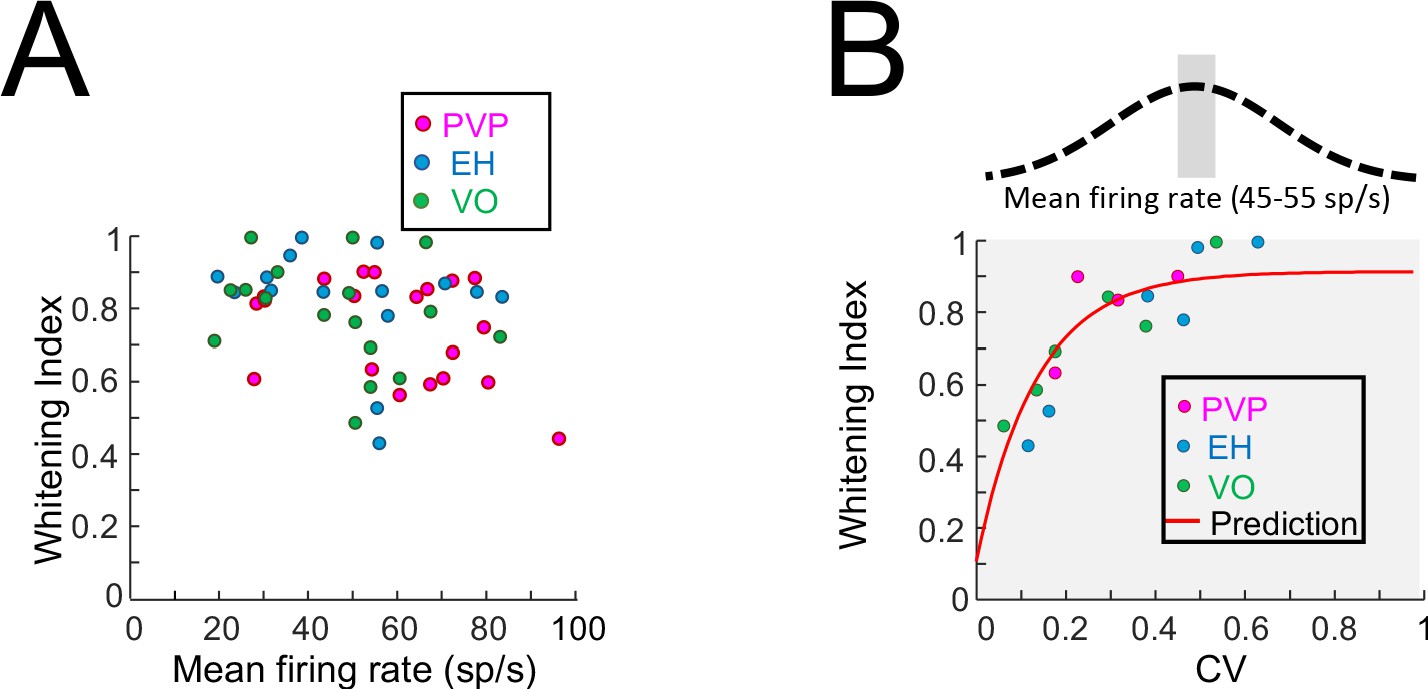
Effects of firing rate on whitening.
(A) Whitening index as a function of the resting discharge firing rate for PVP (magenta), EH (blue) and VO (green) neurons. No significant correlation was observed (PVP: R = −0.37, p=0.11; EH: R = −0.19, p=0.49; VO: R = 0.25, p=0.32; All data: R = −0.24, p=0.09). (B) Whitening index as a function of CV for PVP (magenta), EH (blue) and VO (green) neurons whose firing rates were between 45 sp/s and 55 sp/s. A significant positive correlation was observed (PVP: R = 0.91, p=0.02; EH: R = 0.97, p=7×10⁻⁴; VO: R = 0.96, p=0.002; All data: R = 0.92, p=3.7×10⁻⁷). Also shown in red is the model fit from Figure 2E.
Figure 2—figure supplement 3
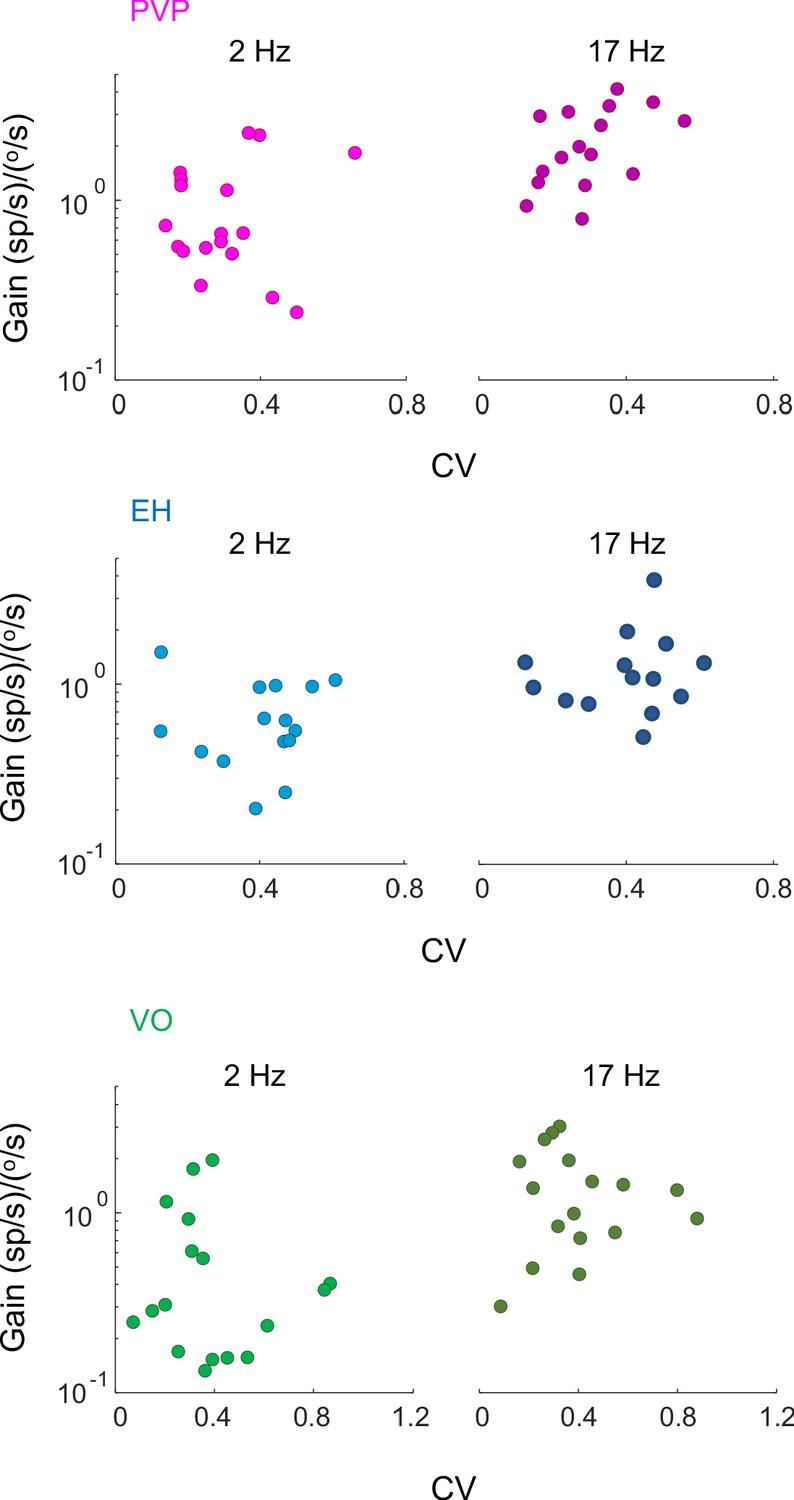
Gain vs. CV for PVP, EH, and VO neurons.
(A) Gain for PVP (magenta), EH (blue) and VO (green) neurons to head velocity during artificial sinusoidal yaw rotations with frequencies 2 Hz (left) and 17 Hz (right) as a function of CV. In all cases, there was no significant correlation between gain and CV (PVP: 2 Hz: R2 = 0.25, p=0.4, 17 Hz: R2 = 0.4, p=0.06; EH: 2 Hz: R2 = 0.25, p=0.3, 17 Hz: R2 = 0.17, p=0.3; VO: 2 Hz: R2 = 0.2, p=0.4, 17 Hz: R2 = 0.16, p=0.6).
Figure 2—figure supplement 4
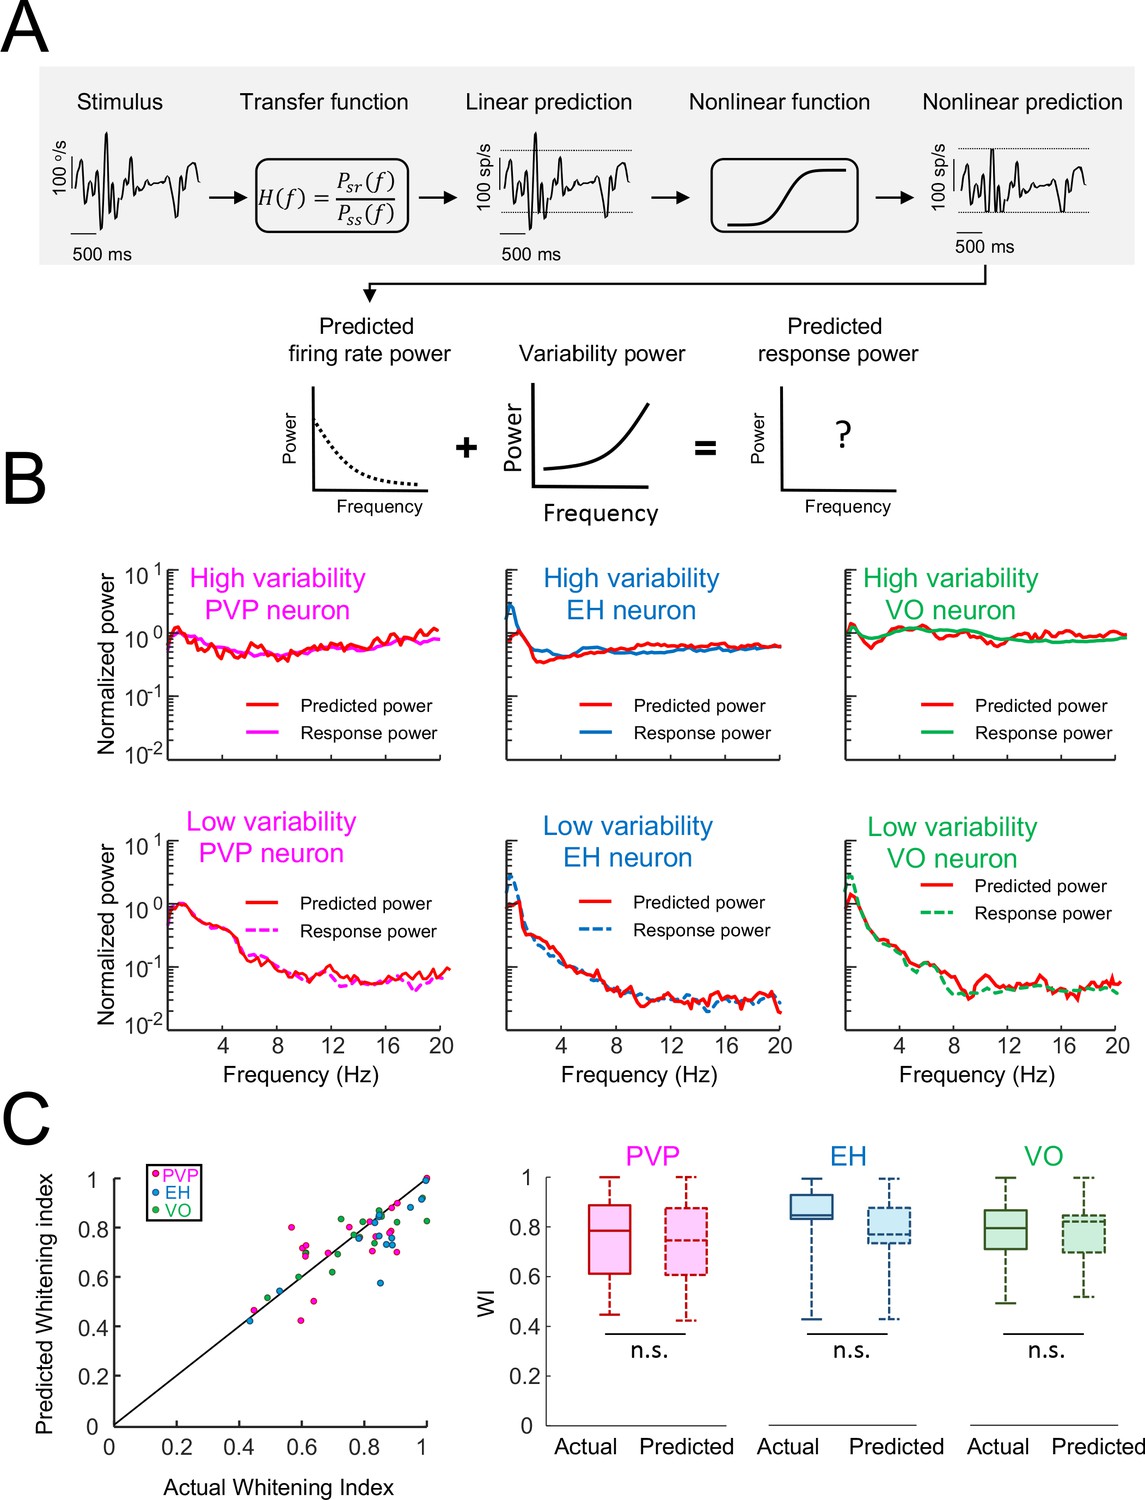
Using linear-nonlinear cascade models to predict responses of central vestibular neurons.
(A) Schematic showing a linear-nonlinear cascade model that was used to generate a prediction of the firing rate. Specifically, the input head velocity stimulus (top left) is filtered using a transfer function (top center left) in order to generate the linear prediction (top middle). The linear prediction is then passed through a nonlinear function (top center right) in order to generate the nonlinear prediction (top right). The power spectrum of the nonlinear prediction (bottom left) is then added to that of the variability (bottom middle) in order to generate the predicted response power spectrum (bottom right). (B) Actual and predicted response power spectra for the same six example neurons shown in Figure 1 consisting of PVP (left), EH (middle), and VO (right) neurons that display high (top) and low (bottom) variability. In all cases, the model could correctly predict the response power spectrum. (C) Left: Predicted whitening index from the model as a function of the actual whitening index value showing datapoints lying around the identity line (black). Right: Actual and predicted whitening index values were for all neuron classes (Student’s t-test, PVP: F(19) = 0.44, p=0.66; EH: F(14) = 0.98, p=0.34; VO = F(16)=0.96, p=0.35).
Figure 2—figure supplement 5

Resting discharge and trial-to-trial variability for PVP, EH, and VO neurons.
Top: Population-averaged power spectra of resting discharge (solid) and that of trial-to-trial variability (dashed) during repeated naturalistic self-motion stimulation. The shaded areas represent ±1 SEM. Bottom: Trial-to-trial variability (dashed) and resting discharge (solid) power spectra for the six example neurons.
Figure 2—figure supplement 6
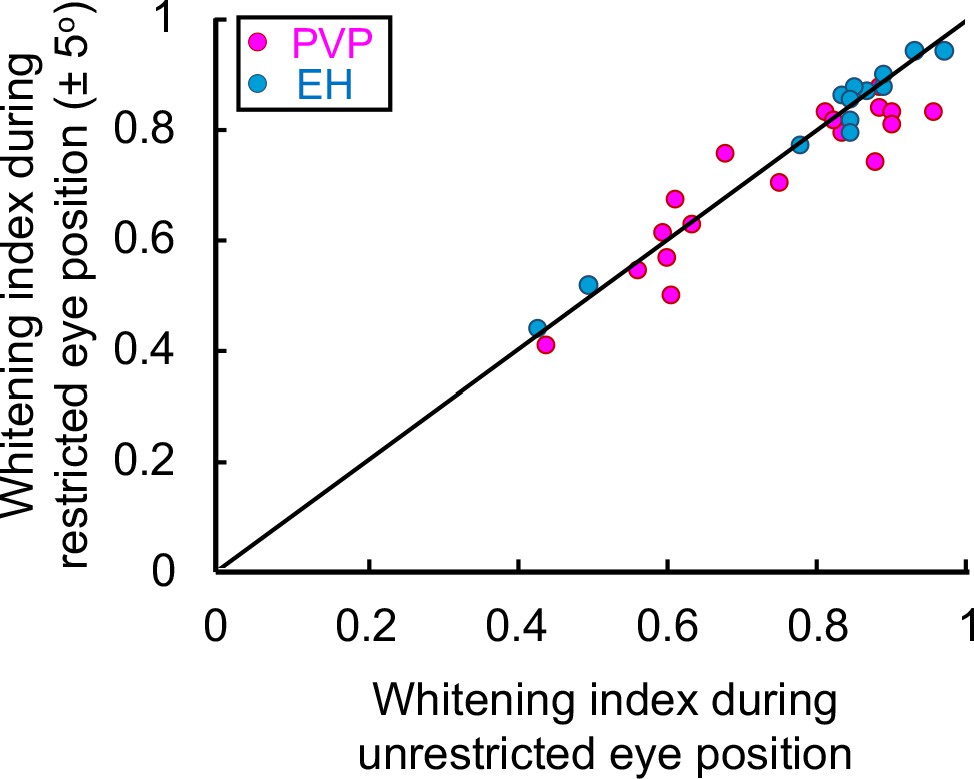
Eye position during naturalistic stimuli does not contribute to temporally whitened responses.
Whitening index obtained for PVP (magenta) and EH (blue) neurons when the eye position was restricted to ± 5o as a function of the whitening index obtained when the eye position was unrestricted. No significant difference was observed (Student’s t-test F(34) = 1.3, p=0.2; PVP: R2 = 0.91, p=2.8×10⁻¹²; EH: R2 = 0.87, p=0.0002).
Figure 2—figure supplement 7
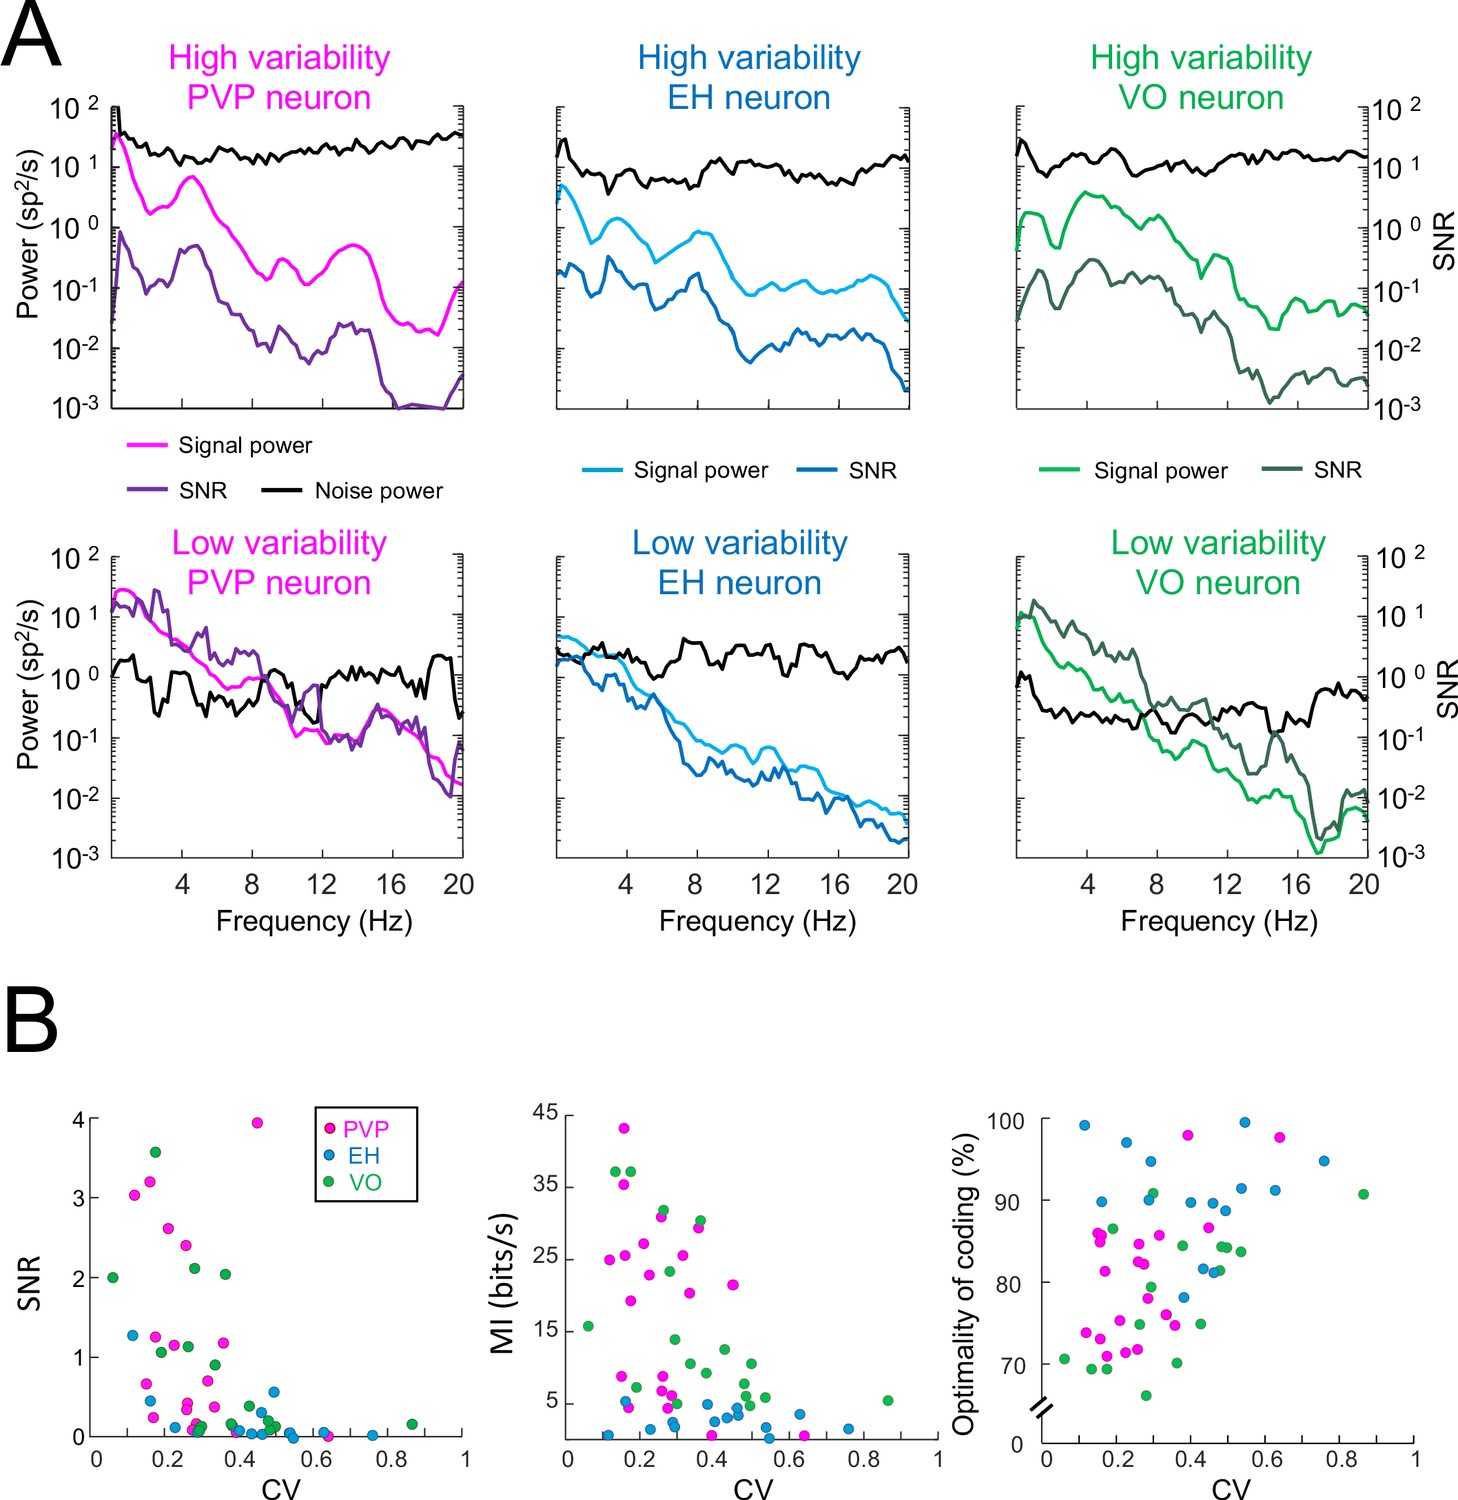
Signal and noise power, as well as SNR, for example PVP, EH, and VO neurons with high and low variability.
(A) Predicted firing rate (i.e., signal) and variability (i.e., noise) power spectra, together with the signal-to-noise ratio (SNR) for six example neurons. (B) Left: SNR was significantly negatively correlated with CV (PVP: R = −0.55, p=0.01; EH: R = −0.62, p=0.01; VO: R = −0.66, p=0.002; All data: R = −0.61, p=1.1×10⁻⁶). Middle: Mutual information was significantly negatively correlated with CV (PVP: R = −0.51, p=0.02; EH: R = 0.08, p=0.77; VO: R = −0.52, p=0.03; All data: R = −0.41, p=0.002). Right: Optimality of coding (i.e., mutual information normalized by its maximum value) was significantly positively correlated with CV (PVP: R = 0.47, p=0.03; EH: R = −0.23, p=0.4; VO: R = 0.56, p=0.02; All data: R = 0.40, p=0.004).
Figure 3 with 2 supplements
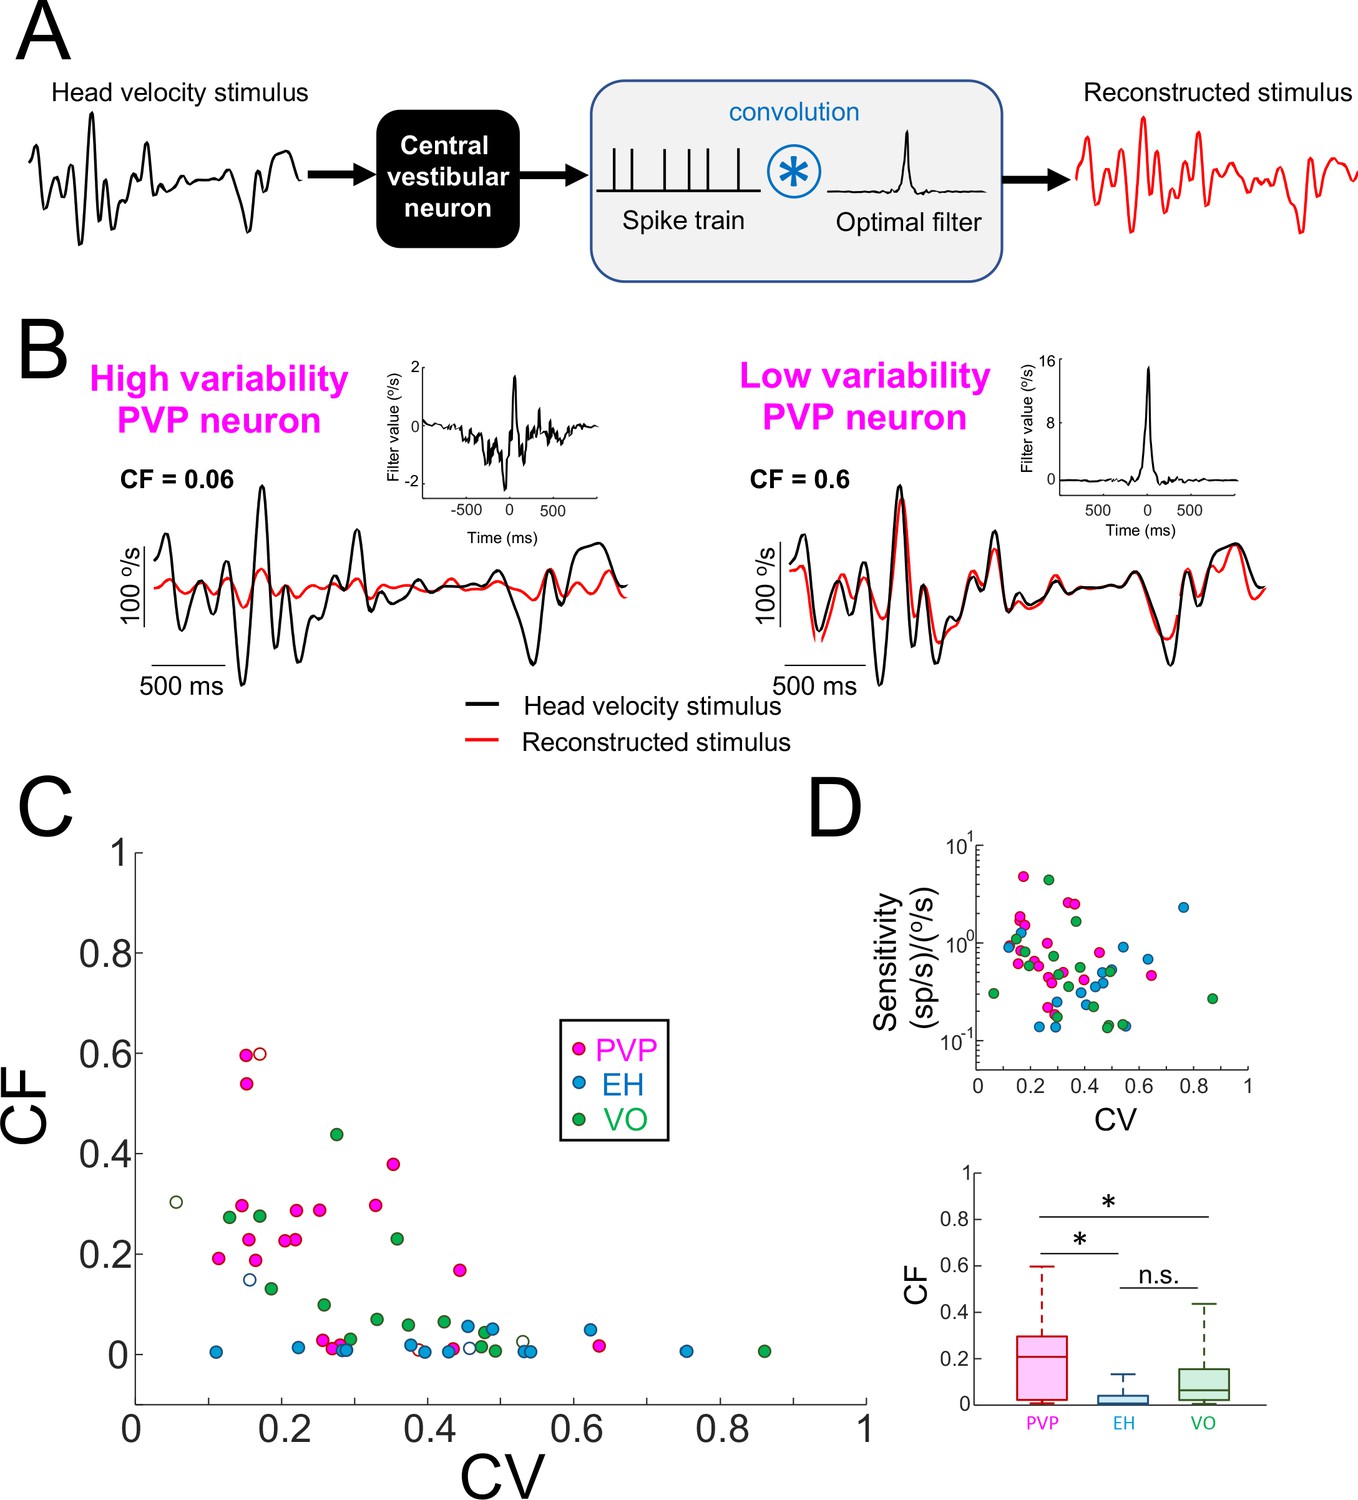
Central vestibular neurons with low variability faithfully encode the detailed time course of naturalistic self-motion stimuli.
(A) Schematic showing the stimulus reconstruction technique. The head velocity stimulus (left) is presented while neural activity (middle) is recorded and the neuron (middle left) is treated as a "black box". The neural activity is then convolved with an optimal filter (middle right) in order to obtain the reconstructed stimulus (right). This filter is chosen such as to minimize the mean square error between the original and reconstructed stimuli (see Materials and methods). (B) Head velocity (black) and reconstructed (red) stimuli from the same example PVP neurons as in Figure 1 with high (left) and low (right) variability. The quality of the reconstruction was quantified using the coding fraction (CF), which ranges between 0 and 1 and represents the fraction of variance in the stimulus that is correctly reconstructed (see Materials and methods). The insets show the optimal kernel for each example neuron. The gaps in the reconstructed stimulus traces indicate segments during vestibular quick phases. (C) CF decreases as a function of increasing CV (all data: R = −0.53, p=1.0×10⁻⁴; PVP: R = −0.51; p=0.02; EH: R = −0.07, p=0.8; VO: R = −0.65, p=4.5×10⁻³; R values were computed on log-transformed data). The six example neurons shown in panel B are represented by open symbols. (D) Top: Neural sensitivity did not decrease with increasing CV (all data: R = −0.24, p=0.09; PVP: R = −0.22; p=0.35; EH: R = 0.35, p=0.20; VO: R = −0.25, p=0.34). The legend is the same as in panel C. Bottom: Population-averaged values of CF were highest for PVP and lowest for EH neurons (one-way ANOVA, F(2,51) = 9.1, p=4.5×10⁻⁴).
Figure 3—figure supplement 1
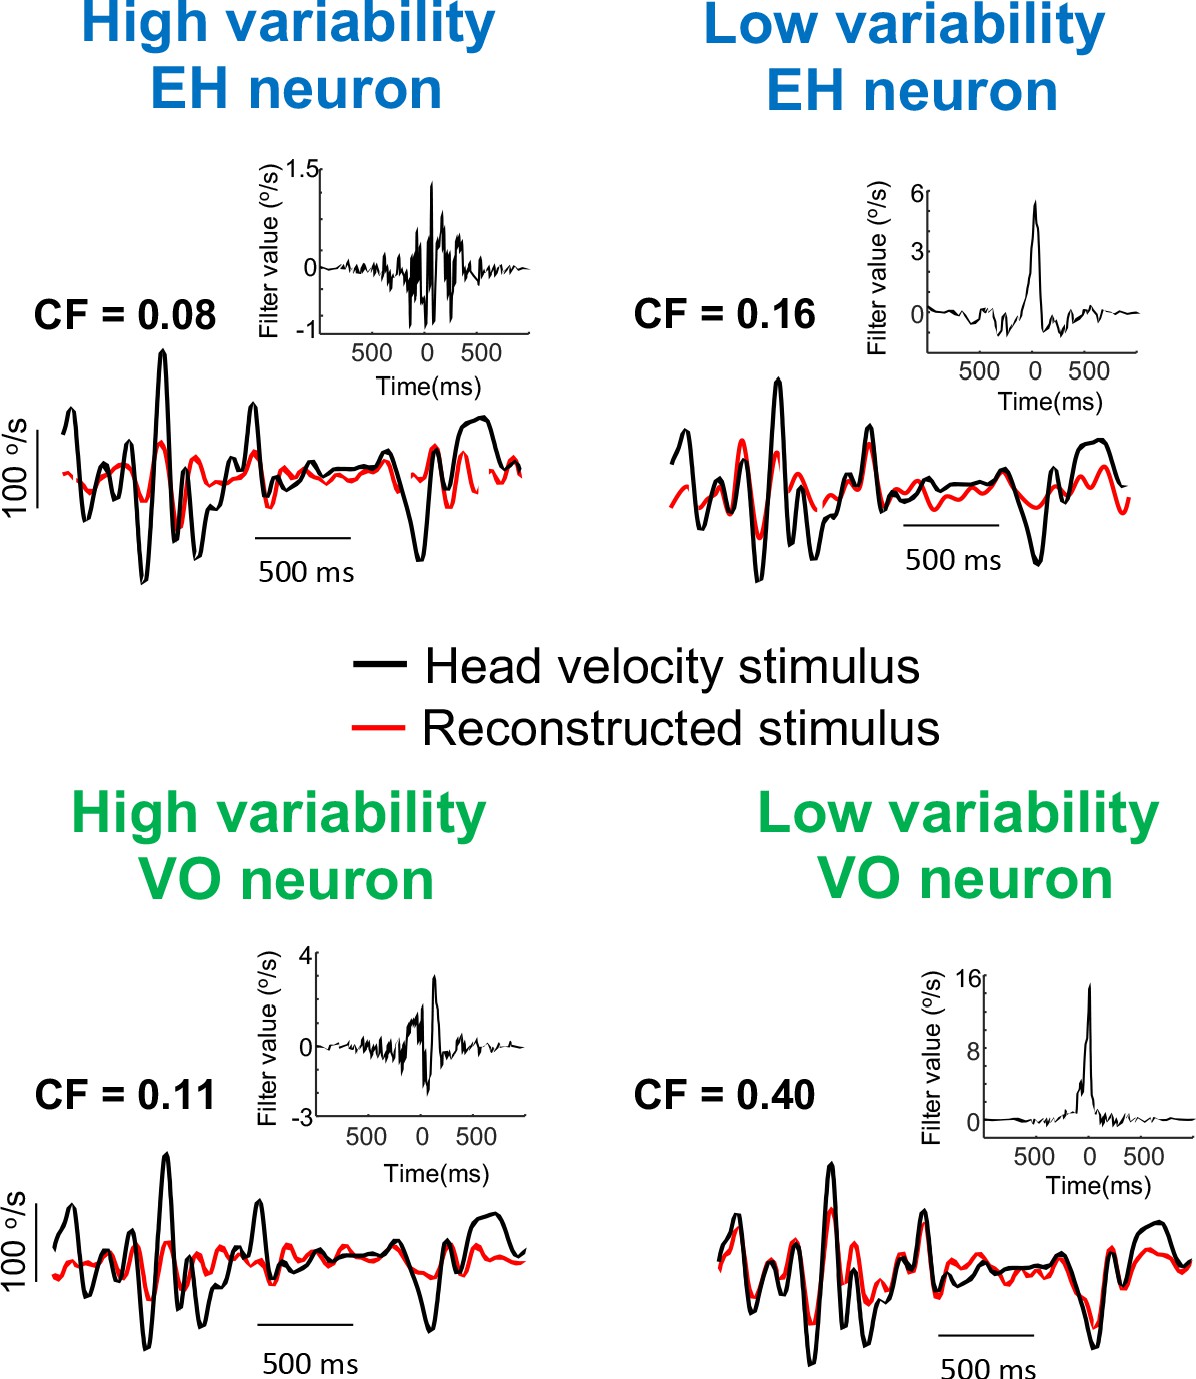
Effects of variability on stimulus reconstruction for EH and PVP neurons.
Original (black) and reconstructed (red) stimuli from the same example EH (left) and VO (right) neurons shown in Figure 1 with high (top) and low (bottom) variability. The insets show the optimal kernel for each example neuron. For the EH neurons, the gaps in the reconstructed indicate segments during vestibular quick phases which were not used for the reconstruction.
Figure 3—figure supplement 2
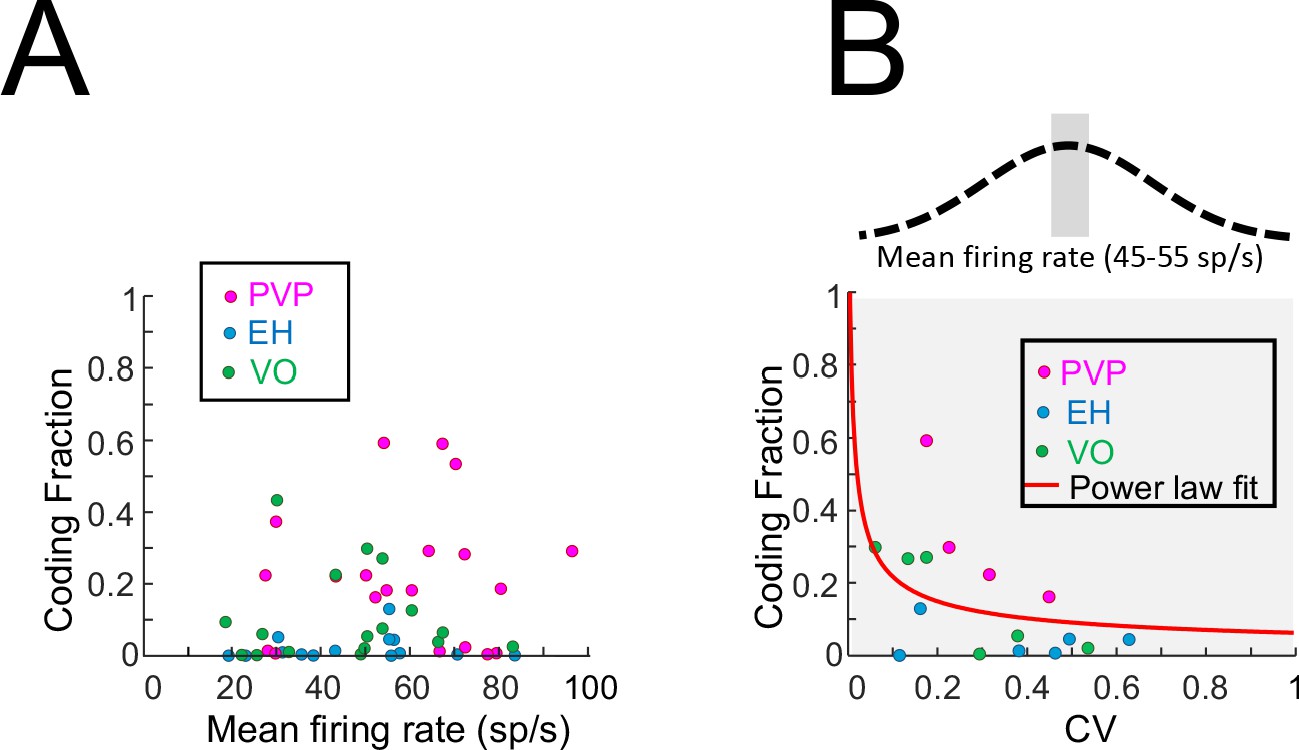
Effects of firing rate on coding fraction.
(A) Coding fraction as a function of the resting discharge firing rate for PVP (magenta), EH (blue) and VO (green) neurons. No significant correlation was observed (PVP: R = 0.05, p=0.82; EH: R = 0.01, p=0.96; VO: R = −0.06, p=0.81; All data: R = 0.13, p=0.34). (B) Coding fraction as a function of CV for PVP (magenta), EH (blue) and VO (green) neurons whose firing rates were between 45 sp/s and 55 sp/s. A significant negative correlation was observed on the log-transformed data (PVP: R = −0.96, p=0.03; EH: R = −0.20, p=0.7; VO: R = −0.87,p=0.02; All data: R = −0.54, p=0.03). Also shown is the best power law fit (red line).
Figure 4 with 3 supplements
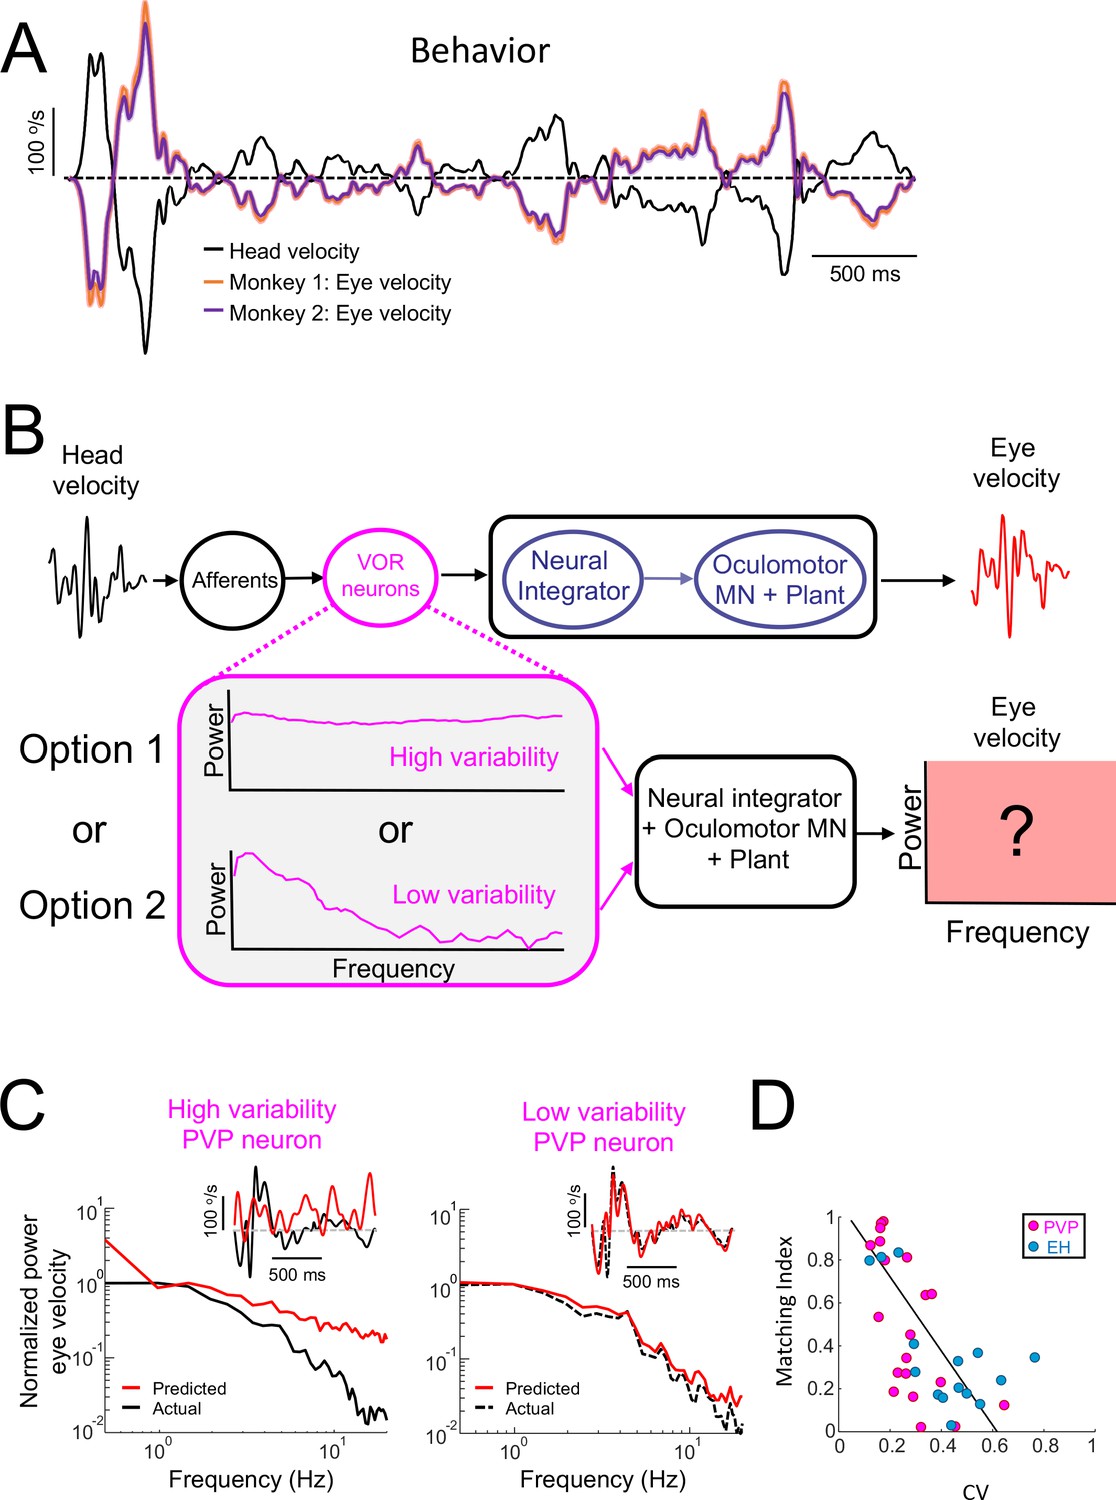
Central VOR neurons (i.e., PVP and EH) with low variability are necessary to properly generate compensatory VOR eye movements.
(A) Head (black) and trial-averaged eye (orange and purple) velocity traces during naturalistic self-motion stimulation for the two animals used in this study. Activity during saccades were not included in the averaging. VOR gain values for both animals were close to unity (VOR gain for monkey 1 = 0.95 ± 0.14; VOR gain for monkey 2 = 0.90 ± 0.12). (B) Top: schematic showing VOR pathways. VOR neurons receive input from peripheral afferents that respond to head movement input and project to the neural integrator as well as extraocular motoneurons ("MN") and the oculomotor plant which generates compensatory eye movements. Bottom: We used the spiking activities from both high ("option 1") and low ("option 2") variability VOR neurons as inputs to the neural integrator and oculomotor plant in order to generate predicted eye movements (red box) that were compared with actual eye movement. (C) Predicted (red) and actual (black) power spectra of eye velocity when the input is from a neuron with high (left) and low (right) variability. The insets show the corresponding time series where the dashed gray lines indicate zero velocity. (D) The matching index was negatively correlated with CV (all data: R = −0.65, p=2.9×10⁻⁵; PVP: R = −0.64, p=2.4×10⁻³; EH: R = −0.64, p=0.01).
Figure 4—figure supplement 1
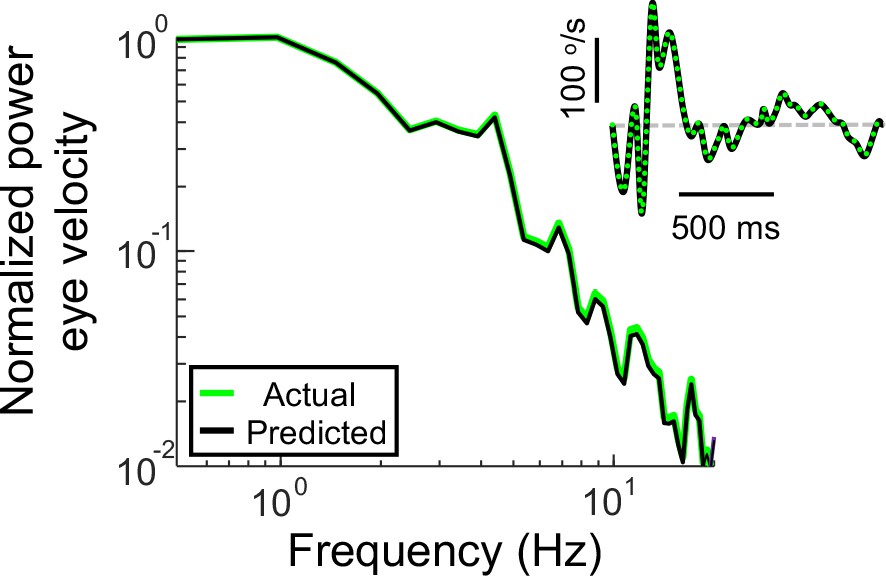
Power spectra of the recorded eye velocity (light green) and that predicted from the full VOR model (black) when the recorded head velocity is used as input.
The inset shows the corresponding time series and the dashed gray line indicates zero velocity.
Figure 4—figure supplement 2
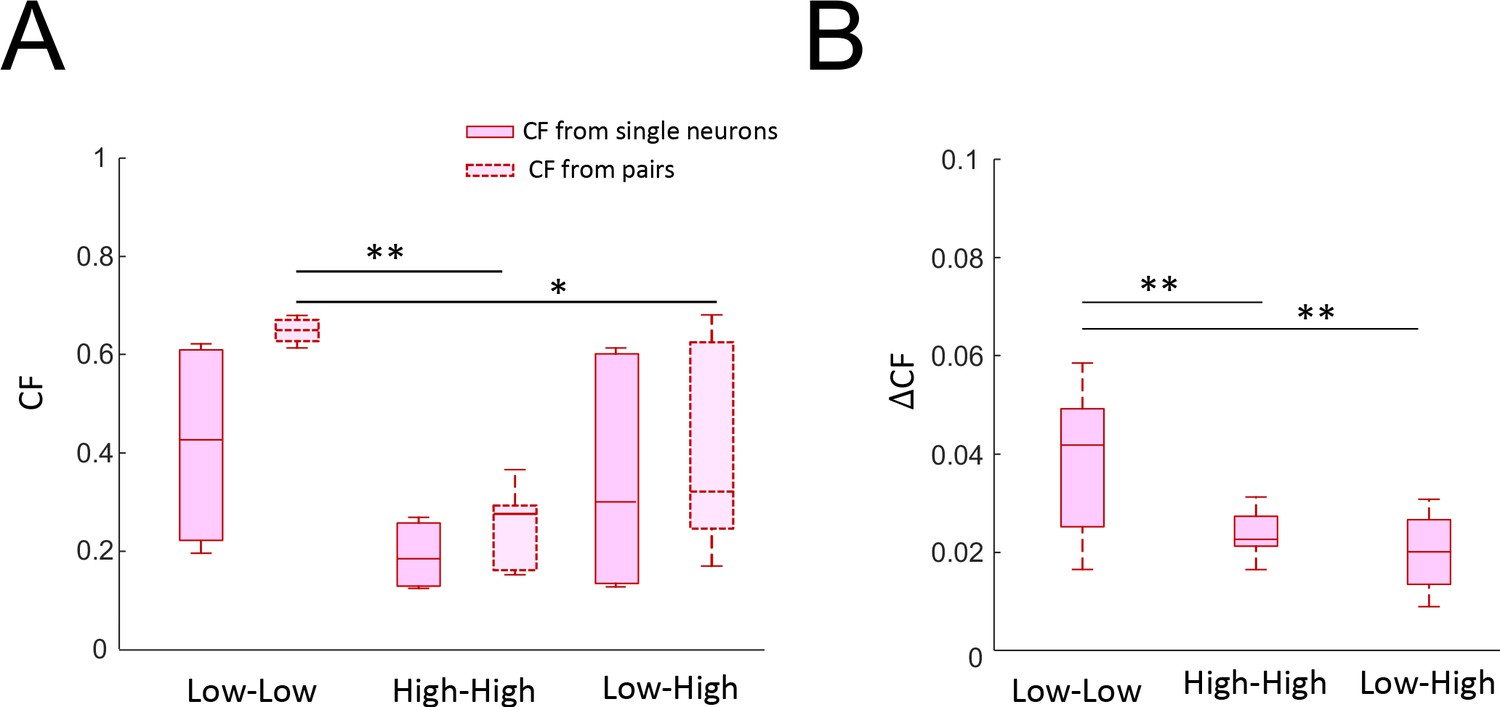
Effects of variability on coding accuracy of neuron pairs.
(A) Population-averaged coding fraction (left) and pair-averaged coding fraction (right) when considering neurons with low variability (left), high variability (middle), or a mix of the two (right). The coding fraction from low variability pairs was significantly higher than that obtained from pairs consisting of one low and one high variability neuron as well as that obtained from high variability pairs (ANOVA, F(2,43) = 6.27, p=0.004). (B) Pair-averaged change in coding fraction when considering neurons with low variability (left), high variability (middle), or a mix of the two (right). The change in coding fraction from low variability pairs was significantly higher than that obtained from both other groups (ANOVA, F(2,43) = 11.6, p=1×10⁻⁴).
Figure 4—figure supplement 3
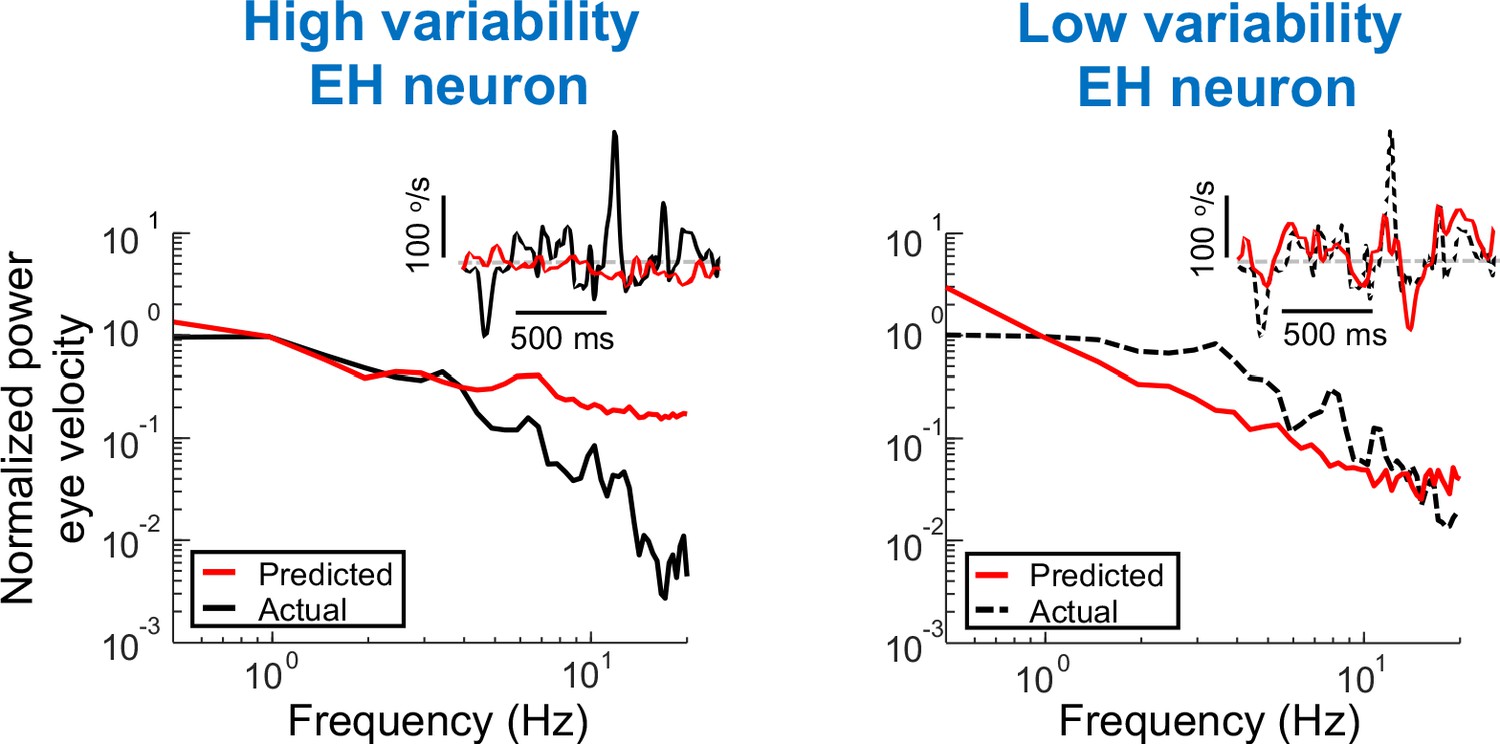
Using the power spectra of EH neuron as input in order to generate predictions of the eye velocity.
Predicted (red) and actual (black) power spectra of eye velocity when the input is from a neuron with high (left) and low (right) variability. Insets: Time series of predicted and actual eye velocity. The dashed gray line indicates zero velocity.
Additional files
Download links
A two-part list of links to download the article, or parts of the article, in various formats.
Downloads (link to download the article as PDF)
Open citations (links to open the citations from this article in various online reference manager services)
Cite this article (links to download the citations from this article in formats compatible with various reference manager tools)
Neural variability determines coding strategies for natural self-motion in macaque monkeys
eLife 9:e57484.
https://doi.org/10.7554/eLife.57484


