Molecular basis for N-terminal alpha-synuclein acetylation by human NatB
- Department of Chemistry, University of Pennsylvania, United States
- Abramson Family Cancer Research Institute, Perelman School of Medicine, University of Pennsylvania, United States
- Department of Biochemistry and Biophysics, Perelman School of Medicine, University of Pennsylvania, United States
Figures
Figure 1

hNatB is active toward an α-Synuclein peptide and can be inhibited by a CoA-αSyn conjugate.
(A) Gel filtration elution profile of hNatB, using a Superdex S200 column. Coomassie-stained SDS-PAGE of peak fractions is reproduced to the right of the chromatograms. (B) Comparison of hNatB activity toward different peptide substrates. All the activities are normalized to the activity of hNatB toward αSyn peptide (MDVF). (C) The dose-response curve corresponding to the titration of CoA-αSyn conjugate (CoA-MDVFMKGLSK) into hNatB acetyltransferase reactions. The calculated IC50 value is indicated. Reactions were performed in triplicate; replicates are shown in the graph as vertical dots.
Figure 2 with 4 supplements

hNatB shows structural differences with hNatA and C.albicans NatB.
(A) hNaa20 (light orange) and hNaa25 (cyan) are shown in cartoon. The CoA-αSyn conjugate inhibitor is shown in sticks and colored as magenta. The N- and C- terminal regions are indicated as ‘N-region’ and ‘C-region’, respectively. Some helices are as labeled. (B) hNaa20 (light orange) and hNaa25 (cyan) are shown overlapped with hNatA (marine blue, PDB: 6C9M). Small molecule IP6 bound to hNatA is shown as surface representation (red). (C) hNaa20 (light orange) and hNaa25 (cyan) are shown superimposed on CaNatB (slate blue, PDB:5K04).
Figure 2—figure supplement 1

Cryo-EM workflow and resolution of hNatB map.
(A) 2D and 3D classification scheme for hNatB EM map determination. (B) Local resolution map of hNatB. (C) Gold standard Fourier shell correlation (FSC) curve of hNatB EM map 3D reconstruction. (D) FSC curves of the refined model versus the overall map that it was refined against (brown); of the model refined in the first of the two independent maps used for the gold-standard FSC versus that same map (green); and of the model refined in the first of the two independent maps versus the second independent map (red).
Figure 2—figure supplement 2
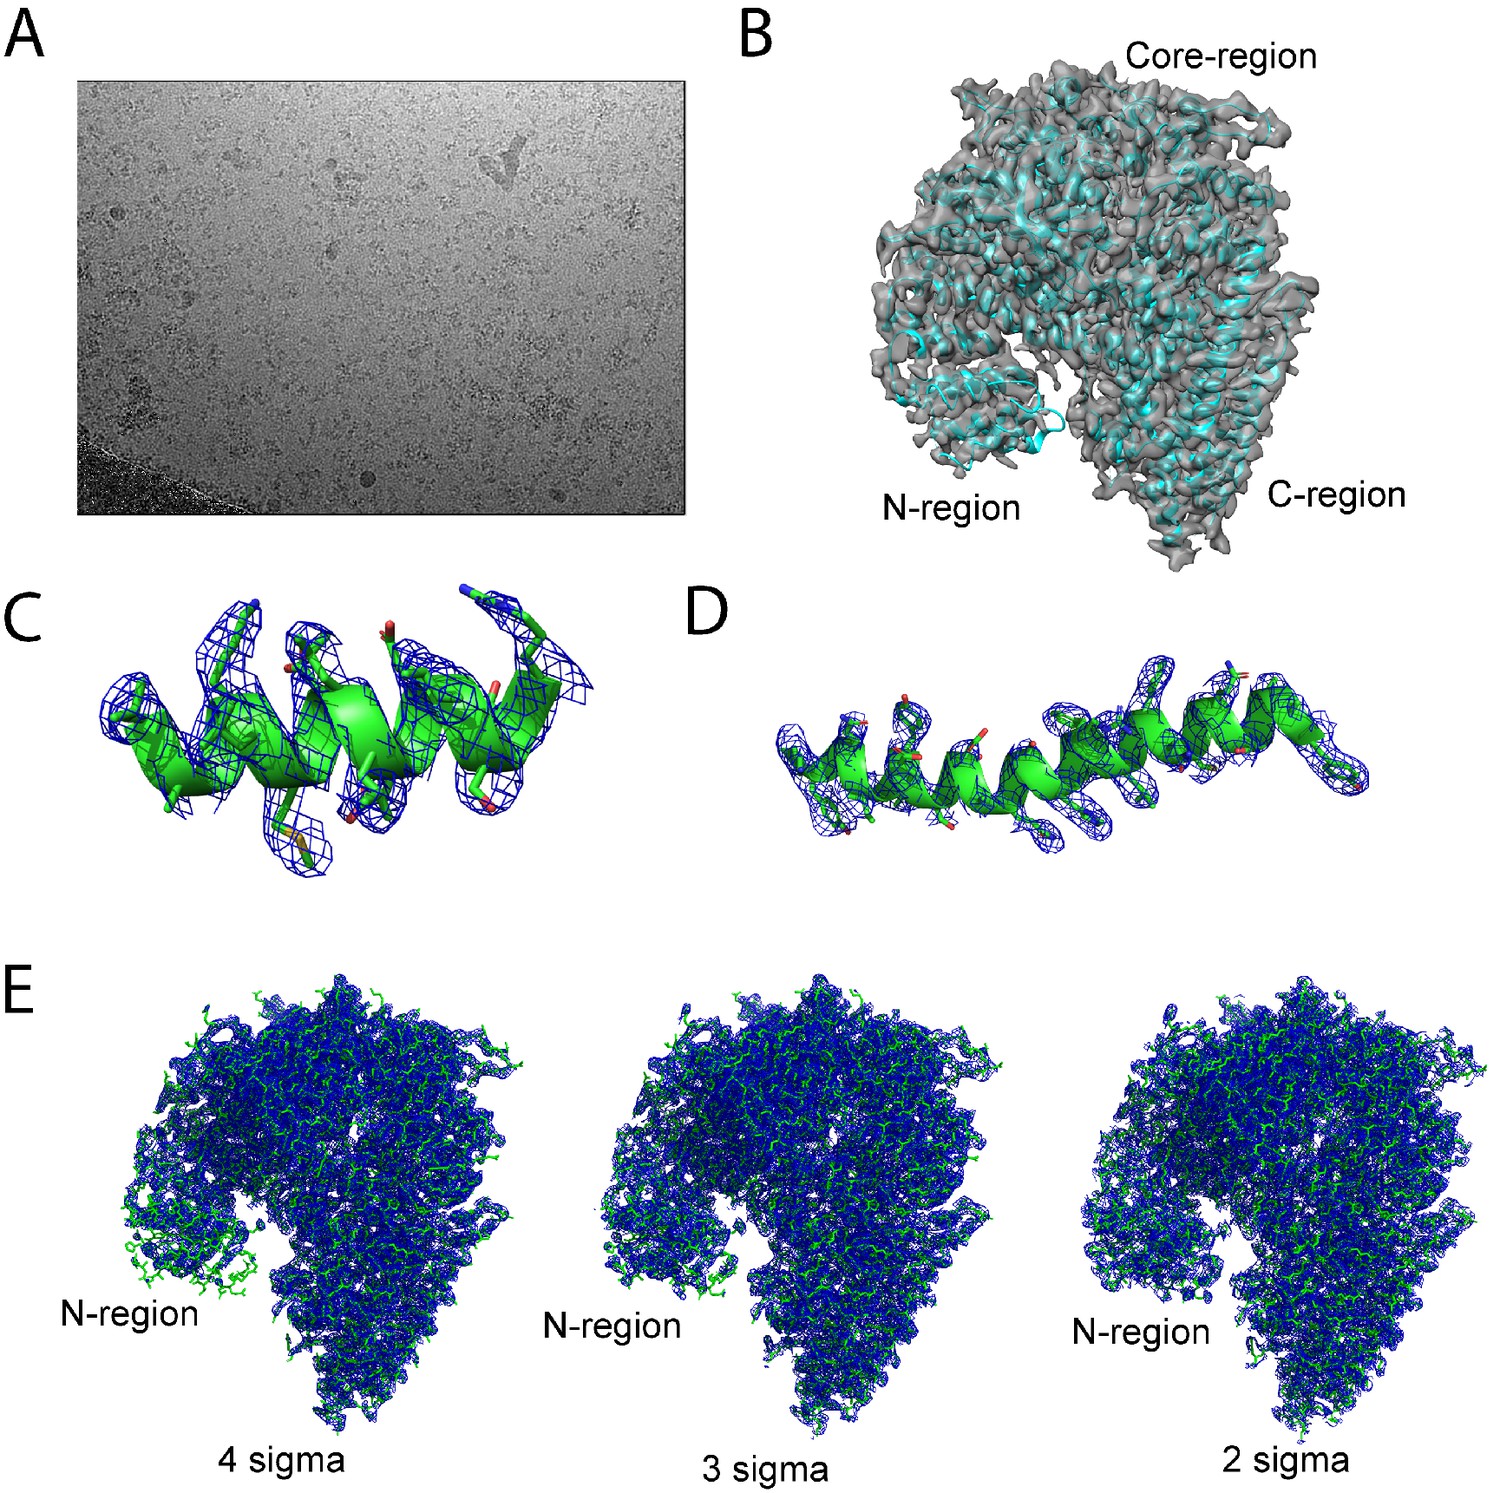
Representative micrograph of hNatB cryo-images and hNatB model fit-in map.
(A) A representative micrograph of a hNatB frozen grids hole (B) Atomic model of hNatB fitted into the Cryo-EM map. (C) The fit of a helical segment from hNAA20 in the EM density. The contour level is 5 sigma. (D) The fit of a helical segment from hNAA25 in the EM density. The contour level is 5 sigma. (E) The fit of hNatB in the EM density at contour levels of 4 sigma, 3 sigma, and 2 sigma.
Figure 2—figure supplement 3
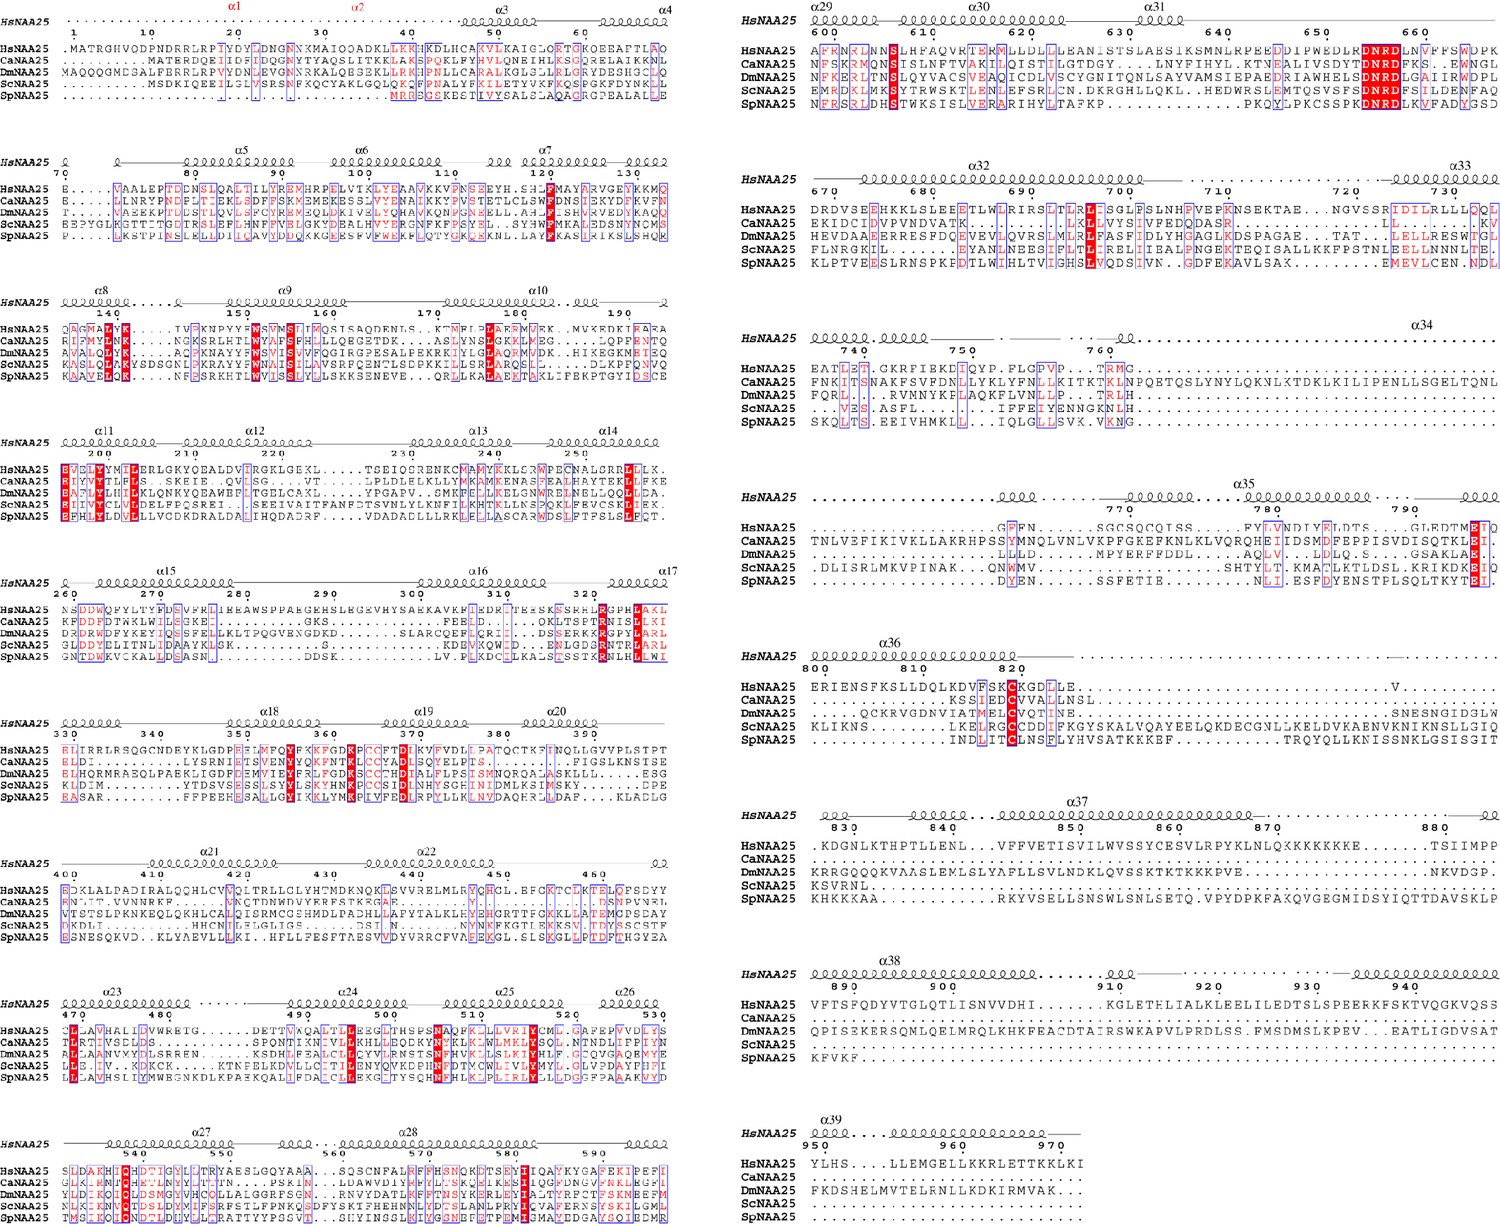
Sequence alignment of NAA25 homologs.
Species include H. sapiens (Hs), C. albicans (Ca), D. melanogaster (Dm), S. cerevisiae (Sc), and S. pombe (Sp).
Figure 2—figure supplement 4
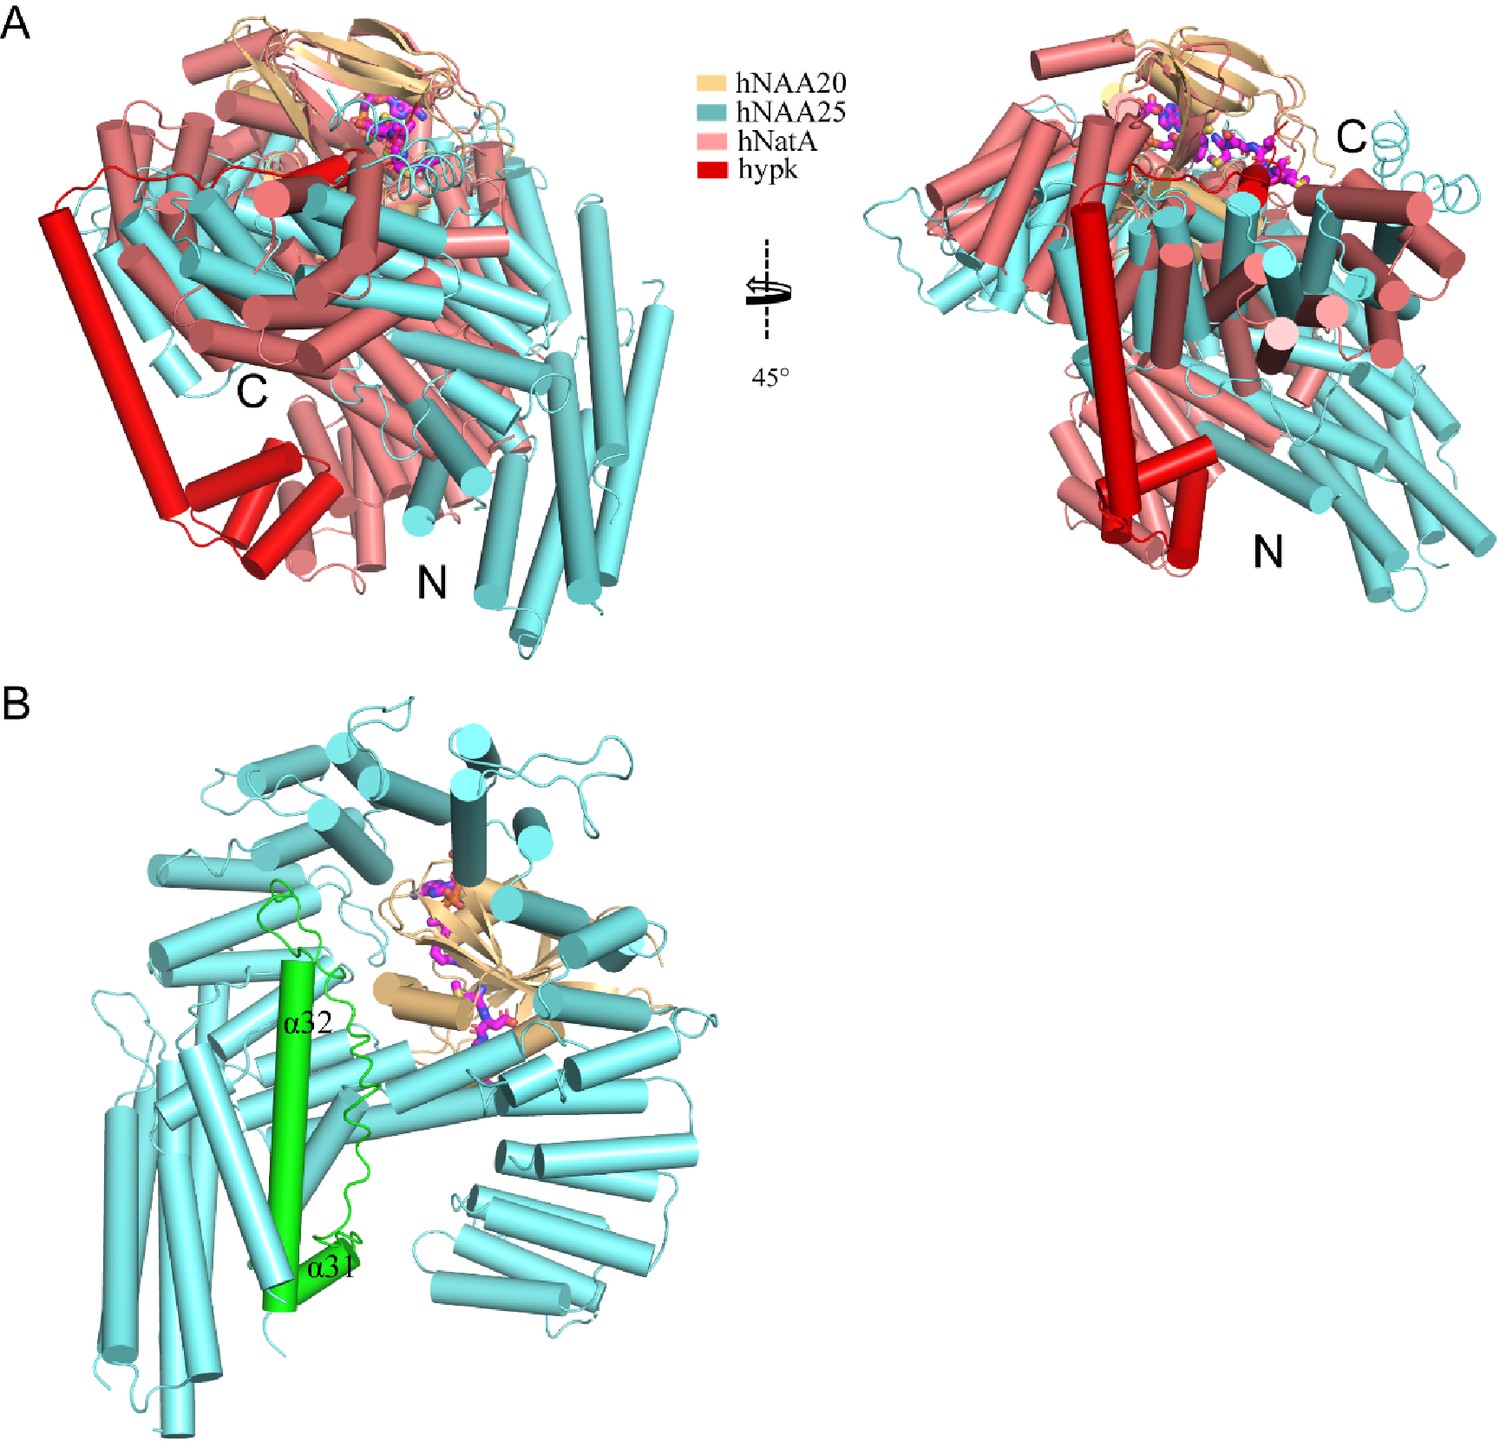
Structural comparison of hNatB and hNatA-HYPK.
(A) hNatB overlaid with hNatA-HYPK. hNatA and HYPK are colored as light salmon and red, respectively. N- and C- termini of the auxiliary subunits are indicated. (B) The extended loop connecting α31 to α32 is highlighted in green in hNatB. This loop is not present in hNatA (not shown).
Figure 3

hNAA20 and hNAA25 make intimate interactions within hNatB.
(A) hNAA20 (light orange) and hNAA25 (cyan) are shown in a cartoon with major associated interface denoted. (B–G) Zoom-in views of the hydrophobic interface regions as indicated in (A).
Figure 4 with 1 supplement
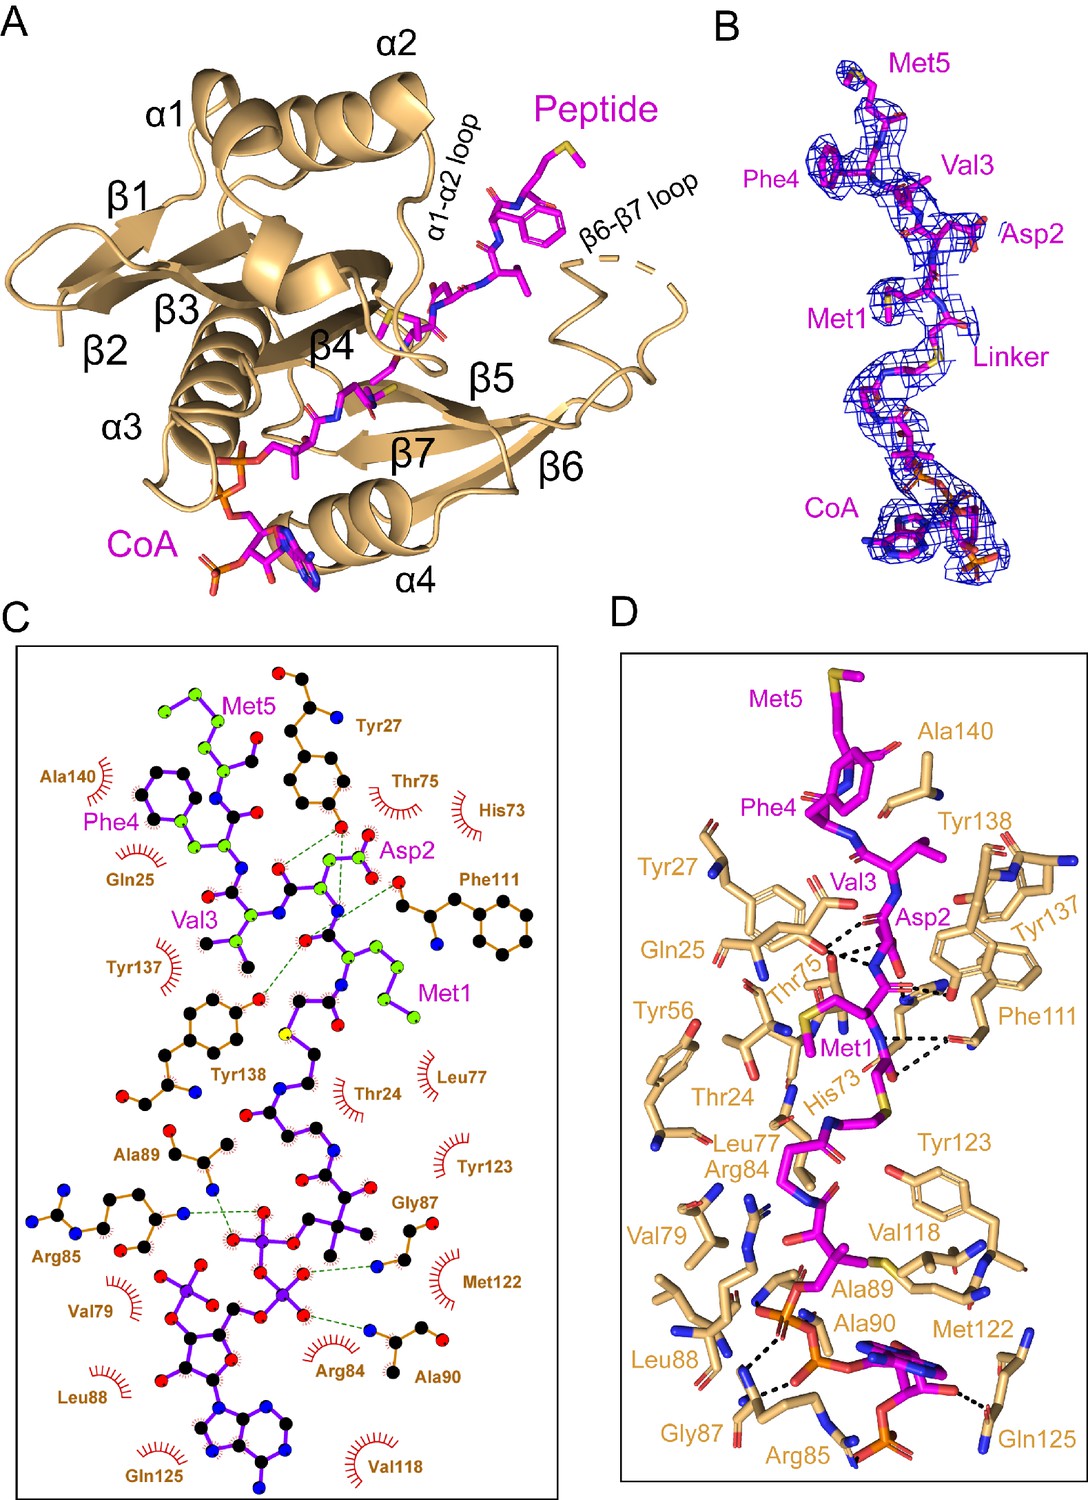
hNAA20 makes key CoA- and substrate peptide-interactions.
(A) The structure of hNAA20 bound to the CoA-αSyn conjugate bound is shown in cartoon with corresponding secondary structures labeled. (B) The fit of the CoA-αSyn conjugate ligand in the EM density map. The contour level is 4.0 sigma. (C) Interaction between CoA-αSyn conjugate and hNAA20 residues is generated with LIGPLOT (Laskowski and Swindells, 2011). Hydrogen bonds are indicated by dashed green lines, and van der Waals interactions are indicated with red semicircles. (D) Highlighted polar and hydrophobic interactions between CoA-αSyn conjugate and the hNAA20 are depicted in the 3D view.
Figure 4—figure supplement 1
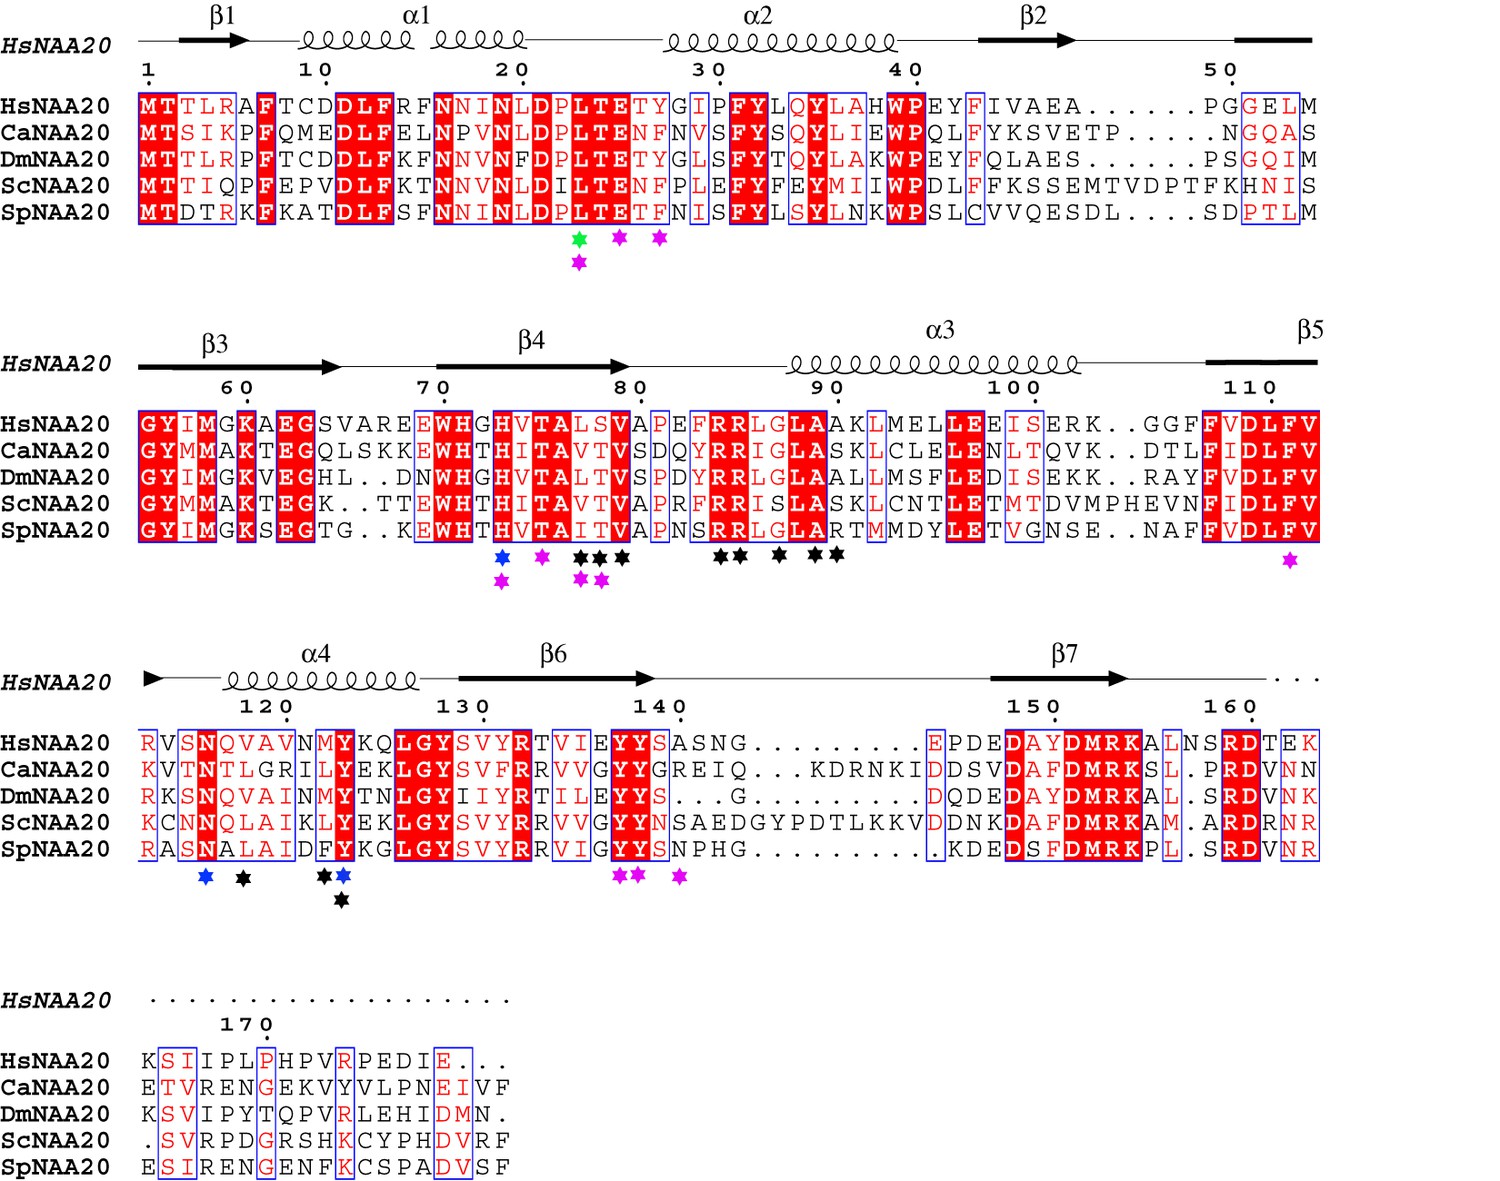
Sequence alignment of NAA20 homologs.
Species depicted include H. sapiens (Hs), C. albicans (Ca), D. melanogaster (Dm), S. cerevisiae (Sc), and S. pombe (Sp). Blue, black and magenta labeled indicate mutation sensitive residues, CoA-binding residues, and peptide-binding residues, respectively.
Figure 5

Structural comparison between hNAA20 and hNAA50.
(A) Bi-substrate inhibitor-bound hNAA20 (light orange) is shown superimposed with hNAA50 (gray, PDB: 3TFY). H73, N116, and Y123 (sticks), mediate important functional roles in hNatB catalysis. (B) Residues forming the Met1 binding pocket of hNAA20 are depicted. (C) Residues forming the Met1 binding pocket of hNAA50 are depicted.
Videos
Video 1
Overall view of the NatB complex.
hNaa20 (light orange) and hNaa25 (cyan) are shown in cartoon. The CoA-αSyn conjugate inhibitor is shown in sticks and colored as magenta.
Video 2
Overall view of α-synuclein N-terminal interactions by NAA20.
Amino acid sidechains that mediate hydrogen bond and van der Waals interactions with α-synuclein are highlighted in a cartoon model of NAA20.
Tables
Table 1
Catalytic parameter of wild-type hNatB and mutants.
| Substrate | Protein | Kcat (min−1) | Kcat (normalized to WT) | Km (μM) | Km (normalized to WT) | Kcat/Km (normalized to WT) |
|---|---|---|---|---|---|---|
| Acetyl-CoA | WT | 9.25 ± 0.29 | 1 | 47.28 ± 5.70 | 1 | 1 |
| MDVF peptide | WT | 7.63 ± 0.14 | 1.0 | 45.08 ± 3.15 | 1.0 | 1.0 |
| E25A | 8.31 ± 0.35 | 1.1 | 39.30 ± 6.62 | 0.87 | 1.3 | |
| Y27A | 16.73 ± 2.11 | 2.2 | 75.03 ± 33.26 | 1.7 | 1.3 | |
| H73A | 0.89 ± 0.14 | 0.12 | 54.76 ± 32.81 | 1.2 | 0.10 | |
| R84A | 13.86 ± 1.75 | 1.8 | 320.8 ± 96.7 | 7.1 | 0.25 | |
| R85A | 18.65 ± 1.02 | 2.4 | 109.6 ± 19.33 | 2.4 | 1.0 | |
| G87A | 14.86 ± 0.56 | 1.9 | 78.16 ± 10.25 | 1.7 | 1.1 | |
| N116A | 0.90 ± 0.06 | 0.12 | 39.86 ± 11.84 | 0.88 | 0.14 | |
| Y123A | 0.34 ± 0.03 | 0.045 | 9.04 ± 3.81 | 0.20 | 0.23 | |
| Y123F | 0.94 ± 0.06 | 0.12 | 42.43 ± 11.52 | 0.94 | 0.13 | |
| Y137A | 6.43 ± 0.23 | 0.84 | 53.67 ± 9.63 | 1.2 | 0.70 | |
| Y138A | 3.09 ± 0.25 | 0.40 | 44.23 ± 13.87 | 0.98 | 0.41 |
Table 2
Cryo-EM data collection, refinement, and validation statistics.
| hNatB/CoA-αSyn complex EMD-21307 PDB: 6VP9 EMPIAR-10477 | |
|---|---|
| Data collection and processing | |
| Magnification | 105,000 |
| Voltage (keV) | 300 |
| Electron exposure (e/Å2) | 40 |
| Defocus range (μm) | −1.5 to −2.5 |
| Pixel size (Å) | 0.83 |
| Symmetry imposed | C1 |
| Initial particles (no.) | 1,927,675 |
| Final particles (no.) | 982,420 |
| Map resolution (Å) | 3.46 |
| FSC threshold | 0.143 |
| Map resolution range (Å) | 2.5–4.5 |
| Refinement | |
| Initial model used (PDB code) | - |
| Model resolution (Å) | 3.5 |
| FSC threshold | 0.5 |
| Model resolution range (Å) | - |
| Map sharpening B factor (Å2) | −191.177 |
| Model composition | |
| Non-hydrogen atoms | 8611 |
| Protein residues | 1077 |
| Ligands | 2 |
| B factors (Å2) | |
| Protein | 2.51/84.68/33.39 |
| Ligand | 17.07/19.91/19.74 |
| R.M.S. deviations | |
| Bonds lengths (Å) | 0.011 |
| Bond angles (°) | 1.105 |
| Validation | |
| MolProbity score | 1.73 |
| Clash score | 3.98 |
| Poor rotamers (%) | 0.55 |
| Ramachandran plot | |
| Favored (%) | 90.10 |
| Allowed (%) | 9.71 |
| Disallowed (%) | 0.19 |
Key resources table
| Reagent type (species) or resource | Designation | Source or reference | Identifiers | Additional information |
|---|---|---|---|---|
| Recombinant DNA reagent | pFASTBac HTA-hNAA20(1-163) (plasmid) | This paper | Protein expression plasmid for hNAA20 (in Sf9 cells) and found in the Materials and methods section of this paper | |
| Recombinant DNA reagent | pFASTBac HTA-6HIS-TEV-hNAA25(1-972) (plasmid) | This paper | Protein expression plasmid for hNAA25 (in Sf9 cells) and found in the Materials and methods section of this paper | |
| Cell line (Spodoptera frugiperda) | Sf9 cells | ThermoFisher | cat #12659017 | For protein expression |
| Peptide, recombinant protein | MVDF peptide | GenScript | NH2-MDVFMKGRWGRPVGRRRRP-COOH | |
| Peptide, recombinant protein | ‘SASE’ peptide | GenScript | NH2-SASEAGVRWGRPVGRRRRP-COOH | |
| Peptide, recombinant protein | ‘MLGP’ peptide | GenScript | NH2-MLGPEGGRWGRPVGRRRRP-COOH | |
| Peptide, recombinant protein | ‘SGRG’/H4 peptide | GenScript | NH2-SGRGKGGKGLGKGGAKRHR-COOH | |
| Peptide, recombinant protein | ‘MLRF’ peptide | GenScript | NH2-ML RFVTKRWGRPVGRRRRP-COOH | |
| Peptide, recombinant protein | ‘DVFM’ peptide | GenScript | NH2-DVFMKGLRWGRPVGRRRRP-COOH | |
| Peptide, recombinant protein | ‘VFMK’ peptide | GenScript | NH2-VFMKGLSRWGRPVGRRRRP-COOH | |
| Other | [14C] Acetyl-CoA (4 mCi/mmol) | PerkinElmer Life Sciences | Cat#NEC313050UC | |
| Other | P81 Phosphocellulose squares | EMD Millipore | Cat#20–134 | |
| Software, algorithm | RELION | Zivanov et al., 2018 | ||
| Software, algorithm | MotionCor2 | Zheng et al., 2017 | ||
| Software, algorithm | COOT | Emsley and Cowtan, 2004 | ||
| Software, algorithm | PHENIX | Adams et al., 2010 | ||
| Software, algorithm | ResMap | Kucukelbir et al., 2014 | ||
| Software, algorithm | Gctf | Zhang, 2016 | ||
| Software, algorithm | Prism 5.0 | GraphPad | ||
| Software, algorithm | PyMOL | Schrodinger LLC |
Additional files
-
Supplementary file 1
Sequence of primers for preparing mutants.
Both the forward and reverse primers for each mutant is indicated.
- https://cdn.elifesciences.org/articles/57491/elife-57491-supp1-v2.docx
-
Transparent reporting form
- https://cdn.elifesciences.org/articles/57491/elife-57491-transrepform-v2.pdf
Download links
A two-part list of links to download the article, or parts of the article, in various formats.
Downloads (link to download the article as PDF)
Open citations (links to open the citations from this article in various online reference manager services)
Cite this article (links to download the citations from this article in formats compatible with various reference manager tools)
Molecular basis for N-terminal alpha-synuclein acetylation by human NatB
eLife 9:e57491.
https://doi.org/10.7554/eLife.57491


