Differential accumulation of storage bodies with aging defines discrete subsets of microglia in the healthy brain
- Multiple Sclerosis & Neurorepair Research Unit, Biogen, United States
- Department of Pharmacology & Experimental Therapeutics, Boston University School of Medicine, United States
- Emerging Neurosciences Research Unit, Biogen, United States
- Chemical Biology and Proteomics, United States
- Multiple Sclerosis Development Unit, Biogen, United States
- Center for Genomic Medicine, Department of Neurology, Massachusetts General Hospital, Harvard Medical School, United States
- Third Rock Ventures, United States
Figures
Figure 1 with 1 supplement
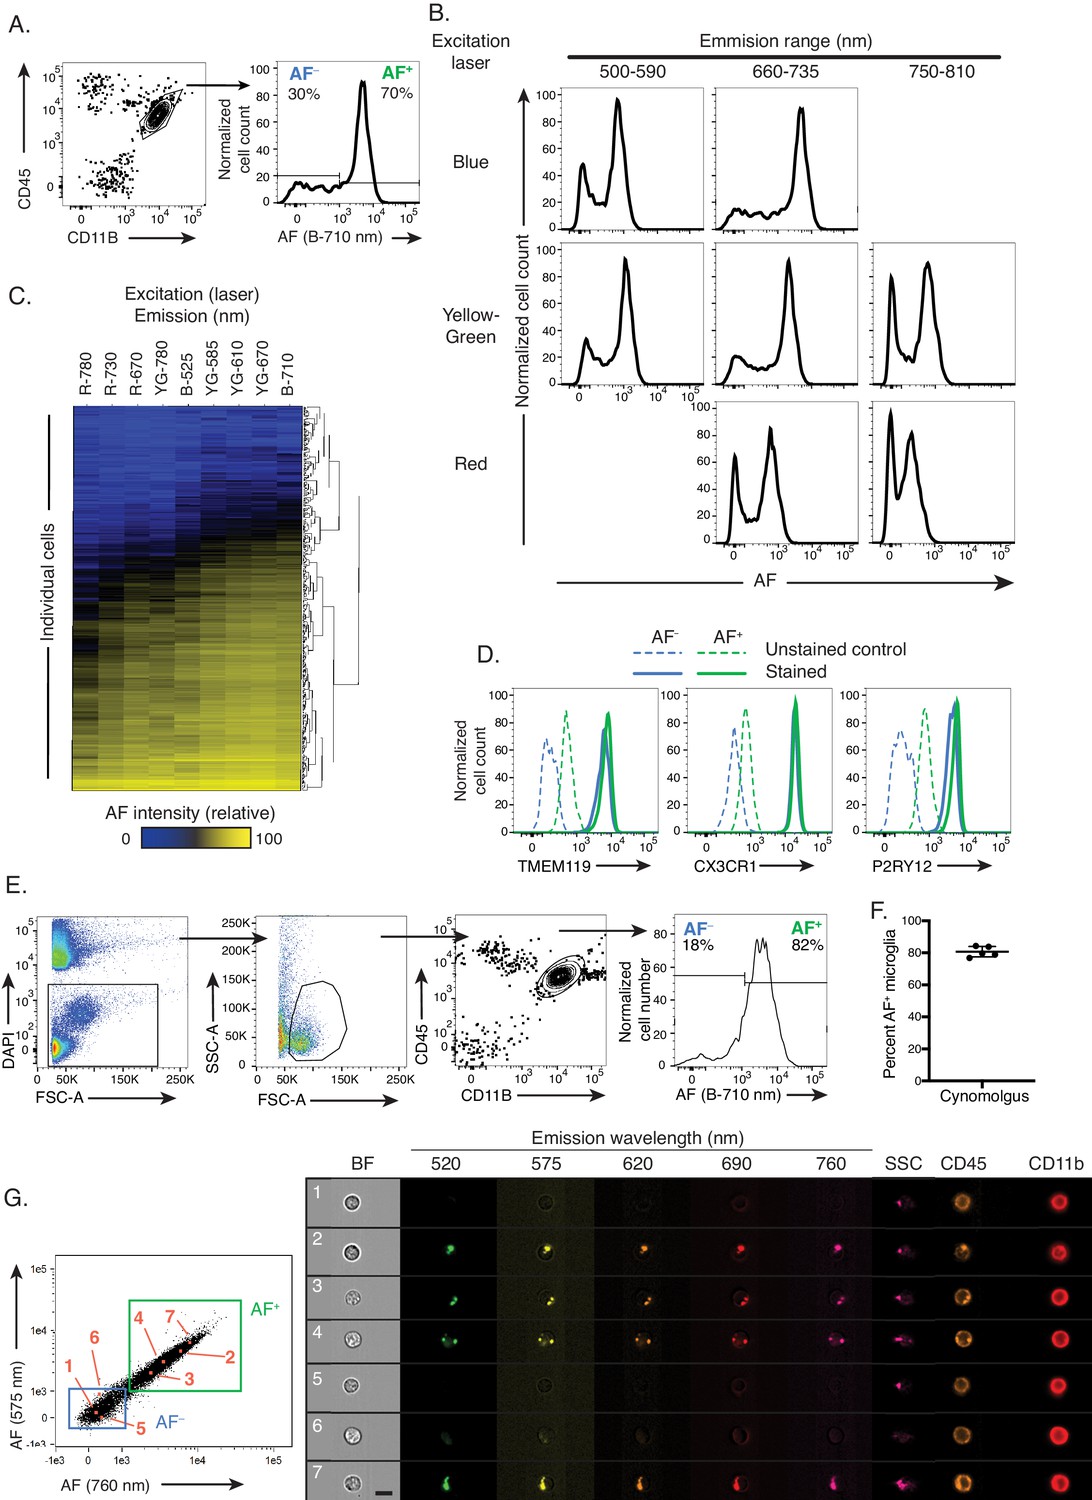
Cellular autofluorescence identifies two discrete and novel microglia subsets.
(A) Representative flow cytometry scatterplot showing CD45 and CD11B surface levels in a brain single cell suspension and histogram of autofluorescence (AF) signal in DAPI− CD45dim CD11B+ microglia detected with a blue laser and 710 nm detector. (B) Representative flow cytometry histograms of AF intensity in the entire microglia population for multiple excitation lasers and emission filters. (C) Heatmap of AF signal detected across multiple cytometer channels (columns) in 500 single microglial cells (rows) and hierarchically clustered by Manhattan distance. (D) Representative flow cytometry histograms of TMEM119, CX3CR1 and P2RY12 surface levels in AF+ and AF− microglia subsets. (E) Representative flow cytometry scatterplots used to identify microglia in brain single cell suspensions from Cynomolgus macaques and representative histogram of AF levels detected in microglia. (F) Quantitation of results presented in (E). (G) Representative scatterplots of AF levels detected in CD45dimCD11B+ microglia and corresponding microscopy images of selected AF+ and AF− cells (highlighted in orange and numbered in the scatterplots and images) analyzed using imaging flow cytometry. Scale bar = 7 μm. (A, B) Representative of n = 12 animals from at least four independent experiments. (D) n = 6 animals from at least two independent experiments. (E, F) n = 5 animals from two independent experiments. B = blue laser, R = red laser, YG = yellow green; AF = autofluorescence; BF = bright field; SSC = side scatter. See also Figure 1—figure supplement 1.
Figure 1—figure supplement 1
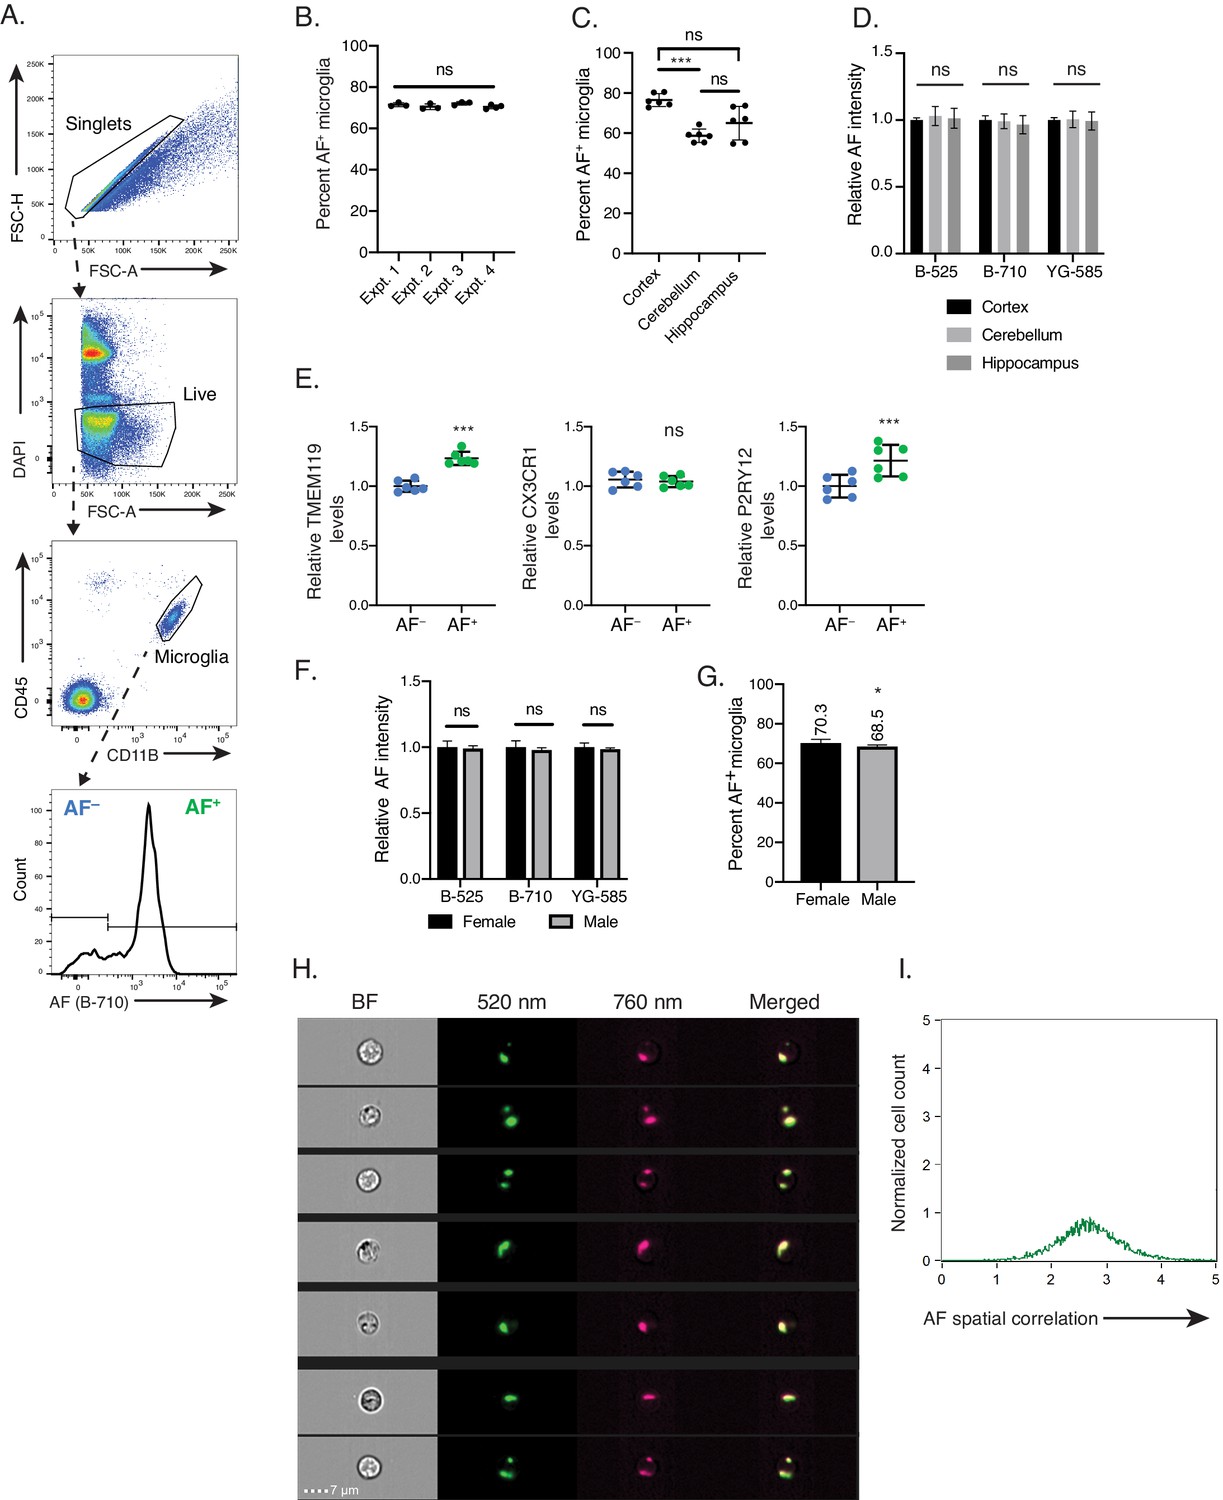
Autofluorescence identifies two discrete microglia subsets across brain regions and in both male and female mice.
Related to Figure 1. (A) Flow cytometry gating strategy used to identify microglia and AF subsets. (B) Percent AF+ microglia detected in 6-month-old mice across multiple independent experiments. Significance established with 1-way ANOVA. n = 3 per experiment. (C) Percent AF+ microglia and (D) relative AF intensity detected in 6 month-old mice from indicated brain regions. n = 6 animals from two independent experiments. Data are presented as the mean ± SD and significance established with (C) Welch ANOVA with Dunnett’s T3 multiple comparisons test post-hoc and (D) 1-way ANOVA. (E) Relative levels of TMEM119, CX3CR1 and P2RY12 in AF+ and AF− microglia subsets calculated as net geometric mean fluorescence intensity after subtraction of background AF signal and normalization to AF− subset. Data are presented as the mean ± SD and significance established with paired t-tests. (F) Relative AF intensity and (G) proportion of AF+ microglia in age-matched male and female mice. Significance established with unpaired Student’s t-test. n ≥ 5 animals per gender from two independent experiments. (H) Representative images of AF signal detected in two flow cytometer channels and overlay of corresponding signals illustrating colocalization of AF signal. (I) Quantification of the colocalization of signal between two AF channels shown in (H), calculated as the log-transformed Pearson’s correlation coefficient. A value of 0 indicates no linear correlation and value of 10 indicates maximal correlation. All data presented as mean ± SD. AF = autofluorescence; FSC = Forward scatter; B = blue laser; YG = yellow green laser. Expt. = experiment; ns = not significant, *p<0.05. ***p<0.001.
Figure 2 with 1 supplement
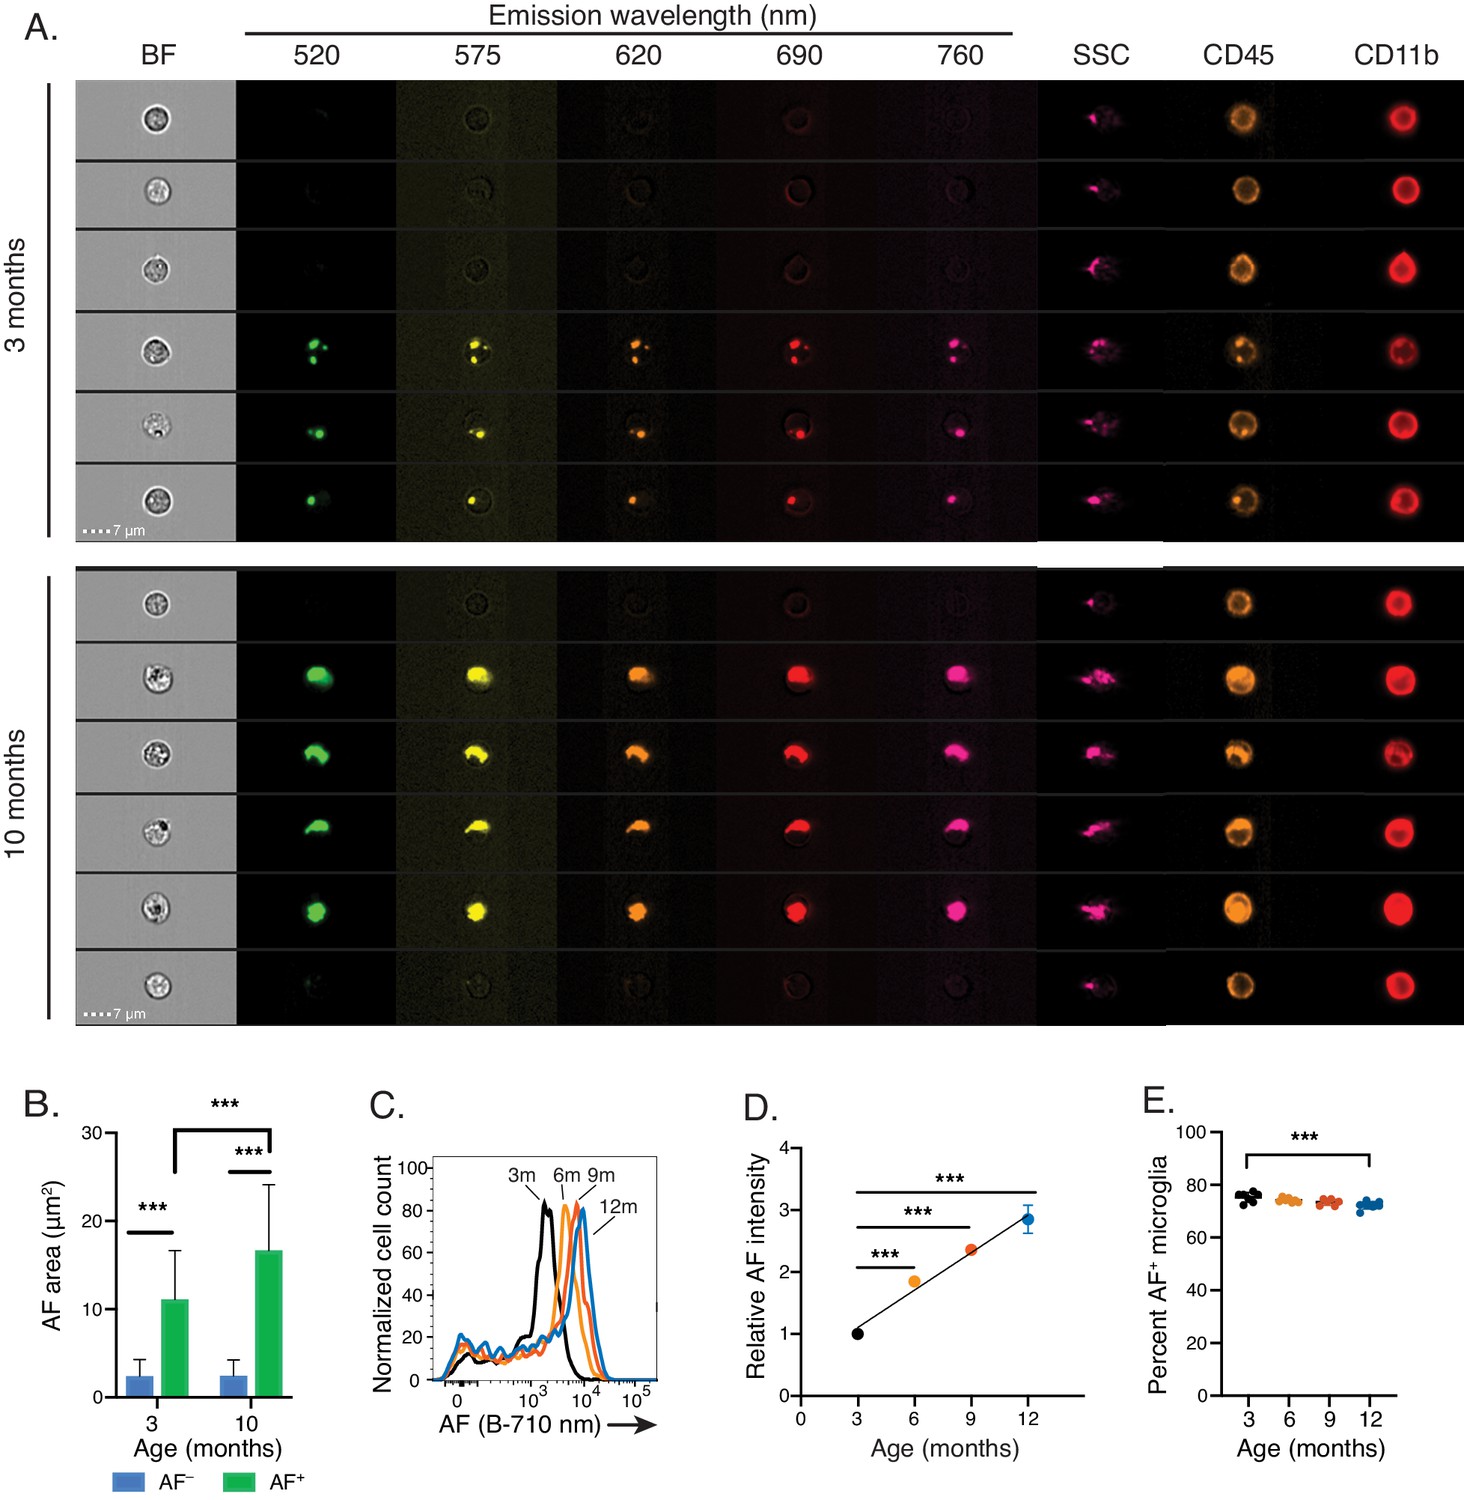
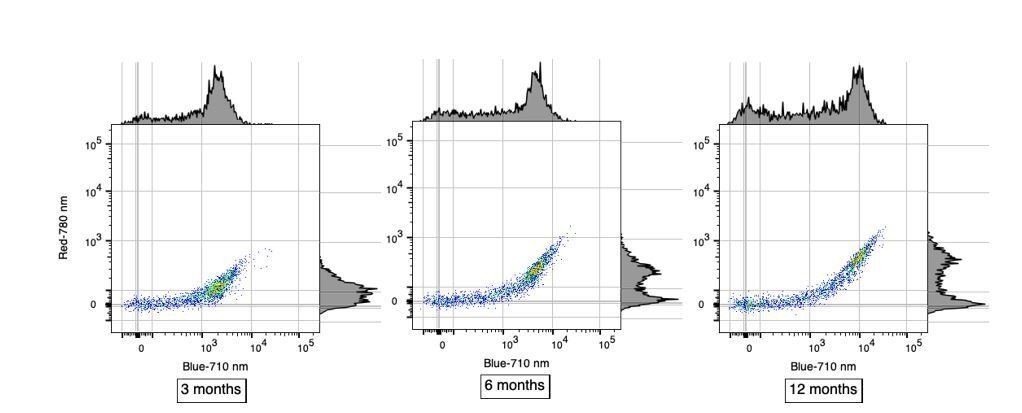
Natural aging increases microglia AF signal intensity solely within AF+ cells.
(A) Representative imaging flow cytometry images and (B) corresponding quantitation of average AF area per cell in AF+ and AF− CD45dimCD11B+ microglia isolated from 3- and 10-month old mice. Significance established with 2-way ANOVA followed by Sidak’s post-hoc correction, n = 4000–8000 cells. (C) Representative flow cytometry histogram and (D) corresponding quantitation of AF intensity in AF+ CD45dim CD11B+ microglia isolated from mice at the indicated ages and presented as normalized values to AF levels observed in 3 month old animals. Significance established with 1-way ANOVA followed by Dunnett’s post-hoc. The line depicts the linear regression (R2 = 0.95). (E) Percent AF+ microglia at indicated ages. Significance established with 1-way ANOVA followed by Dunnett’s post-hoc. All data are presented as mean ± SD. For panels C-E, n ≥ 6 animals per age from at least two independent experiments. BF = bright field, AF = autofluorescence, SSC = side scatter, ***p<0.001. See also Figure 2—figure supplement 1.
Figure 2—figure supplement 1
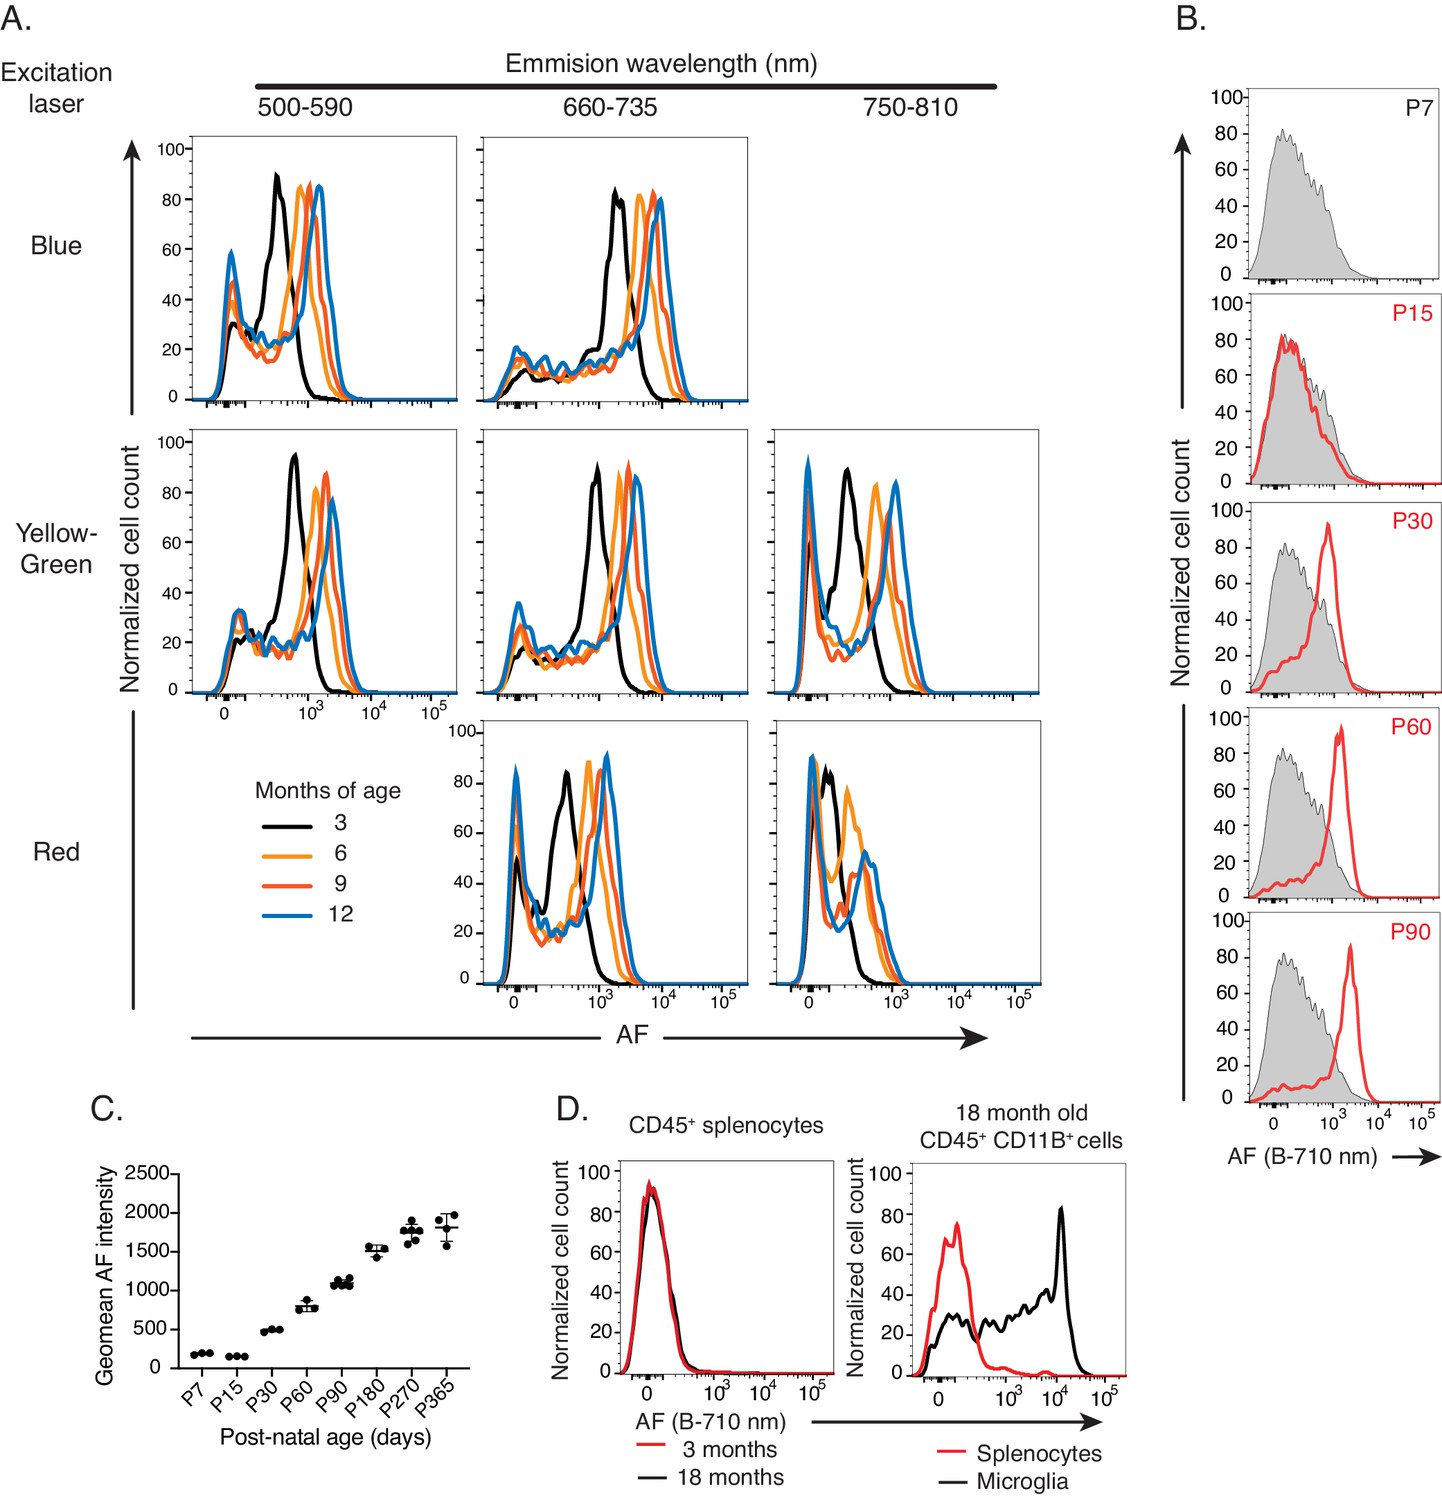
Microglial autofluorescence increases with age in multiple flow cytometry channels and is unique to microglia.
Related to Figure 2C,D. (A) Representative flow cytometry histograms of AF intensity in the entire microglia population for multiple cytometer excitation lasers and emission filter wavelengths overlaying AF signal detected at indicated ages. Representative of n ≥ 6 animals per age group representative of at least two independent experiments. (B) Representative flow cytometry histograms and (C) quantitation of AF intensity detected at the indicated days post-birth. Shaded-grey histogram in overlays is representative of P7 microglia. n ≥ 3 mice per age, one independent experiment. (D) Representative flow cytometry histogram overlays of AF in splenocytes and microglia at the specified ages. n = 3 mice per age, one independent experiment. AF = autofluorescence.
Figure 3
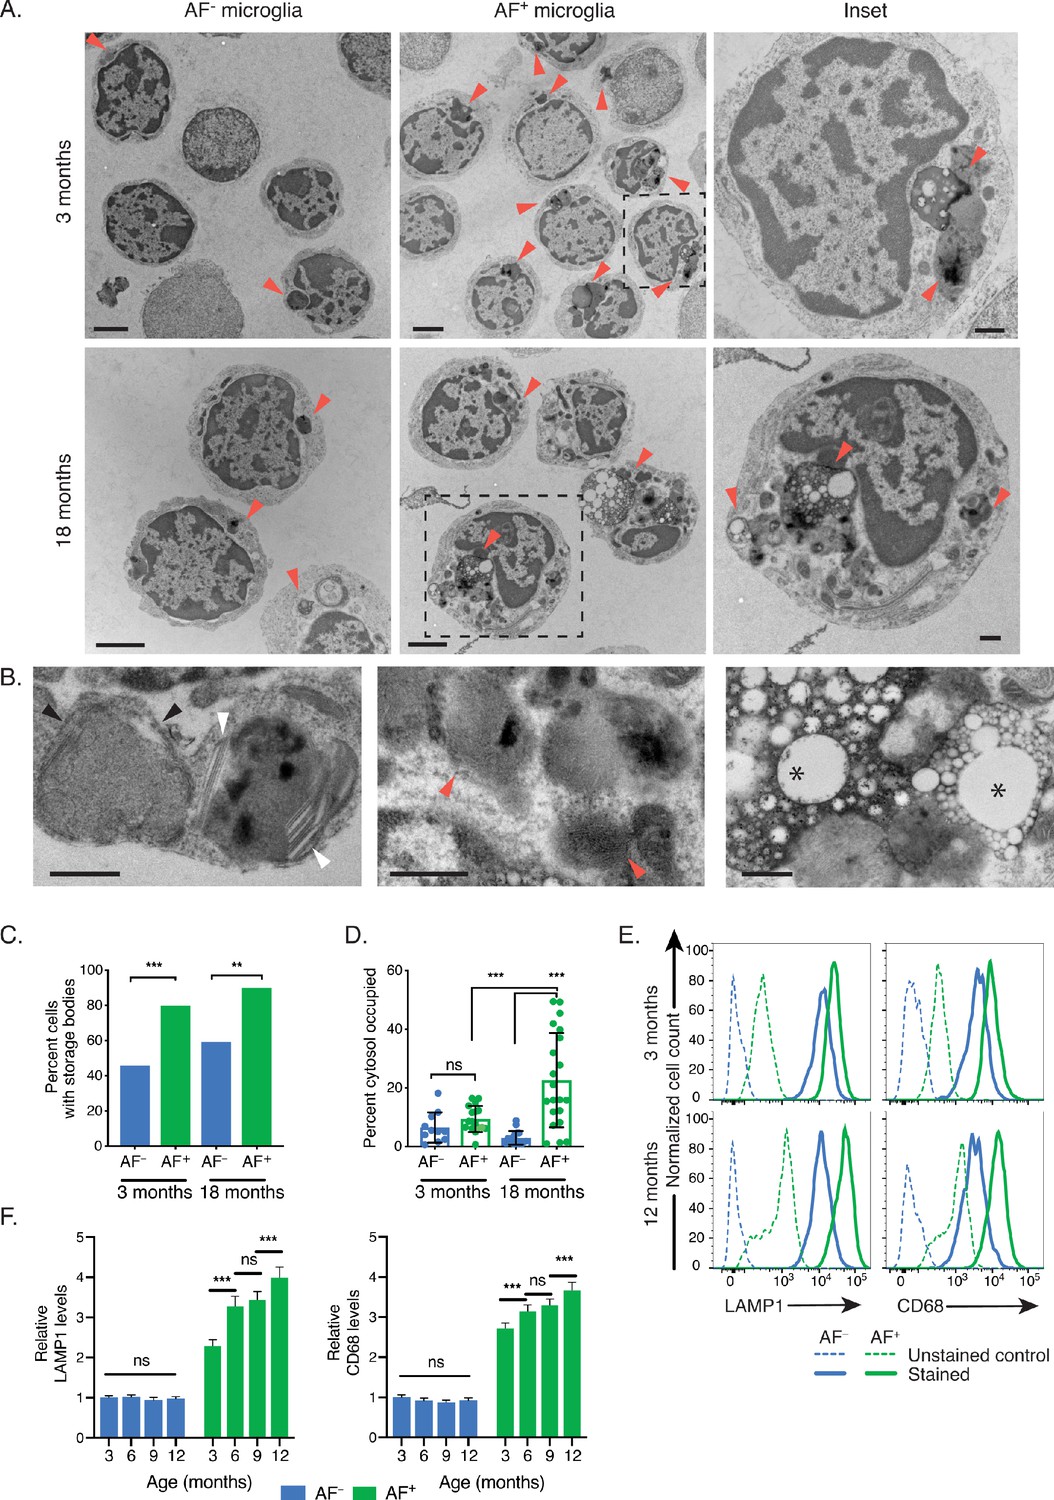
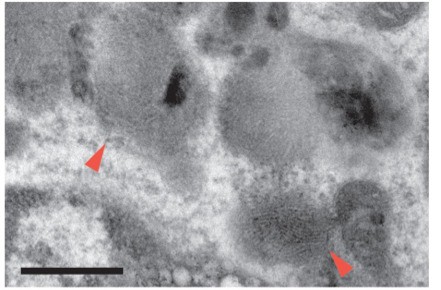
AF+ microglia selectively accumulate intracellular storage bodies with age.
(A) Representative TEM images of sorted microglia subsets from 3- to 18-month-old mice. Red arrowheads point to storage bodies. Scale bars = 2 µm. Insets depict higher magnification images of selected AF+ microglia (dashed square lines). Inset scale bars = 500 nm. (B) Representative TEM images of storage bodies observed within aged AF+ microglia. Black arrowheads, curvilinear storage material; white arrowheads, crystal bodies; red arrows, fingerprint-like storage material; asterisks, lipid storage content. Scale bars = 500 nm. (C) Frequency of cells containing storage bodies in microglia AF subsets sorted and pooled from n = 10 mice at the indicated ages. Significance established with Fischer’s exact test. n = 48–59 cells/group. (D) Average percent of cytosolic area occupied by storage material in cells containing at least one storage body. Significance established with 2-way ANOVA followed by Tukey’s post-hoc. n = 11–21 cells/group. (E) Representative flow cytometry histograms and (F) corresponding quantitation of LAMP1 and CD68 staining in AF− and AF+ subsets at indicated ages. Relative levels of LAMP1 and CD68 calculated as net geometric mean fluorescence intensity after subtraction of background AF signal and normalization to AF intensity detected in the AF− subset at 3 months of age. Significance established with 2-way repeated-measures ANOVA followed by Tukey’s post-hoc. n ≥ 6 animals per age from at least two independent experiments. All data presented as mean ± SD. ns = not significant, **p<0.01 ***p<0.001.
Figure 4 with 1 supplement
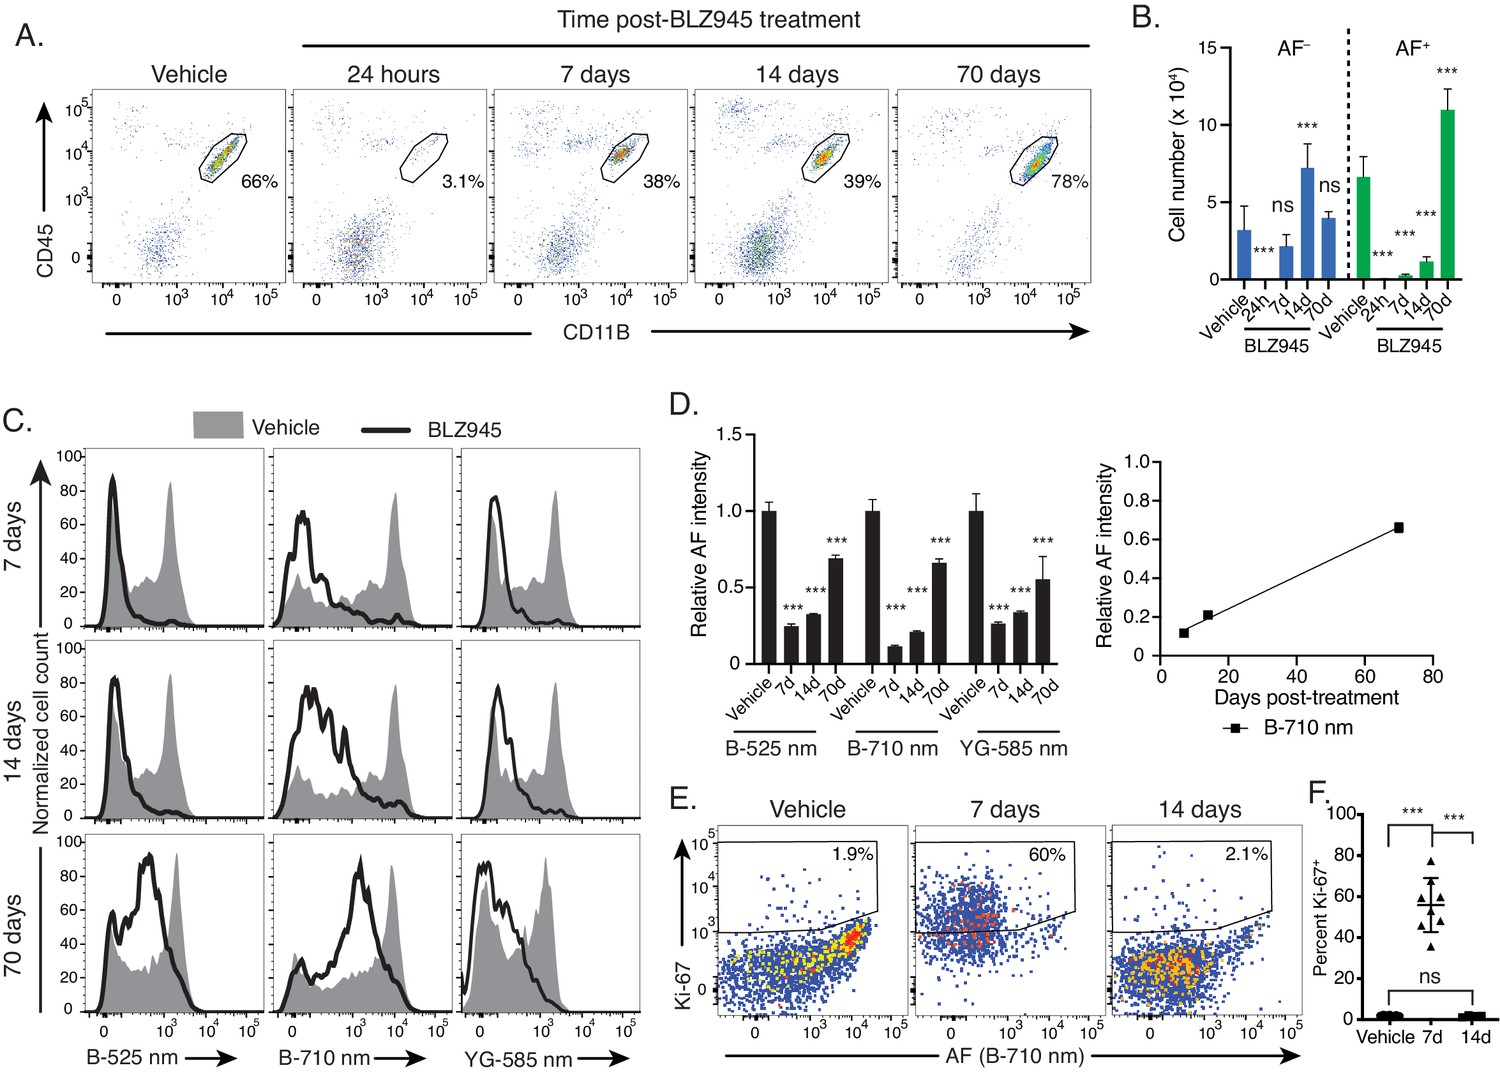
Microglia AF subsets exhibit differential population dynamics upon depletion and replenishment of the microglia niche.
(A) Representative flow cytometry scatterplots showing CD45 and CD11B surface levels in brain single cell suspensions from mice at indicated timepoints post treatment with vehicle or BLZ945 and (B) corresponding quantitation of absolute cell numbers of AF+ and AF− microglia post-treatment. Significance established with 1-way ANOVA followed by Dunnett’s post-hoc test. (C) Representative flow cytometry histograms and (D) corresponding quantitation of AF intensity in the entire microglia population detected across multiple combinations of excitation lasers and emission filters and normalized to levels observed in vehicle-treated mice. In the scatter plot, the line represents the linear regression (R2 = 0.99). Significance established with 1-way ANOVA followed by Dunnett’s post-hoc test for each AF channel. (E) Representative flow cytometry scatterplots depicting KI-67 levels and AF intensity in microglia isolated at indicated time points post-treatment and (F) corresponding quantitation of the percent microglia positive for KI-67. Significance established with Welch’s ANOVA followed by Dunnett’s T3 post-hoc. n ≥ 8 animals per genotype group from at least two independent experiments. All data represented as mean ± SD. d = day; h = hour; B = blue laser; YG = yellow green laser; AF = autofluorescence; ns = not significant, ***p<0.001. See also Figure 4—figure supplement 1.
Figure 4—figure supplement 1
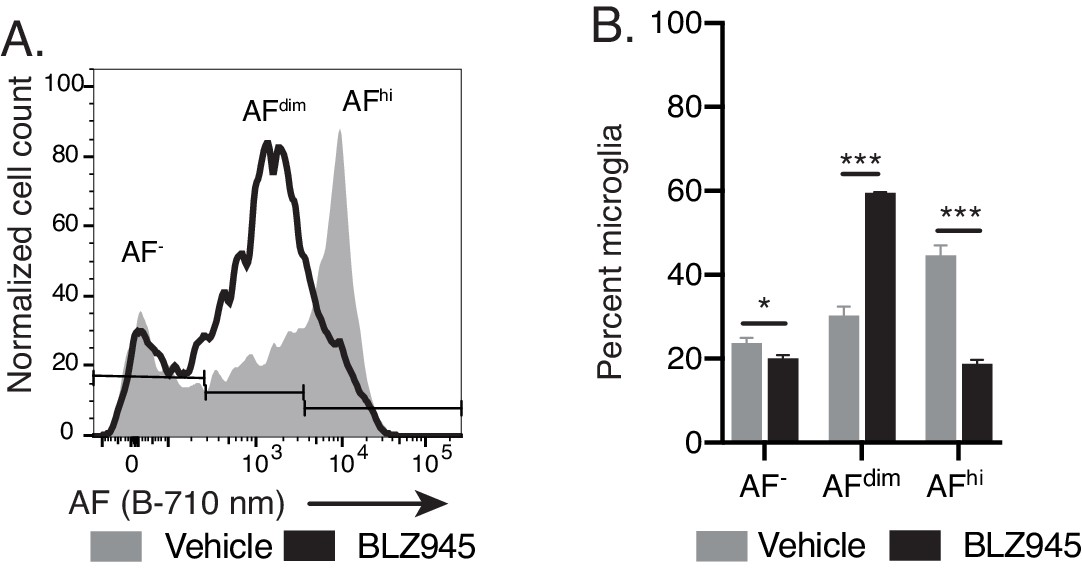
Repopulating microglia exhibit lower levels of AF.
Related to Figure 4C,D. (A) Representative flow cytometry histogram and (B) corresponding quantitation of microglia subset proportions 70 days after treatment with vehicle or BLZ945. Significance established with 2-way repeated measures ANOVA followed by Sidak’s post-hoc. n = 4 animals per group representative of least two independent experiments. Data presented as mean ± SD. ns = not significant, *p<0.05, ***p<0.001.
Figure 5
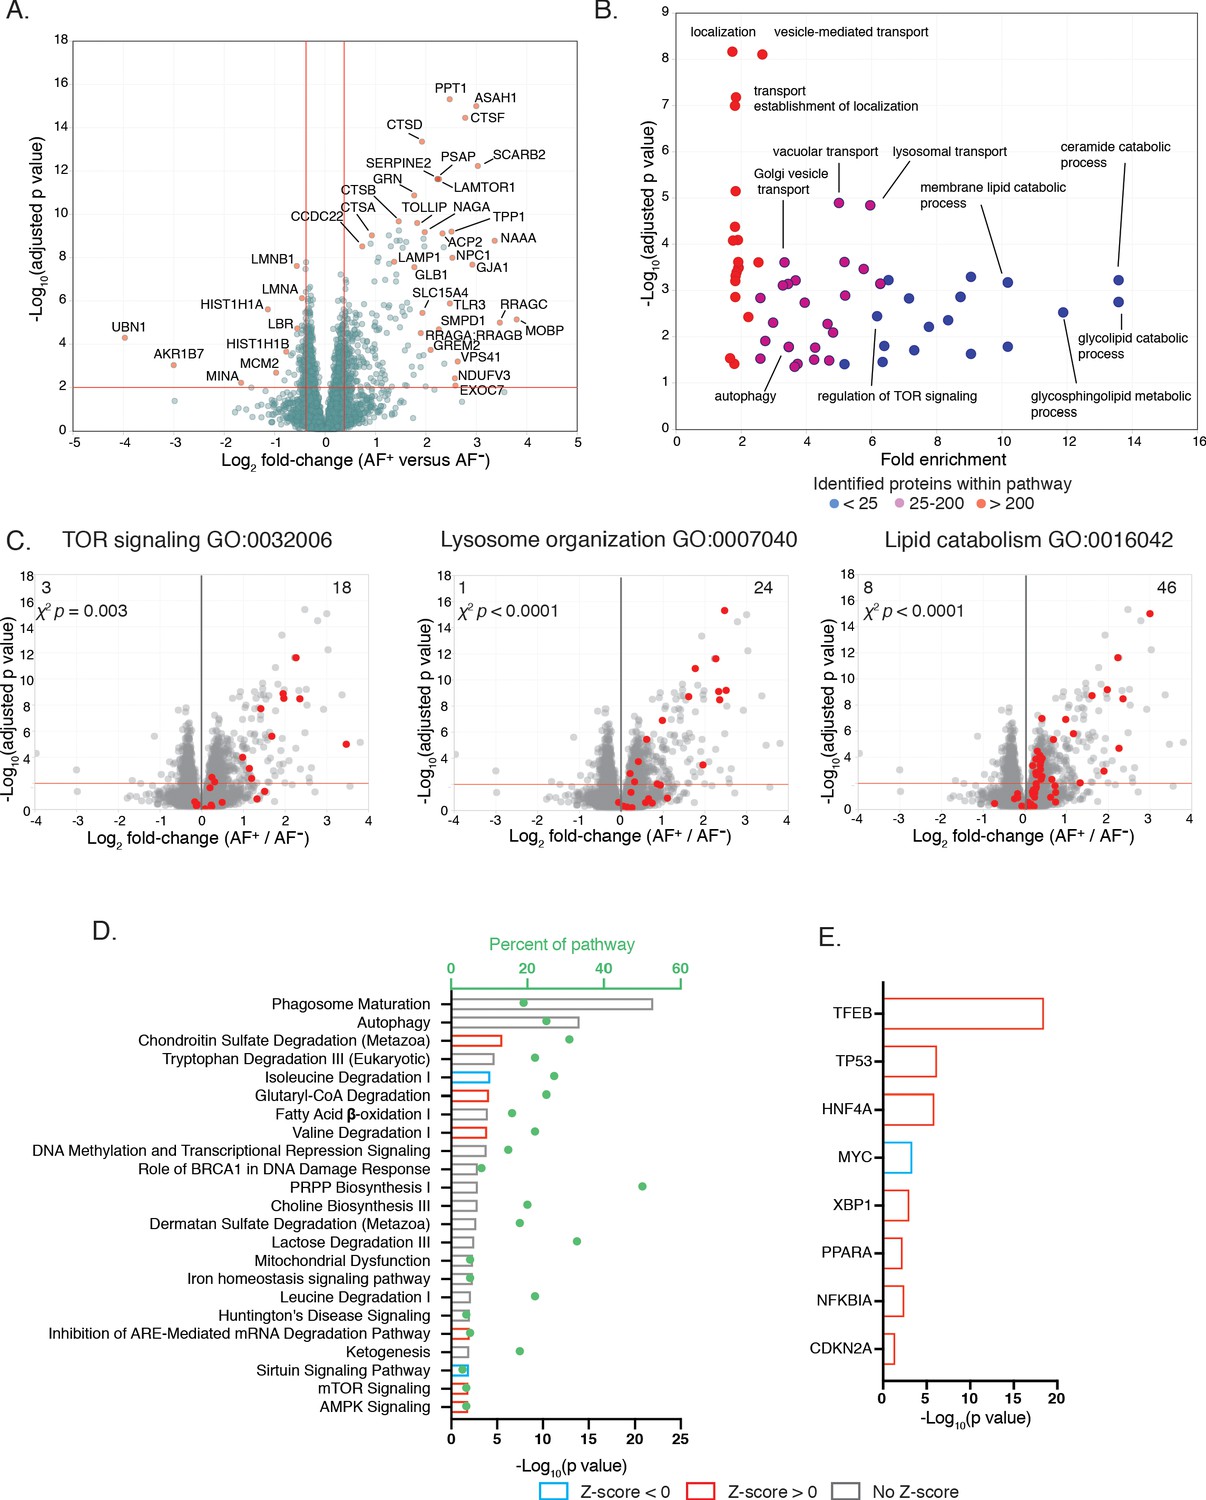
Proteomic analysis of isolated AF+ and AF− microglia subsets reveals molecular differences in endolysosomal, autophagic and metabolic pathways.
(A) Volcano plot comparing protein abundance in AF+ and AF− microglia (x-axis: Log2 abundance difference, y-axis: negative log Benjamini-Hochberg adjusted p value from two-tailed Student’s t-test) with most-differentially expressed proteins annotated. Red lines: significance cutoffs (adjusted p value < 0.01, |Fold change| > 1.3). (B) Scatter plot displaying adjusted p value and GO term fold-enrichment results among differentially expressed proteins (DEPs) upregulated in AF+, with selected pathways highlighted. Dot color indicates number of proteins within GO pathway detected in the dataset (see legend). (C) Volcano plots comparing protein levels in AF+ and AF− microglia with indicated GO term signatures overlaid in red. p value, χ2 statistical test for bias in distribution of GO term pathway members. (D) Top canonical pathways and (E) upstream regulators identified by IPA as differentially regulated between AF subsets. (D) Bars and dots respectively indicate p values and the percent of pathway proteins detected. (D, E) Predicted activation or inhibition of pathway or transcriptional regulator is indicated by positive and negative Z-scores, respectively, see legend. Analysis based on 351 DEPs identified using adjusted p value < 0.01 and fold change > |1.3|. See also Figure 5—source data 1, 2 and 3.
-
Figure 5—source data 1
AF+ versus AF- subset associated proteins.
Sheet 1: Description of the column headers. Sheet 2: Proteins which were differentially regulated (adj. p value < 0.05) between subsets.
- https://cdn.elifesciences.org/articles/57495/elife-57495-fig5-data1-v2.xlsx
-
Figure 5—source data 2
Panther overrepresentation test of AF+ and AF- associated proteins.
Sheet 1: Description of the column headers. Sheet 2: Pathway overrepresentation testing for proteins upregulated in AF+ microglia. Sheet 3: Pathway overrepresentation testing for proteins upregulated in AF- microglia.
- https://cdn.elifesciences.org/articles/57495/elife-57495-fig5-data2-v2.xlsx
-
Figure 5—source data 3
Ingenuity pathway analysis of differentially regulated proteins in AF subsets.
Sheet 1: Description of the column headers. Sheet 2: Overlap of differentially regulated proteins with IPA canonical pathways based on input list of 351 proteins with adj. p val <0.01 and fold change > |1.3|. Sheet 3: Upstream regulators identified by IPA based on input list of 351 differentially regulated proteins with adj. p val <0.01 and fold change > |1.3|.
- https://cdn.elifesciences.org/articles/57495/elife-57495-fig5-data3-v2.xlsx
Figure 6 with 2 supplements
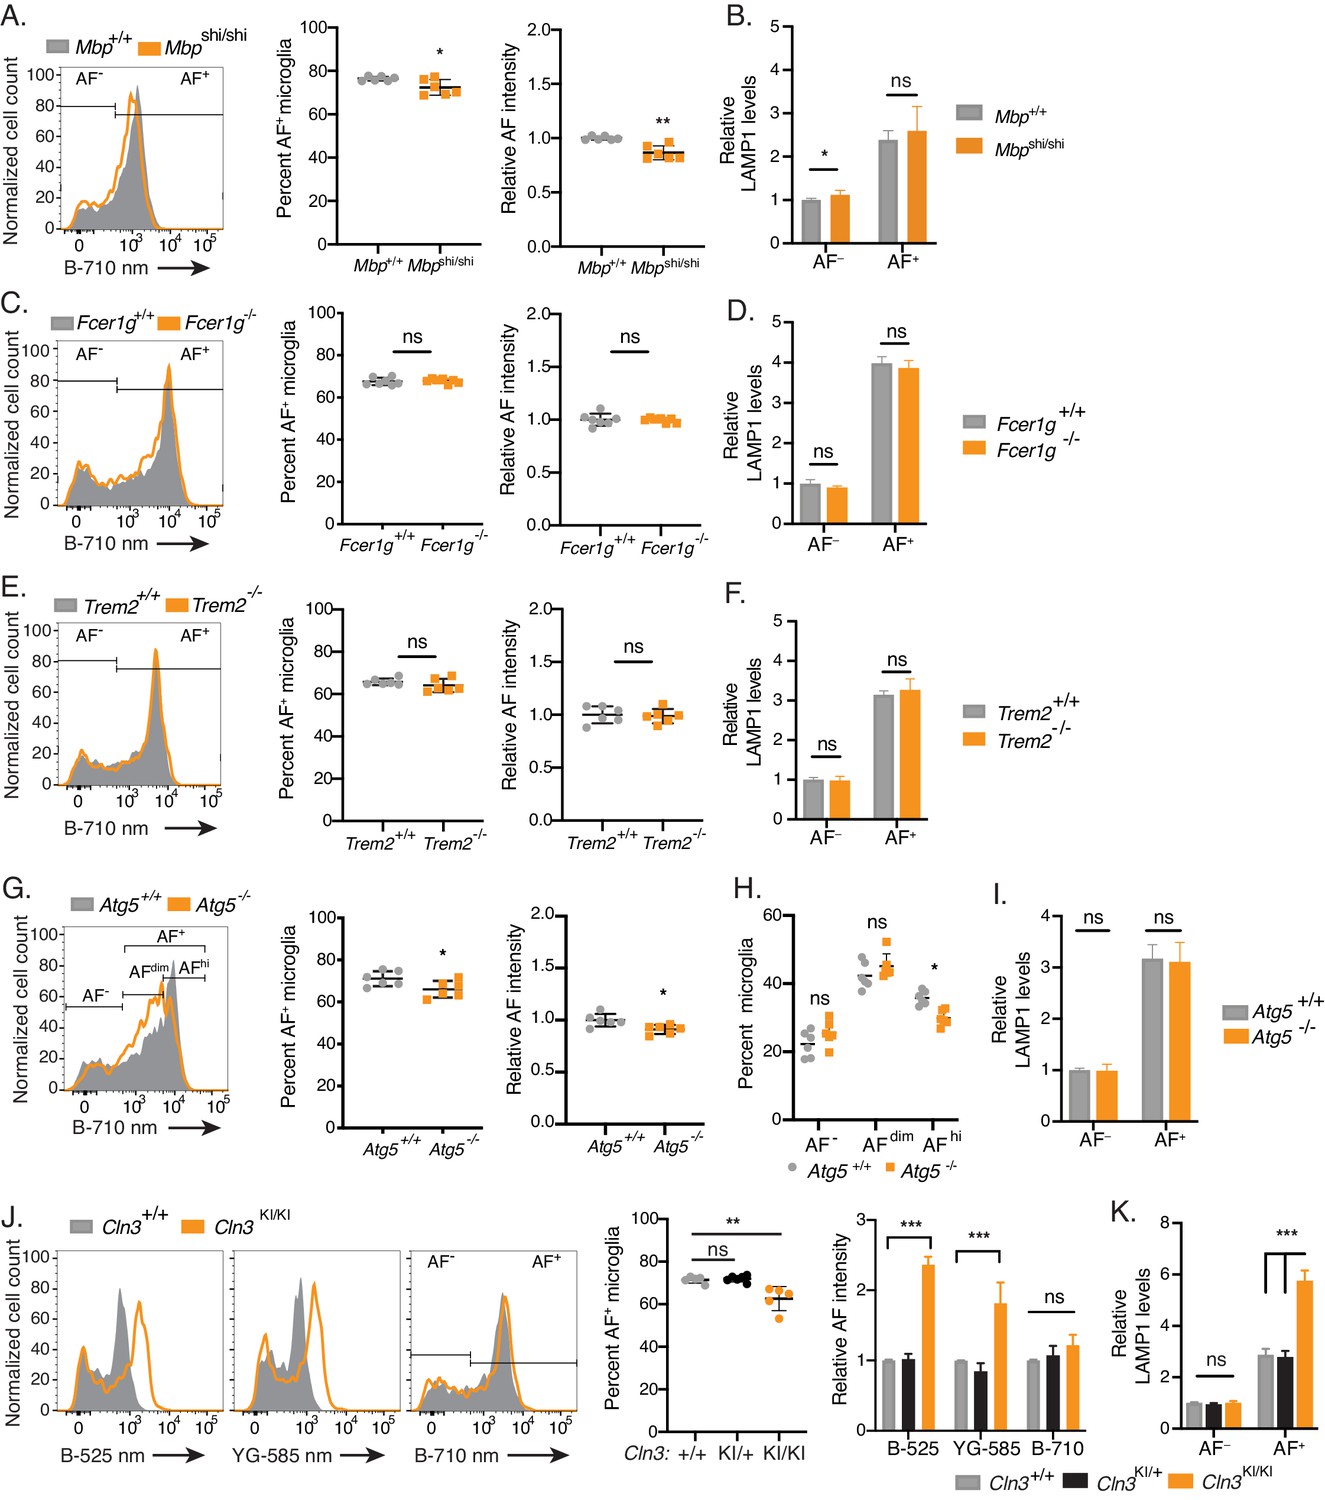
The accumulation of AF storage bodies in microglia is genetically-controlled.
(A, C, E, G, H, J) Representative flow cytometry histograms and quantitation of AF subset frequency and/or AF signal intensity in AF+ microglia isolated from mice of indicated genotypes. Significance established with unpaired Student’s t-test (A, C, E, G), 2-way repeated measures ANOVA followed by Sidak’s post-hoc (H), and 1-way ANOVA followed by Tukey’s post-hoc (J). (B, D, F, I, K) Quantitation of LAMP1 levels in microglia isolated from mice of indicated genotypes, calculated as net geometric mean fluorescence intensity after subtraction of background AF signal and normalization to AF intensity detected in AF− microglia from wild-type age-matched control mice. Significance established with unpaired Student’s t-test (B, D, F, I) and 1-way ANOVA followed by Tukey’s post-hoc (K). n ≥ 6 animals per genotype group from at least two independent experiments. All groups were age-matched and all data presented as mean ± SD. AF = autofluorescence; B = blue laser; YG = yellow green laser; ns = not significant, *p<0.05, **p<0.01, ***p<0.001. See also Figure 6—figure supplements 1 and 2.
Figure 6—figure supplement 1

Characterization of microglia isolated from Mbp-deficient mice.
Related to Figure 6A,B. (A) Representative flow cytometry scatterplots depicting CLEC7A levels and AF intensity in microglia from mice of indicated genotypes and (B) corresponding quantitation of percent microglia positive for CLEC7A. Significance established with Welch’s t-test. **p<0.01.
Figure 6—figure supplement 2
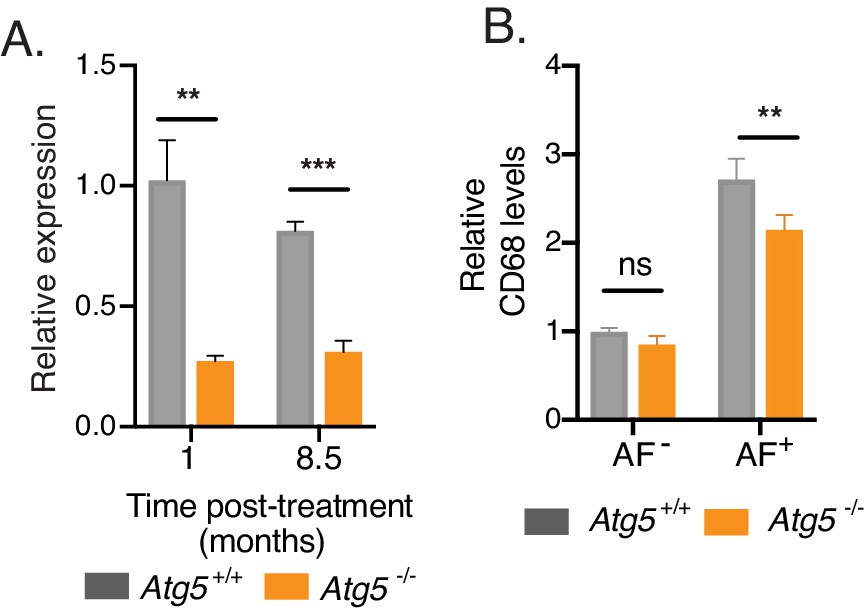
Characterization of microglia isolated from Atg5-deficient mice.
Related to Figure 6G,H,I. (A) Relative transcript expression of Atg5 quantified by RT-qPCR of FACS-isolated microglia from mice of indicated genotypes 1 or 8.5 months after tamoxifen-induced recombination. Significance established with unpaired Student’s t-test. (B) Quantitation of CD68 levels in microglia isolated from Atg5−/−mice, calculated as net geometric mean fluorescence intensity after subtraction of background AF signal and normalization to AF intensity detected in AF- microglia from wild-type age-matched control mice. Significance established with unpaired Student’s t-test. n ≥ 6 animals per genotype group from at least two independent experiments. AF = autofluorescence; ns = not significant, **p<0.01. ***p<0.001.
Figure 7 with 1 supplement
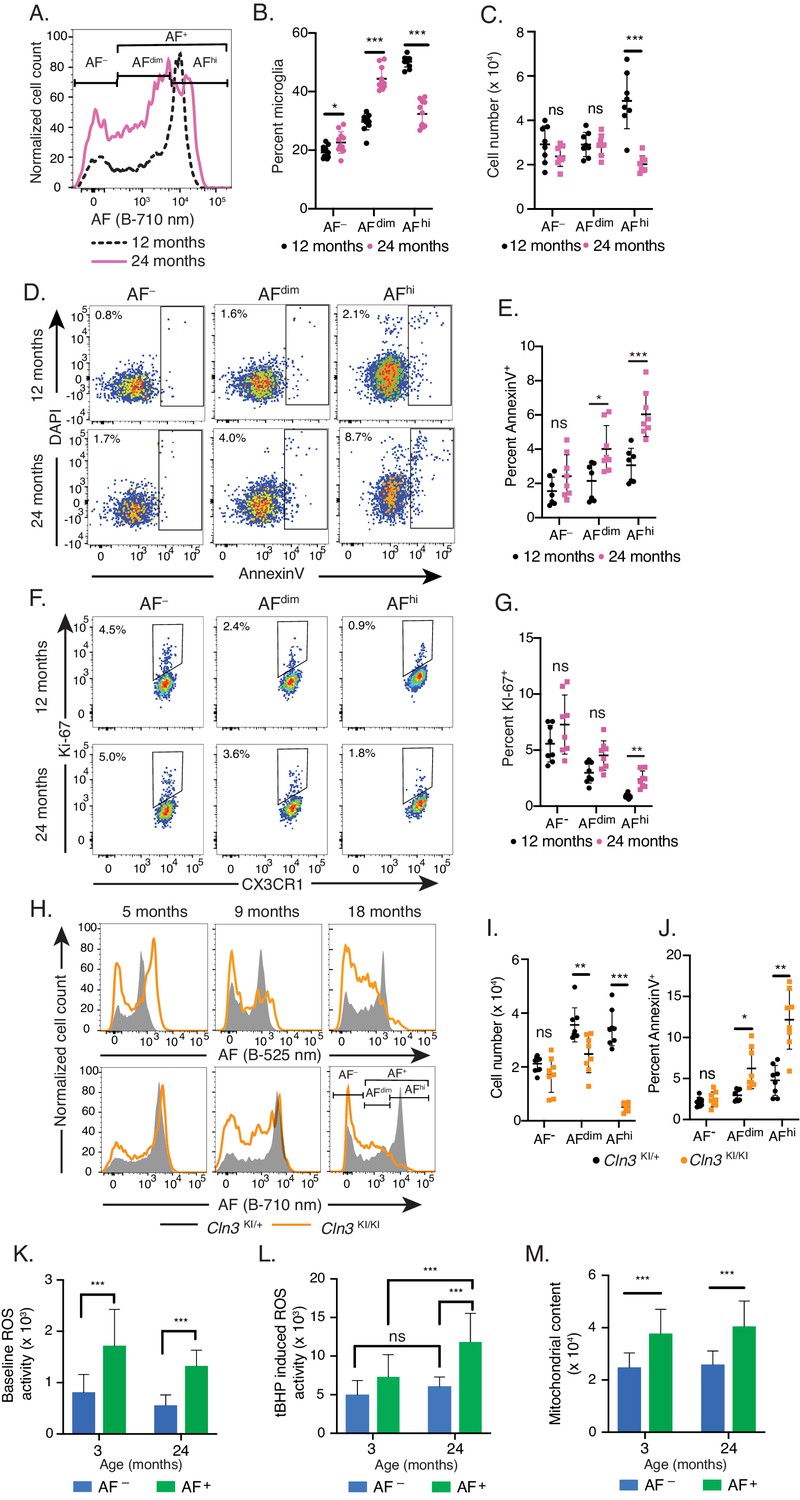
Advanced aging and lysosomal dysfunction lead to the preferential cellular loss of the AFhi microglia population.
(A) Representative flow cytometry histograms and (B, C) corresponding quantitation of AF subset frequencies (B) and absolute cell numbers (C) in 12- and 24-month-old naïve mice. Significance established with 2-way repeated measures ANOVA followed by Sidak’s post-hoc. (D–G) Representative scatterplots depicting DAPI and AnnexinV staining (D) and KI67 and CX3CR1 staining (F) in microglia subsets from 12- and 24-month-old mice and corresponding quantitation of the frequency of AnnexinV+ (E) and KI67+ (G) cells in each microglia subset. Significance established with 2-way repeated measures ANOVA followed by Sidak’s post-hoc. (H) Representative flow cytometry histograms of AF intensity in microglia from mice of indicated genotypes and ages and detected using two distinct cytometer channels and (I) corresponding quantitation of absolute cell numbers of microglia subsets in 18-month-old animals. Significance established with 2-way ANOVA followed by Sidak’s post-hoc. (J) Quantitation of percent microglia positive for AnnexinV in indicated AF subsets from 18-month-old animals of indicated genotypes. (K–L) Quantitation of CellROX DeepRed ROS-indicator staining in microglia subsets from mice at indicated ages and after subtraction of background AF signal at (K) baseline and (L) after treatment with ROS inducer tBHP. (M) Quantitation of Mitotracker dye staining as an indicator of mitochondrial content in microglia subsets from mice at indicated ages. Significance established with 2-way ANOVA followed by Sidak’s post-hoc. n ≥ 7 animals per genotype group from at least two independent experiments. All data presented as mean ± SD. AF = autofluorescence; B = blue laser; ROS = reactive oxygen species; tBHP = tert Butyl hydroperoxide; ns = not significant *p<0.05 **p<0.01 ***p<0.001. See also Figure 7—figure supplement 1.
Figure 7—figure supplement 1
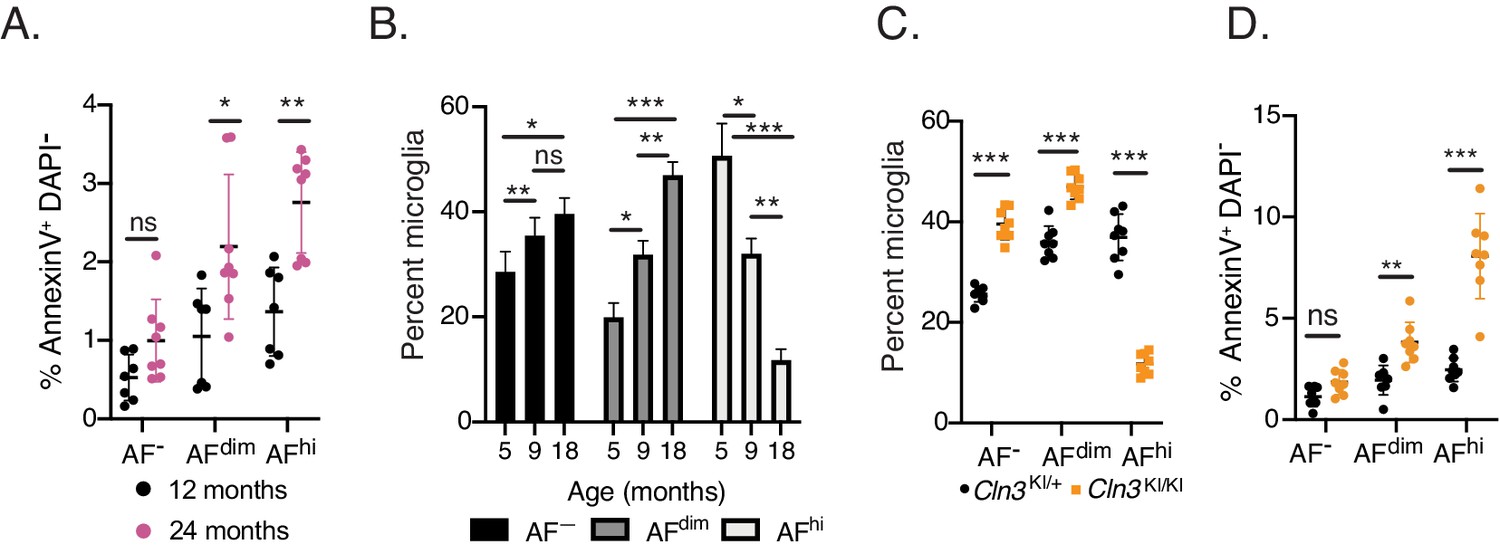
Lysosomal dysfunction leads to the preferential cellular loss of the AFhi microglia population.
Related to Figure 7E,H,I,J. (A) Quantitation of the frequency of AnnexinV+, DAPI− microglia at 12- and 24 months of age in C57BL/6 mice. Significance established with 2-way repeated measures ANOVA followed by Sidak’s post-hoc (B) Quantitation of the frequency of microglia subsets in Cln3KI/KI mice at indicated ages. Significance established with 2-way repeated measures ANOVA followed by Tukey’s post-hoc. (C, D) Quantitation of the frequency of AF microglia subsets and (D) AnnexinV+ DAPI− microglia in Cln3KI/+ and Cln3KI/KI mice at 18 months of age. Significance established with 2-way repeated measures ANOVA followed by Sidak’s post-hoc. n ≥ 7 animals per group from at least two independent experiments. AF = autofluorescence. Data presented as mean ± SD. ns = not significant, *p<0.05, **p<0.01, ***p<0.001.
Author response image 1
Author response image 2
Tables
Key resources table
| Reagent type (species) or resource | Designation | Source or reference | Identifiers | Additional information |
|---|---|---|---|---|
| Chemical compound, drug | BLZ945; CSF1R inhibitor | PMID:24056773 | CAS No. 953769-46-5 | |
| Chemical compound, drug | Tamoxifen | Millipore-Sigma | Cat# T5648 | |
| Biological sample (C. macaque) | NHP brain samples | Charles River Labs | freshly isolated same day | |
| Other | DAPI | ThermoFisher | Cat# 62248 | Cell impermeant blue-fluorescent DNA stain for viability used at a concentration of 0.1 µg/mL |
| Antibody | anti-mouse CD11b BV510 (rat monoclonal) | Biolegend | RRID:AB_2561390 | FlowCyt (1:200) |
| Antibody | anti-mouse CD45 BV785 (rat monoclonal) | Biolegend | RRID:AB_2564590 | FlowCyt (1:200) |
| Antibody | anti-mouse CX3CR1 BV421 (rat monoclonal) | Biolegend | RRID:AB_2565706 | FlowCyt (1:200) |
| Antibody | anti-mouse P2RY12 PE (rat monoclonal) | Biolegend | RRID:AB_2721644 | FlowCyt (1:200) |
| Antibody | anti-mouse TMEM119 (rabbit monoclonal) | AbCam | RRID:AB_2744673 | FlowCyt (1:100) |
| Antibody | anti-rabbit AlexaFluor488 (rat monoclonal) | Biolegend | RRID:AB_2563203 | FlowCyt (1:400) |
| Other | AnnexinV AlexaFluor647 | ThermoFisher | Cat# A23204 | Apoptotic cell labeling reagent |
| Antibody | anti-mouse CD68 FITC (rat monoclonal) | Biolegend | RRID:AB_10575475 | FlowCyt (1:300) |
| Antibody | anti-mouse LAMP1 AlexaFluor647 (rat monoclonal) | Biolegend | RRID:AB_571990 | FlowCyt (1:200) |
| Antibody | anti-mouse KI-67 BV421 (rat monoclonal) | Biolegend | RRID:AB_2629748 | FlowCyt (1:100) |
| Antibody | anti-mouse Ly6G PE (rat monoclonal) | BD Biosciences | RRID:AB_394208 | FlowCyt (1:100) |
| Antibody | anti-mouse Ly6C PE (rat monoclonal) | Biolegend | RRID:AB_1186133 | FlowCyt (1:100) |
| Antibody | anti-mouse CD3 PE (rat monoclonal) | BD Biosciences | RRID:AB_395699 | FlowCyt (1:100) |
| Antibody | anti-mouse CD19 PE (rat monoclonal) | BD Biosciences | RRID:AB_395050 | FlowCyt (1:100) |
| Antibody | anti-mouse NK1.1 PE (rat monoclonal) | BD Biosciences | RRID:AB_396674 | FlowCyt (1:100) |
| Antibody | anti-mouse CD45 AF488 (rat monoclonal) | Biolegend | RRID:AB_493531 | FlowCyt (1:100) |
| Antibody | anti-mouse CX3CR1 BV785 (rat monoclonal) | Biolegend | RRID:AB_2565938 | FlowCyt (1:200) |
| Antibody | anti-mouse CD11b APC (rat monoclonal) | Biolegend | RRID:AB_312794 | FlowCyt (1:200) |
| Antibody | anti-NHP CD45 BV786 (mouse monoclonal) | BD Biosciences | RRID:AB_2738454 | FlowCyt (5 µL/test) |
| Antibody | anti-NHP CD11b BV510 (mouse monoclonal) | BD Biosciences | RRID:AB_2737996 | FlowCyt (5 µL/test) |
| Genetic reagent (M. musculus) | Cx3cr1tm2.1(cre/ERT2)Jung (Cx3cr1–CreERT2) | PMID:23273845 | RRID:IMSR_JAX:020940 | Dr. Steffen Jung (Weizmann Institute of Science, Israel) |
| Genetic reagent (M. musculus) | Atg5flox | PMID:16625204 | Dr. Noboru Mizushima, (University of Tokyo) | |
| Genetic reagent (M. musculus) | Fcer1g-/- | Taconic Biosciences | Model 583 | PMID:8313472 |
| Genetic reagent (M. musculus) | Trem2-/- | KOMP repository | RRID:MMRRC_050209-UCD | |
| Genetic reagent (M. musculus) | Mbpshi | Jackson Laboratory | RRID:IMSR_JAX:001428 | PMID:6168677 |
| Genetic reagent (M. musculus) | Cln3e × 7/ex8 (Cln3 KI) | PMID:12374761 | Dr. Susan Cotman (Harvard Medical School) | |
| Software, algorithm | FlowJo V10 | TreeStar | RRID:SCR_008520 | |
| Software, algorithm | Prism 8.0 | Graphpad | RRID:SCR_002798 | |
| Software, algorithm | FIJI | FIJI | RRID:SCR_002285 | |
| Software, algorithm | MaxQuant Version 1.6.0.16 | Max Planck | RRID:SCR_014485 | |
| Software, algorithm | Perseus | Max Planck | RRID:SCR_015753 | |
| Software, algorithm | Ingenuity Pathway Analysis | Qiagen | RRID:SCR_008653 | |
| Other | Percoll | GE Healthcare | Cat# 17-0891-01 | Medium for density gradient centrifugation |
| Other | Mitotracker DeepRedFM | ThermoFisher | Cat# M22426 | Mitochondrial fluorescent dye, used at 50 nM |
| Other | CellROX DeepRed | ThermoFisher | Cat# C10491 | ROS fluorescent detection agent, used at 500 nM |
| Sequence based reagent | Atg5 Taqman primers | ThermoFisher | AssayID: Mm01187301_m1, Cat# 4351372 | Spanning exons 3–4 |
| Commercial assay or kit | RNEasy Plus Micro | Qiagen | Cat# 74034 | |
| Commercial assay or kit | SuperScript IV VILO kit | ThermoFisher | Cat# 11754050 | |
| Sequence based reagent | Gapdh endogenous control primers, M. musculus | ThermoFisher | Cat# 4352339E | |
| Commercial assay or kit | QuantiTect Multiplex PCR | Qiagen | Cat# 204541 | |
| Software, algorithm | PANTHER | PANTHER | RRID:SCR_004869 | |
| Peptide, recombinant protein | Lysyl Endopeptidase, Mass Spectrometry Grade (Lys-C) | Wako | Cat# 121–05063 | |
| Peptide, recombinant protein | Sequencing Grade Modified Trypsin | Promega | Cat# V5113 |
Additional files
Download links
A two-part list of links to download the article, or parts of the article, in various formats.
Downloads (link to download the article as PDF)
Open citations (links to open the citations from this article in various online reference manager services)
Cite this article (links to download the citations from this article in formats compatible with various reference manager tools)
Differential accumulation of storage bodies with aging defines discrete subsets of microglia in the healthy brain
eLife 9:e57495.
https://doi.org/10.7554/eLife.57495


