The histone deacetylase complex MiDAC regulates a neurodevelopmental gene expression program to control neurite outgrowth
- Department of Cell & Molecular Biology, St. Jude Children’s Research Hospital, United States
- Department of Computational Biology, St. Jude Children's Research Hospital, United States
- Genome Engineering & iPS Center, Department of Genetics, Washington University, United States
- Department of Tumor Cell Biology, St. Jude Children's Research Hospital, United States
Figures
Figure 1 with 3 supplements
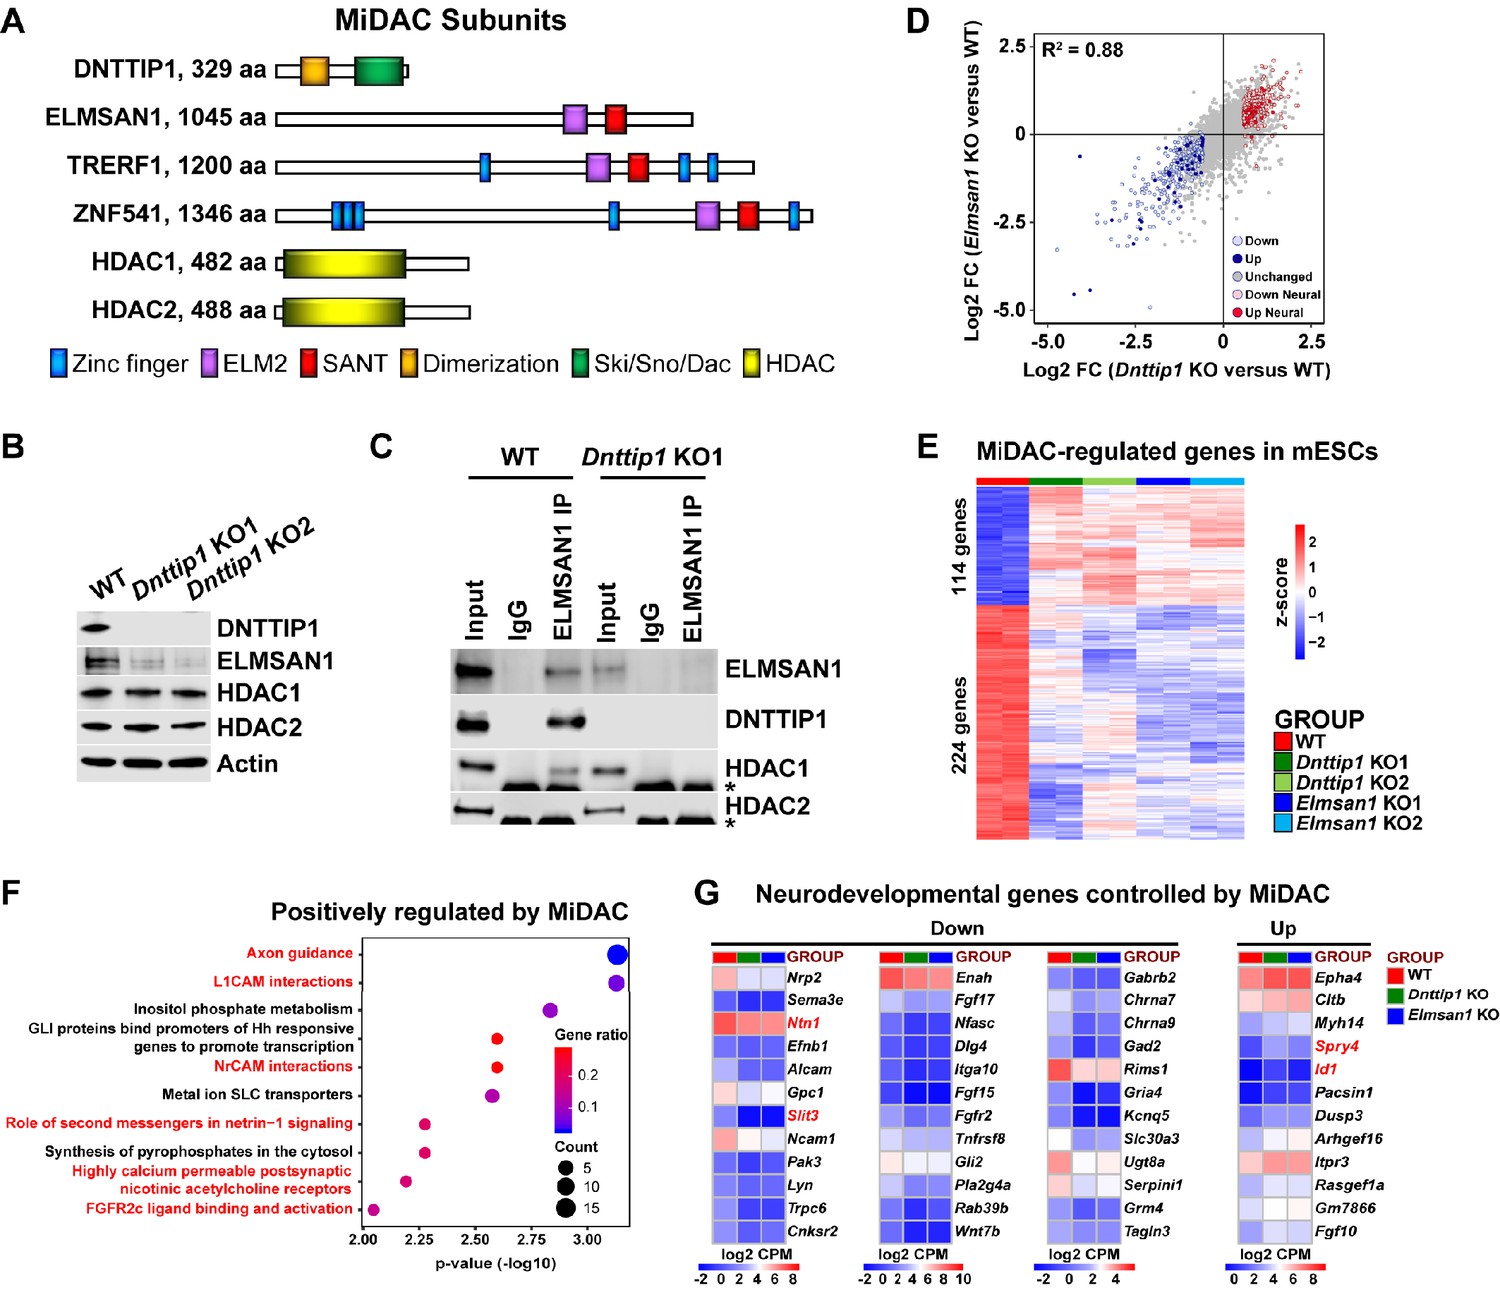
MiDAC controls a neurodevelopmental gene expression program.
(A) Subunits with domains of the human histone deacetylase complex MiDAC. (B) WB for the indicated MiDAC components from total cell lysates of WT, Dnttip1 KO1 and Dnttip1 KO2 mESCs. Actin is the loading control. (C) IPs were carried out with IgG and ELMSAN1 antibodies from nuclear extracts of WT and Dnttip1 KO1 mESCs followed by WB for the indicated MiDAC components. The asterisk marks the IgG heavy chain. (D) Scatter plot comparing all DEGs in Dnttip1 KO (KO1 and KO2) versus WT mESCs from Figure 1—figure supplement 2A (x-axis) with DEGs in Elmsan1 KO (KO1 and KO2) versus WT mESCs from Figure 1—figure supplement 2B (y-axis). Both axes depict normalized gene expression (log2 FC of CPM). (E) RNA-seq heatmap depicting DNTTIP1 and ELMSAN1 co-regulated (MiDAC-regulated) genes in mESCs (fold change (FC) >1.5 or <−1.5, p<0.01). The color scale depicts normalized gene expression (log2 CPM). (F) Reactome analysis showing the most highly enriched gene categories of genes that are positively regulated by MiDAC (both down in Dnttip1 KO (KO1 and KO2) and Elmsan1 KO (KO1 and KO2) versus WT mESCs, FC <−1.5, p<0.01). Pathways associated with neural differentiation and function are highlighted in red. (G) RNA-seq heatmaps depicting down- and upregulated genes from a gene set of neurodevelopmental genes that is mutually regulated by DNTTIP1 and ELMSAN1 (FC <−1.5 or >1.5, p<0.05). The color scale depicts the z-score of normalized gene expression (log2 CPM). (D) DEGs, (E) MiDAC-regulated genes, (F) Reactome gene categories and (G) differentially expressed neurodevelopmental genes were determined based on two biological replicates each from WT mESCs and two Dnttip1 KO and two Elmsan1 KO clones, respectively.
Figure 1—figure supplement 1
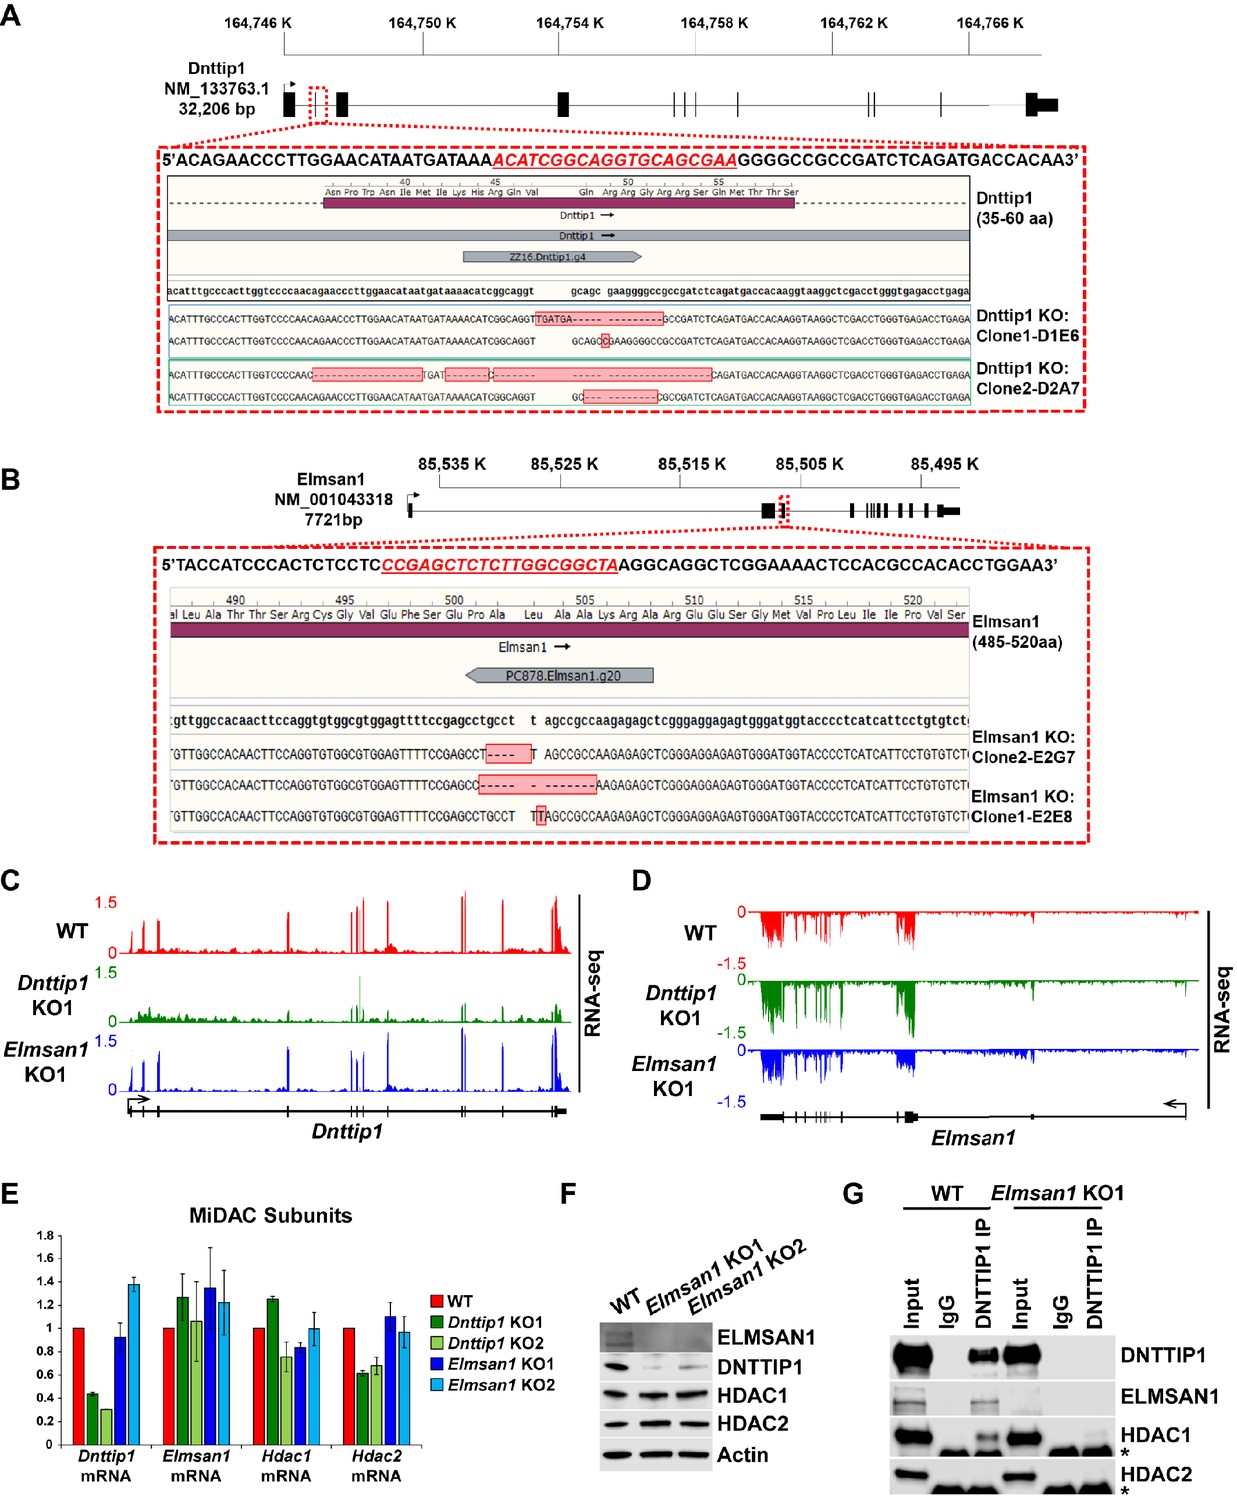
Characterization of Dnttip1 KO and Elmsan1 KO mESCs.
(A, B) Gene structures of Dnttip1 and Elmsan1 highlighting the region within exon 2 that was targeted by CRISPR/Cas9 in mESCs. The gDNA sequence is shown underlined in red. The resulting indels for each allele within the (A) Dnttip1 KO1, Dnttip1 KO2 and (B) Elmsan1 KO1 and Elmsan1 KO2 clones are highlighted by red boxes. (C, D) RNA-seq tracks of the (C) Dnttip1 and (D) Elmsan1 locus in WT, Dnttip1 KO1 and Elmsan1 KO1 mESCs. The RNA-seq track files depict replicate 1 from WT mESCs and the Dnttip1 KO1 and Elmsan1 KO1 clone, respectively. (E) qRT-PCR for Dnttip1, Elmsan1, Hdac1, and Hdac2 mRNA in WT, Dnttip1 KO (KO1 and KO2) and Elmsan1 KO (KO1 and KO2) mESCs. Expression was normalized to Gapdh. (F) WB for the indicated MiDAC components from total cell lysates of WT, Elmsan1 KO1 and Elmsan1 KO2 mESCs. Actin is the loading control. (G) IPs were carried out with IgG and DNTTIP1 antibodies from nuclear extracts of WT and Elmsan1 KO1 mESCs followed by WB for the indicated MiDAC components. The asterisk marks the IgG heavy chain.
Figure 1—figure supplement 2
MiDAC controls a neurodevelopmental gene expression program.
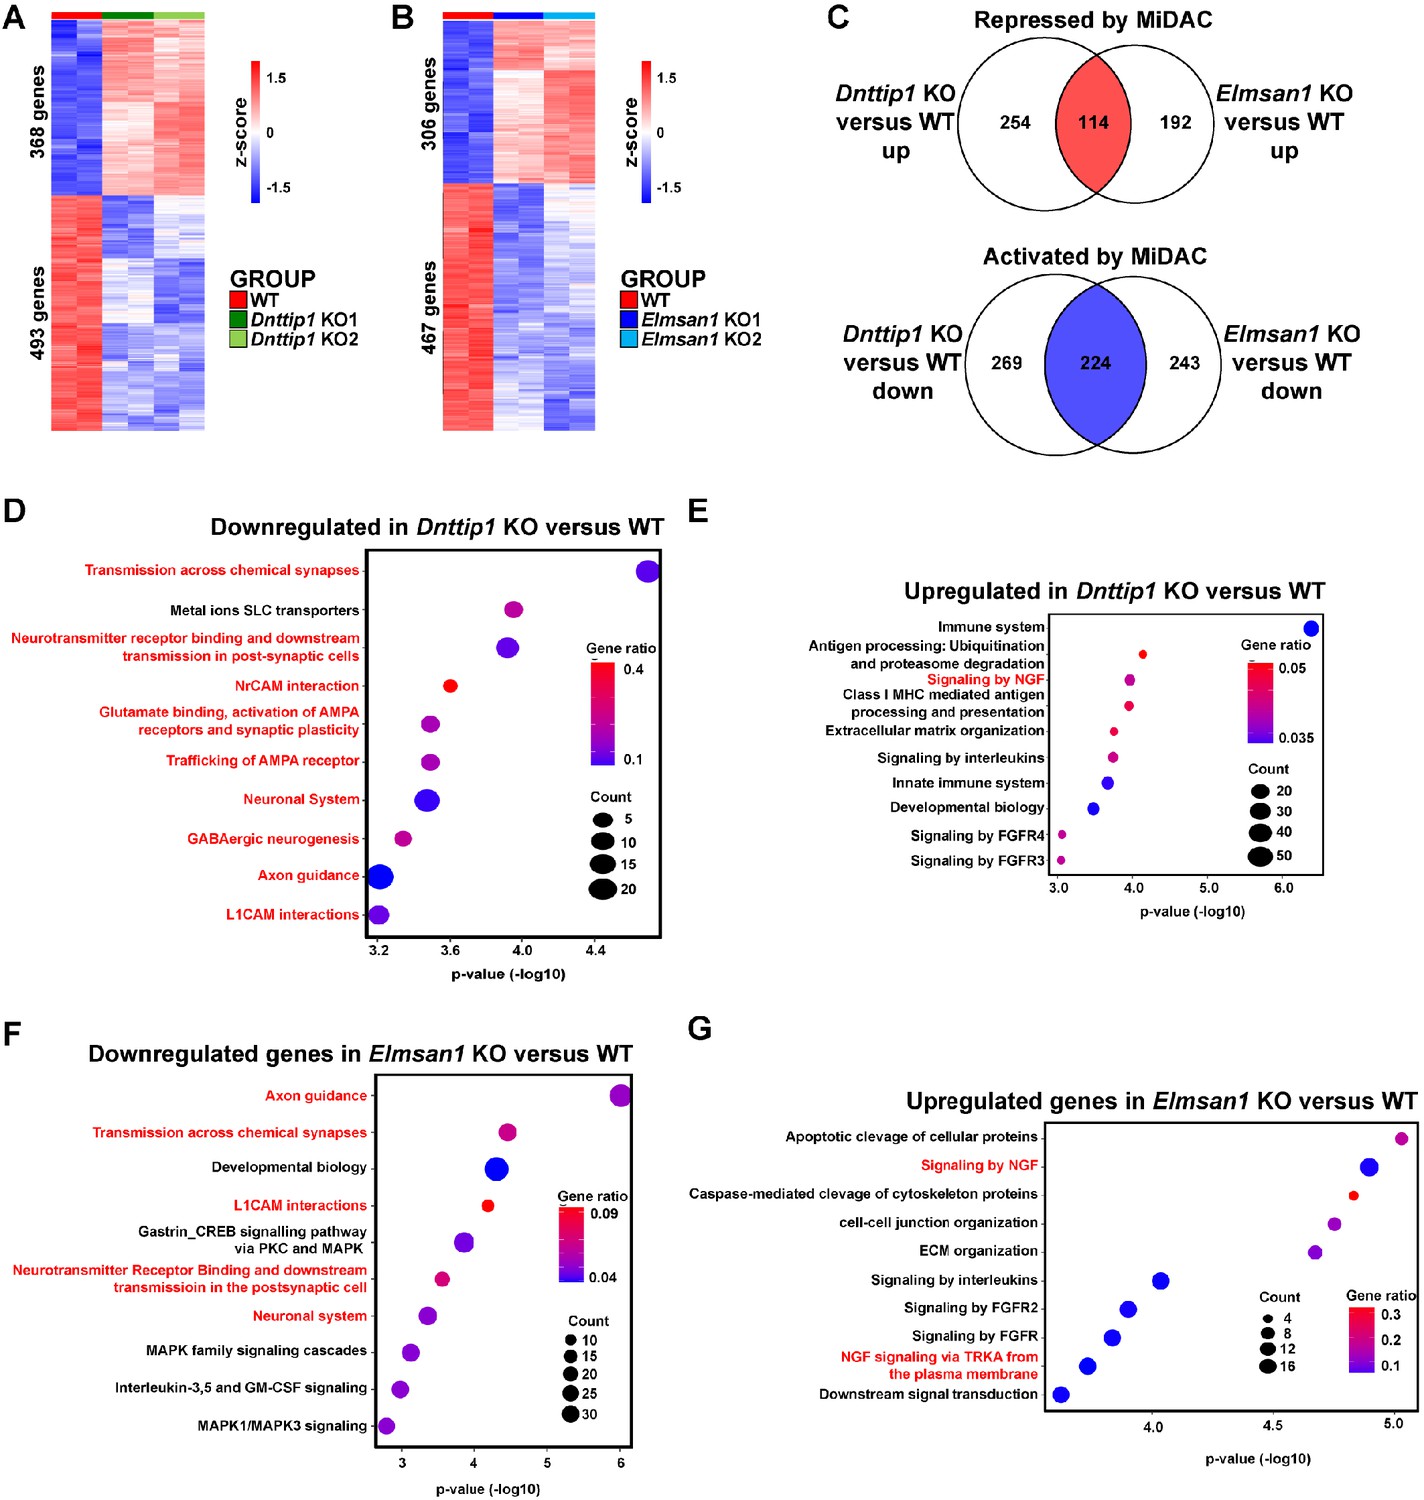
(A, B) RNA-seq heatmaps obtained by hierarchical clustering of differentially expressed genes (DEGs) in (A) WT and Dnttip1 KO (KO1 and KO2) and (B) WT and Elmsan1 KO (KO1 and KO2) mESCs (fold change (FC) >1.5 or <−1.5, p<0.01). The color scale depicts normalized gene expression (log2 CPM). (C) Venn diagrams showing the numbers of a downregulated (blue, 224 genes) and upregulated (red, 114 genes) gene set that is common to both Dnttip1 KO (KO1 and KO2) and Elmsan1 KO (KO1 and KO2) mESCs (FC <−1.5 or >1.5, p<0.01). (D, E) Reactome analysis showing the most highly enriched gene categories of (D) down- and (E) upregulated genes in Dnttip1 KO (KO1 and KO2) versus WT mESCs (FC <−1.5 or >1.5, p<0.01). Pathways associated with neuronal differentiation and function are highlighted in red. (F, G) Reactome analysis showing the most highly enriched gene categories of (F) down- and (G) upregulated genes in Elmsan1 KO (KO1 and KO2) versus WT mESCs (FC <−1.5 or >1.5, p<0.01). Pathways associated with neuronal differentiation and function are highlighted in red. (A, B) DEGs, (C) MiDAC-regulated genes and (D–G) Reactome gene categories were determined based on two biological replicates each from WT mESCs and two Dnttip1 KO and two Elmsan1 KO clones, respectively.
Figure 1—figure supplement 3
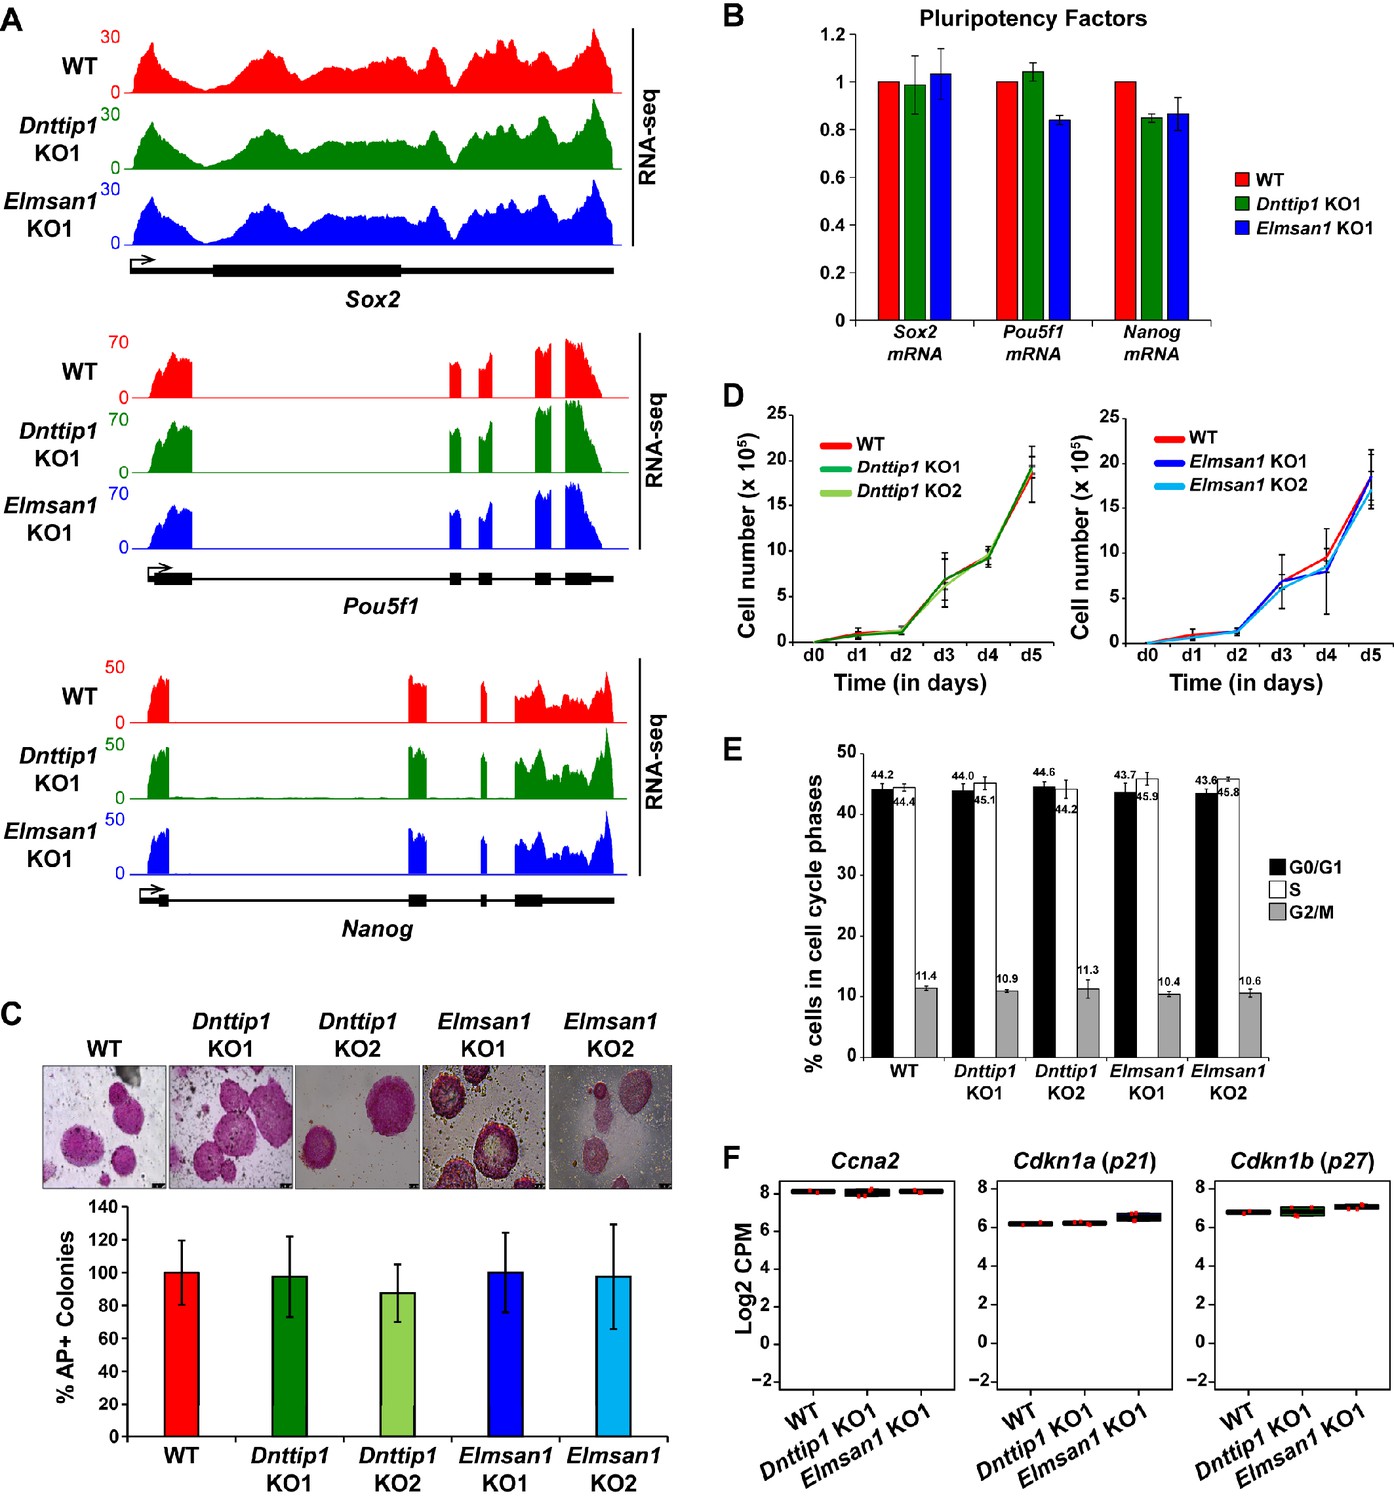
MiDAC is dispensable for self-renewal, pluripotency and cell cycle distribution of mESCs.
(A) RNA-seq tracks of the Sox2, Pou5f1 and Nanog loci in WT, Dnttip1 KO1 and Elmsan1 KO1 mESCs. The RNA-seq track files depict replicate 1 from WT mESCs and the Dnttip1 KO1 and Elmsan1 KO1 clone, respectively. (B) qRT-PCR for Sox2, Pou5f1 and Nanog mRNA in WT, Dnttip1 KO1 and Elmsan1 KO1 mESCs. Expression was normalized to Gapdh. (C) Alkaline phosphatase (AP) staining and quantification of AP-positive WT, Dnttip1 KO (KO1 and KO2) and Elmsan1 KO (KO1 and KO2) mESC colonies as percentage of the whole population. (D) Proliferation time course comparing WT with Dnttip1 KO (KO1 and KO2) and WT with Elmsan1 KO (KO1 and KO2) mESCs. (E) Cell cycle distribution of WT, Dnttip1 KO (KO1 and KO2) and Elmsan1 KO (KO1 and KO2) mESCs. Black: G0/G1 phase. White: S phase. Gray: M phase. (F) Box plots showing the normalized gene expression levels (log2 CPM) of cyclin A2 (Ccna2) and the cyclin-dependent kinase inhibitors Cdkn1a (p21) and Cdkn1b (p27) in WT, Dnttip1 KO (KO1 and KO2) and Elmsan1 KO (KO1 and KO2) mESCs. Gene expression levels were determined based on two biological replicates each from WT mESCs and two Dnttip1 KO and two Elmsan1 KO clones, respectively.
Figure 2 with 1 supplement

MiDAC regulates neurite outgrowth.
(A) Schematic outline of neuro-ectoderm (NE) differentiation protocol. (B) MAP2 immunofluorescence (IF) staining of WT, Dnttip1 KO1 and Elmsan1 KO1 NE after 12 days of differentiation. Nuclei were stained with DAPI. For analysis the neuronal cell body (blue) and its neurites were manually traced with ImageJ software. The white scale bar represents 20 µm. (C, D) qRT-PCR for (C) Tubb3 and (D) Map2 mRNA in WT, Dnttip1 KO1 and Elmsan1 KO1 mESCs (day 0) and NE after 12 and 21 days of differentiation. Expression was normalized to Gapdh. (E–G) Quantification of (E) neurite length, (F) the total number of neurites per neuron and (G) the percentage of neurons within the total cell population from traced neurites in WT, Dnttip1 KO1 and Elmsan1 KO1 neurons after 12 days of differentiation as determined by MAP2 IF. (E, F) The neurites of 200 neurons within the total cell population were assessed per genotype. (H) Gene expression levels of the indicated neurodevelopmental genes in WT, Dnttip1 KO1 and Elmsan1 KO1 NE after 12 days of differentiation as analyzed by qRT-PCR. Expression was normalized to Gapdh. Unpaired t-test was performed throughout where ***, p≤0.001; **, p≤0.01; *, p≤0.05; and ns, p>0.05 is not significant.
Figure 2—figure supplement 1
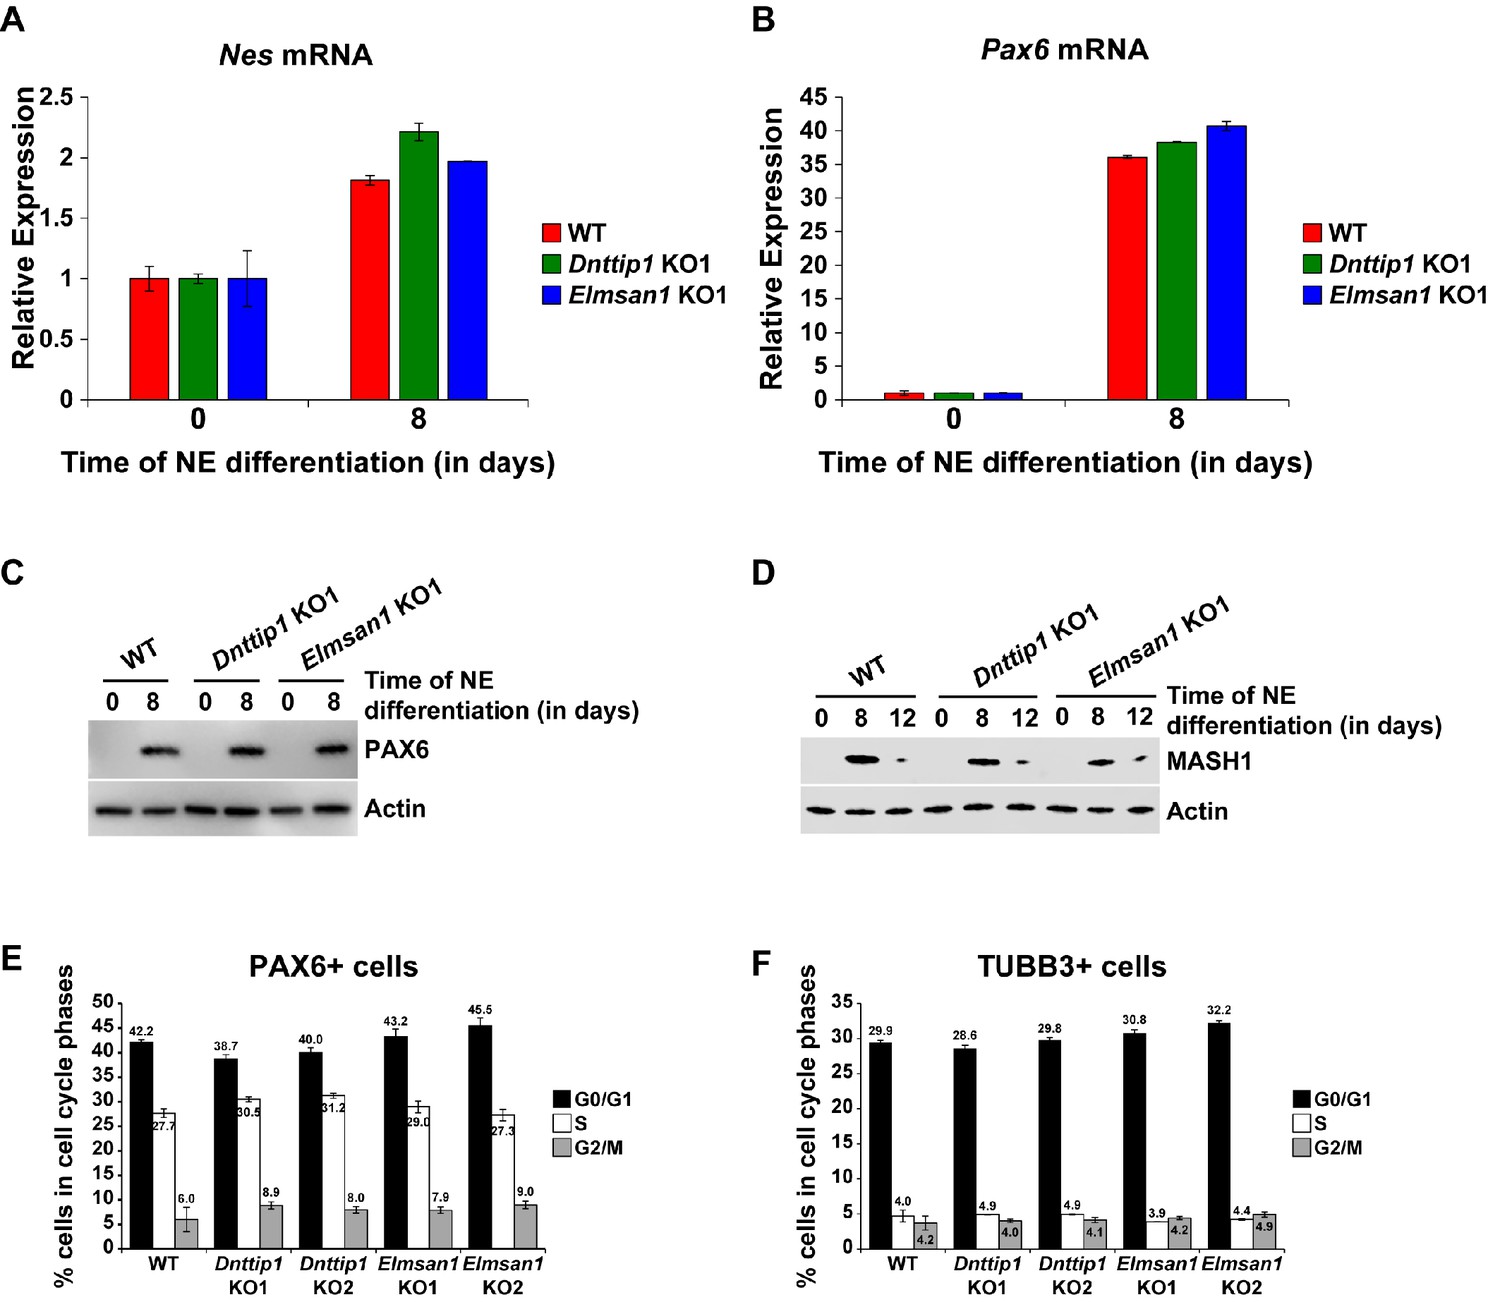
Loss of MiDAC function does not alter the differentiation and cell cycle distribution of neural progenitor cells.
(A, B) qRT-PCR for (A) Nes and (B) Pax6 mRNA in WT, Dnttip1 KO1 and Elmsan1 KO1 mESCs and NE after 8 days of differentiation. Expression was normalized to Gapdh. (C, D) WB for (C) PAX6 and (D) MASH1 from total cell lysates of WT, Dnttip1 KO1 and Elmsan1 KO1 mESCs and NE after (C) 8 days and (D) 8 and 12 days of differentiation. Actin is the loading control. (E, F) Cell cycle distribution of (E) PAX6 positive and (F) TUBB3 positive cells of WT, Dnttip1 KO (KO1 and KO2) and Elmsan1 KO (KO1 and KO2) NE after (E) 8 and (F) 12 days of differentiation. Black: G0/G1 phase. White: S phase. Gray: M phase.
Figure 3 with 1 supplement
MiDAC binds to and modulates the expression of genes that regulate neural differentiation and neurite outgrowth.
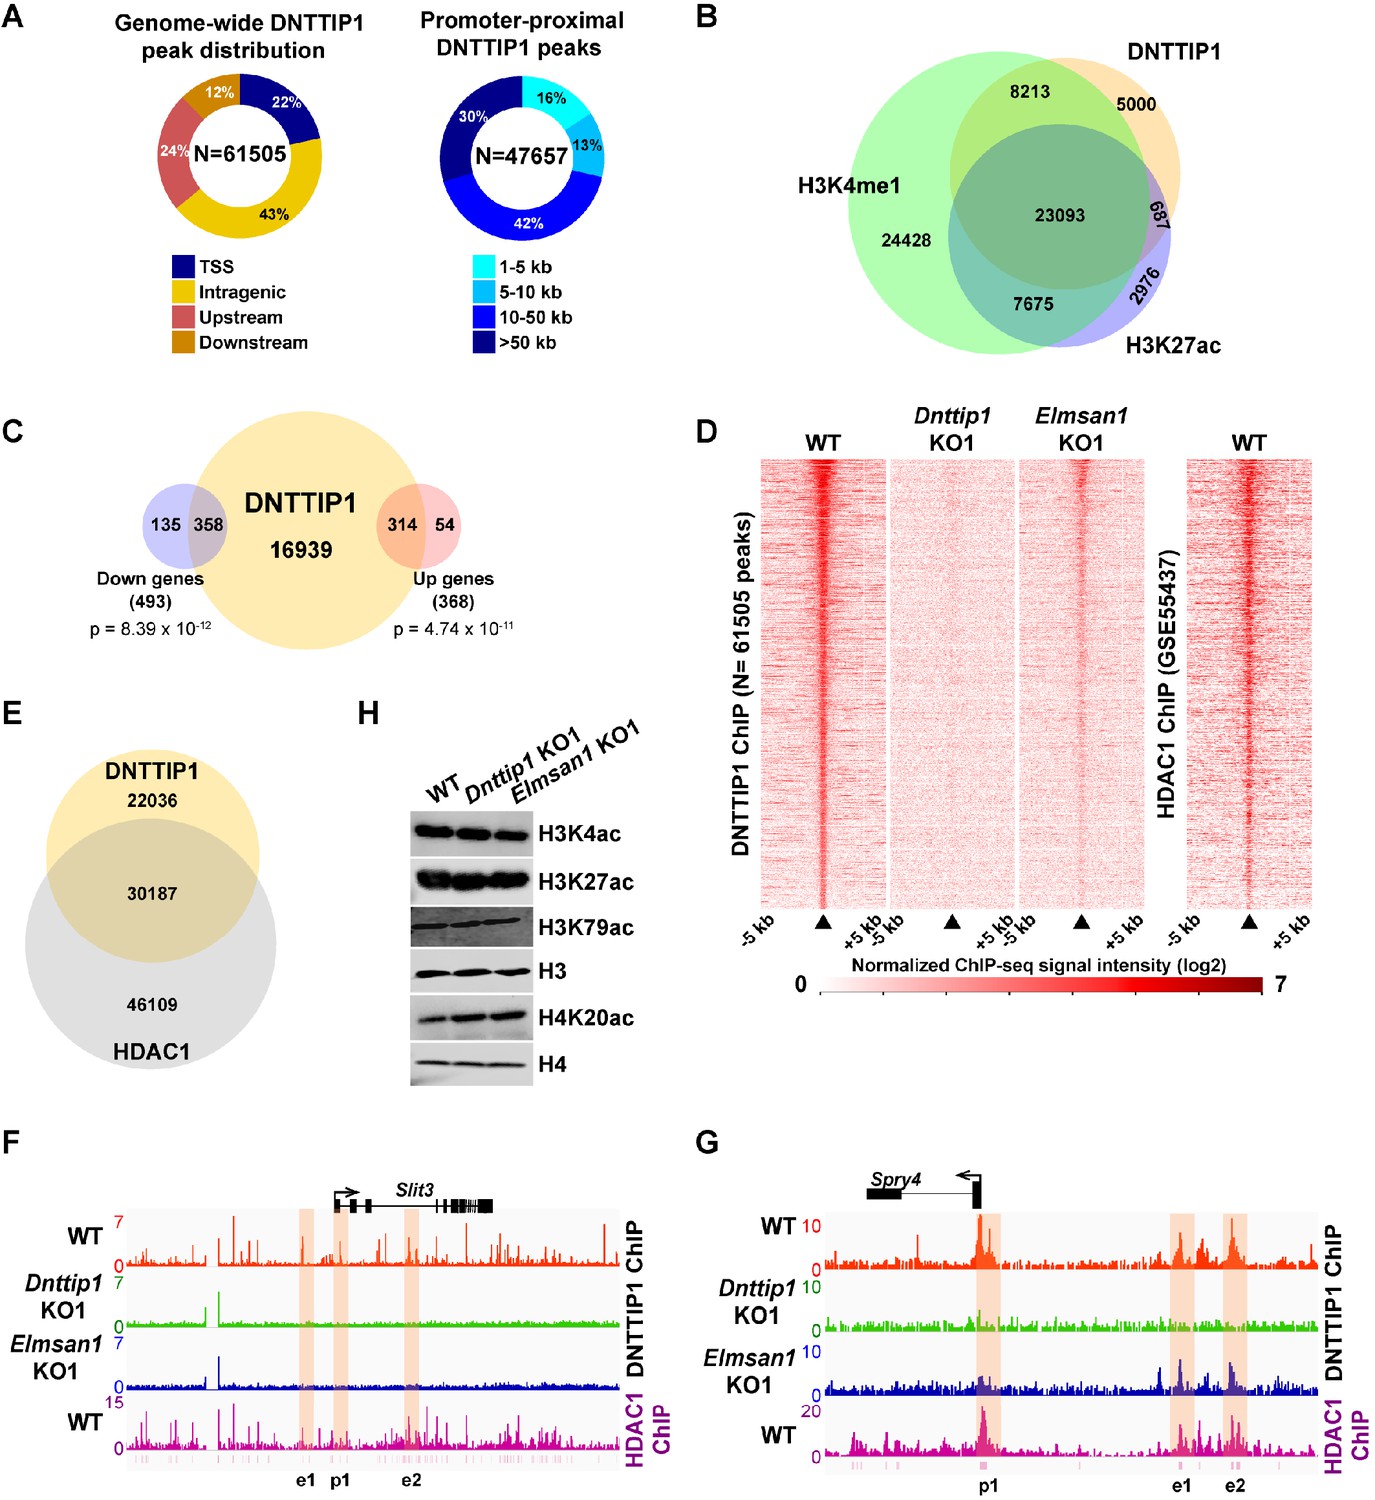
(A) Pie charts displaying the genome-wide distribution (left) and promoter distal distribution (right) of DNTTIP1 in WT mESCs. DNTTIP1 peaks within 1 kb of the transcription start site (TSS) were assigned to TSS. (B) Venn Diagram depicting the overlap between DNTTIP1, H3K4me1 and H3K27ac peaks in WT mESCs. (C) Venn diagram showing the number of downregulated and upregulated genes in Dnttip1 KO (KO1 and KO2) versus WT mESCs that are bound by DNTTIP1 in WT mESCs. (D) Heatmaps displaying the genome-wide distribution of all DNTTIP1 binding sites in WT, Dnttip1 KO1 and Elmsan1 KO1 mESCs sorted by enrichment in descending order in WT mESCs and compared to HDAC1 occupancy in WT mESCs. The color scale depicts the normalized ChIP-seq signal intensity (log2 CPM per 20 bp bin). (E) Venn diagram showing the co-occupancy between DNTTIP1 and HDAC1 peaks in WT mESCs. (A–E) DNTTIP1, H3K4me1 and H3K27ac ChIP-seq peaks were determined based on the average of two replicates each from WT mESCs and where applicable based on the average of two replicates each from Dnttip1 KO1 and Elmsan1 KO1 mESCs, respectively. HDAC1 ChIP-seq data were obtained from GSE55437. Downregulated and upregulated genes were determined based on two biological replicates each from WT mESCs and two Dnttip1 KO (KO1 and KO2) clones. (F, G) ChIP-seq profiles of the (F) Slit3 and (G) Spry4 loci for DNTTIP1 in WT, Dnttip1 KO1 and Elmsan1 KO1 mESCs and for HDAC1 in WT mESCs. Promoter and putative enhancer regions used for manual ChIP experiments in Figure 4 are highlighted by orange boxes. The track files depict the average of two ChIP-seq replicates each from WT mESCs and the average of two replicates each from the Dnttip1 KO1 and Elmsan1 KO1 clone, respectively. (H) WB for the specified histone acetylation marks from total cell lysates of WT, Dnttip1 KO1 and Elmsan1 KO1 mESCs. H3 and H4 are loading controls.
Figure 3—figure supplement 1
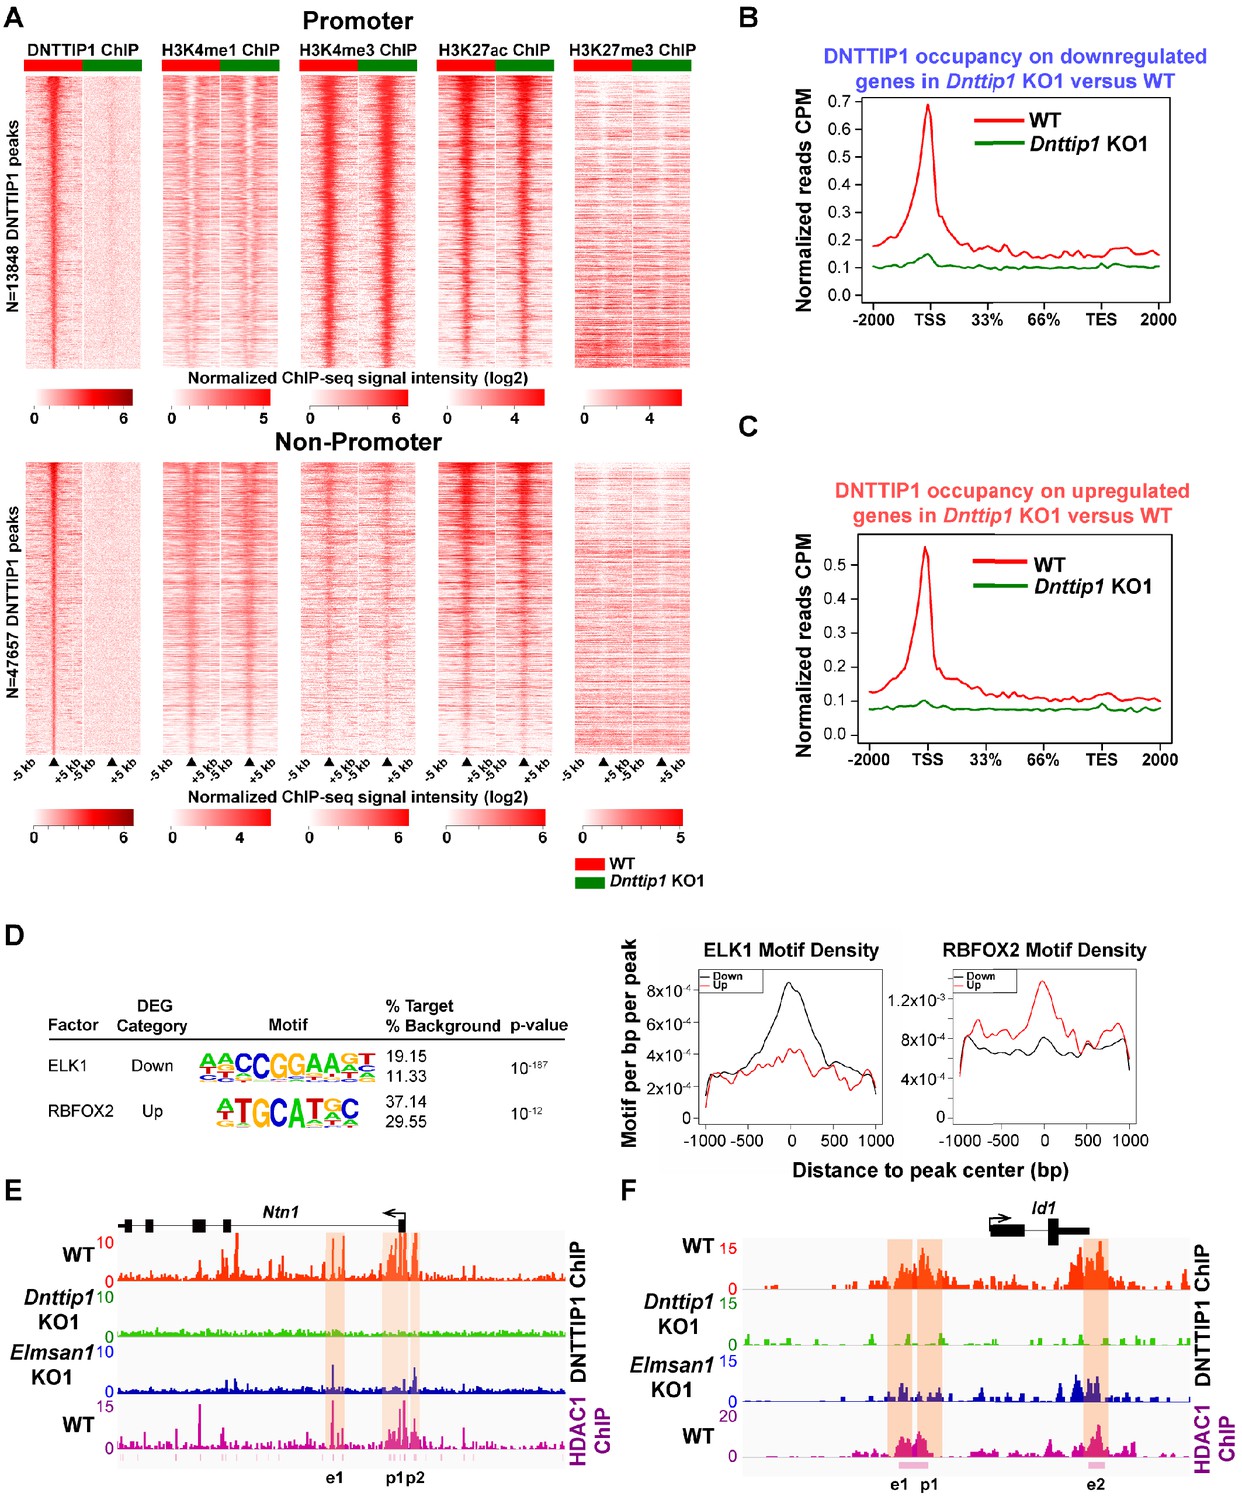
MiDAC binds to and modulates the expression of genes that regulate neural differentiation and neurite outgrowth.
(A) Heatmaps displaying the genome-wide distribution of all DNTTIP1 binding sites on promoters (TSS) and promoter-distal elements in WT and Dnttip1 KO1 mESCs sorted by enrichment in descending order in WT mESCs and compared to H3K4me1, H3K4me3, H3K27ac and H3K27me3 occupancy in WT and Dnttip1 KO1 mESCs. The color scale depicts the normalized ChIP-seq signal intensity (log2 CPM per 20 bp bin). (B, C) Occupancy plots displaying the average DNTTIP1 enrichment over gene bodies stratified by (B) transcriptionally down- (FC <−1.5, p<0.01) or (C) upregulated (FC >1.5, p<0.01) genes in WT versus Dnttip1 KO1 mESCs. (D) De novo motif analysis of DNTTIP1-bound genes that are down- or upregulated in Dnttip1 KO1 versus WT mESCs with motif-enrichment plots for ELK1 and RBFOX2. (E, F) ChIP-seq profiles of the (E) Ntn1 and (F) Id1 loci for DNTTIP1 in WT, Dnttip1 KO1 and Elmsan1 KO1 mESCs and for HDAC1 in WT mESCs. Promoter and putative enhancer regions used for manual ChIP experiments Figure 4—figure supplement 1 are highlighted by orange boxes. (A–F) Enrichment of DNTTIP1, H3K4me1, H3K4me3, H3K27ac, H3K27me3 and motif density was determined based on the average of two ChIP-seq replicates each from WT mESCs and where applicable based on the average of two replicates each from the Dnttip1 KO1 and Elmsan1 KO1 clone, respectively. HDAC1 ChIP-seq data were obtained from GSE55437.
Figure 4 with 2 supplements
MiDAC directly targets positive and negative regulators of neurite outgrowth during neural differentiation.
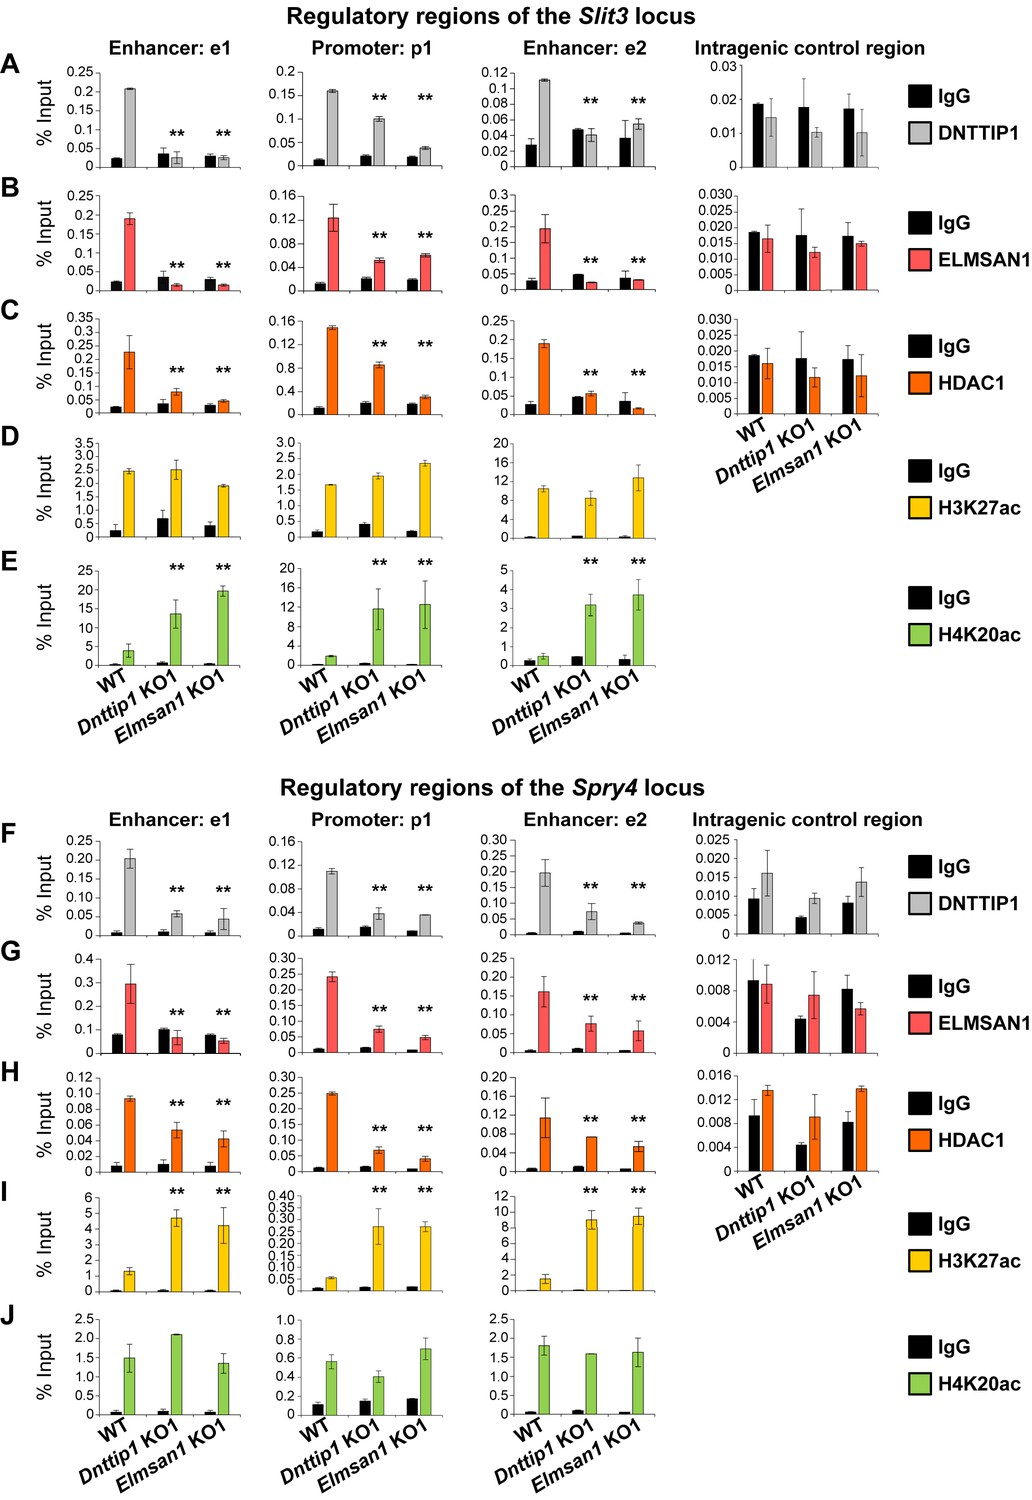
(A–J) qPCR from manual ChIP experiments against (A, F) DNTTIP1, (B, G) ELMSAN1, (C, H) HDAC1, (D, I) H3K27ac and (E, J) H4K20ac from WT, Dnttip1 KO1 and Elmsan1 KO1 NE targeting select promoter, putative enhancer and intragenic control regions of (A–E) Slit3 or (F-J) Spry4 loci as highlighted in Figure 3F and G. IgG was used as a control antibody. Unpaired t-test was performed throughout where **, p≤0.01; and ns, p>0.05 is not significant.
Figure 4—figure supplement 1
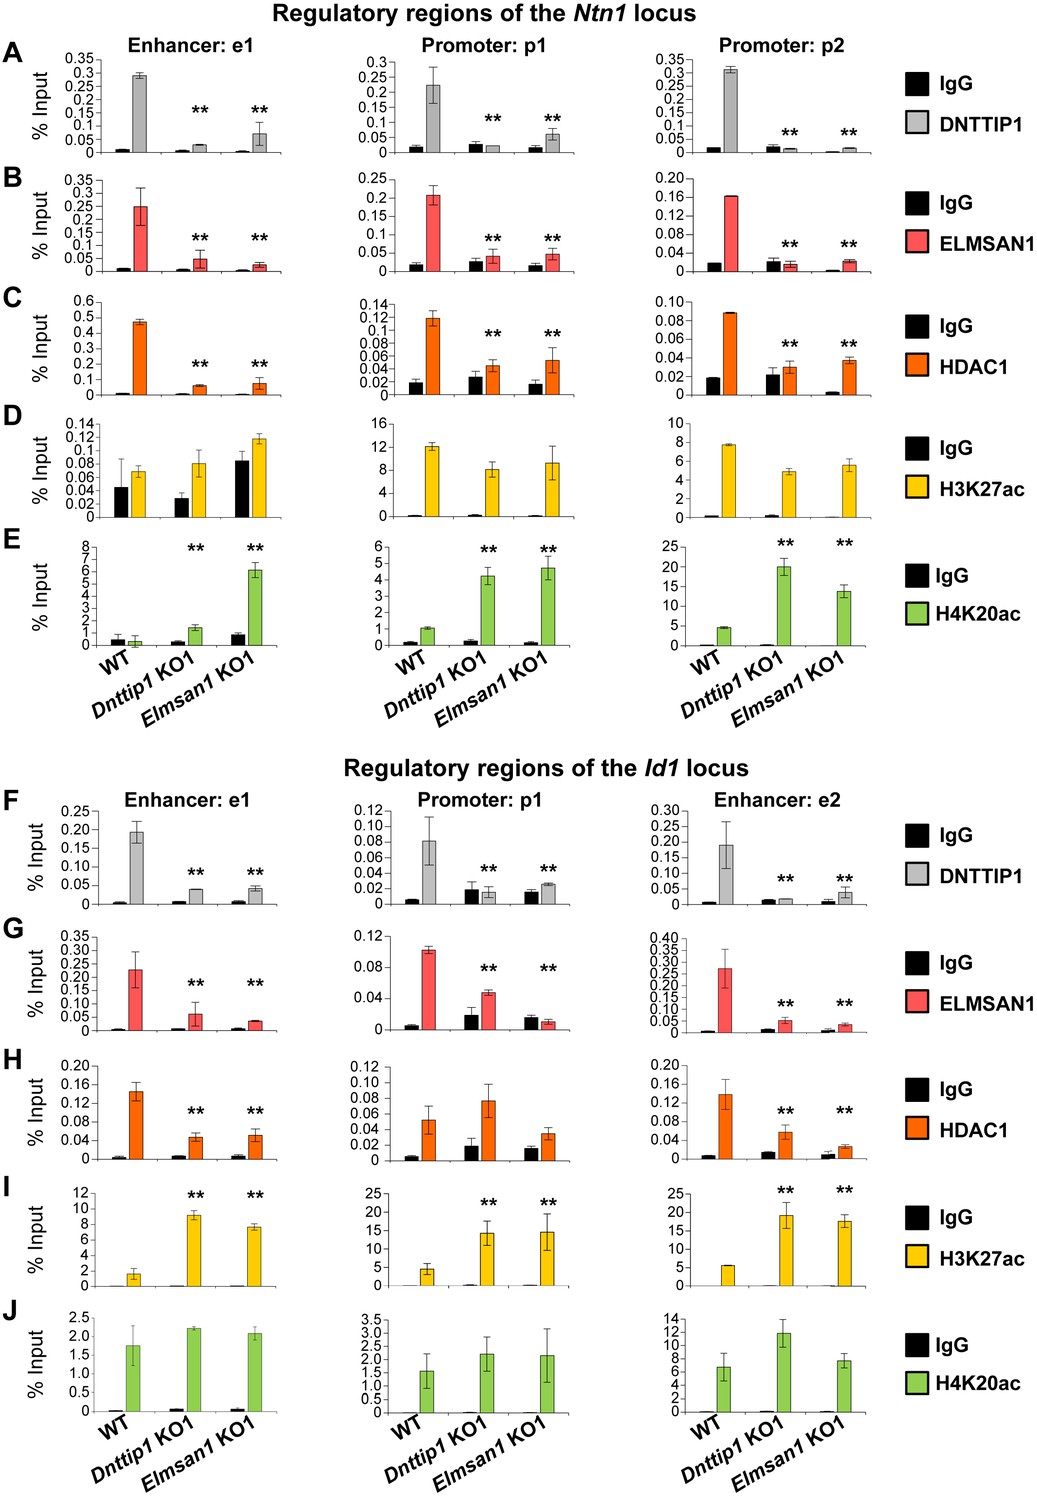
MiDAC directly targets positive and negative regulators of neurite outgrowth during neural differentiation.
(A–J) qPCR from manual ChIP experiments against (A, F) DNTTIP1, (B, G) ELMSAN1, (C, H) HDAC1, (D, I) H3K27ac and (E, J) H4K20ac from WT, Dnttip1 KO1 and Elmsan1 KO1 NE targeting select promoter, putative enhancer and intragenic control regions of (A–E) the Ntn1 or (F-J) the Id1 loci as highlighted in Figure 3—figure supplement 1E and F. IgG was used as a control antibody. Unpaired t-test was performed throughout where **, p≤0.01; and ns, p>0.05 is not significant.
Figure 4—figure supplement 2
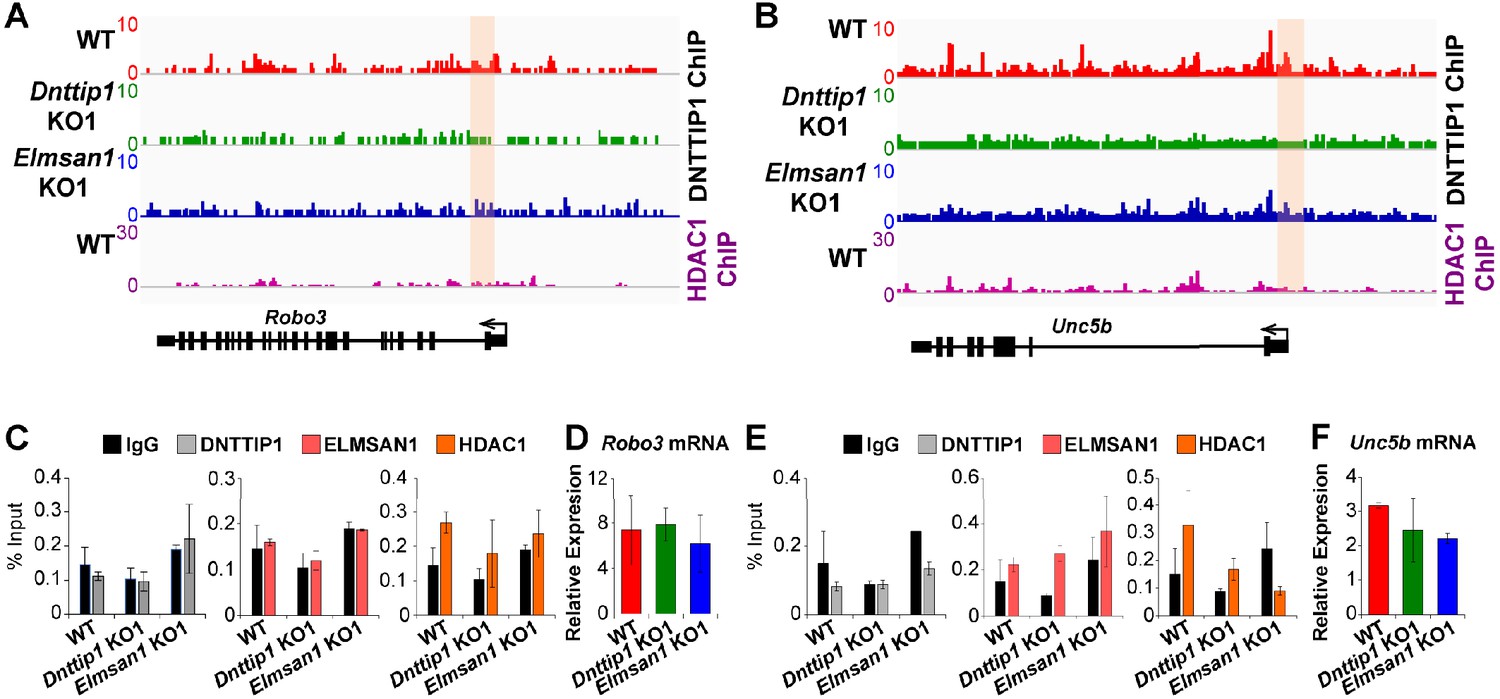
MiDAC does not transcriptionally regulate the genes of the ROBO3 and UNC5B receptors of the SLIT3 and NTN1 signaling pathways.
(A, B) ChIP-seq profiles of the (A) Robo3 and (B) Unc5b loci for DNTTIP1 in WT, Dnttip1 KO1 and Elmsan1 KO1 mESCs and for HDAC1 in WT mESCs. Promoter regions used for manual ChIP experiments in (C) and (E) are highlighted by orange boxes. DNTTIP1 ChIP-seq peaks were determined based on the average of two replicates each from WT mESCs and based on the average of two replicates each from the Dnttip1 KO1 and Elmsan1 KO1 clone, respectively. HDAC1 ChIP-seq data were obtained from GSE55437. (C) qPCR from manual ChIP experiments against DNTTIP1, ELMSAN1 and HDAC1 from WT, Dnttip1 KO1 and Elmsan1 KO1 NE targeting the promoter of the Robo3 locus as highlighted in (A). IgG was used as a control antibody. (D) qRT-PCR for Robo3 mRNA in WT, Dnttip1 KO1 and Elmsan1 KO1 NE after 12 days of differentiation. Expression was normalized to Gapdh. (E) qPCR from manual ChIP experiments against DNTTIP1, ELMSAN1 and HDAC1 from WT, Dnttip1 KO1 and Elmsan1 KO1 NE targeting the promoter of the Unc5b locus as highlighted in (B). IgG was used as a control antibody. (F) qRT-PCR for Unc5b mRNA in WT, Dnttip1 KO1 and Elmsan1 KO1 NE after 12 days of differentiation. Expression was normalized to Gapdh.
Figure 5 with 1 supplement
The regulatory role of MiDAC in neural differentiation and neurite outgrowth is carried out in part by secreted components.
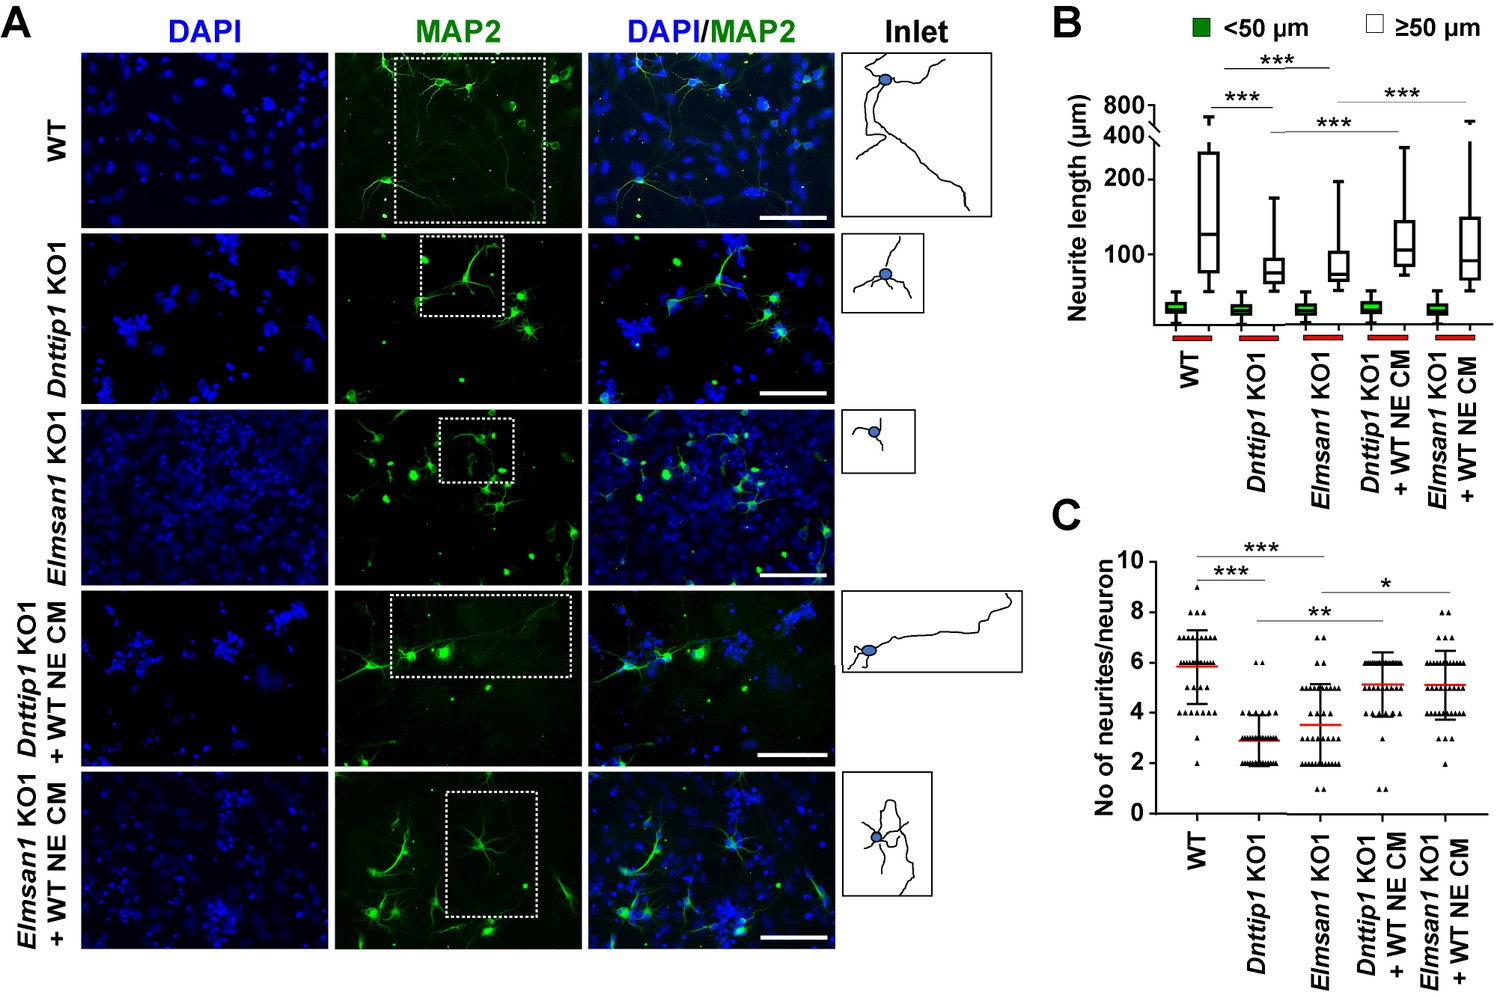
(A) MAP2 IF staining after 12 days of differentiation performed on WT, Dnttip1 KO1 and Elmsan1 KO1 NE supplemented daily with conditioned medium (CM) of WT NE from day 7–12. Nuclei were stained with DAPI. For analysis the neuronal cell body (blue) and its neurites (black) were manually traced with ImageJ software and for each sample one traced neuron is displayed in the inlet. The white scale bar represents 50 µm. (B, C) Quantification of (B) neurite length and (C) the total number of neurites per neuron from the MAP2 IF staining in (A) using ImageJ. (B) Neurite length was divided into two categories of short neurites <50 µm (green box plots) and longer neurites ≥50 µm (white box plots). (B, C) The neurites of 200 neurons were assessed per sample. One-way ANOVA was performed throughout where ***, p≤0.001; **, p≤0.01; and *, p≤0.05.
Figure 5—figure supplement 1
The regulatory role of MiDAC in neural differentiation and neurite outgrowth is carried out in part by secreted components.
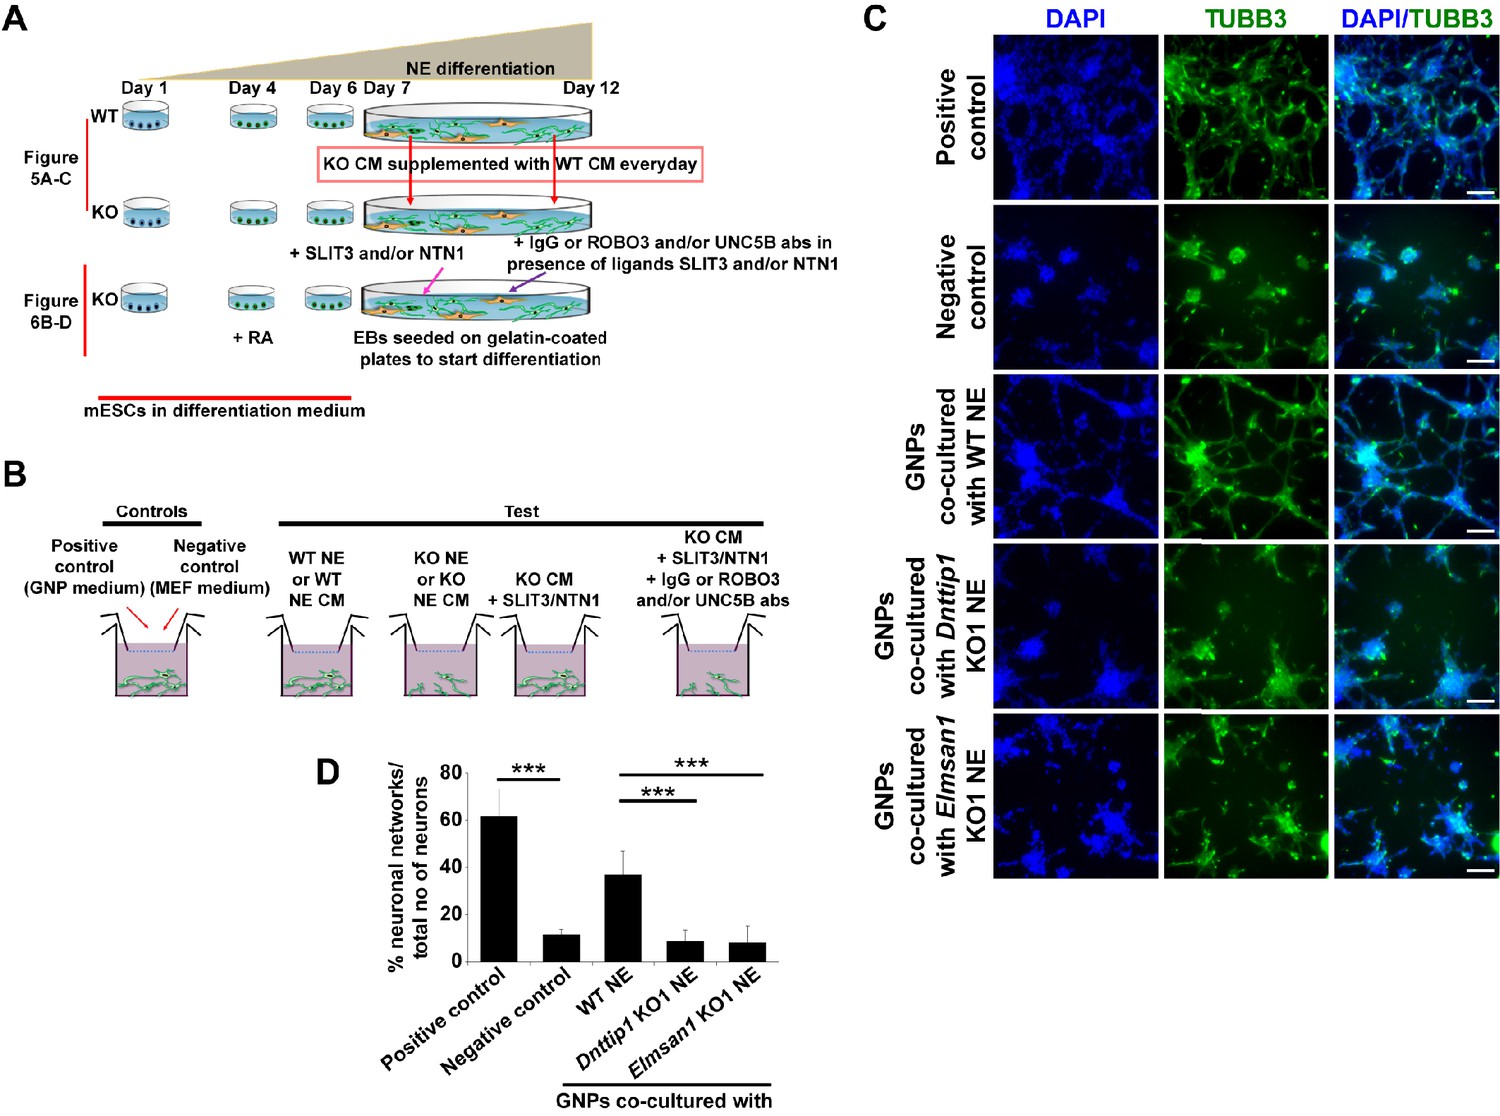
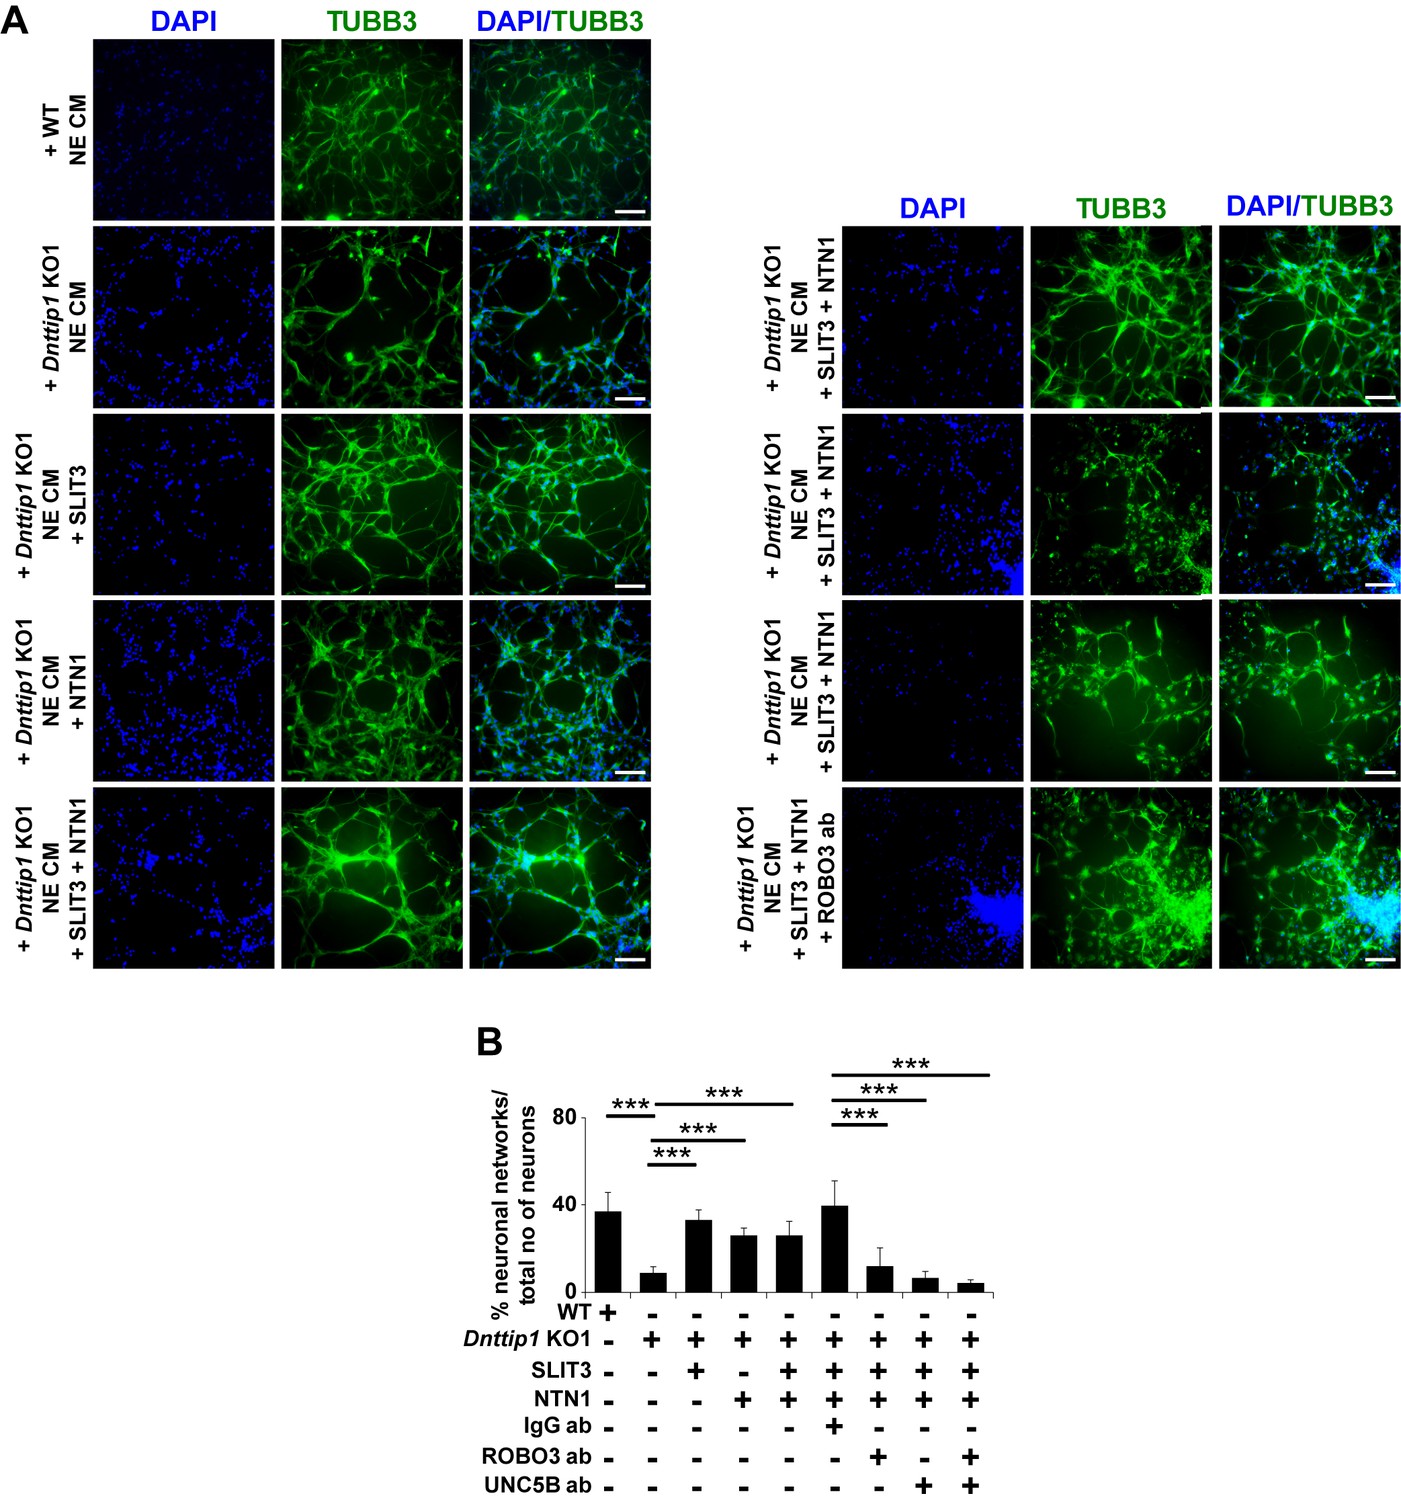
(A) Experimental outline of assay to rescue neurite outgrowth defects in Dnttip1 KO1 or Elmsan1 KO1 NE as described in Figures 5A–C and 6B–D. (B) Experimental outline of the chamber assay to rescue the neuronal network formation defects of granule neuron progenitor (GNP)-derived neurons co-cultured with Dnttip1 KO1 or Elmsan1 KO1 NE as described in (C) and (D) or CM of Dnttip1 KO1 or Elmsan1 KO1 NE as described in Figure 6—figure supplement 1A and B. (C) Chamber assay utilizing GNPs that were co-cultured in the lower chamber in parallel with differentiating WT, Dnttip1 KO1 or Elmsan1 KO1 NE in the upper chamber comprising a time window from day 7–12 of differentiation to induce neuronal network formation from GNPs. Defined differentiation-inducing GNP medium was used as a positive and CM from mouse embryonic fibroblasts (MEFs) as a negative control. TUBB3 IF staining of GNP-derived neuronal networks was performed after 6 days of differentiation. Nuclei were stained with DAPI. The white scale bar represents 100 µm. (D) Quantification of neuronal network formation from the TUBB3 IF staining in (C) using ImageJ. The percentage of formed neuronal networks within the total population of TUBB3-positive neurons is displayed. A neuronal network was scored when a closed local circuit was detected around an individual neuron. Neuronal network formation was assessed for 100 neurons per sample in triplicate.
Figure 6 with 1 supplement
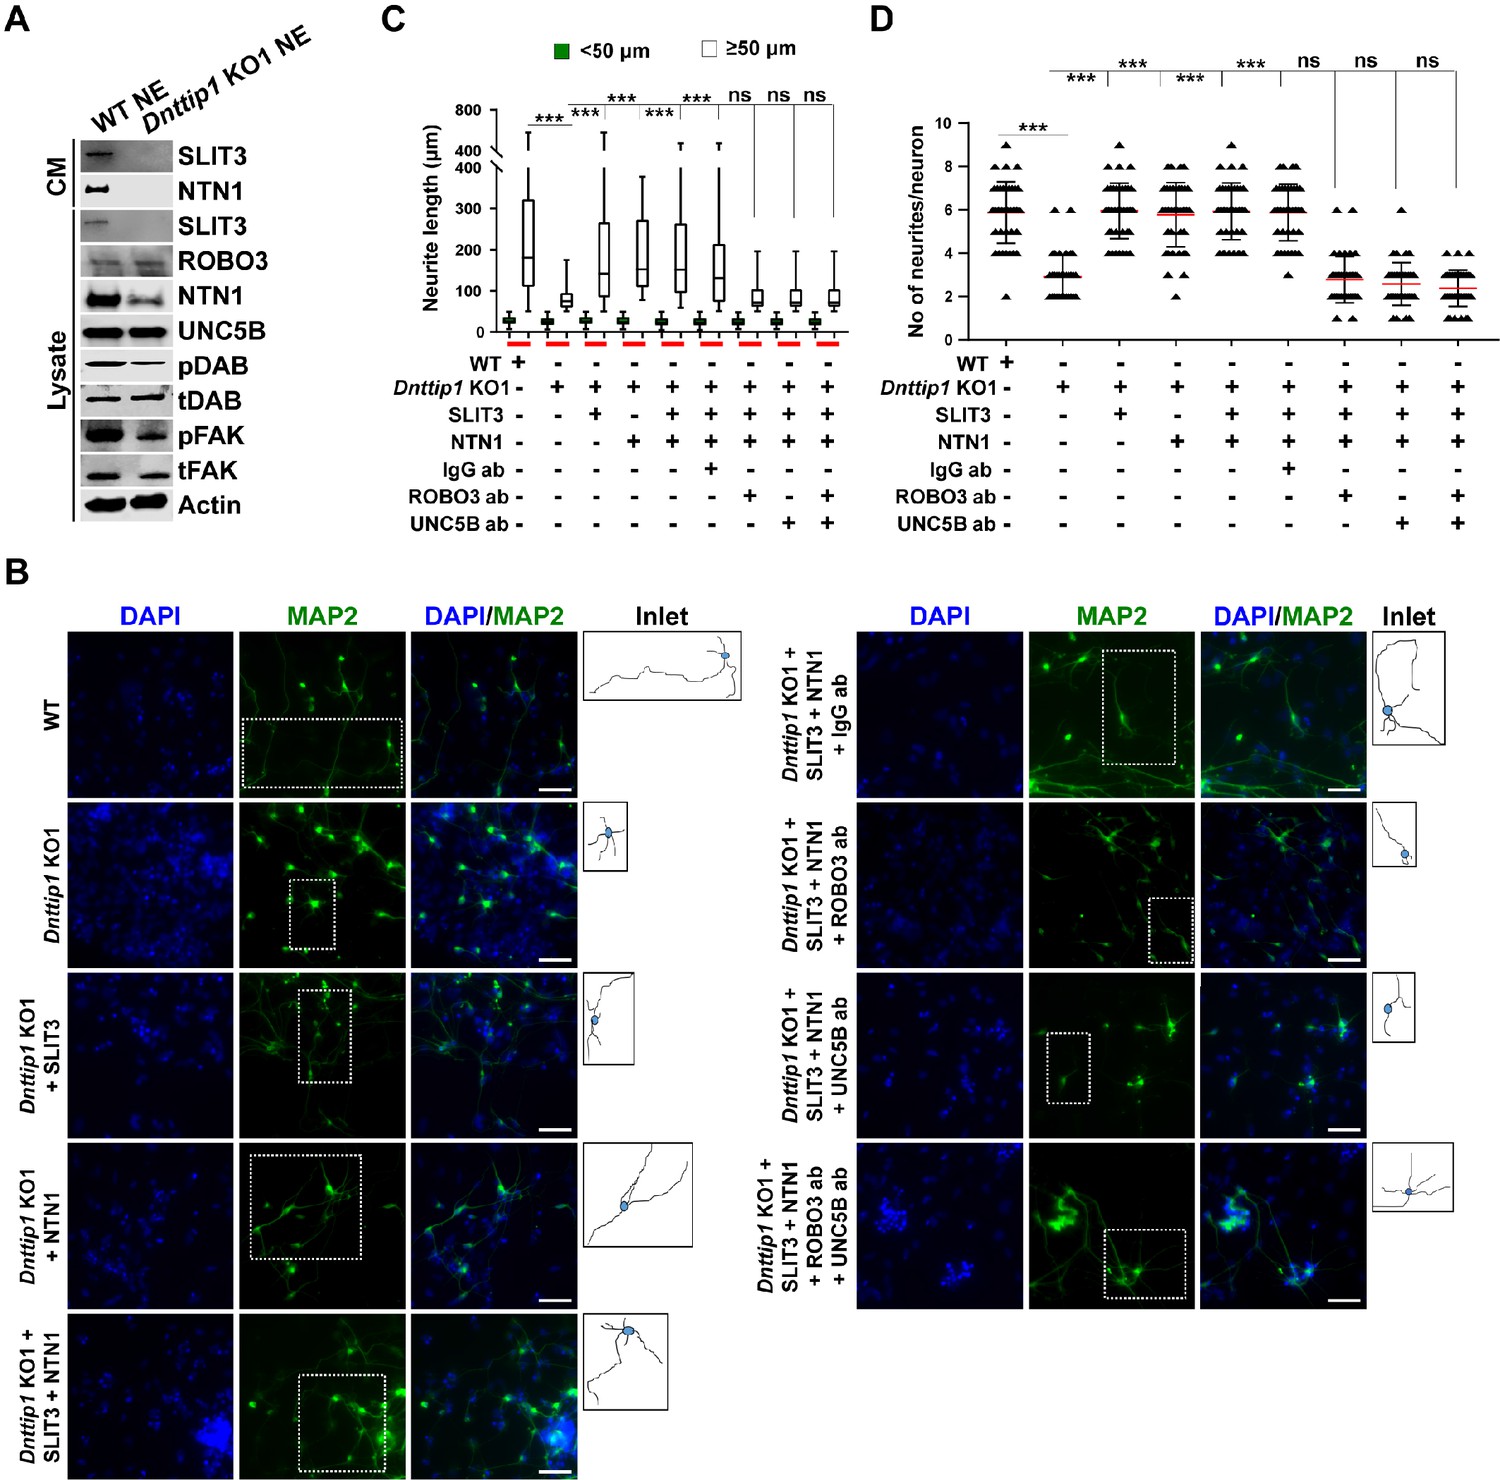
MiDAC regulates neurite outgrowth via the SLIT3/ROBO3 and NTN1/UNC5B signaling pathways.
(A) WB for signaling components of the SLIT3/ROBO3 and NTN1/DCC/UNC5B signaling axes from CM and total cell lysates of WT and Dnttip1 KO1 NE after 12 days of differentiation. To enrich SLIT3 and NTN1 from CM, IPs were performed with SLIT3 and NTN1 antibodies from CM of WT and Dnttip1 KO1 NE. Actin is the loading control for the total cell lysates. (B) Assay to rescue the neurite outgrowth defects in Dnttip1 KO1 NE. CM of Dnttip1 KO1 NE was supplemented with the recombinant signaling ligands SLIT3 and/or NTN1 from day 7–12 without or with preblocking of Dnttip1 KO1 NE with IgG or signaling receptor antibodies against ROBO3 and/or UNC5B. MAP2 IF staining was performed after 12 days of differentiation. Nuclei were stained with DAPI. To facilitate analysis the neuronal cell body (blue) and its neurites were manually traced with ImageJ software and for each sample one traced neuron is displayed in the inlet. The white scale bar represents 50 µm. (C, D) Quantification of (C) neurite length and (D) the total number of neurites per neuron from the MAP2 IF staining in (B) using ImageJ. (C) Neurite length was divided into two categories of short neurites <50 µm (green box plots) and longer neurites ≥50 µm (white box plots). (C, D) The neurites of 200 neurons were assessed per sample. One-way ANOVA was performed throughout where ***, p≤0.001; and ns, p>0.05 is not significant.
Figure 6—figure supplement 1
MiDAC regulates neurite outgrowth via the SLIT3/ROBO3 and NTN1/UNC5B signaling pathways.
(A) Chamber assay to rescue the network formation defects of GNP-derived neurons that were supplemented with CM of Dnttip1 KO1 NE. CM of Dnttip1 KO1 NE was supplemented with the recombinant signaling ligands SLIT3 and/or NTN1 from day 7–12 without or with pre-blocking of GNP-derived neurons with control IgG or signaling receptor antibodies against ROBO3 and/or UNC5B. TUBB3 IF staining was performed after 12 days of differentiation. Nuclei were stained with DAPI. The white scale bar represents 100 µm. (B) Quantification of neuronal network formation from the TUBB3 IF staining in (A) using ImageJ. The percentage of formed neuronal networks within the total population of TUBB3-positive neurons is displayed. A neuronal network was scored when a closed local circuit was detected around an individual neuron. Neuronal network formation was assessed for 100 neurons per sample in triplicate. Unpaired t-test was performed throughout where ***, p≤0.01.
Figure 7
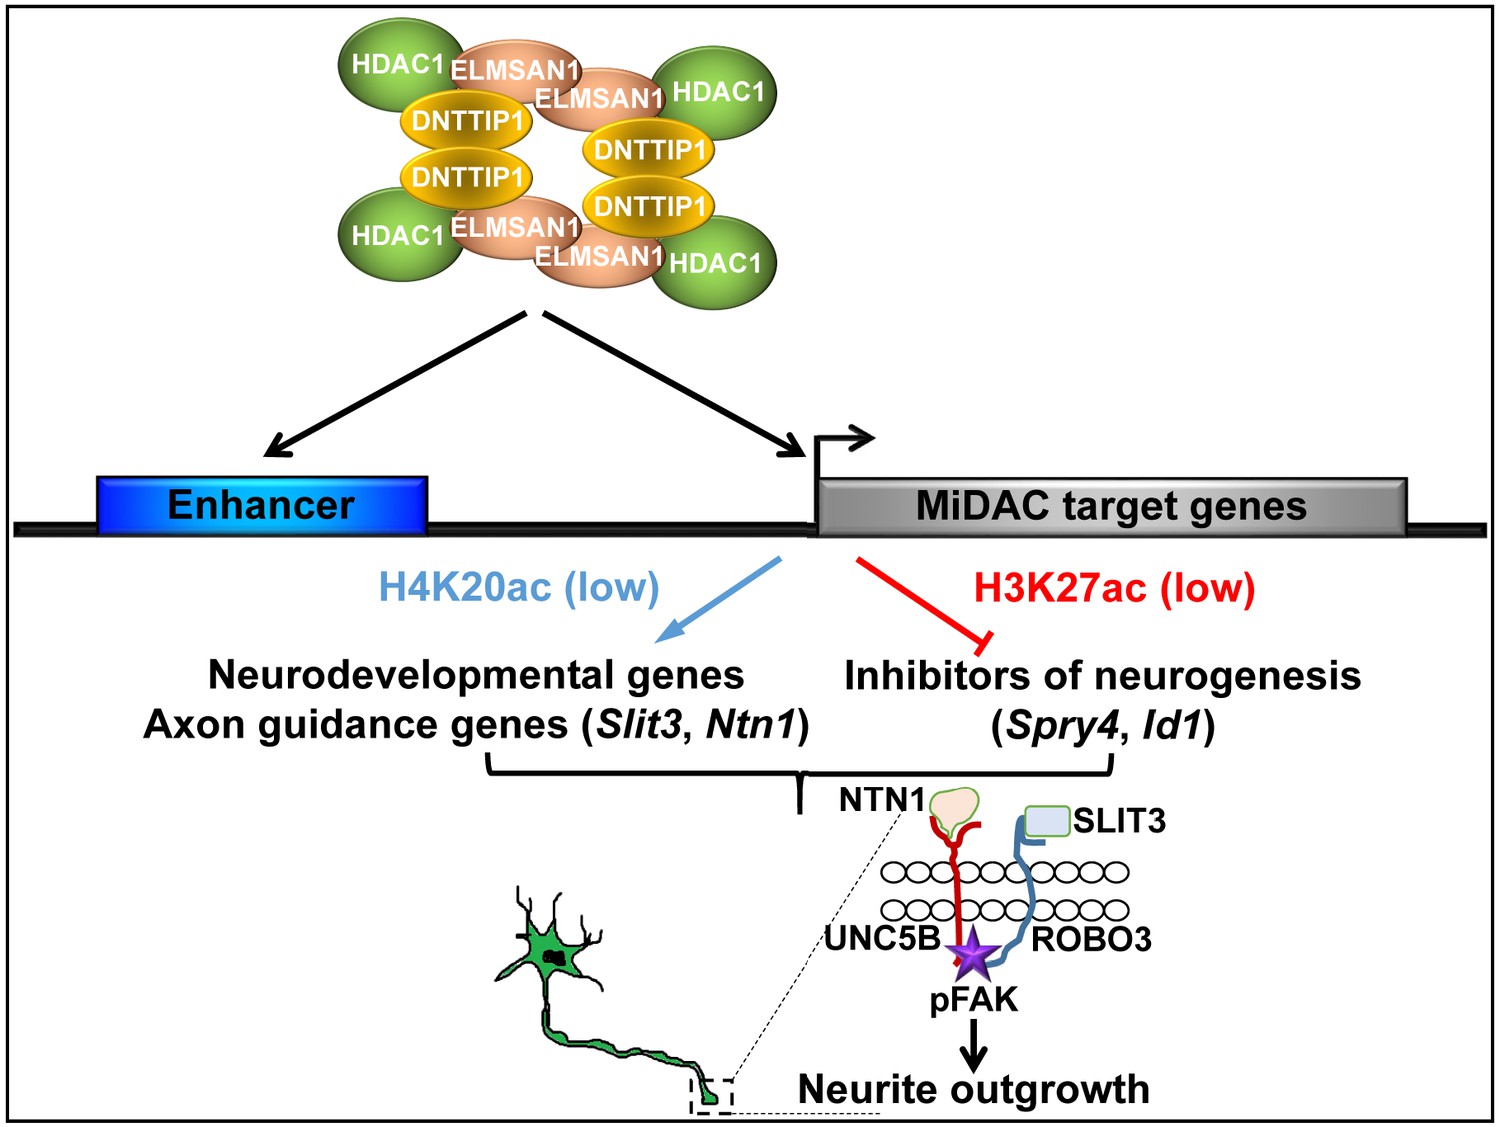
Model of MiDAC function in neurite outgrowth and morphogenesis.
MiDAC directly binds to and deacetylates H4K20ac on regulatory elements of pro-neural genes such as those of the axon guidance ligands SLIT3 and NTN1 resulting in the activation of these genes. Conversely, MiDAC inhibits the gene expression of negative regulators of neurogenesis such as SPRY4 and ID1 by binding and removing H3K27ac from their promoters and enhancers. SLIT3 and NTN1, the downstream targets of MiDAC, bind to their cognate receptors ROBO3 and UNC5B respectively thereby activating the signaling cascade responsible for promoting neurite outgrowth.
Additional files
-
Supplementary file 1
List of guide RNA and deep sequencing primer sequences used for CRISPR/Cas9-mediated genome editing of Dnttip1 and Elmsan1 in mESCs.
- https://cdn.elifesciences.org/articles/57519/elife-57519-supp1-v3.docx
-
Supplementary file 2
Differentially expressed genes in Dnttip1 KO (KO1 and KO2) and Elmsan1 KO (KO1 and KO2) mESCs (FC ≤−1.5 or ≥1.5; p-value<0.01) (MS Excel spreadsheets).
- https://cdn.elifesciences.org/articles/57519/elife-57519-supp2-v3.xlsx
-
Supplementary file 3
DNTTIP1 binding sites identified by ChIP-seq in mESCs (MS Excel spreadsheet).
- https://cdn.elifesciences.org/articles/57519/elife-57519-supp3-v3.xlsx
-
Supplementary file 4
Genes that are up- or downregulated in Dnttip1 KO (KO1 and KO2) versus WT mESCs (FC ≤−1.5 or ≥1.5; p-value<0.01 except for Spry4) and bound by DNTTIP1 (MS Excel spreadsheet).
- https://cdn.elifesciences.org/articles/57519/elife-57519-supp4-v3.xlsx
-
Supplementary file 5
List of primer sequences used for qRT-PCR analysis.
- https://cdn.elifesciences.org/articles/57519/elife-57519-supp5-v3.docx
-
Supplementary file 6
List of primer sequences used for ChIP qPCR analysis.
- https://cdn.elifesciences.org/articles/57519/elife-57519-supp6-v3.docx
-
Transparent reporting form
- https://cdn.elifesciences.org/articles/57519/elife-57519-transrepform-v3.docx
Download links
A two-part list of links to download the article, or parts of the article, in various formats.
Downloads (link to download the article as PDF)
Open citations (links to open the citations from this article in various online reference manager services)
Cite this article (links to download the citations from this article in formats compatible with various reference manager tools)
The histone deacetylase complex MiDAC regulates a neurodevelopmental gene expression program to control neurite outgrowth
eLife 9:e57519.
https://doi.org/10.7554/eLife.57519


