The role of the NMD factor UPF3B in olfactory sensory neurons
- Department of Obstetrics, Gynecology, and Reproductive Sciences, School of Medicine University of California, San Diego, United States
- Department of Bioengineering, University of California, San Diego, United States
- Department of Dermatology, University of California, San Diego, United States
- Division of Biological Sciences, University of California, San Diego, United States
- Institute of Genomic Medicine, University of California, San Diego, United States
Figures
Figure 1 with 2 supplements

Identification of UPF3B-regulated genes and NMD target genes in the olfactory system.
(A) The weight of Upf3b-null vs. WT (wild type) mice at the indicated time points. Upf3b-null mice gain weight slowly during postnatal development but then reach the weight of WT mice at the last time point (9 weeks), a pattern indicative of a partial olfactory defect. *, p<0.05. (B) qPCR analysis of olfactory marker genes in Upf3b-null and WT OE (n = 6). **, p<0.01; ****, p<0.0001. (C) Heatmap of genes differentially expressed in mOSNs from Upf3b-null (KO) vs. WT mice (four biological replicates from each are shown). Row names labeled as green are Olfr genes. Right, the most statistically significant GO terms associated with upregulated genes (top) and downregulated genes (bottom) after Upf3b loss. (D) A list of most statistically enriched GO terms associated with the 52 high-confidence UPF3B-dependent NMD target mRNAs we identified in mOSNs.
Figure 1—figure supplement 1
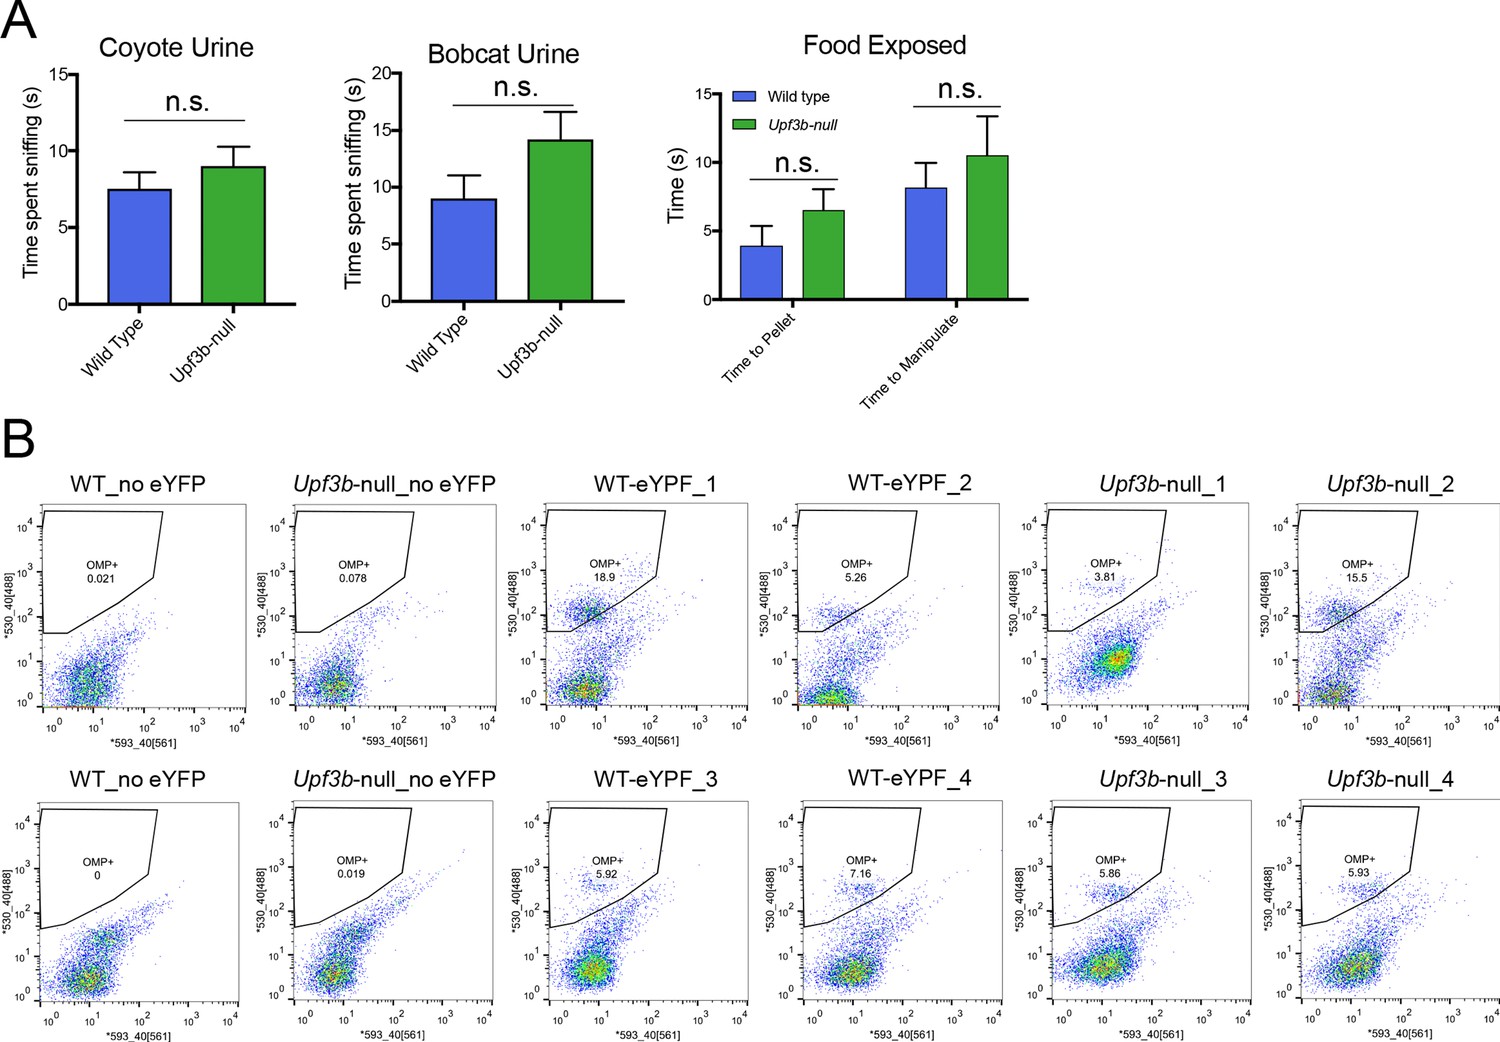
Upf3b-null mice behavior and purified mOSNs.
(A) Behavior analysis of Upf3b-null and control (wild type) mice in response to exposure to animal urine or food. (n = 10). (B) FACS plots of dissociated cells from Upf3b-null and control OEs used to purify Omp-eYPF+ cells for RNA-seq analysis. The y-axis measures YFP expression. For each sample, three male mice (8– to 9-weeks old) were pooled together for sorting. (n = 4).
Figure 1—figure supplement 2
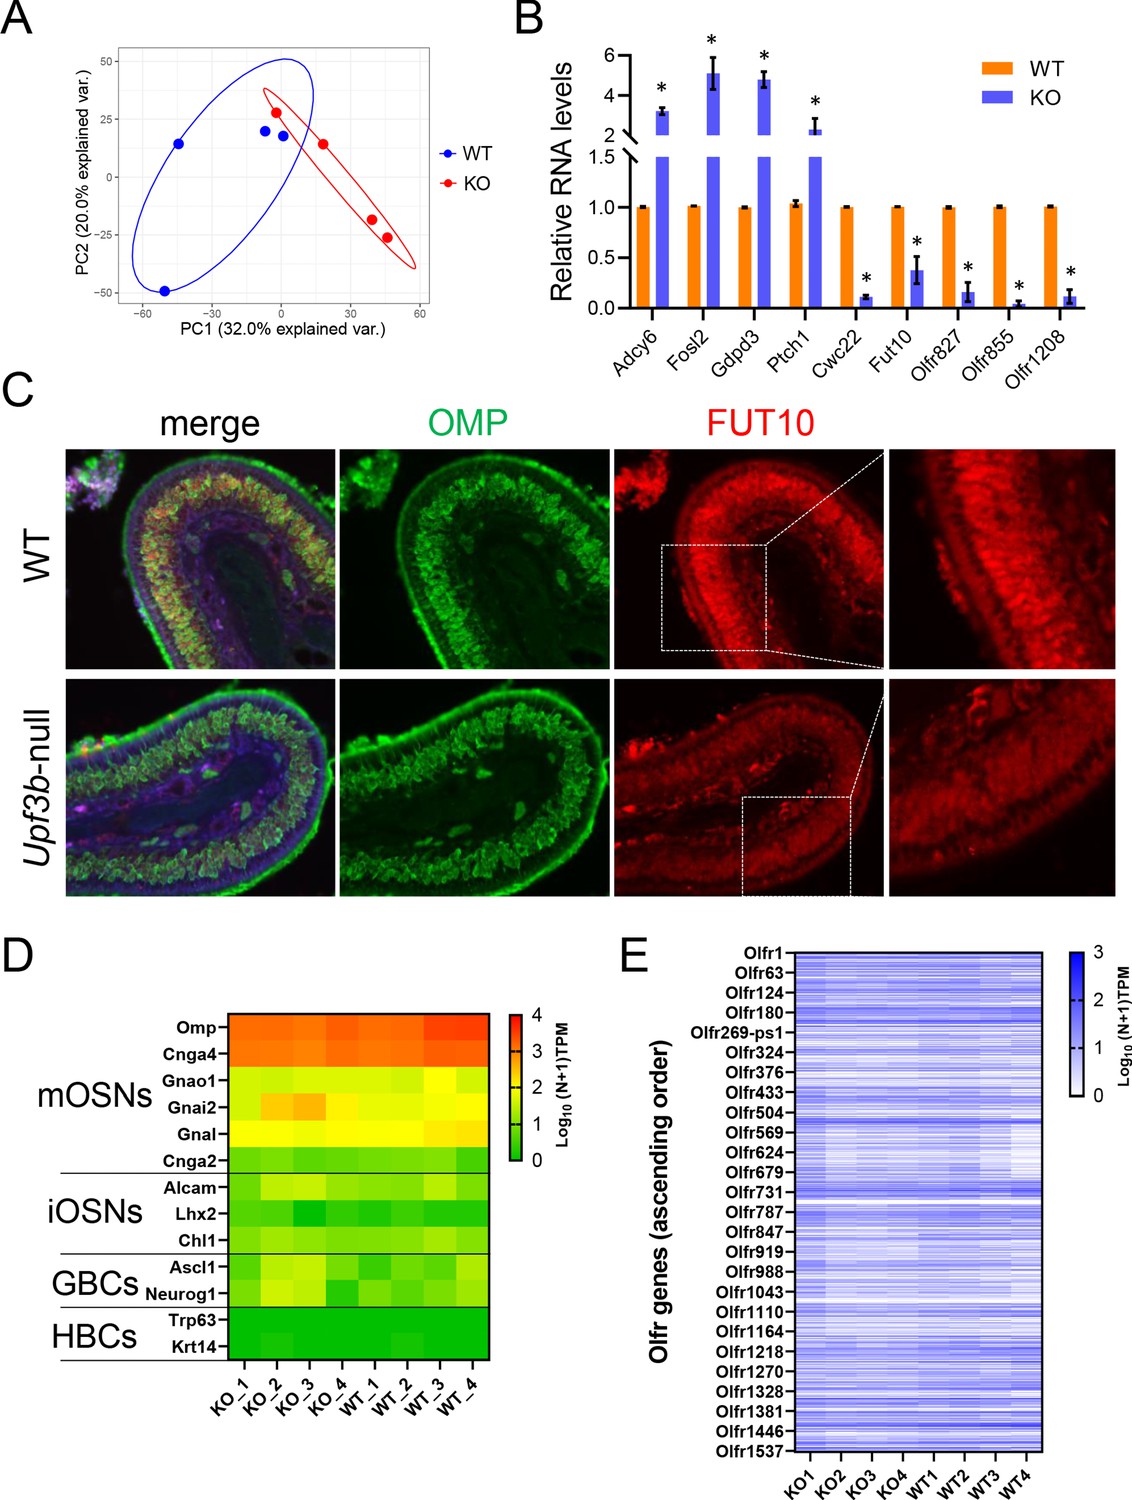
UPF3B-regulated genes in mOSNs.
(A) Principal component analysis of RNAseq datasets from Upf3b-null (KO) and control (WT) mOSNs. (B) qPCR validation of genes shown by RNA-seq analysis to be upregulated (Adcy6, Fosl2, Gdpd3, and Ptch1) or downregulated (Cw22, Fut10, Olfr827, Olfr855, and Olfr1208) in Upf3b-null mOSNs relative to control mOSNs. The genes were chosen on the basis of having known functions, including in neural development. (n = 3). *p<0.05. (C) Immunofluorescence analysis of OE sections from Upf3b-null and wild-type (WT) samples stained with FUT10 and OMP antibodies. FUT10 was chosen on the basis of having known roles in neural development. Nuclei were labeled with DAPI. (n = 3). (D) Heatmap showing the expression of canonical OSN precursor/OSN markers in the indicated Upf3b-null (KO) and control (WT) mOSN-enriched samples, based on RNA-seq analysis. RNA expression levels are represented on a log10 scale of TPM values plus one (0, not expressed; 4, highly expressed). (E) Heatmap showing the expression of all annotated Olfr genes (in ascending order) in the indicated mOSN-enriched samples. RNA expression levels are represented on a log10 scale of TPM values plus one (0, not expressed; 3, highly expressed).
Figure 2
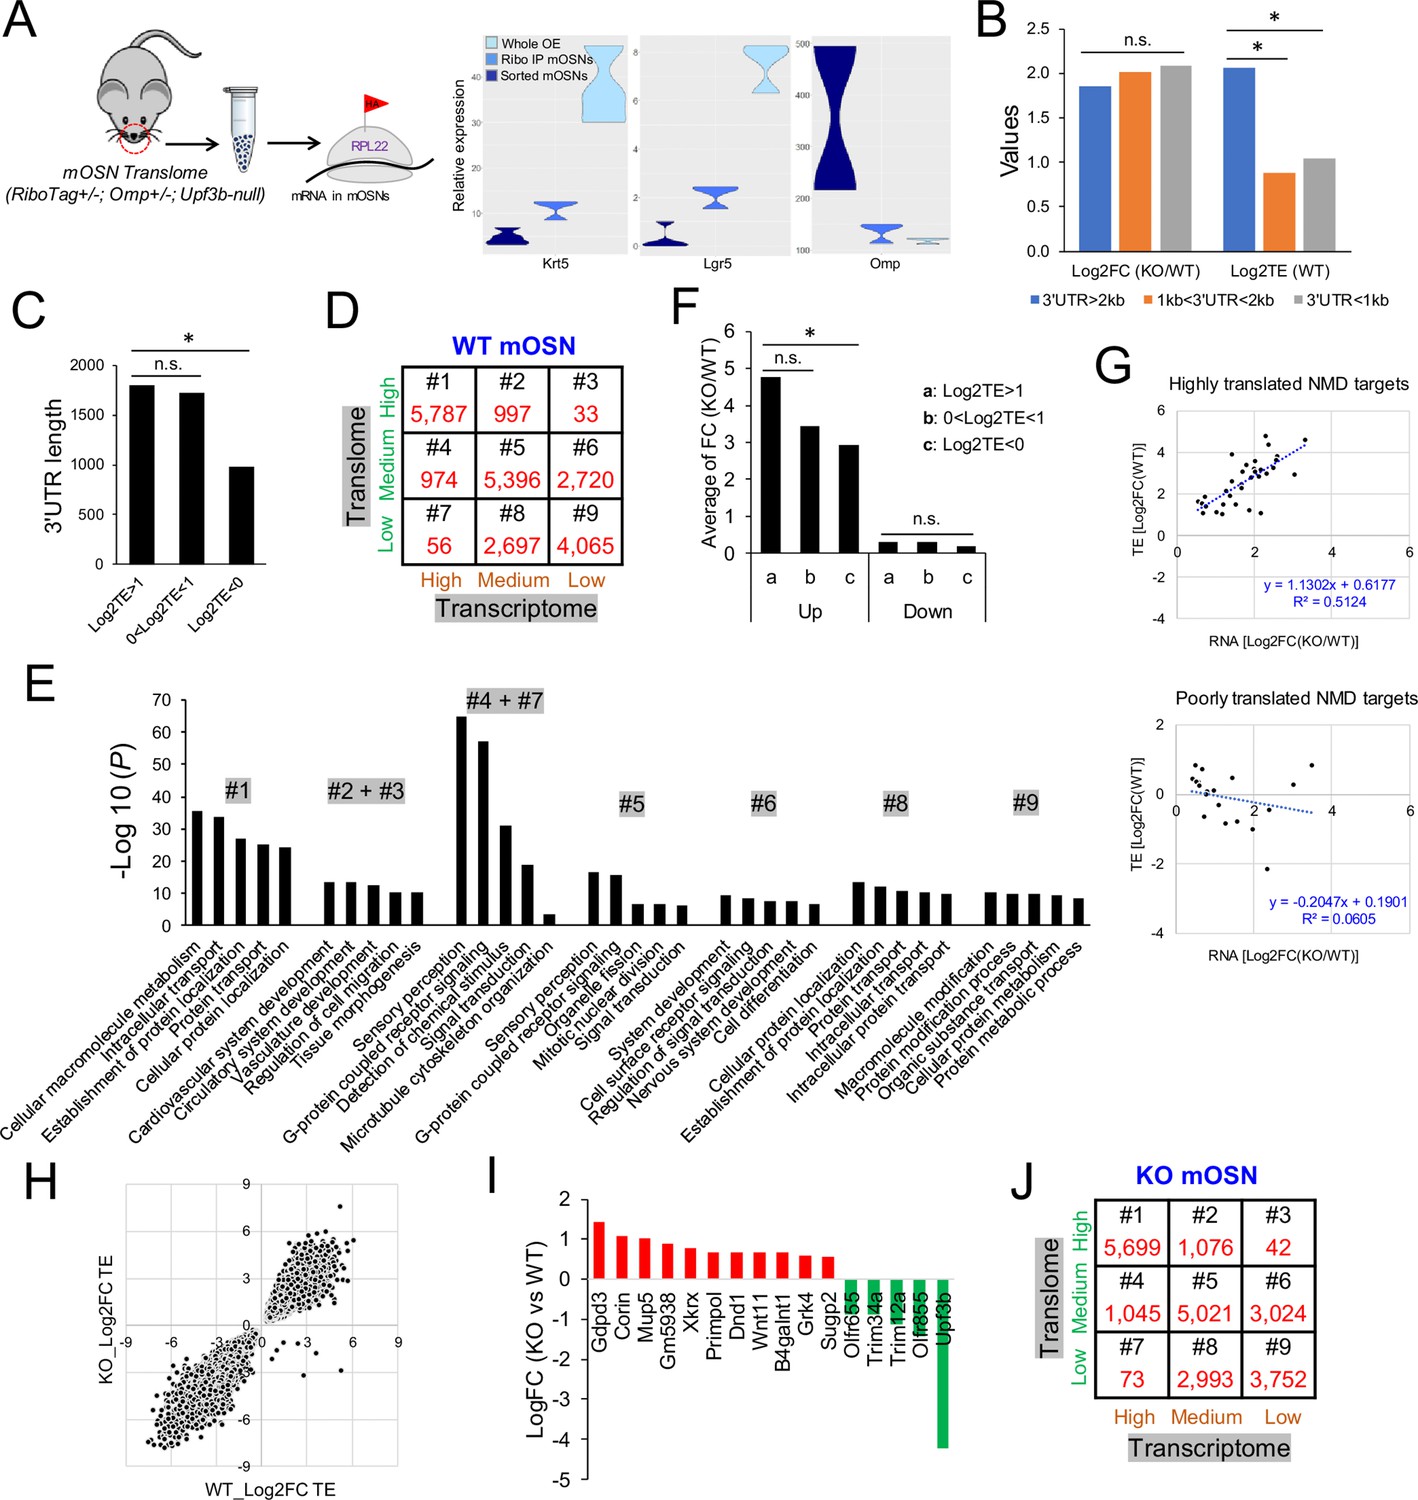
The mOSN translome and NMD.
(A) Left, strategy used to define the mOSN translome. Right, RNAseq analysis of the expression of gene markers for HBCs (Krt5), GBCs (Lgr5), and mOSNs (Omp) in the indicated samples. (B) Average inferred translation efficiency (TE) of mOSN mRNAs with the indicated 3’UTR length ranges. *, p<0.05. (C) Average 3’UTR length of mOSN mRNAs with the indicated range of TE values. *, p<0.05. (D) mOSN mRNAs from WT mice stratified by steady-state mRNA level (transcriptome) and TE. The number of genes in each category is indicated. (E) Top enriched GO terms associated with the different categories of genes defined in (D). (F) Analysis of upregulated mRNAs (candidate NMD targets) and downregulated mRNAs (indirect targets) are shown on the left and right, respectively. The average shift in expression in Upf3b-null mOSNs relative to WT mOSNs is shown for mOSNs binned by TE (a and c have the highest and lowest TE values, respectively). *, p<0.05. (G) Scatter plot of the 52 high-confidence mOSN NMD targets, showing TE vs. NMD magnitude (upregulation in Upf3b-null mOSNs). Both values are log2-transformed. (H) Scatterplot showing the TE of mRNAs in Upf3b-null vs. WT mOSNs. (I) mRNAs exhibiting significantly altered TE in response to Upf3b loss. (J) mOSN mRNAs from Upf3b-null (KO) mice stratified by steady-state mRNA level (transcriptome) and TE. The number of cells in each category is indicated.
Figure 3
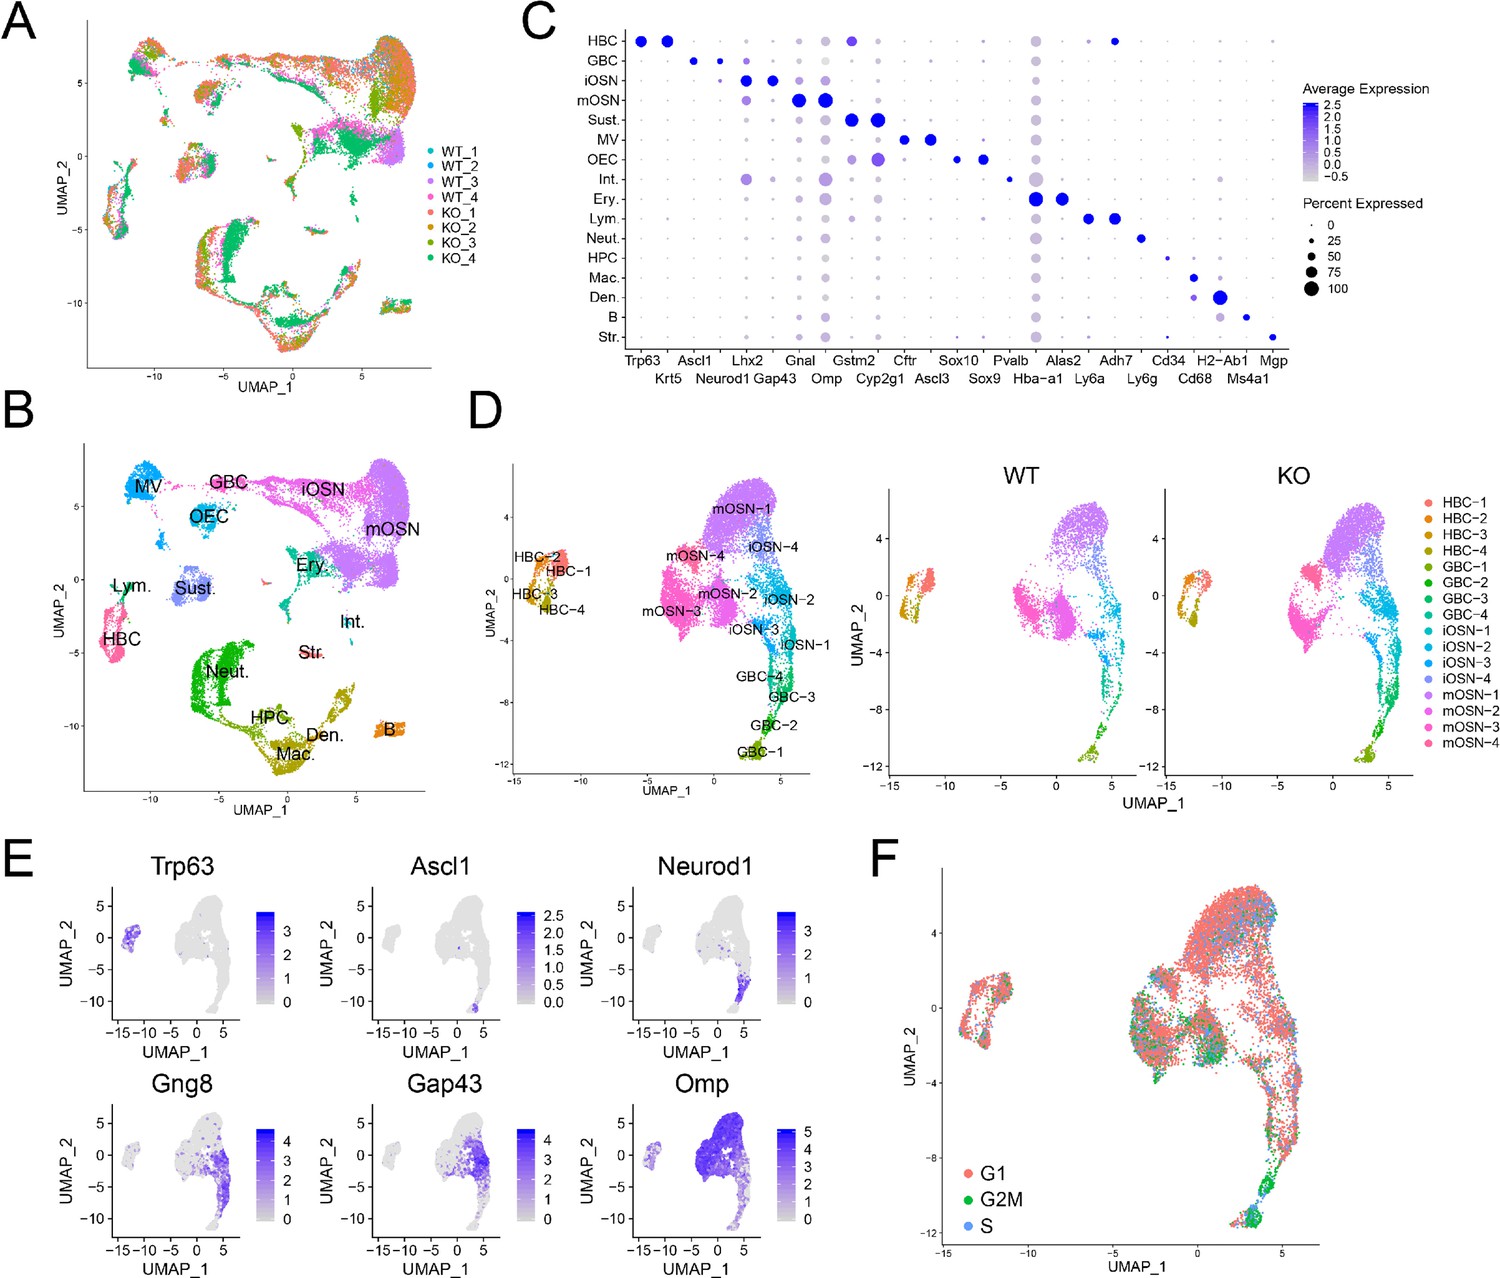
Identification of OE cell subsets using scRNAseq analysis.
(A) UMAP plot of OE cells from 4 Upf3b-null (KO) and 4 WT mice analyzed by scRNAseq. (B) Same UMAP plot as is in (A), showing the identity of the different cell clusters. (C) Dotplot depicting the expression of gene markers in the cell clusters defined in (B). (D) Left, UMAP plot of reclustered OSN precursors/OSNs defined in (A). Right, genotype information. (E) Same UMAP plot as in (D), showing the expression of stage-specific markers. (F) Same UMAP plot as in (D), showing inferred cell-cycle phase based on the expression of a large set of G2/M- and S-phase genes (Kowalczyk et al., 2015).
Figure 4

HBC, GBC, iOSN and mOSN heterogeneity.
(A) Violin plots showing the expression of selective gene markers in the four indicated HBC sub-clusters in WT mice. (B) Monocle trajectory analysis of the HBC and GBC sub-clusters we identified. The arrow indicates the inferred direction of differentiation. (C–E) Violin plots showing the expression of selective gene markers in the indicated GBC, iOSN, and mOSN sub-clusters in WT mice. (F) The most statistically enriched signaling pathways in the mOSN-1,–2, and −3 sub-clusters.
Figure 5

Gene groups exhibiting distinct expression dynamics during OSN development.
(A) Monocle pseudotime trajectory analysis of the indicated cell clusters and sub-clusters from WT mice defined in Figure 3B (top) and Figure 3D (bottom), respectively. (B) Heatmap depicting the expression pattern of the four gene groups we defined, each with a unique expression pattern, as defined by the trajectory timeline shown in (A), upper. Top: pseudotime directions; right: the number of differentially expressed genes in each group and representative biological processes and P-values. (C) The most statistically enriched signaling pathways corresponding to each of the four gene groups defined in (B). (D) Dot plot showing genes related to the Hippo signaling pathway are primarily expressed in HBCs. (E) Transcription factor genes exhibiting the most statistically enriched expression in each gene group defined in (B). Target sequences predicted by the ENCODE database are indicated.
Figure 6 with 2 supplements
UPF3B shapes olfactory neurogenesis.
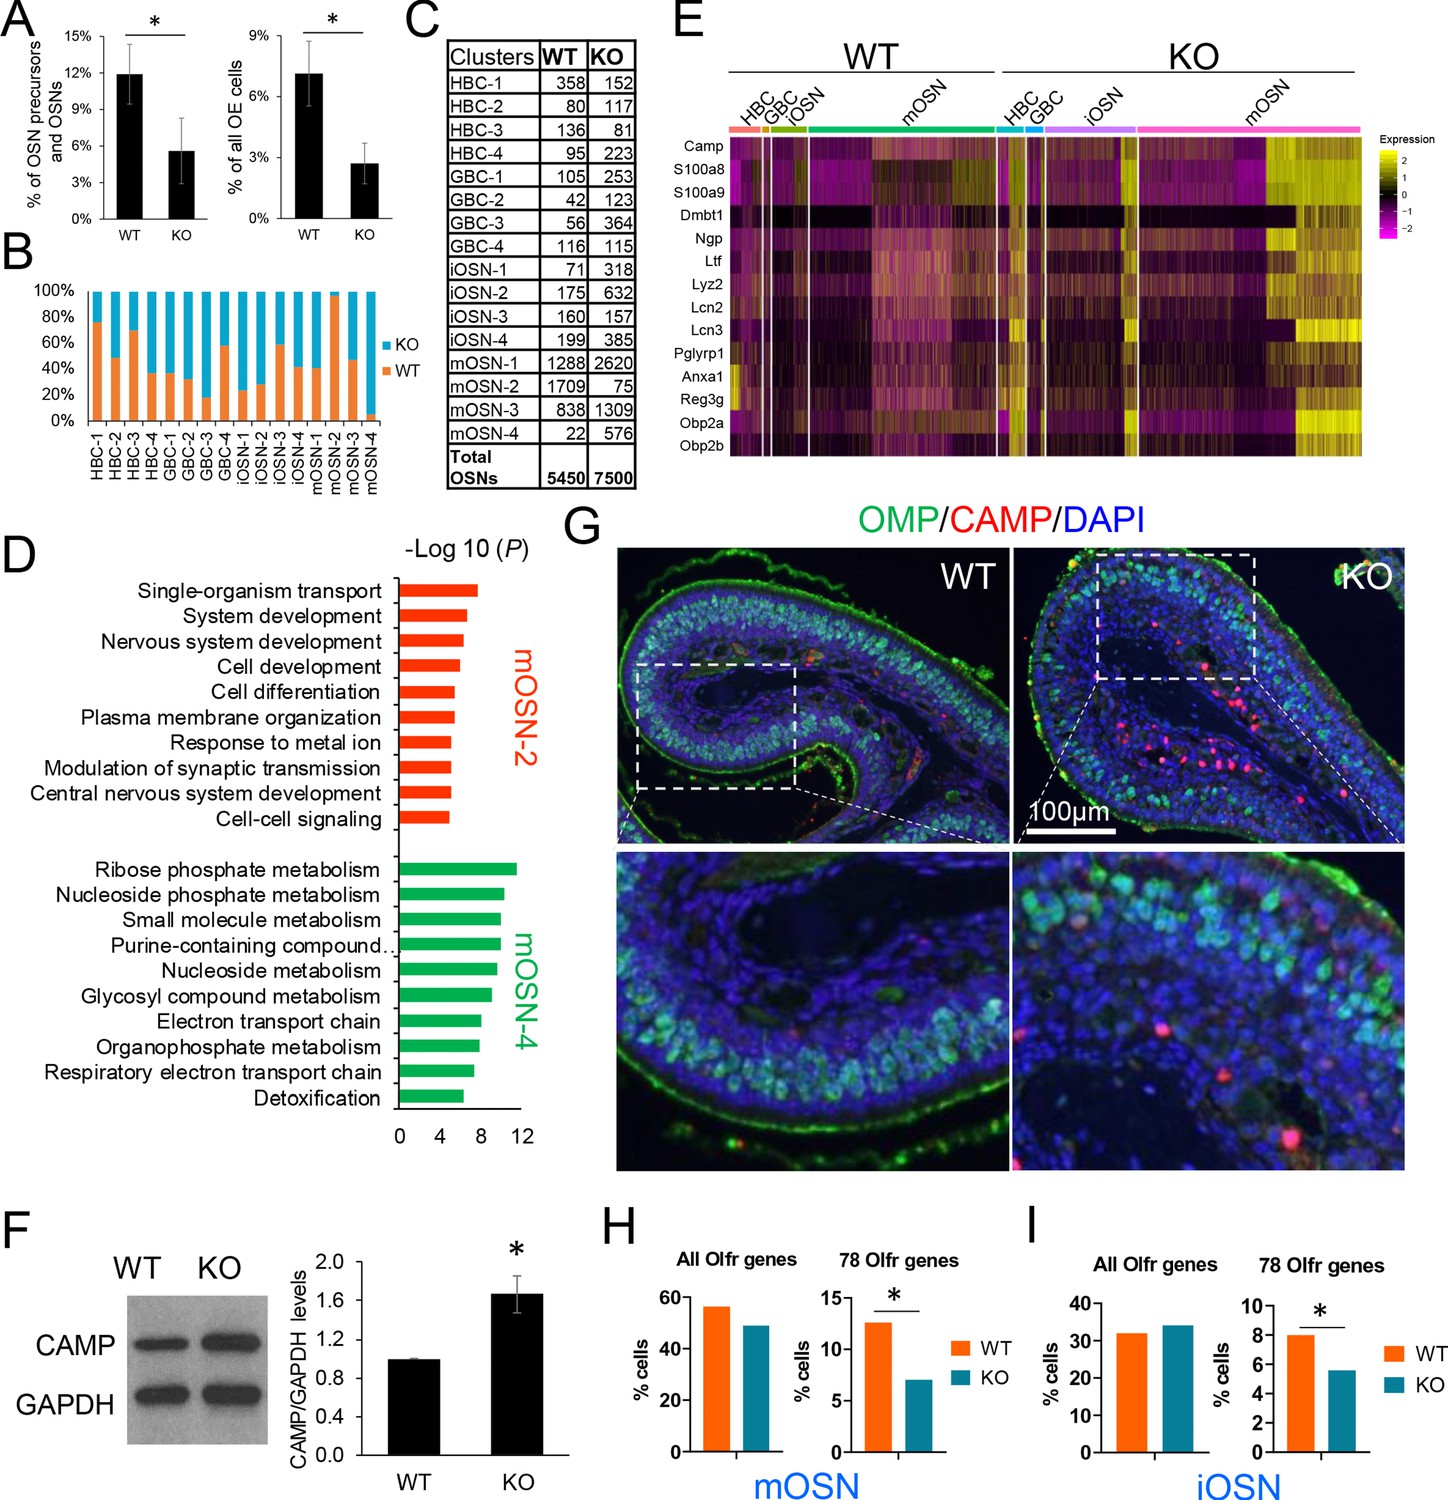
(A) The fraction of HBCs per all OSN precursors/OSNs (HBCs, GBCs, iOSNs and mOSNs) (left) or all OE cells (right), in Upf3b-null (KO) and WT mice, as determined by scRNA-seq analysis. *, p<0.05. (B) The percentage of cells from the indicated cell sub-clusters in Upf3b-null (KO) and WT mice, as determined by scRNAseq analysis. (C) Cell number in each cell sub-cluster, as defined in Figure 3D. (D) Most statistically enriched GO terms in the mOSN-2 and −4 sub-clusters. (E) Heatmap depicting the expression pattern of anti-microbial genes in the indicated cell subsets. (F) Left: Western blot analysis of endogenous CAMP protein level in the OE from Upf3b-null (KO) and WT mice. Right: quantification of CAMP level normalized against GAPDH (n = 3). *, p<0.05. (G) IF analysis of adult mouse OE sections co-stained with antisera against CAMP (red) and OMP (green). Nuclei were stained with DAPI (blue). (H, I) The percentage of mOSNs (H) and iOSNs (I) in our scRNAseq datasets that express Olfr genes. Left, all known Olfr genes. Right, the 78 Olfr genes significantly downregulated in Upf3b-null mice, based on RNAseq analysis (Figure 1C). *, p<0.05.
Figure 6—figure supplement 1
Impact of UPF3B loss on OE cell subsets.
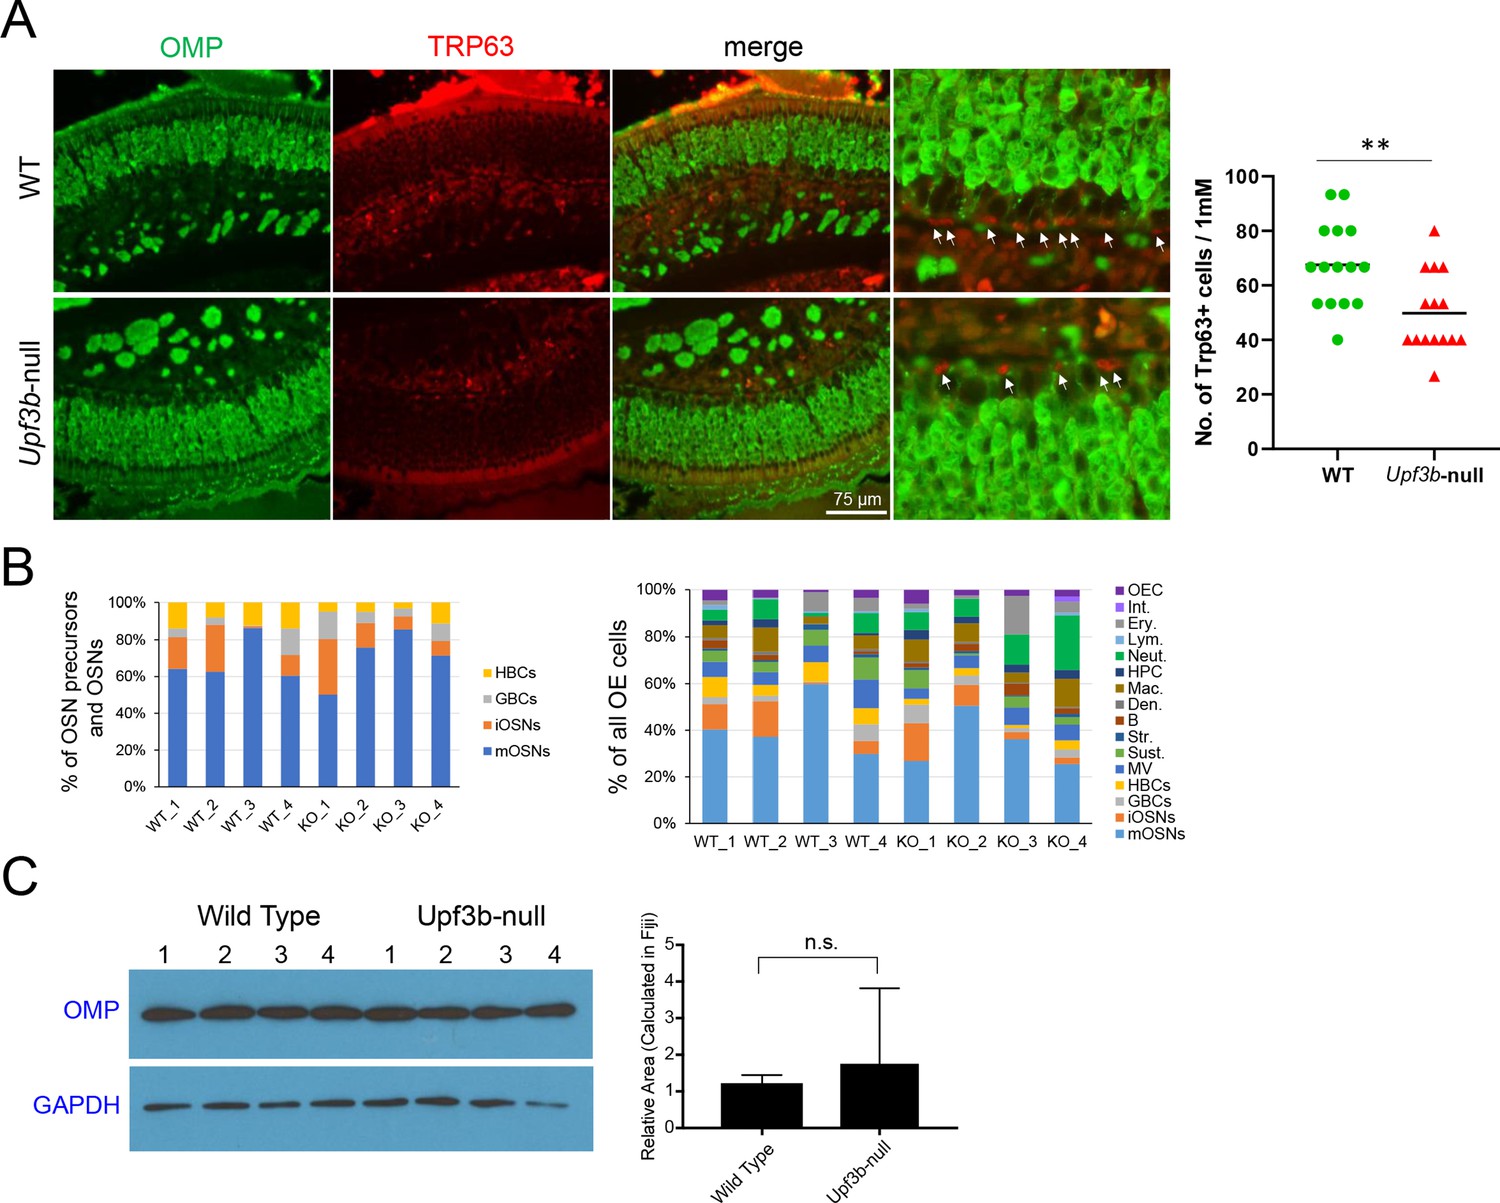
(A) Left, IF analysis of adult mouse OE sections co-stained with antisera against TRP63 (red) and OMP (green). White arrows label TRP63+ HBCs. (n = 3). Right, quantification of TRP63+ cells per 1 mM. For each group, 15 different OSN field lengths (75 μm long) from three individual mice were examined to calculate the number of TRP63+ cells per mM. (B) The fraction of different cell subsets per OSN precursors and OSNs (HBCs, GBCs, iOSNs and mOSNs) cells (top) or all OE cells (bottom), in indivdiual Upf3b-null (KO) and control (WT) mice, as determined by scRNA-seq analysis. (C) Left, western blot analysis of OMP protein expression in independent OE samples from Upf3b-null and control (wild type) mice. GAPDH is the normalization control. Right, quantification of OMP expression normalized to GAPH levels (n = 4).
Figure 6—figure supplement 2
mOSN subsets and UPF3B-regulated genes.
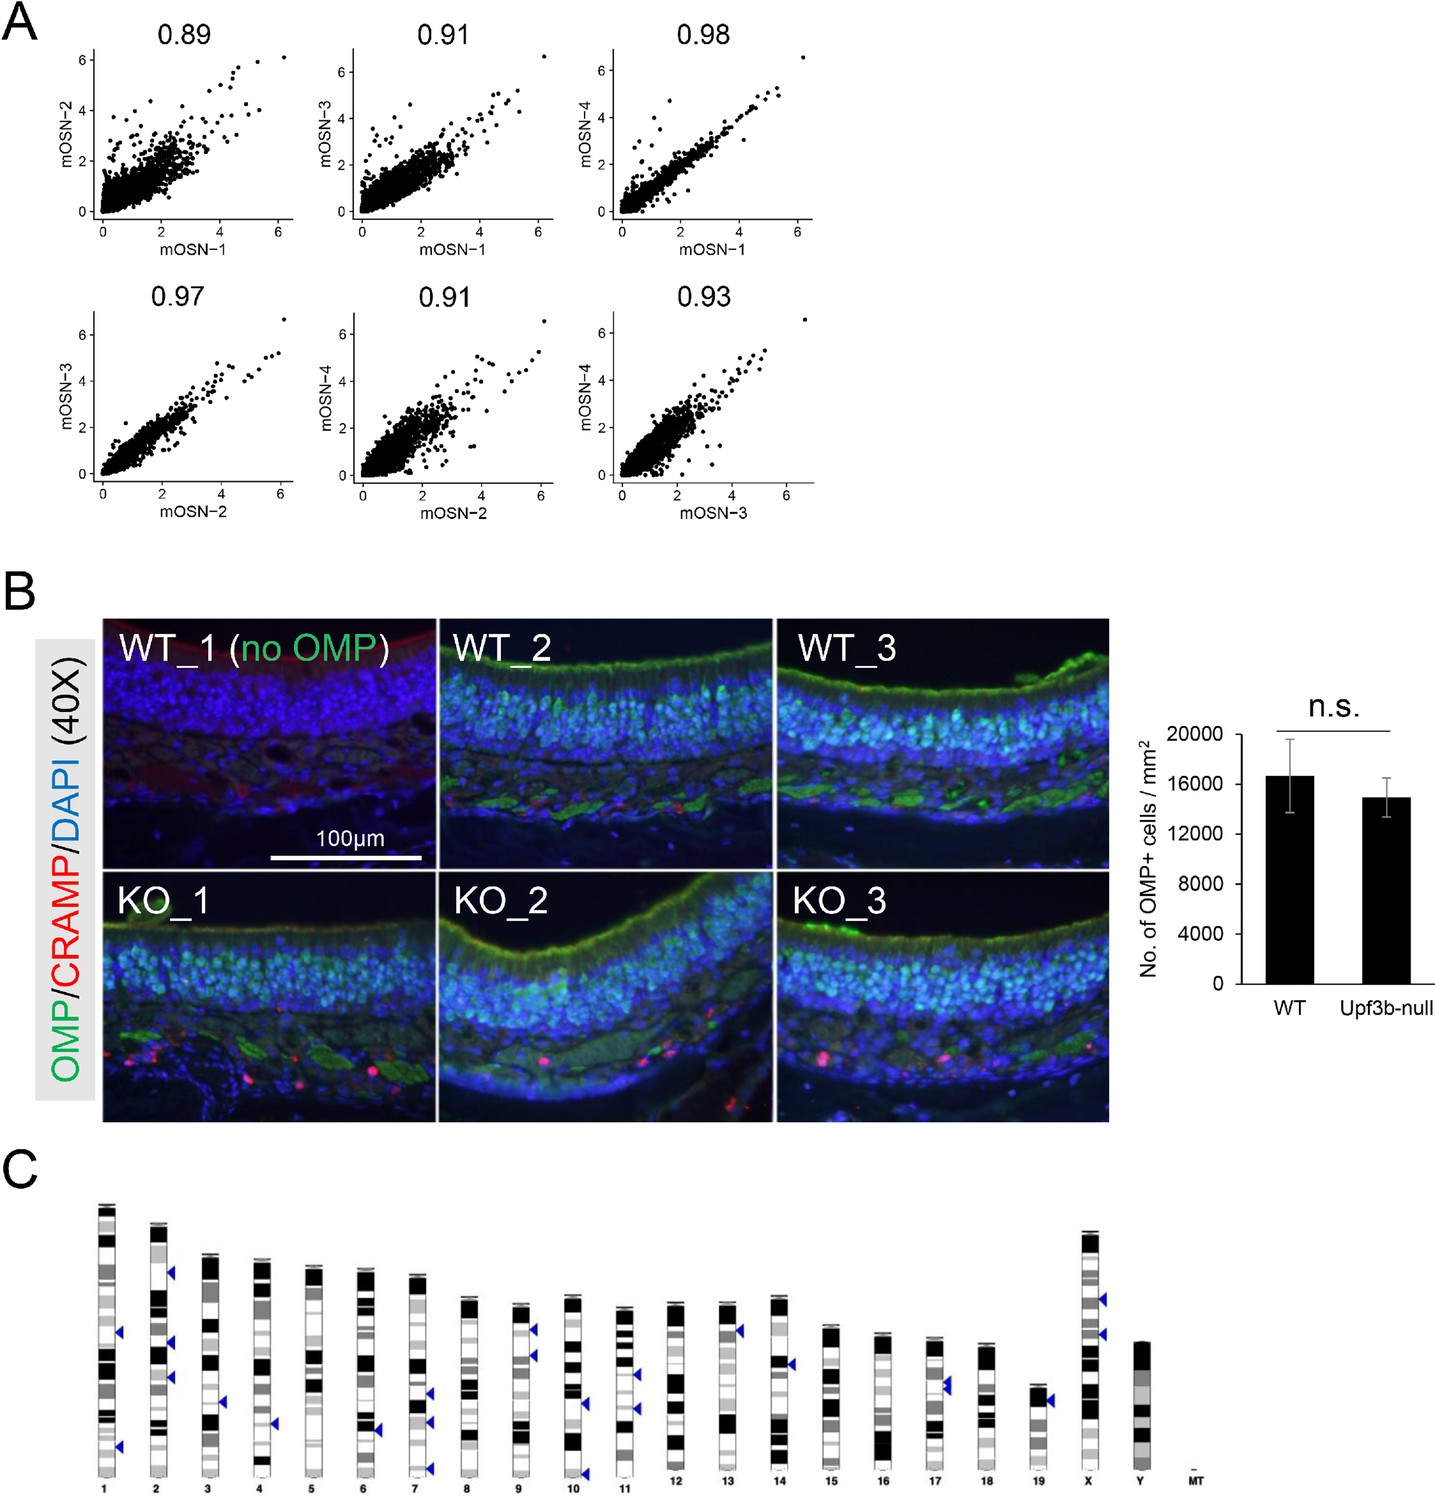
(A) Scatter plots showing Pearson correlation analysis of the transcriptomes from the indicated mOSN cell sub-clusters. (B) Left, IF analysis of adult mouse OE sections co-stained with antisera against CAMP/CRAMP (red) and OMP (green). Nuclei were stained with DAPI (blue). (n = 3). Right, quantification of OMP+ cells per mm2. For each group, 6 different mSONs views (2500 μm2) from 3 individual mice were quantified to calculate cell number per mm2. (C) The chromosomal distribution of the 78 Upf3b-regulated Olfr genes.
Author response image 1
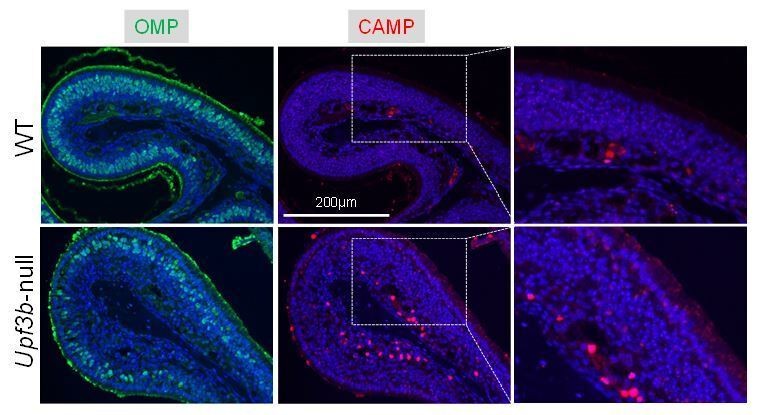
IF analysis of adult mouse OE sections co-stained with antisera against CAMP (red) and OMP (green).
Nuclei were stained with DAPI (blue).
Author response image 2
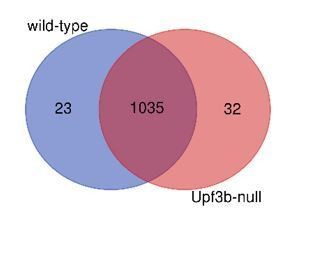
Venn diagram showing the expression of Olfr genes in Upf3b-null and control mOSNs.
Tables
Table 1
UPF3B-dependent NMD target mRNAs in mOSNs.
| Symbol | log2FC (KO/WT) | Padj | dEJ | uORF | 3'UTR length | Symbol | log2FC (KO/WT) | Padj | dEJ | uORF | 3'UTR length |
|---|---|---|---|---|---|---|---|---|---|---|---|
| Prelid3a | 1.099967 | 0.003745 | YES | NO | 1572 | Fmo2 | 2.02039 | 0.014815 | NO | NO | 2411 |
| 1700025G04Rik | 0.662926 | 0.012989 | NO | YES | 8870 | Gab2 | 0.98414 | 0.003018 | NO | NO | 3927 |
| 6030419C18Rik | 0.73232 | 0.036112 | NO | YES | 55 | Gdf11 | 1.429234 | 0.005353 | NO | NO | 2811 |
| 9330159F19Rik | 0.542375 | 0.017617 | NO | YES | 3408 | Gldn | 2.115908 | 0.045841 | NO | NO | 2970 |
| Adcy6 | 2.587005 | 0.002078 | NO | YES | 2356 | Hk2 | 2.296045 | 0.033161 | NO | NO | 2285 |
| Cdh24 | 1.560901 | 0.001303 | NO | YES | 121 | Lbh | 1.417311 | 0.024315 | NO | NO | 2498 |
| Fam84b | 0.719841 | 0.001704 | NO | YES | 3969 | Luc7l | 0.492061 | 8.19E-05 | NO | NO | 3738 |
| Inpp5f | 1.178064 | 0.043839 | NO | YES | 949 | Map3k9 | 0.79841 | 0.021555 | NO | NO | 1029 |
| Lrp2 | 2.504276 | 0.008534 | NO | YES | 1305 | Msrb3 | 1.668851 | 0.033388 | NO | NO | 2972 |
| Mafg | 0.577538 | 0.046713 | NO | YES | 4167 | Neurl3 | 1.966306 | 0.00546 | NO | NO | 1763 |
| Plxnc1 | 2.322167 | 0.048567 | NO | YES | 2320 | Notch2 | 1.68375 | 0.047733 | NO | NO | 2917 |
| Prdm4 | 0.420203 | 0.027945 | NO | YES | 1160 | Plekha5 | 0.608634 | 0.004216 | NO | NO | 3461 |
| Ptch1 | 0.768864 | 0.01088 | NO | YES | 3205 | Rab43 | 1.033148 | 0.0151 | NO | NO | 3737 |
| Ptger2 | 3.032221 | 0.035664 | NO | YES | 1825 | Rac2 | 3.029035 | 0.038392 | NO | NO | 2319 |
| Sash3 | 2.352656 | 0.033245 | NO | YES | 1309 | Raver2 | 1.921185 | 0.027779 | NO | NO | 1892 |
| Serpinb11 | 1.991555 | 0.002719 | NO | YES | 468 | Rflnb | 0.755198 | 0.017617 | NO | NO | 2716 |
| Snx33 | 1.512032 | 0.012417 | NO | YES | 1258 | Sik1 | 2.027635 | 1.48E-06 | NO | NO | 2035 |
| Zfp36 | 1.802697 | 0.025165 | NO | YES | 774 | Slc38a6 | 1.21151 | 0.025847 | NO | NO | 1512 |
| Agap2 | 1.264604 | 0.00099 | NO | NO | 1357 | Slc5a1 | 2.563582 | 0.00527 | NO | NO | 1868 |
| Aox2 | 1.36834 | 0.018035 | NO | NO | 1640 | Swap70 | 1.863436 | 0.009993 | NO | NO | 2169 |
| Atp10d | 3.315656 | 0.017617 | NO | NO | 2384 | Tgm2 | 2.395934 | 0.042993 | NO | NO | 1399 |
| Bhlhe40 | 1.435423 | 0.000192 | NO | NO | 1593 | Themis2 | 3.496025 | 0.015464 | NO | NO | 1053 |
| Btg2 | 1.281148 | 0.000173 | NO | NO | 2199 | Tmprss2 | 2.167673 | 0.005867 | NO | NO | 1456 |
| Cybrd1 | 2.372842 | 0.002733 | NO | NO | 4269 | Tob2 | 0.667082 | 0.001453 | NO | NO | 2459 |
| Cyth4 | 2.162221 | 0.045105 | NO | NO | 1455 | Ywhag | 0.644673 | 0.017707 | NO | NO | 2586 |
| Ermn | 1.686519 | 0.005793 | NO | NO | 2641 | Zcchc6 | 0.512078 | 0.003018 | NO | NO | 1346 |
Key resources table
| Reagent type (species) or resource | Designation | Source or reference | Identifiers | Additional information |
|---|---|---|---|---|
| Gene (Mus musculus) | Upf3b | GenBank | Gene ID: 68134 | |
| Genetic reagent (Mus. musculus) | C57BL/6J | Jackson Laboratory | Stock #: 000664 RRID:MGI:3028467 | |
| Genetic reagent (Mus. musculus) | Upf3b-null mice | PMID:21925383 | RRID:MGI:6110148 | Miles Wilkinson lab |
| Genetic reagent (Mus. musculus) | R26-eYFP mice | PMID:11299042 | Obtained from Dr. Maike Sander (UCSD) | |
| Genetic reagent (Mus. musculus) | Omp-Cre mice | PMID:22057188 | Obtained from Dr. Haiqing Zhao (Johns Hopkins University) | |
| Genetic reagent (Mus. musculus) | RiboTag mice | PMID:19666516 | Obtained from Dr. Paul Ameiux (University of Washington) | |
| Antibody | Rabbit monoclonal anti-OMP (EPR19190) | Abcam | Cat# ab183947 RRID:AB_2858281 | IF (1:400), WB (1:2000) |
| Antibody | Goat polyclonal anti-OMP | FUJIFILM Wako Chemicals | Cat# 544–10001-WAKO RRID:AB_2315007 | IF (1:200) |
| Antibody | Rabbit polyclonal anti-CAMP | Generated by Richard L. Gallo laboratory | PMID:11442754 | IF (1:200) |
| Antibody | Rabbit polyclonal anti-FUT10 | Proteintech | Cat#: 18660–1-AP RRID:AB_10641997 | IF (1:200) |
| Antibody | Donkey anti-Goat IgG (H+L) Cross-Adsorbed Secondary Antibody, Alexa Fluor 488 | Thermo Fisher Scientific | Cat#: A-11055 RRID:AB_2534102 | IF (1:1000) |
| Antibody | Donkey anti-Rabbit IgG (H+L) Highly Cross-Adsorbed Secondary Antibody, Alexa Fluor 555 | Thermo Fisher Scientific | Cat#: A-31572 RRID:AB_162543 | IF (1:1000) |
| Sequence-based reagent | Fosl2_F | This paper | PCR primers | CCGCAGAAGGAGAGATGAG (from IDT) |
| Sequenced-based reagent | Fosl2_R | This paper | PCR primers | GCAGCTTCTCTGTCAGCTC (from IDT) |
| Sequence-based reagent | Ptger2_F | This paper | PCR primers | TGCTCCTTGCCTTTCACAATC (from IDT) |
| Sequenced-based reagent | Ptger2_R | This paper | PCR primers | CCTAAGTATGGCAAAGACCCAAG (from IDT) |
| Sequence-based reagent | Adcy6_F | This paper | PCR primers | TTCCTGACCGTGCCTTCTC (from IDT) |
| Sequenced-based reagent | Adcy6_R | This paper | PCR primers | CACCCCGGTTGTCTTTGC (from IDT) |
| Sequence-based reagent | Ptch1_F | This paper | PCR primers | ACCTCCTAGGTAAGCCTCC (from IDT) |
| Sequenced-based reagent | Ptch1_R | This paper | PCR primers | CACCCACAATCAACTCCTCC (from IDT) |
| Sequence-based reagent | Cwc22_F | This paper | PCR primers | CAGAAGACAGATACACAGAGCAAG (from IDT) |
| Sequenced-based reagent | Cwc22_R | This paper | PCR primers | CTCTCTCTCTCTCTCTGCGTTT (from IDT) |
| Sequence-based reagent | Fut10_F | This paper | PCR primers | CCAGGGCCTTCCTATTCTACG (from IDT) |
| Sequenced-based reagent | Fut10_R | This paper | PCR primers | CTGAATGTGGCCGTATGGTTG (from IDT) |
| Sequence-based reagent | Gdpd3_F | This paper | PCR primers | TGATCCGACACTTGCAGGAC (from IDT) |
| Sequenced-based reagent | Gdpd3_R | This paper | PCR primers | GCTGTGGGGTAATCGGTCAT (from IDT) |
| Sequence-based reagent | Olfr827_F | This paper | PCR primers | TGGGATGGTTCTTCTGGGAA (from IDT) |
| Sequenced-based reagent | Olfr827_R | This paper | PCR primers | ACCGTGGAGTAGGAGAGGTC (from IDT) |
| Sequence-based reagent | Rpl19_F | This paper | PCR primers | CCTGAAGGTCAAAGGGAATGTG (from IDT) |
| Sequenced-based reagent | Rpl19_R | This paper | PCR primers | CTTTCGTGCTTCCTTGGTCTT (from IDT) |
| Commercial assay or kit | Chromium Single Cell 3' Library and Gel Bead Kit | 10X Genomics | Cat# 120237 | |
| Commercial assay or kit | iScript cDNA synthesis Kit | BioRad | Cat# 170–8891 | |
| Commercial assay or kit | SsoAdvanceD Universal SYBR Green Supermix | BioRad | Cat# 172–5274 | |
| Commercial assay or kit | RNeasy Mini Kit | Qiagen | Cat# 74104 | |
| Software, algorithm | Cell Ranger Version 2.1.1 | 10x genomics | Cell Ranger Version 2.1.1 | |
| Software, algorithm | Seurat (v3.1.5) | Designed by Rahul Satija laboratory | PMID:31178118 | |
| Software, algorithm | Monocle (v2.16.0) | Designed by Cole Trapnell laboratory | PMID:28114287 | |
| Software, algorithm | NIH ImageJ (v1.8.0) | NIH | Version 1.8.0 |
Additional files
-
Supplementary file 1
Quality control matrices of Upf3b-null and control mOSNs RNA-seq datasets.
(1) QC metrics, (2) reads count, and (3) TPM values from Upf3b-null (KO) and control (WT) mOSN RNA-seq and RiboTag datasets. (4) The expression of all annotated Olfr genes in Upf3b-null (KO) and control (WT) mOSN samples, based on RNA-seq analysis.
- https://cdn.elifesciences.org/articles/57525/elife-57525-supp1-v2.xlsx
-
Supplementary file 2
mOSN transcriptome, translome, and NMD targets.
(1) Genes differentially expressed between Upf3b-null and WT mOSNs (as defined by RNA-seq analysis), including their known NIFs. (2) High-confidence NMD targets: transcripts both upregulated and stabilized in Upf3b-null mOSNs. (3) The transcriptome and translome of Upf3b-null and WT mOSNs, based on RNA-seq and RiboTag analyses. (4) Translational efficiency (TE) of RNAs expressed in Upf3b-null and WT mOSNs, as defined by RNA-seq and RiboTag analyses.
- https://cdn.elifesciences.org/articles/57525/elife-57525-supp2-v2.xlsx
-
Supplementary file 3
Putative mouse NMD target RNAs defined by previous studies.
- https://cdn.elifesciences.org/articles/57525/elife-57525-supp3-v2.xlsx
-
Supplementary file 4
Genes exhibiting enriched expression in scRNA-seq-defined OE cell subsets.
(1) Genes exhibiting enriched expression in all OE cell types identified by scRNA-seq analysis. (2) Genes exhibiting enriched expression in HBC, GBC, iOSN, and mOSN sub-clusters identfied by scRNA-seq analysis. (3) Genes exhibiting enriched expression in the 4 temporally distinct gene groups defined by pseudotime trajectory analysis of HBCs, GBCs, iOSNs, and mOSNs. (4) Transcription factor (TF) genes exhibiting enriched expression in the 4 temporally distinct gene groups defined by pseudotime trajectory analysis of HBCs, GBCs, iOSNs, and mOSNs.
- https://cdn.elifesciences.org/articles/57525/elife-57525-supp4-v2.xlsx
-
Supplementary file 5
Immune genes expressed in HBCs, GBCs, iOSNs, and mOSNs.
(1) Immune genes enriched in Upf3b-null HBC, GBC, iOSN, and mOSN sub-clusters identified by scRNA-seq analysis. (2) NIFs present in immune genes expressed in Upf3b-null OSNs.
- https://cdn.elifesciences.org/articles/57525/elife-57525-supp5-v2.xlsx
-
Transparent reporting form
- https://cdn.elifesciences.org/articles/57525/elife-57525-transrepform-v2.docx
Download links
A two-part list of links to download the article, or parts of the article, in various formats.
Downloads (link to download the article as PDF)
Open citations (links to open the citations from this article in various online reference manager services)
Cite this article (links to download the citations from this article in formats compatible with various reference manager tools)
The role of the NMD factor UPF3B in olfactory sensory neurons
eLife 9:e57525.
https://doi.org/10.7554/eLife.57525


