A molecular filter for the cnidarian stinging response
- Department of Molecular and Cellular Biology, Harvard University, United States
- Department of Biology, Brandeis University, United States
Figures
Figure 1 with 1 supplement
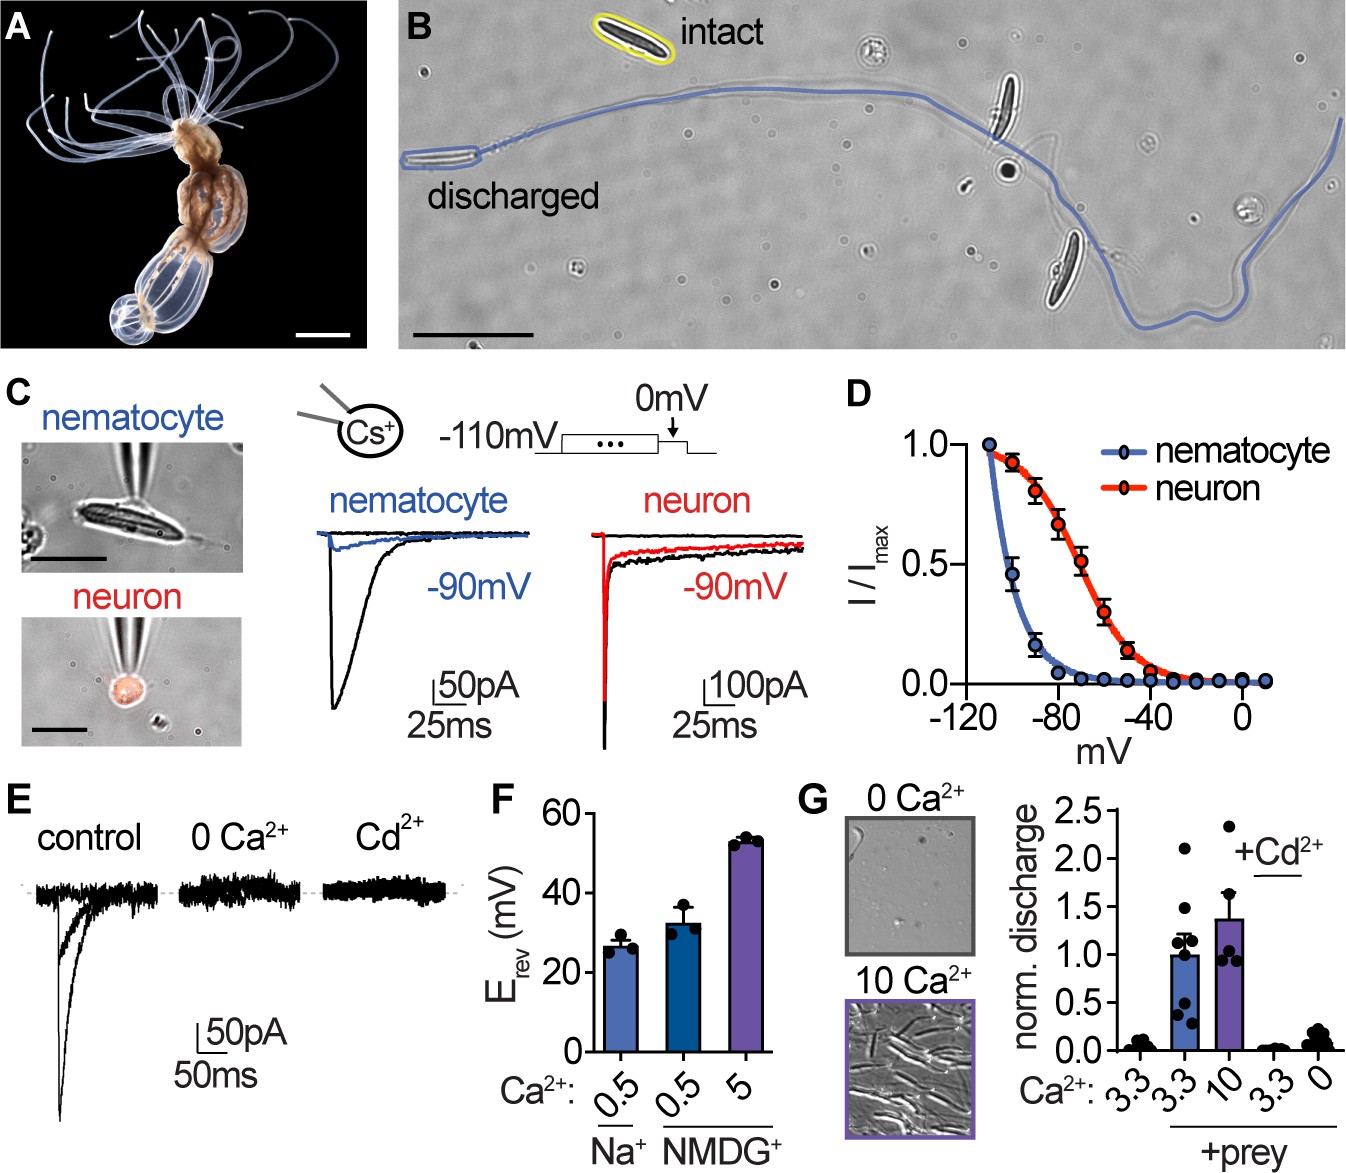
Nematocyte voltage-gated Ca2+ currents exhibit sensitive voltage-dependent inactivation.
(A) Starlet sea anemone (Nematostella vectensis). Scale bar = 3 mm. (B) Intact (yellow) and discharged nematocyte (blue). Scale bar = 20 μm. (C) Left: Representative patch clamp experiments from a nematocyte and tentacle neuron. Scale bar = 10 μm. Right: Nematocyte or neuron voltage-gated currents elicited by a maximally activating voltage pulse following 1 s pre-pulses to −110 mV (max current), −90 mV (colored), or 0 mV (inactivated, no current). (D) Nematocyte voltage-gated currents inactivated at very negative voltages compared with neurons. Nematocyte inactivation occurred at voltages more negative than could be measured compared with a sigmoidal inactivation relationship in neurons: nematocyte estimated Vi1/2 = -100.2 ± 0.4mV, n = 13 and neuron Vi1/2 = -70.8 ± 1.0mV, n = 9. Apparent activation thresholds were similar (Figure 1—figure supplement 1A). (E) Nematocyte voltage-gated currents elicited by −40 mV and 0 mV pulses were abolished in absence of external Ca2+ and blocked by cadmium (Cd2+). Representative of n = 4 for 0 Ca2+ and three for Cd2+, p<0.001 paired two-tailed student’s t-test. (F) Nematocyte voltage-gated currents were Ca2+-sensitive. Substitution of extracellular Ca2+, but not Na+ for NMDG+, affected the reversal potential. n = 3–4, p<0.001 for 5 mM Ca2+ versus other conditions, one-way ANOVA with post-hoc Tukey test. (G) Nematocyte discharge was minimal or absent in response to mechanical stimulation alone (n = 11, 3.3 mM Ca2+). In the presence of prey extract, mechanically evoked discharge was similar in standard and higher concentration of extracellular Ca2+ (n = 8 for 3.3 mM Ca2+, n = 5 for 10 mM) and blocked by Cd2+ (n = 8) or the removal of extracellular Ca2+ (n = 15). Discharged nematocysts embedded in presented gelatin-coated coverslips were quantified. p<0.001 for + prey with 3.3 or 10 mM Ca2+ versus other conditions, one-way ANOVA with post-hoc Bonferroni test. Data represented as mean ± sem.
-
Figure 1—source data 1
Properties of nematocytes and neurons.
- https://cdn.elifesciences.org/articles/57578/elife-57578-fig1-data1-v1.xlsx
Figure 1—figure supplement 1
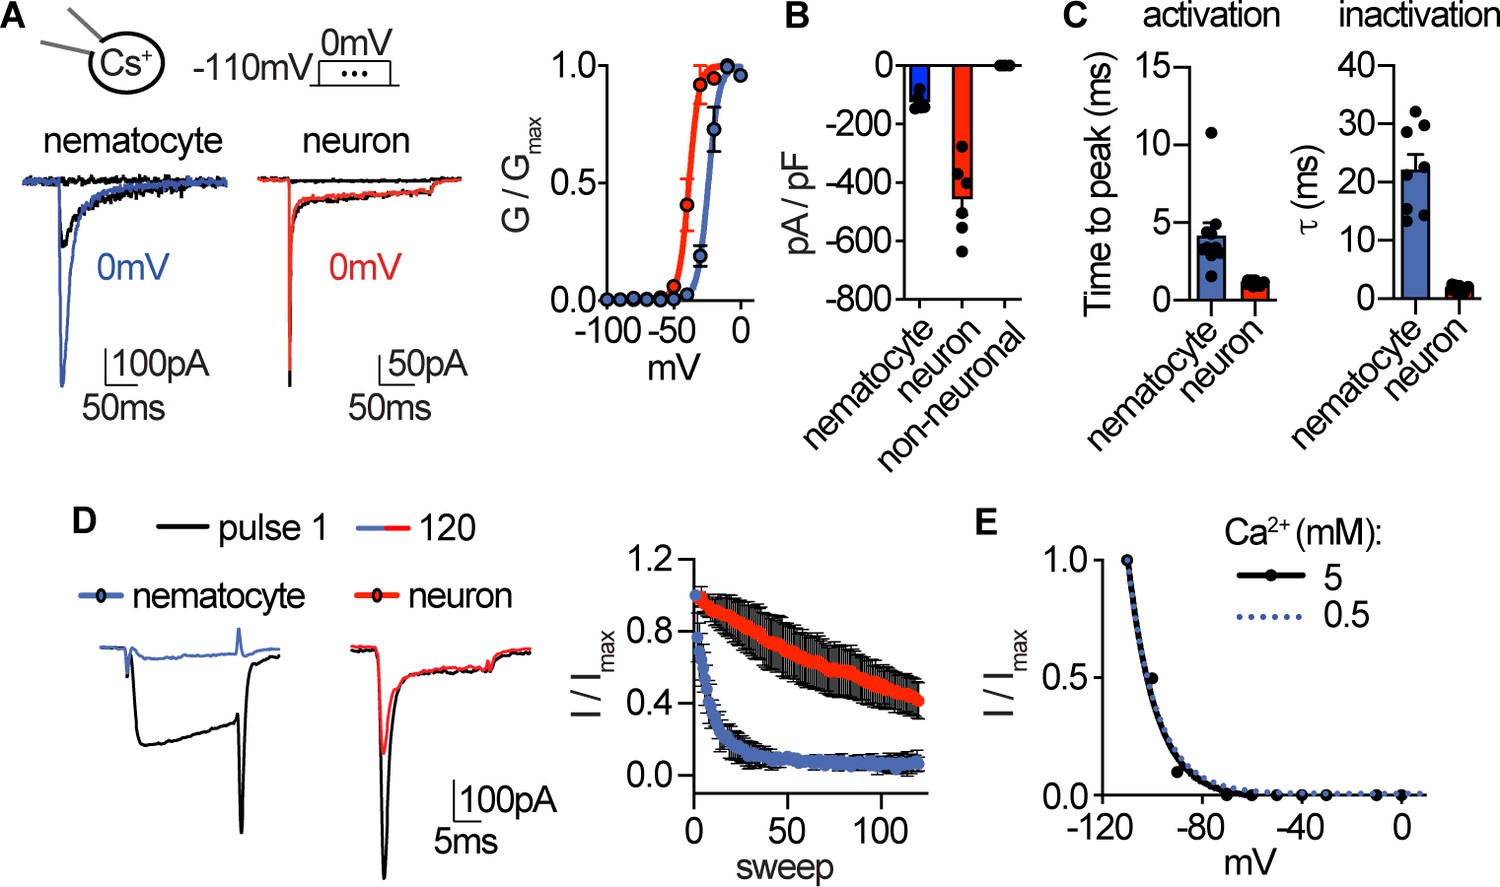
Native nematocyte CaV properties.
(A) Voltage-gated currents from a nematocyte and tentacle neuron elicited by −40 mV or 0 mV pulses. Conductance-voltage curves: nematocyte Va1/2 = -24.0 ± 0.5mV, n = 10 and neuron Va1/2 = -38.6 ± 0.6mV, n = 7. (B) Peak current density elicited by 0 mV pulse in nematocytes (n = 5), neurons (n = 6), and non-neuronal cells (n = 3). (C) Inward currents activated and inactivated more slowly in nematocytes compared with neurons. n = 10 nematocytes, 11 neurons. p<0.0001 two-tailed student’s t-test. (D) Nematocyte inward currents inactivated more quickly with repetitive stimulation compared with neurons. Protocol: 3.33 Hz stimulation with 20 ms pulses to −10 mV from −90 mV. n = 4 of each cell type, multiple row two-tailed student’s t-test with significance of p<0.05 by sweep five and p<0.0001 by 120. (E) Inactivation of inward currents does not vary with external Ca2+. 0.5 mM Ca2+ estimated Vi1/2 = -100.2 ± 0.4mV, n = 13, from Figure 1. 5 mM Ca2+ estimated Vi1/2 = -99.8 ± 0.9mV, n = 3. Data represented as mean ±sem.
Figure 2 with 1 supplement
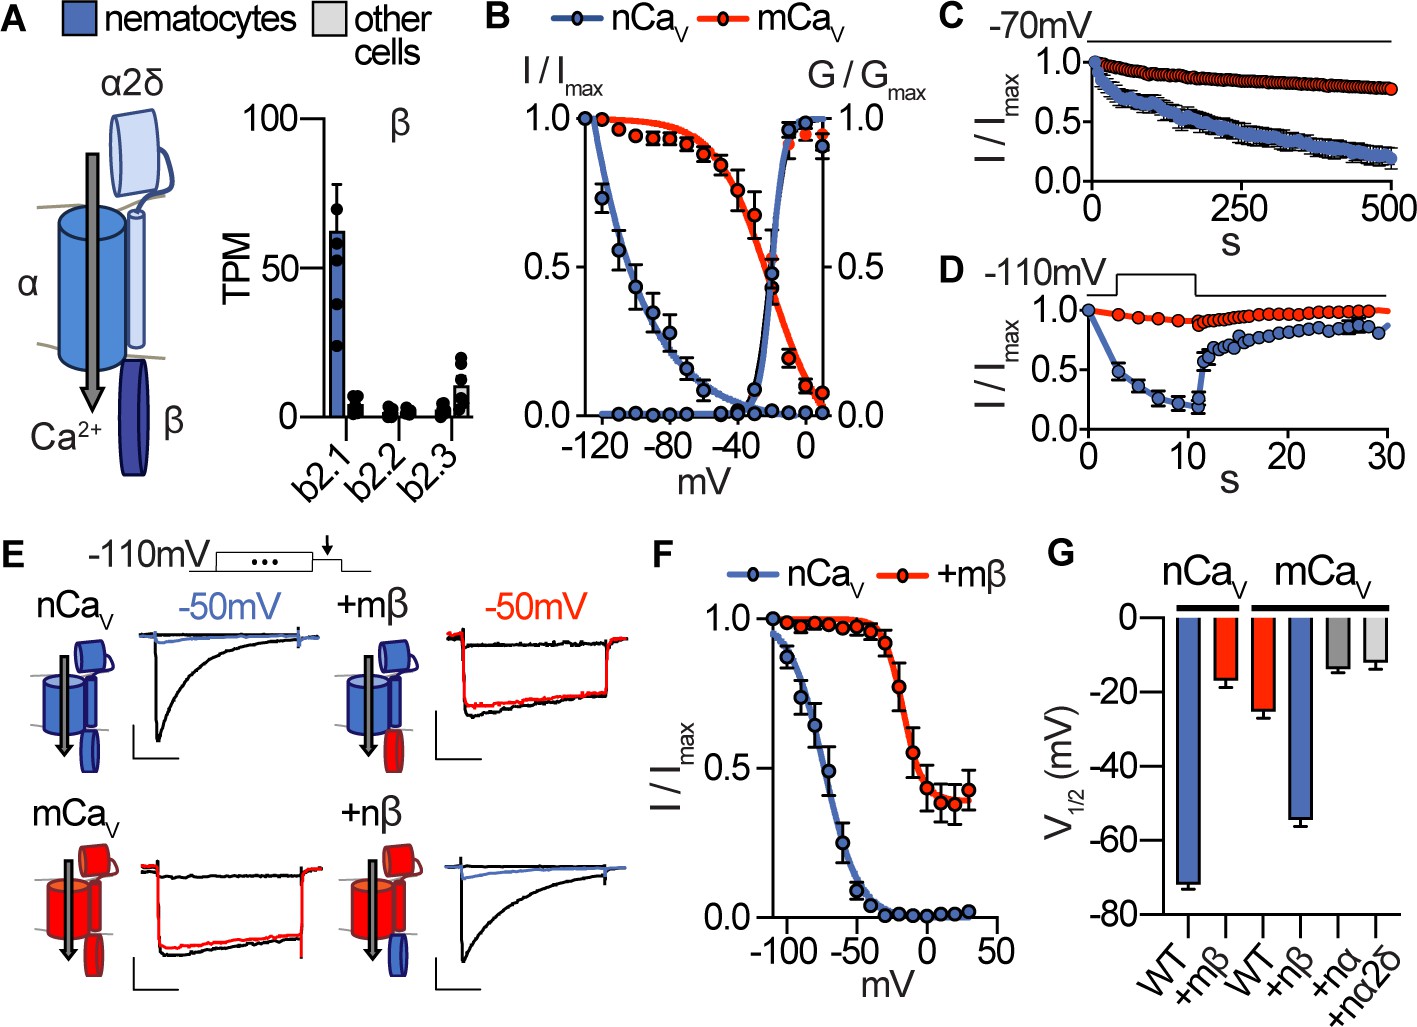
Nematostella CaV exhibits unique voltage-dependent properties conferred by its β subunit.
(A) CaV channel complex with α, β, and α2δ subunits. mRNA expression (transcripts per million, TPM) of voltage-gated calcium (CaV) channel β subunits in nematocyte-enriched cells (blue) and non-enriched cells (grey). n = 6, p<0.0001 for cacnb2.1 in nematocytes versus other cells, two-way ANOVA with post-hoc Bonferroni test. (B) Heterologously-expressed nCav channels (Nematostella cacna1a, cacnb2, cacna2d1) inactivated at very negative voltages (estimated Vi1/2 = -101.5 ± 1.6mV, n = 5) versus mammalian orthologues (mCaV, Vi1/2 = -20.9 ± 3.4mV, n = 10). Apparent activation thresholds were the same: nCaV Va1/2 = -9.8 ± 0.3mV, n = 5, mCaV Va1/2 = -10.4 ± 0.5mV, n = 9. Inactivation was measured in response to 1 s pre-pulses from −110 mV to 10 mV with an inter-sweep holding potential of −90 mV. (C) nCaV exhibited slow inactivation with −70 mV holding potential (0.2 Hz stimulation, 5 s inter-pulse interval) that was best fit by two exponential functions with time constants of 10.0 and 369.5 s. n = 6, multiple row two-tailed student’s t-test with significance of p<0.05 by 15 s and p<0.0001 by 500 s. (D) nCav inactivated at −40 mV and quickly recovered at negative holding potentials. n = 7 for nCaV, n = 6 for mCaV. (E) Voltage-gated currents recorded from nCaV or mCaV following a −110 mV pre-pulse, −50 mV pre-pulse (colored), and 20 mV pre-pulse. CaV β subunits were substituted as indicated (mammalian β in red and Nematostella β in blue). Scale bars = 100 pA, 25 ms. (F) Mammalian β shifts nCaV voltage-dependent inactivation to positive voltages. nCaV Vi1/2 = -73.2 ± 1.2mV, n = 6. nCaV + mβ=−16.9 ± 1.9 mV, n = 6. (G) Half maximal inactivation voltage (Vi1/2) for CaV chimeras. p<0.0001 for nCaV versus nCaV + mβ, mCaV versus mCaV + nβ, one-way ANOVA with post-hoc Tukey test. Inactivation was measured in response to pre-pulses from −100 mV to 10 mV with an inter-sweep holding potential of −110 mV to reduce slow inactivation. Data represented as mean ±sem.
-
Figure 2—source data 1
Properties of nCaV.
- https://cdn.elifesciences.org/articles/57578/elife-57578-fig2-data1-v1.xlsx
Figure 2—figure supplement 1
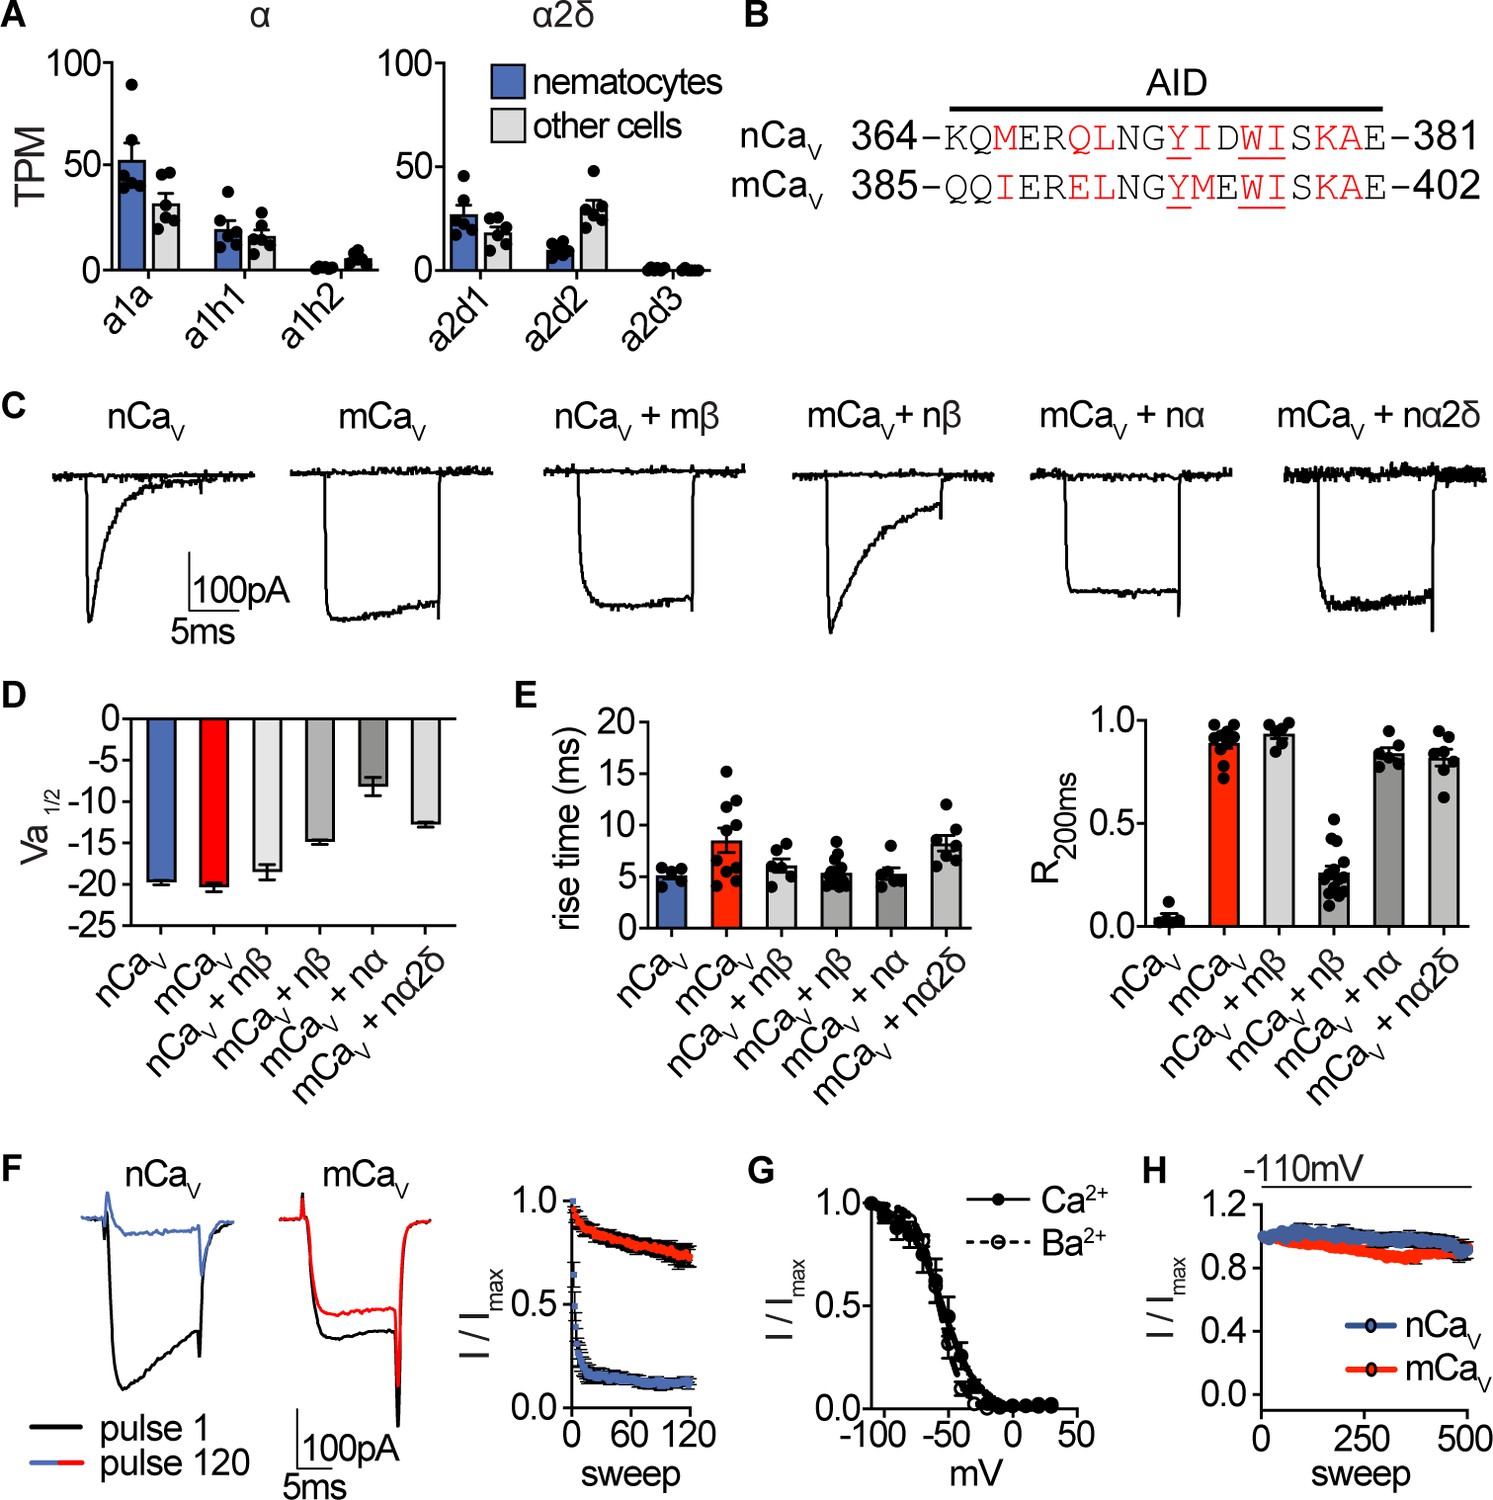
Nematostella CaV properties.
(A) mRNA expression (transcripts per million, TPM) of voltage-gated calcium (CaV) channel α and α2δ subunits in nematocyte-enriched cells (blue) versus non-enriched cells (grey). n = 6, p<0.01 for cacna1a in nematocytes versus other cells, two-way ANOVA with post-hoc Bonferroni test. Expression of other subunits was not significantly different. (B) Sequence alignment of Nematostella and Mus musculus α subunits at the α interaction domain (AID). Red letters indicate important regions for beta subunit interaction, underlined letters are critical for interaction. (C) Representative voltage-activated currents from HEK-293 cells expressing wild-type or chimeric CaV channels with specific combinations of mammalian and Nematostella subunits. Currents were elicited by 0 mV pulses from −110 mV. (D) Half maximal activation voltage (Va1/2) was similar for CaV chimeras. n = 6 nCaV, 6 nCaV + mβ, 10 mCaV, 10 mCaV + nβ, 6 mCaV + nα, 6 mCaV + nα2δ. (E) Left: Rise time of voltage-activated inward current. Right: Relative fraction of inward current remaining after a 200 ms step to 0 mV (R200). n = 6 nCaV, 6 nCaV + mβ, 10 mCaV, 14 mCaV + nβ, 6 mCaV + nα, 7 mCaV + nα2δ. (F) nCaV inactivated more quickly than mCaV. Protocol: 3.33 Hz stimulation with 20 ms pulses to −10 mV from −90 mV. n = 5 nCaV, 6 mCaV, multiple row two-tailed student’s t-test with significance of p<0.05 by sweep two and p<0.0001 by 120. (G) Inactivation curves of mCaV + nβ were similar when external Ca2+ (Vi1/2 = -54.4 ± 1.8mV, n = 10) was replaced with Ba2+ (Vi1/2 = -57.0 ± 0.9mV, n = 6). (H) nCaV exhibited relatively little slow inactivation from −110 mV compared with −70 mV holding potential (Figure 2, 0.2 Hz stimulation, 5 s inter-pulse interval). Data represented as mean ±sem.
Figure 3 with 1 supplement
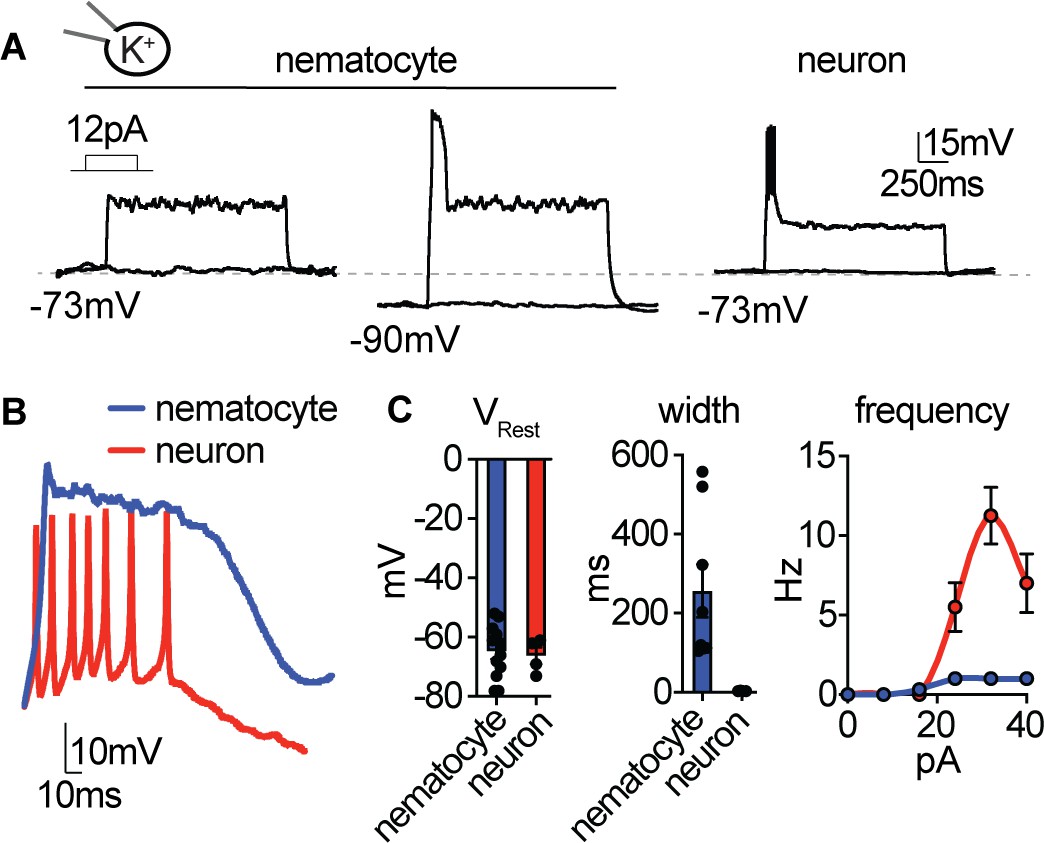
Nematocyte excitability requires hyperpolarized voltages.
(A) Depolarizing current injection only elicited spikes from nematocytes first hyperpolarized to relieve inactivation. Nematocyte spike amplitude: 0 mV at rest, 41.5 ± 2.2 mV from ~−90 mV. n = 8, p<0.0001 two-tailed paired student’s t-test. In contrast, tentacle neurons spiked from rest (31.5 ± 1.7 mV, n = 4). (B) Current injection elicited long singular spikes from nematocytes and numerous narrow spikes from neurons. (C) Nematocytes and neurons had similar resting membrane potentials but distinct spike width. n = 8 nematocytes, n=4 neurons, p<0.01, two-tailed student’s t-test. Nematocytes produced only one spike, regardless of injection amplitude (n = 8), whereas neurons produced varying spike frequency depending on injection amplitude (n = 4). p<0.0001 two-way ANOVA with post-hoc Bonferroni test. Data represented as mean ±sem.
-
Figure 3—source data 1
Nematocyte and neuron excitability and K+currents.
- https://cdn.elifesciences.org/articles/57578/elife-57578-fig3-data1-v1.xlsx
Figure 3—figure supplement 1
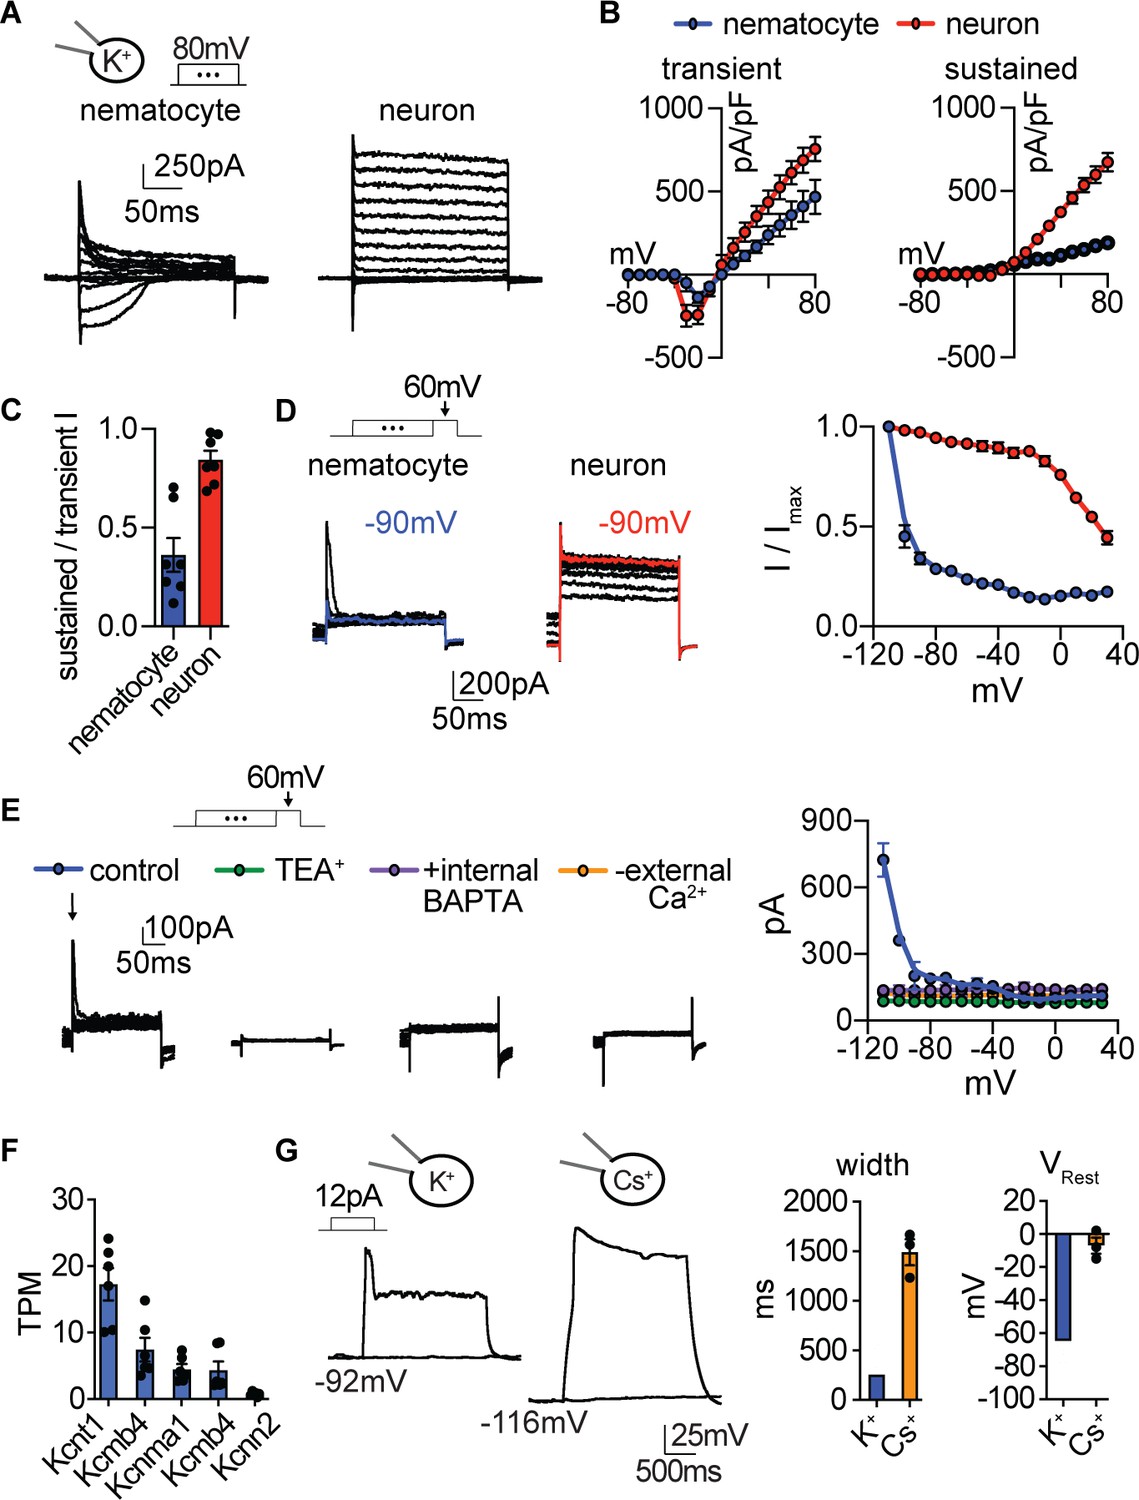
Nematocyte K+ current properties.
(A) In the presence of intracellular K+, voltage-activated outward currents were elicited from nematocytes and tentacle neurons. (B) Current-voltage relationships of peak transient and sustained (end of 200 ms voltage pulse) currents in nematocytes and neurons. n = 7. (C) Nematocytes exhibited a lower ratio of sustained/transient outward current, indicating faster inactivation of outward current. n = 7, p<0.01 two-tailed student’s t-test. (D) Nematocyte transient outward currents exhibited strong voltage-dependent inactivation compared with weak voltage-dependent inactivation of outward currents in neurons. n = 5, p<0.0001 for voltages at −100 mV or above, two-way ANOVA with post-hoc Bonferroni test. (E) Transient K+ currents in nematocytes were assessed using voltage protocols to enhance the outward current sensitive to voltage-dependent inactivation. These currents were abolished by the K+ channel blocker TEA+ (n = 4), the intracellular Ca2+ chelator BAPTA (n = 4), or in the absence of external Ca2+ (replaced with NMDG+ + EGTA, n = 3). p<0.0001 for currents measured following pre-pulses to −110 or −100 mV, two-way ANOVA with post-hoc Bonferroni test. Smaller sustained outward currents measured following more positive pre-pulses were significantly affected by TEA+ but not other treatments. (F) mRNA expression (transcripts per million, TPM) of Ca2+-activated K+ channels in nematocyte-enriched cells. n = 6. (G) Nematocyte spike width and resting membrane potential were affected by the presence of intracellular Cs+. Cells were first hyperpolarized to elicit spikes with subsequent current injection. Spike width: n = 8 K+ (from Figure 3) and 3 Cs+, p<0.05 two-tailed student’s t-test. Resting membrane voltage: n = 12 K+ (from Figure 3) and 3 Cs+, p<0.01 two-tailed student’s t-test. Data represented as mean ±sem.
Figure 4 with 1 supplement
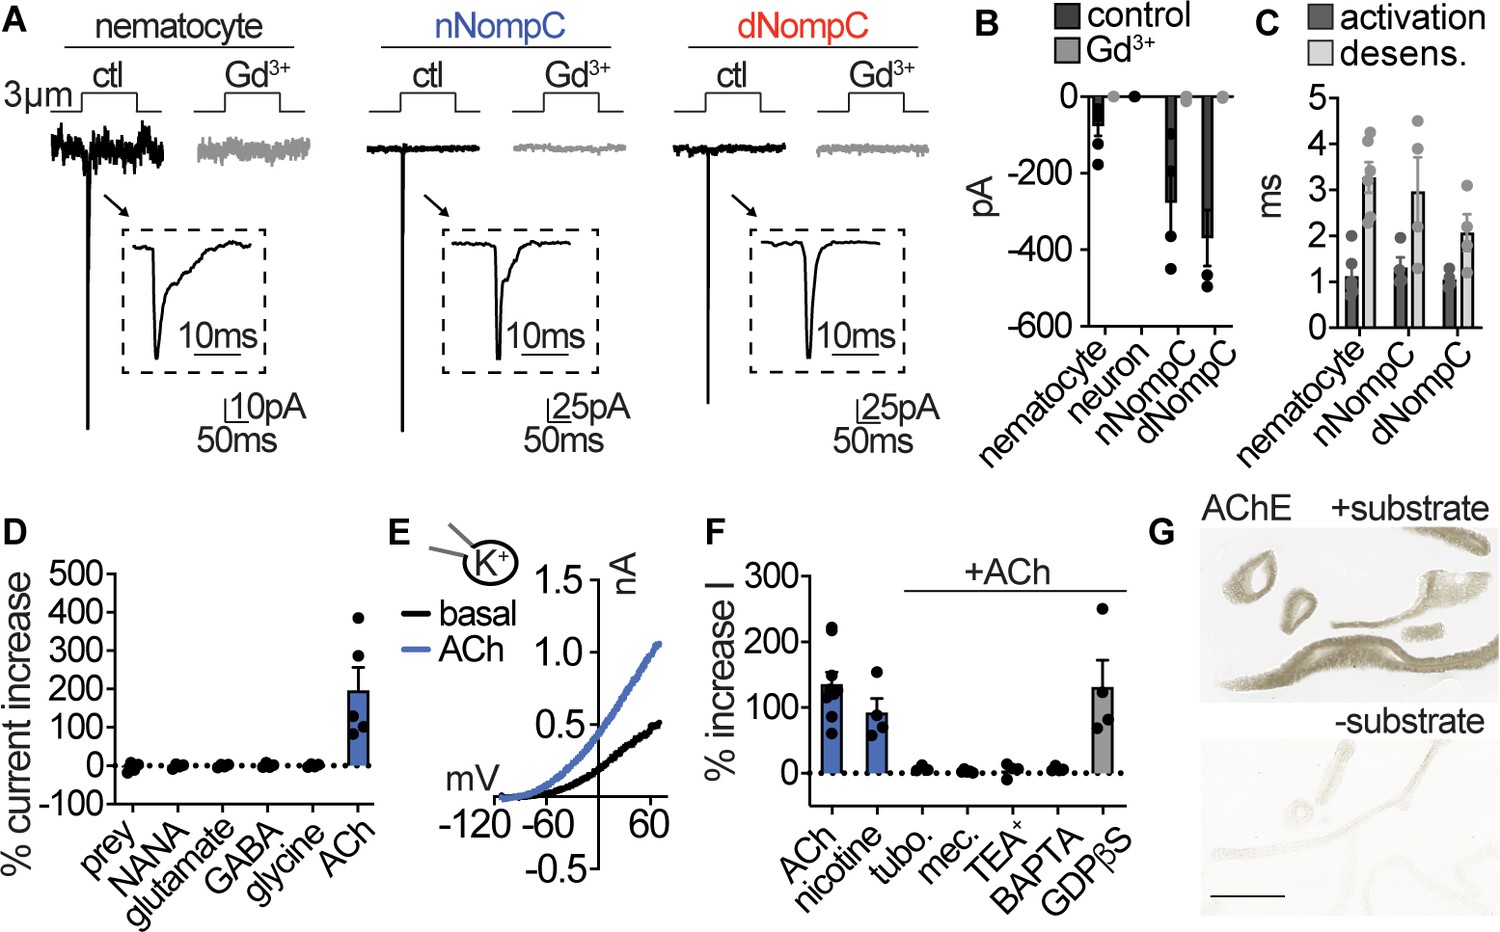
Nematocytes are intrinsically mechanosensitive and indirectly chemosensitive.
(A) Mechanical stimulation of nematocytes evoked Gd3+-sensitive, transient inward currents with similar properties to heterologously expressed Nematostella (n) and Drosophila (d) NompC channels. Stimulation thresholds (pipette displacement): nematocyte = 1.7 ± 0.3 μm (n = 6), nNompC = 4.2 ± 0.6 μm (n = 4), dNompC = 4.2 ± 0.5 μm (n = 4). Untransfected cells did not respond to similar stimuli (n = 6). (B) Mechanically evoked currents from nematocytes (n = 6), nNompC (n = 4), and dNompC (n = 4) were blocked by Gd3+, while tentacle neurons lacked mechanically evoked currents (n = 8). p<0.01 two-tailed student’s t-test. (C) Mechanically evoked current activation and desensitization kinetics were similar in nematocytes (n = 6), nNompC (n = 4), and dNompC (n = 4). (D) Chemosensory stimuli did not directly affect nematocytes but the neurotransmitter acetylcholine (ACh, n = 5) elicited a large outward current. n = 4 for prey extract, NANA, Glutamate, GABA, Glycine, p<0.001 for ACh versus other conditions, one-way ANOVA with post-hoc Tukey test. (E) Representative current-voltage relationship of ACh-elicited response in nematocytes. (F) ACh-evoked currents (n = 9) were blocked by nicotinic ACh receptor antagonists (tubocurarine = 4, mecamylamine = 4) and a similar current was elicited by nicotine (n = 4). ACh-evoked outward currents were inhibited by a K+ channel blocker (TEA+, n = 4) and an intracellular Ca2+ chelator (BAPTA, n = 4), but not the G-protein signaling blocker GDPβS (n = 4). p<0.001 for vehicle versus antagonists, one-way ANOVA with post-hoc Tukey test. (G) Acetylcholinesterase staining in tentacles with and without substrate solution (representative of n = 3 animals). Scale bar = 200 μm. Data represented as mean ±sem.
-
Figure 4—source data 1
Mechano- and chemosensory properties.
- https://cdn.elifesciences.org/articles/57578/elife-57578-fig4-data1-v1.xlsx
Figure 4—figure supplement 1
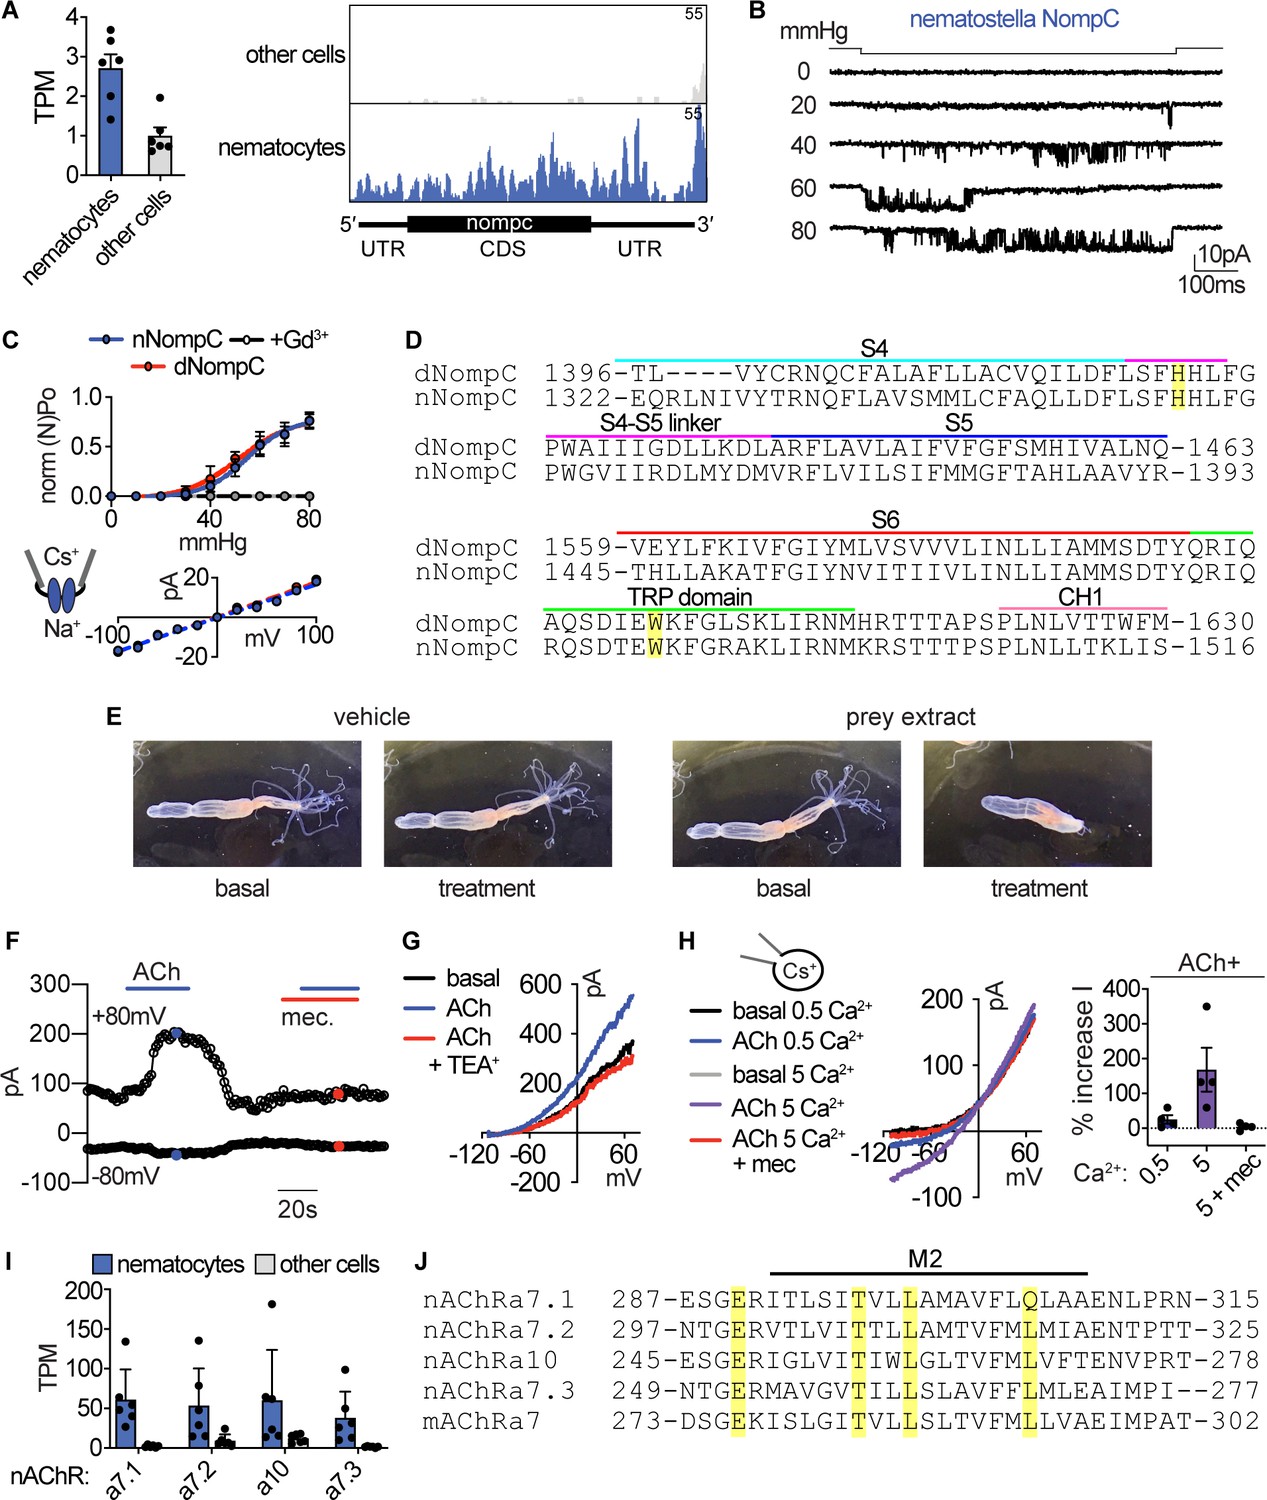
Sensory transduction properties.
(A) Left: mRNA expression (transcripts per million, TPM) of NompC (no mechanoreceptor potential) ion channels in nematocyte-enriched cells (blue) vs. non-enriched cells (grey). n = 6, p<0.05, two-tailed student’s t-test. Right: Numerous reads mapped across the entire NompC sequence. The transcript architecture is shown below the mapping. CDS, coding sequence; UTR, untranslated regions. The maximum read counts was set as the same value between samples. (B) A representative single Nematostella NompC (nNompC) channel expressed in an excised membrane patch was sensitive to increasing pressure applied via the patch pipette. Vm = −80 mV. (C) nNompC and Drosophila NompC (dNompC) exhibited similar pressure-open probability (NPO) relationships and slope conductance. nNompC was blocked by Gd3+. 95% confidence interval for pressure required to induce half maximal PO: nNompC = 51.9–59.4 mmHg, dNompC = 47.4–59.7 mmHg. n = 5. Slope conductance: nNompC = 168 ± 4 pS, dNompC = 175 ± 4 pS. n = 4. Patches from untransfected cells did not respond to similar stimuli (n = 6). (D) Alignment of Drosophila (dNompC) and Nematostella (nNompC) protein sequences revealed high conservation with overall sequence identity of 44.3% (62.7% similarity). Yellow indicates residues important for mechanosensitivity. (E) Application of filtered prey extract, but not vehicle, elicited a feeding response (contraction of tentacles) in a representative Nematostella. (F) Representative nematocyte response to acetylcholine (ACh) shows an outwardly-rectifying current, which was blocked by mecamylamine (Mec). K+ was the major intracellular cation. (G) Representative current-voltage relationship shows that the ACh-evoked current was inhibited by the K+ channel blocker TEA+. (H) In the presence of intracellular Cs+ to block K+ currents, ACh mediated a mecamylamine-sensitive, inward current that was enhanced by extracellular Ca2+. (I) mRNA expression (transcripts per million, TPM) of nicotinic acetylcholine-like receptors (nAChRs) in nematocyte-enriched cells (blue) vs. non-enriched cells (grey). n = 6, p<0.05 for nACHRa7.1, two-way ANOVA with post-hoc Bonferroni test. (J) Alignment of Nematostella nAChRs and mouse nAChRa7 protein sequences revealed conserved residues that facilitate Ca2+ permeability. Data represented as mean ±sem.
Figure 5 with 3 supplements

Nematocyte voltage-dependence facilitates signal integration required for stinging.
(A) Left: Electron micrograph demonstrating dense-core vesicles in the vicinity of an electron-dense zone localized at the junction between a spirocyte and nematocyte. Middle: 3D reconstruction of the nematocyte and spirocyte shown in the left panel. The box indicates the position of the synapse. Right: 3D reconstruction of a different nematocyte making a synapse with a putative sensory neuron. The box indicates the position of the synapse shown in Figure 5—figure supplement 2C and E. (B) ACh induced hyperpolarization of nematocytes. n = 6, p<0.01 paired two-tailed student’s t-test. (C) Depolarizing current injection did not induce active properties from rest, but did elicit a voltage spike from most nematocytes hyperpolarized by ACh. n = 6, p<0.01 paired two-tailed student’s t-test. (D) Chemo-tactile-induced nematocyte discharge (touch + prey extract, n = 8) was inhibited by the mechanoreceptor current blocker Gd3+ (n = 7) and nAChR antagonist mecamylamine (n = 14). In the absence of chemical stimulation (touch - prey extract, n = 5), touch + ACh (n = 14) was sufficient to induce discharge, which was inhibited by mecamylamine (n = 12). p<0.0001 for controls versus respective treatments, one-way ANOVA with post-hoc Bonferroni test. Data represented as mean ±sem.
-
Figure 5—source data 1
Combinatorial sensory cues modulate discharge.
- https://cdn.elifesciences.org/articles/57578/elife-57578-fig5-data1-v1.xlsx
Figure 5—figure supplement 1
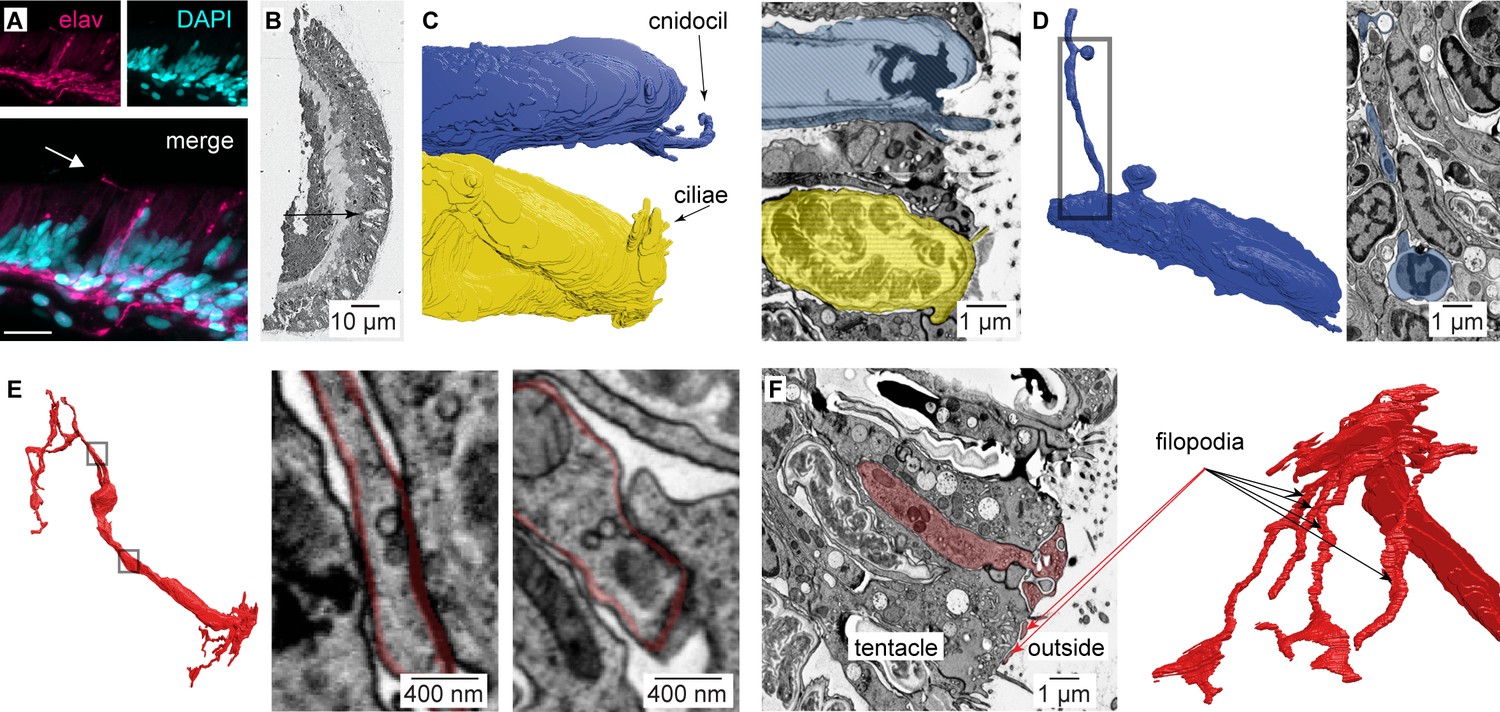
Nematocyte morphology.
(A) Tentacle from elav::mOrange Nematostella stained with dsRed (red) indicated neural processes beneath ectodermal nematocytes and putative sensory neurons located within the ectoderm. DAPI (blue) stains nuclei and nematocysts. White arrow indicates putative sensory projection. Scale bar = 10 μm. (B) Electron micrograph of Nematostella tentacle section (50 nm thickness). Arrow indicates regions containing nematocytes, spirocytes and sensory neurons which were imaged at higher magnification as illustrated in Figure 5 and Figure 5—figure supplement 2. (C) Cnidocil of a nematocyte (blue) and ciliae of a spirocyte (orange). Left: 3D reconstruction. Right: Electron micrograph of one section of the nematocyte (top) and one section of the spirocyte (bottom). (D) Nematocyte process. Left: 3D reconstruction of the nematocyte. Right: Electron micrograph of one section across the nematocyte process, indicated by the region boxed on the left panel. (E) Synapses made between the neuron and other cells than a nematocyte. Two examples are shown (middle and right panels). (F) Sensory terminal of the neuron shown in Figure 5A with multiple filopodia extending in the outside environment. Left: Electron micrograph of one section of the sensory neuron. Right: 3D reconstruction of the sensory neuron.
Figure 5—figure supplement 2
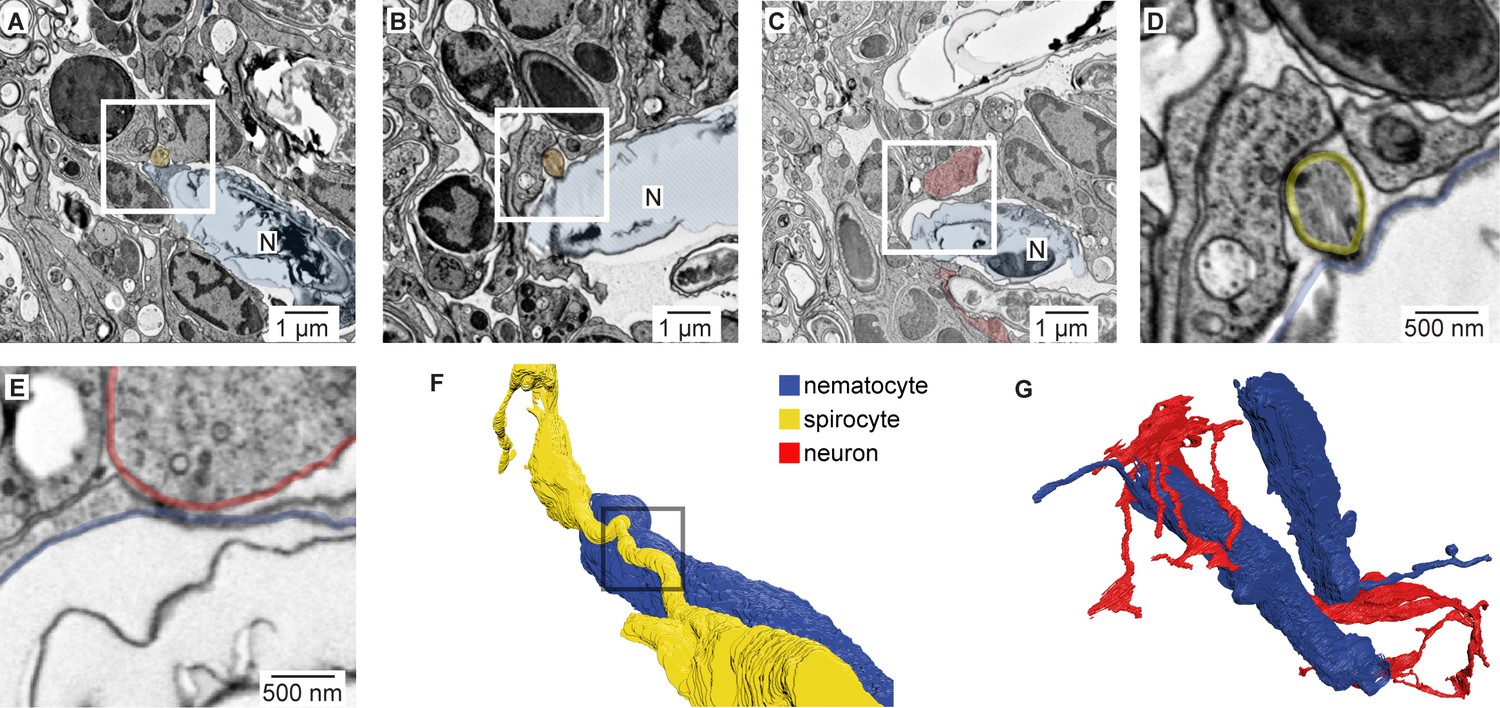
Nematocyte synaptic connections.
(A) Putative synapse between a nematocyte (N, blue) and a spirocyte (yellow). Higher magnification is shown in Figure 5A. (B) Putative synapse between a nematocyte (N, blue) and a spirocyte (orange). (C) Putative synapse between a nematocyte (N, blue) and a sensory neuron (red). (D) Higher magnification of the regions boxed in B. (E) Higher magnification of the regions boxed in C. (F) Reconstruction of the synapse between a nematocyte (N, blue) and a spirocyte (S, yellow). Box indicates site of synaptic contact shown in panel A and Figure 5A. (G) 3D reconstruction of the sensory neuron and the two nematocytes shown in Figure 5A (blue).
Figure 5—figure supplement 3

Nematocyte signaling pathways.
(A) For nematocytes with a resting membrane voltage (VRest) more positive than −60 mV, ACh was insufficient to hyperpolarize cells enough to mediate a spike following depolarizing current injection. Representative of n = 2. (B) For nematocytes with VRest more negative than −60 mV, all ACh-hyperpolarized cells produced voltage spikes following depolarizing current injection. n = 4, p<0.001 two-tailed student’s t-test. (C) Controls (related to Figures 1G and 5D) for nematocyte discharge. Control = 8, Gd3+wash = 7, Mec wash = 14, Cd2+wash = 8. (D–F). mRNA expression (transcripts per million, TPM) of calcium-binding proteins (D), calcium exchangers (E), and calcium ATPases (F) in nematocyte-enriched cells.
Figure 6
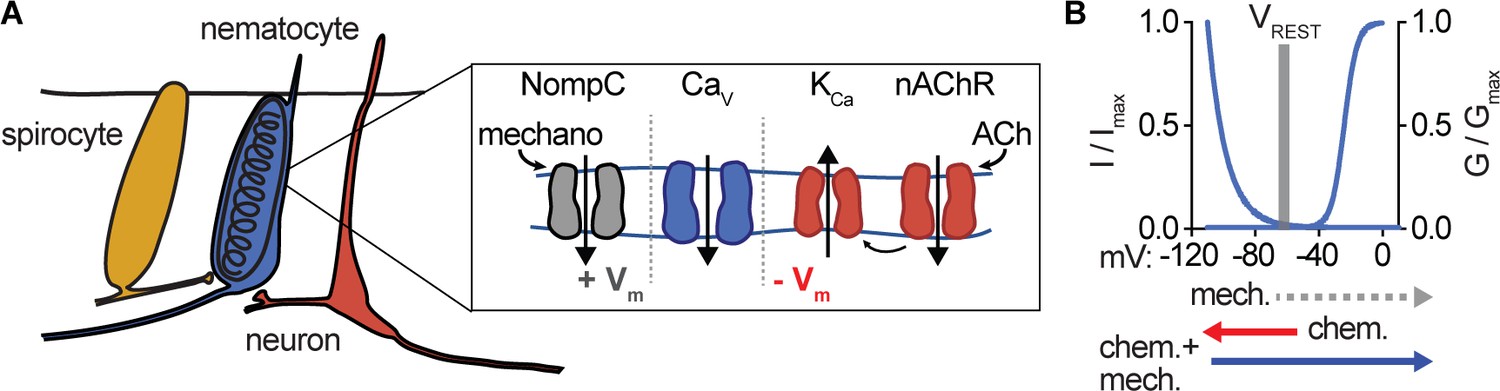
Nematocyte CaV properties filter salient chemo-tactile signals.
(A) Model for nematocyte signal integration. (B) Nematocyte CaV is inactivated at rest and thus does not amplify extraneous NompC-mediated mechanical signals. Chemosensory stimuli hyperpolarize nematocytes through ACh signaling to relieve inactivation of CaV channels, which can then amplify mechanical stimuli to engage discharge.
Tables
Key resources table
| Reagent type (species) or resource | Designation | Source or reference | Identifiers | Additional information |
|---|---|---|---|---|
| Strain, strain background (Nematostella vectensis, adult, male and female) | Nematostella vectensis | Woods Hole MarineBiological Laboratory | ||
| Strain, strain background (Nematostella vectensis, stable transgenic line, adult, male and female) | NvElav1::mOrange | (Nakanishi et al., 2012) | ||
| Cell line (Homo-sapiens) | HEK293T | ATCC | CRL-3216 | |
| Antibody | Anti- DsRed (Rabbit Polyclonal) | TaKaRa | Cat#632496 | 1:500 |
| Recombinant DNA reagent | nCaV: cacna1a (plasmid) | Plasmid fromour lab (see Materials and methods) | Nematostella nCaV α | |
| Recombinant DNA reagent | nCaV: cacna2d1(plasmid) | Plasmid from our lab (see Materials and methods) | Nematostella nCaV α2δ | |
| Recombinant DNA reagent | nCaV: cacnb2 (plasmid) | Plasmid from our lab (see Materials and methods) | Nematostella nCaV β | |
| Recombinant DNA reagent | nNompC (plasmid) | Plasmid from our lab (see Materials and methods) | Nematostella nNompC | |
| Recombinant DNA reagent | Rat cacna2d1 | (Lin et al., 2004) | Addgene Plasmid #26575 | Rat mCaV α2δ |
| Recombinant DNA reagent | Mouse cacna1a | (Richards et al., 2007) | Addgene Plasmid #26578 | Mouse mCaV α |
| Recombinant DNA reagent | Rat cacnb2a | (Wyatt et al., 1998) | Addgene Plasmid #107424 | Rat mCaV β |
| Recombinant DNA reagent | dNompC-GFP | YN Jan (UCSF) | N/A | Drosophila nNompC |
| Sequence-based reagent | RACE Primer | Primer generated in our lab (see Materials and methods) | PCR primer | GATTACGCCAAGCTTTATGCGTCCAATCGTACTTGTCGGC |
| Sequence-based reagent | RACE Primer | Primer generated in our lab (see Materials and methods) | PCR primer | GATTACGCCAAGCTTGCCGACAAGTACGATTGGACGCATA |
| Sequence-based reagent | Cacnb primer F | Primer generated in our lab (see Materials and methods) | PCR primer | CAGAGCCAGGCCTGAGCGAG |
| Sequence-based reagent | Cacnb primer R | Primer generated in our lab (see Materials and methods) | PCR primer | GCCCCGTTAAAAGTCGAGAG |
| Commercial assay or kit | SMARTer RACE 5’/3’ Kit | TaKaRa | Cat# 634858 | |
| Chemical compound, drug | N-Acetylneuraminic acid (NANA) | Sigma | Cat#857459 | |
| Chemical compound, drug | Glycine | Sigma | Cat#410225 | |
| Chemical compound, drug | Acetylcholine chloride | Sigma | Cat#A6625 | |
| Chemical compound, drug | GdCl3 | Sigma | Cat#7532 | |
| Chemical compound, drug | TEA | Sigma | Cat#86614 | |
| Chemical compound, drug | GDPβS | Sigma | Cat#G7637 | |
| Chemical compound, drug | CdCl2 | Sigma | Cat#202908 | |
| Chemical compound, drug | Mecamylamine | Tocris | Cat#2843 | |
| Chemical compound, drug | Glutamate | Tocris | Cat#0218 | |
| Chemical compound, drug | γ-Aminobutyric acid (GABA) | Tocris | Cat#0344 | |
| Chemical compound, drug | Nicotine ditartrate | Tocris | Cat#3546 | |
| Chemical compound, drug | Tubocurarine | Tocris | Cat#2820 | |
| Chemical compound, drug | BAPTA | Molecular Probes | Cat#B-1204 | |
| Software, algorithm | Cutadapt | (Martin, 2011) | https://github.com/marcelm/cutadapt/ | |
| Software, algorithm | Trinity | (Grabherr et al., 2011) | https://github.com/trinityrnaseq | |
| Software, algorithm | InterProScan | (Jones et al., 2014) | https://github.com/ebi-pf-team/interproscan/ | |
| Software, algorithm | HMMER | (Eddy, 2009) | http://hmmer.org/ | |
| Software, algorithm | Pfam | (El-Gebali et al., 2019) | https://pfam.xfam.org/ | |
| Software, algorithm | DIAMOND | (Buchfink et al., 2015) | https://github.com/bbuchfink/diamond | |
| Software, algorithm | Clustal Omega | (Sievers et al., 2011) | https://www.ebi.ac.uk/Tools/msa/clustalo/ | |
| Software, algorithm | Fiji: Linear Stack Alignment with SIFT | (Schindelin et al., 2012) | https://fiji.sc/ | |
| Software, algorithm | Matlab custom script | Matlab code provided in source data for Figure 1 | See supplemental table for script | |
| Software, algorithm | VAST | (Berger et al., 2018) | https://software.rc.fas.harvard.edu/lichtman/vast/ | |
| Software, algorithm | 3D Studio Max 2019 | (Autodesk, 2019) | https://www.autodesk.com |
Additional files
Download links
A two-part list of links to download the article, or parts of the article, in various formats.
Downloads (link to download the article as PDF)
Open citations (links to open the citations from this article in various online reference manager services)
Cite this article (links to download the citations from this article in formats compatible with various reference manager tools)
A molecular filter for the cnidarian stinging response
eLife 9:e57578.
https://doi.org/10.7554/eLife.57578


