Resource plasticity-driven carbon-nitrogen budgeting enables specialization and division of labor in a clonal community
- InStem - Institute for Stem Cell Science and Regenerative Medicine, India
- Simons Centre for the Study of Living Machines, National Center for Biological Sciences, Tata Institute for Fundamental Research, India
- Manipal Academy of Higher Education, India
Figures
Figure 1 with 1 supplement
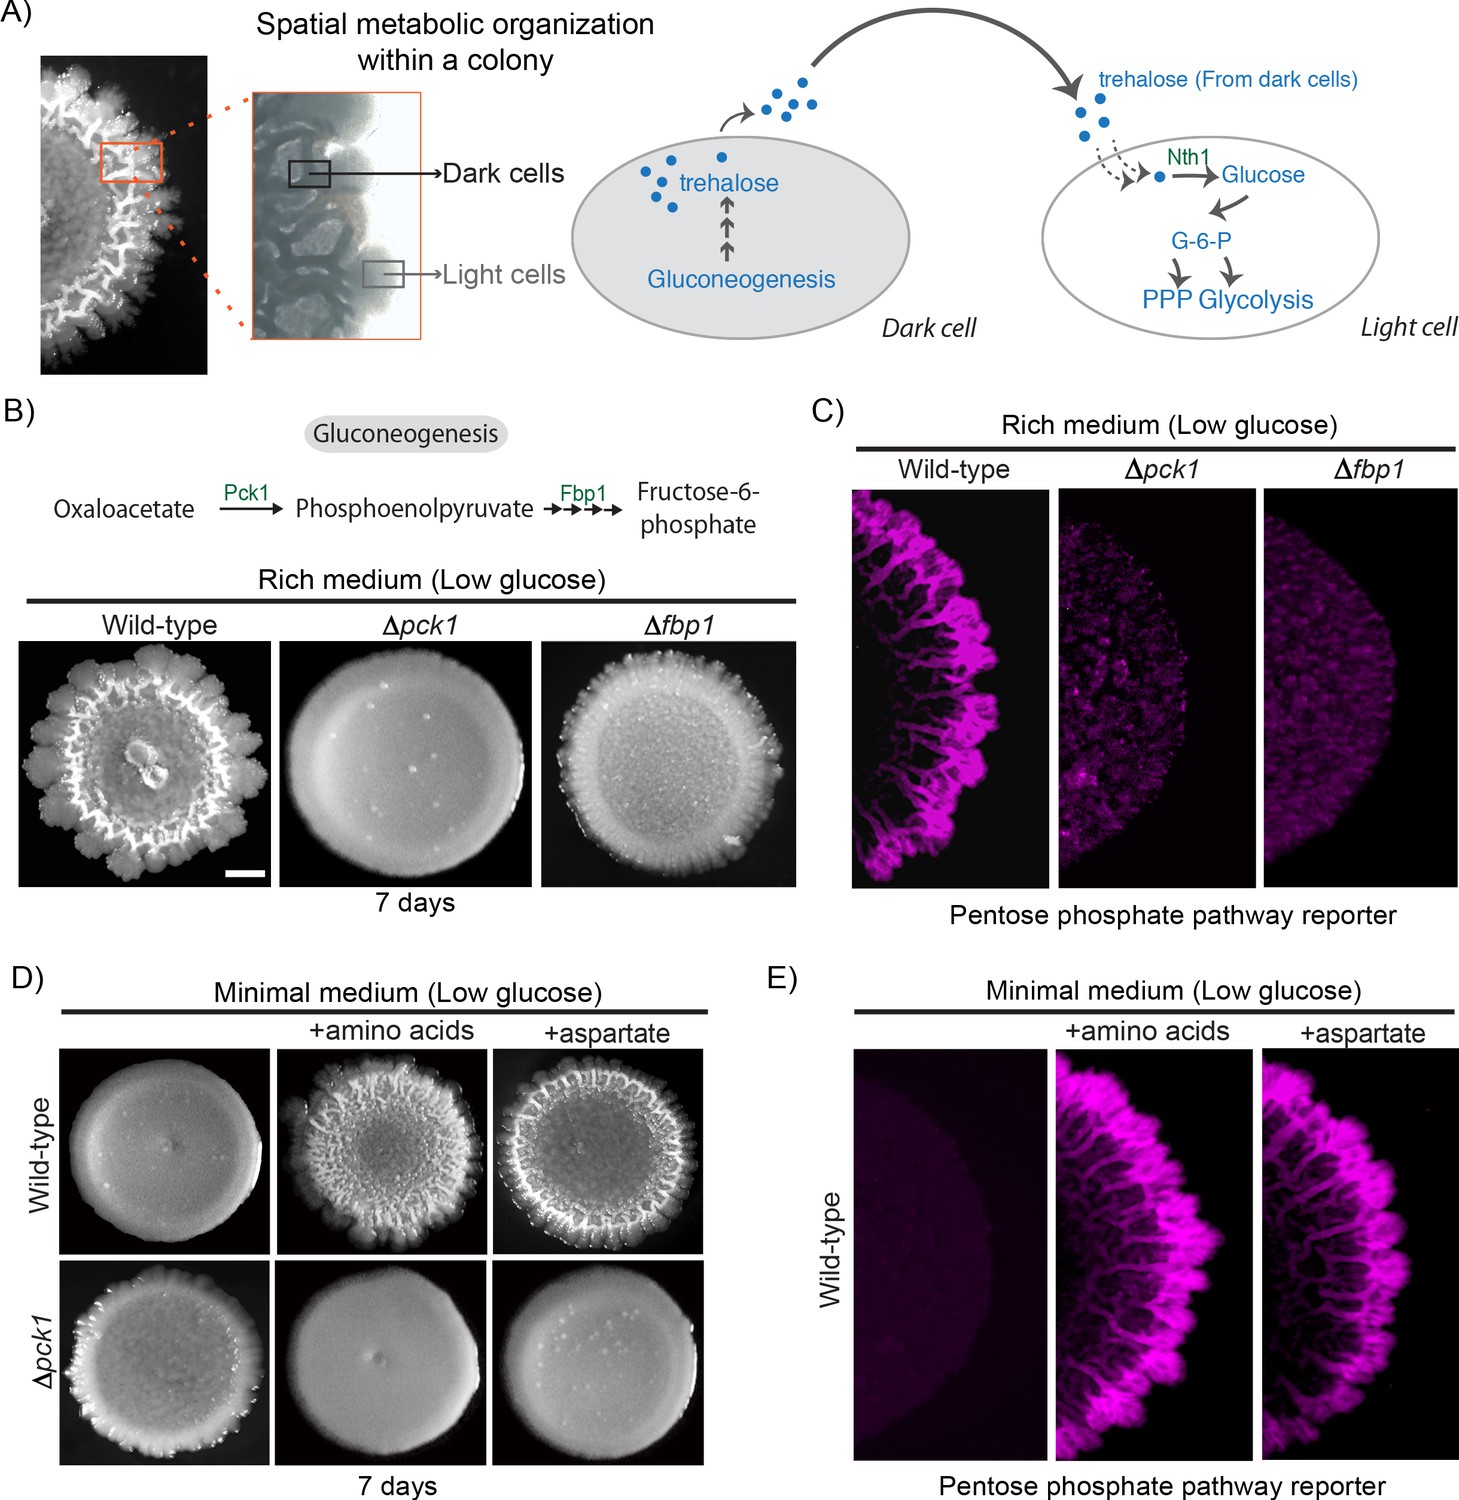
Amino acid driven gluconeogenesis is critical for the emergence of phenotypic heterogeneity.
(A) External trehalose controls the emergence of light cells. Trehalose synthesized by the dark cells fuels glycolysis and pentose phosphate pathway in light cells. (B) Gluconeogenesis is required for development of structural morphology in the colonies. The panel shows the morphology of mature wild-type and gluconeogenic mutant (∆pck1 and ∆fbp1) yeast colonies in rich medium, with supplemented glucose as the sole variable. Scale bar: 2 mm. Also see Figure 1—figure supplement 1A for more information. (C) Spatial distribution of mCherry fluorescence across a colony, indicating the activity of a reporter for pentose phosphate pathway (TKL1) activity in wild-type and gluconeogenesis defective mutants (∆pck1 and ∆fbp1). (D) Amino acids and in particular aspartate is required for the development of structural morphologies in the colonies in a gluconeogenesis dependent manner. The panel shows the morphology of mature wild-type and gluconeogenesis-defective (∆pck1) yeast colonies in minimal medium (low glucose), with and without amino acid supplementation, or with only aspartate supplementation. (E) Spatial distribution of mCherry fluorescence across a colony, indicating the activity of a reporter for pentose phosphate pathway (TKL1) activity in wild-type colonies grown either in minimal media or minimal media supplemented with all amino acids or just aspartate.
Figure 1—figure supplement 1
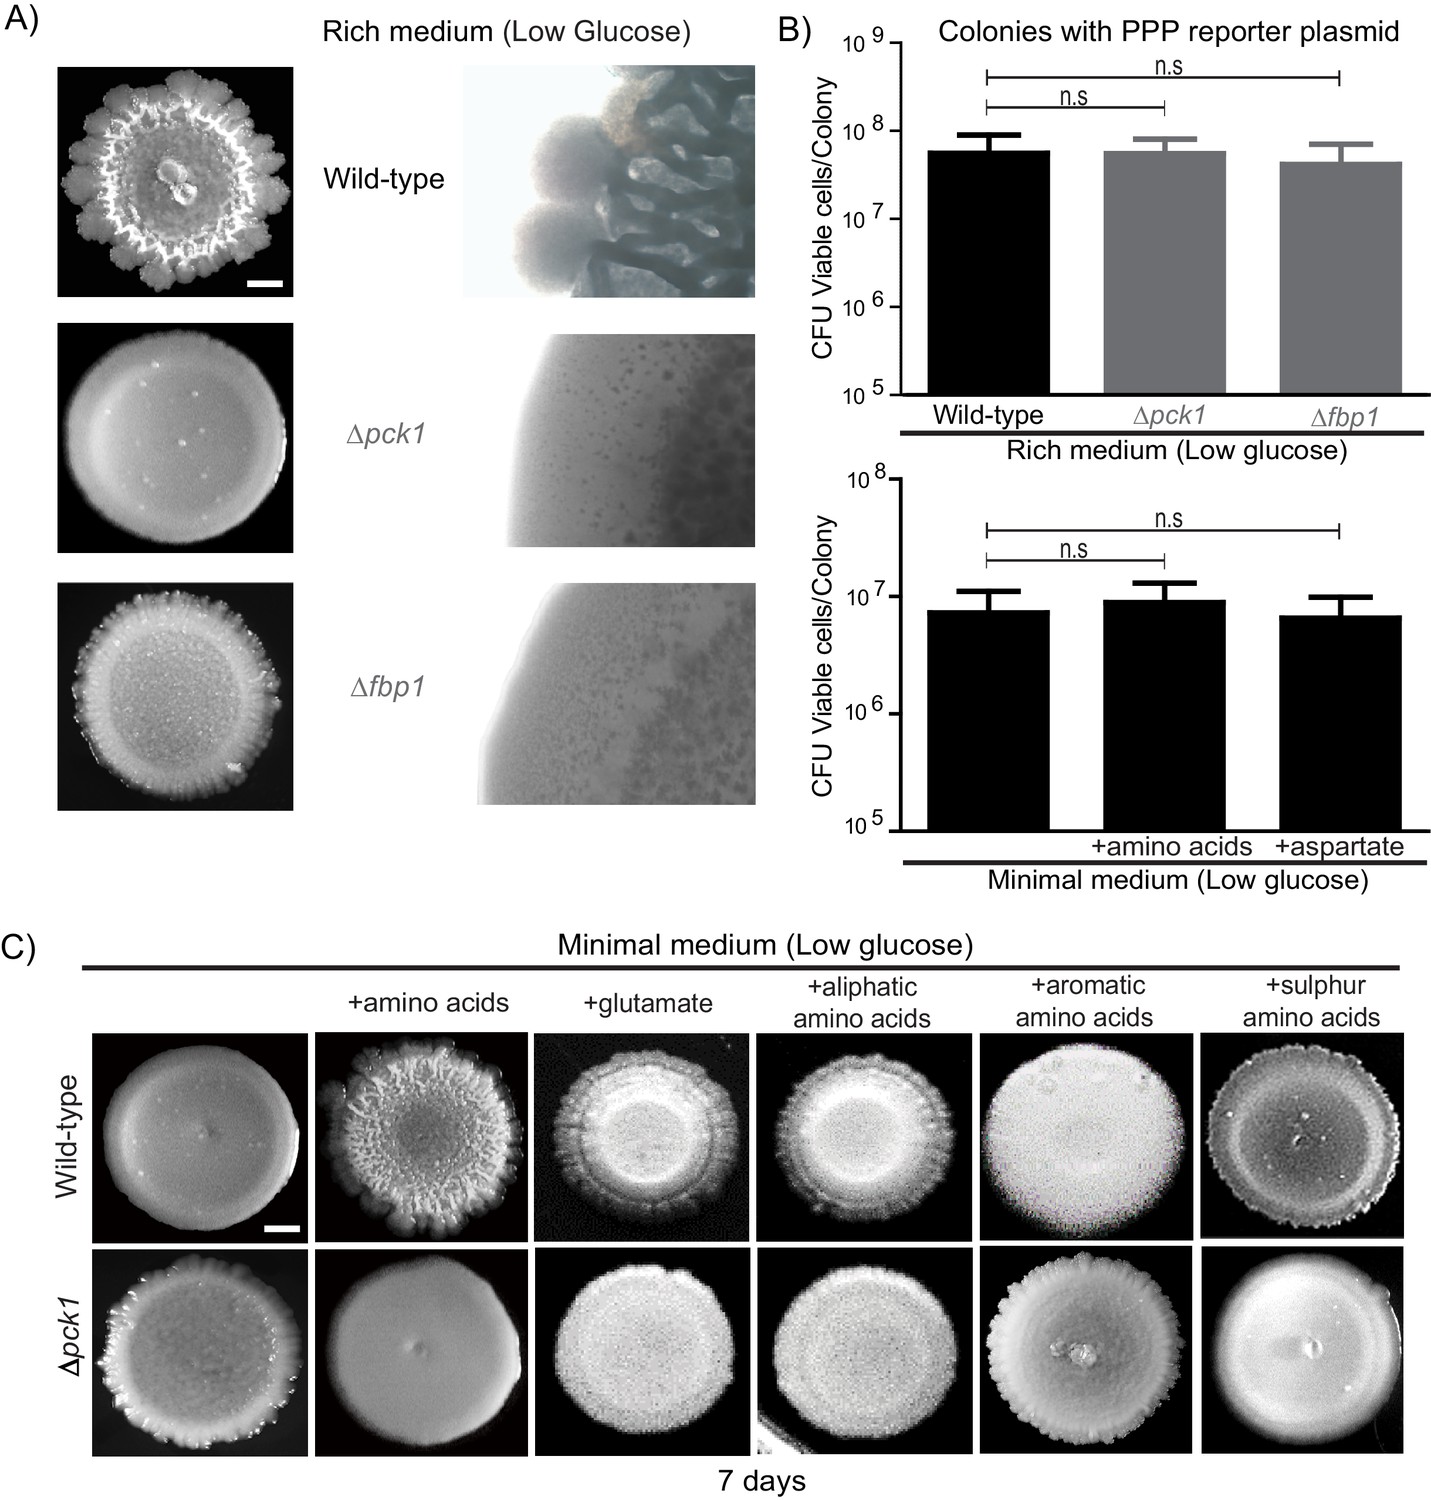
Amino acid dependent gluconeogenesis drives the development of complex colonies exhibiting specialized cell states.
(A) Gluconeogenesis is required for development of structural morphology in the colonies. The panel shows the morphology of mature wild-type and gluconeogenesis defective (∆pck1 and ∆fbp1) yeast colonies in rich medium, with supplemented glucose as the sole variable. Scale bar: 2 mm. (B) Viability of cells in wild-type, Δpck1 and Δfbp1 colonies grown in rich medium (low glucose) for 7 days were measured by collecting cells from the colonies and plating them in rich medium (n = 5). Statistical significance was calculated using unpaired t test and error bars represent standard deviation. Similarly, viability of cells in wild-type colonies grown either in minimal media or minimal media supplemented with all amino acids, or just aspartate, were measured by collecting cells from the colonies and plating them in rich medium (n = 5). Statistical significance was calculated using unpaired t test and error bars represent standard deviation. (C) The panel shows the morphology of mature wild-type and gluconeogenesis defective (∆pck1) yeast colonies grown for 7 days in minimal medium (low glucose), with and without supplementation of the indicated amino acids. Scale bar: 2 mm.
Figure 2 with 1 supplement
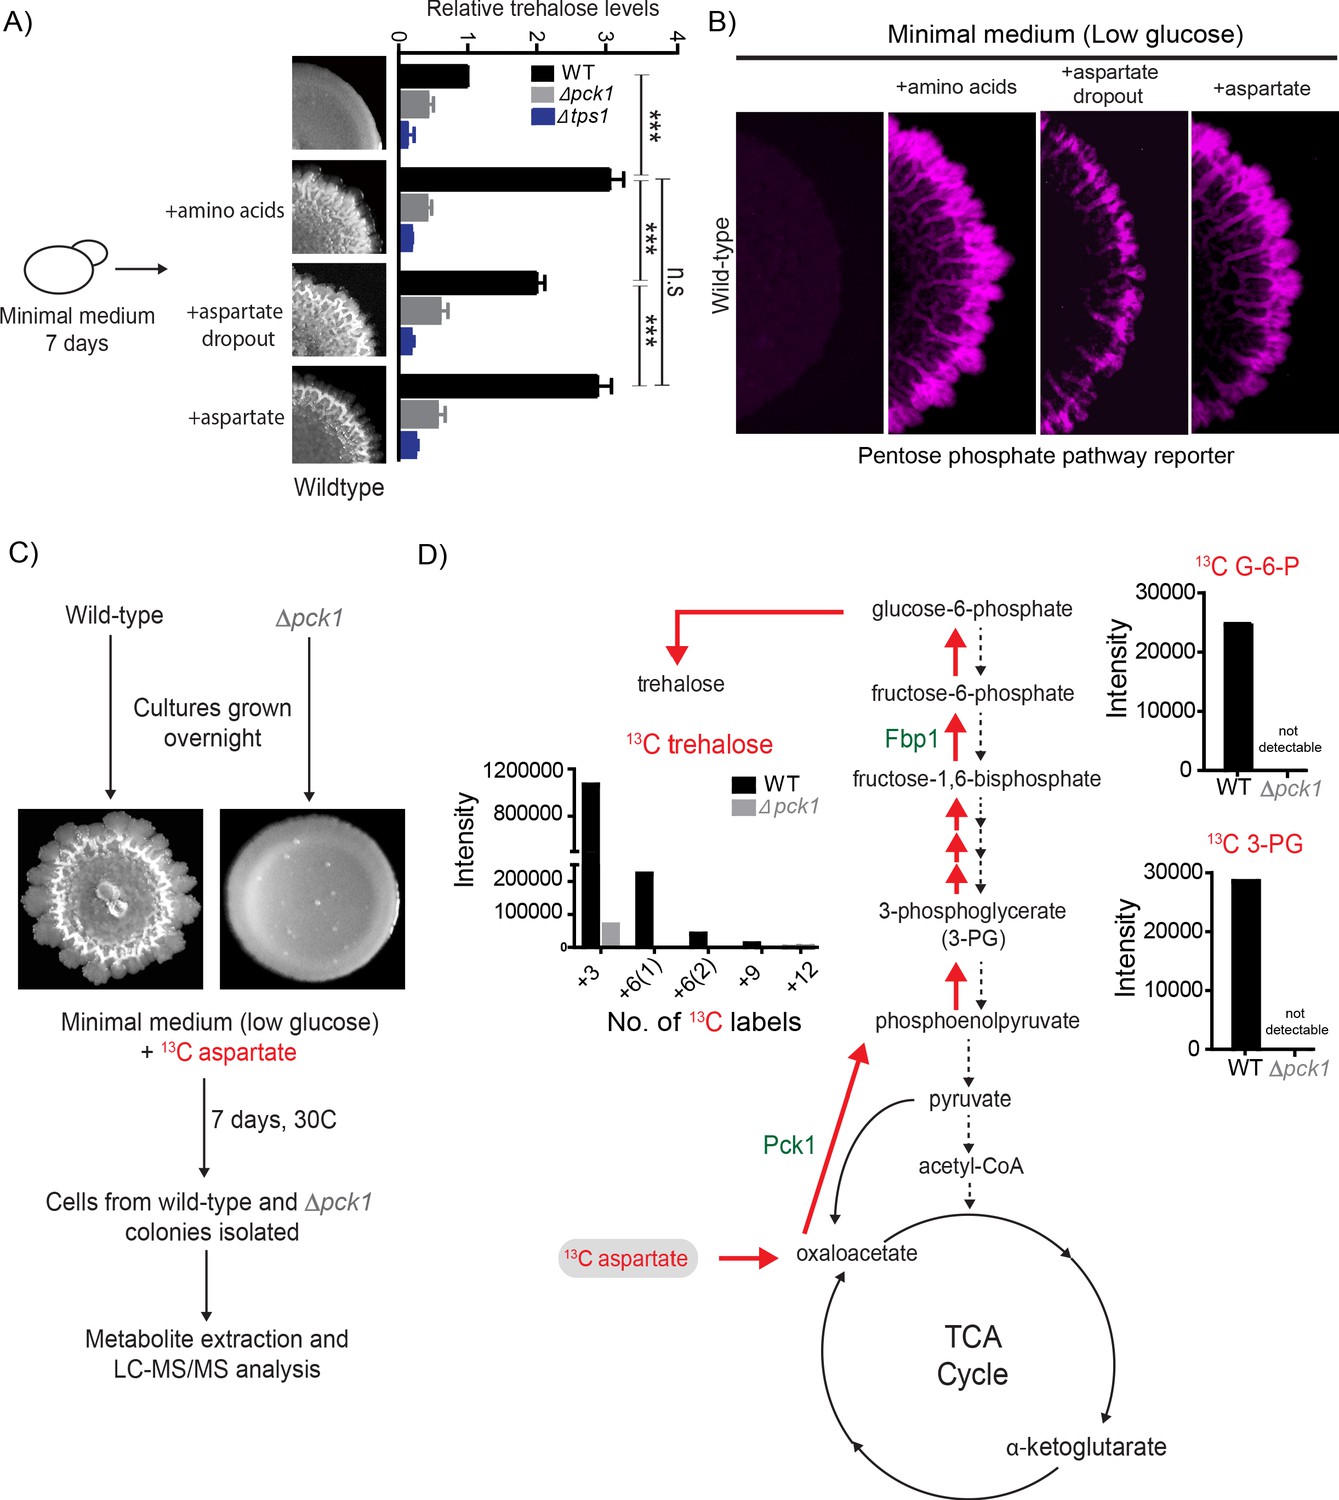
Aspartate enables light cell emergence by fueling trehalose synthesis.
(A) Comparative steady-state amounts of trehalose measured in wild-type, ∆pck1 (gluconeogenesis defective) and ∆tps1 (trehalose synthesis defective) colonies grown in minimal medium, or minimal medium supplemented with either all amino acids, or aspartate alone, or all amino acids without aspartate (aspartate dropout) (n = 3). Colony insets represent wild-type colony morphology in different media conditions. Statistical significance was calculated using unpaired t test (*** indicates p<0.001) and error bars represent standard deviation. (B) Aspartate significantly contributes to colony development and emergence of light cells. Spatial distribution of mCherry fluorescence across a colony, indicating the activity of a reporter for pentose phosphate pathway (TKL1) activity in wild-type yeast colonies grown in minimal medium (low glucose), supplemented with either all amino acids, or aspartate alone, or all amino acids without aspartate (aspartate dropout). Also see Figure 2—figure supplement 1A for more information. (C and D) Metabolic-flux based analysis comparing relative 13C incorporation from 13C-labeled aspartate into newly synthesized gluconeogenic intermediates (3-phosphoglycerate and glucose-6-phosphate) and trehalose, in wild-type and ∆pck1 colonies.
Figure 2—figure supplement 1
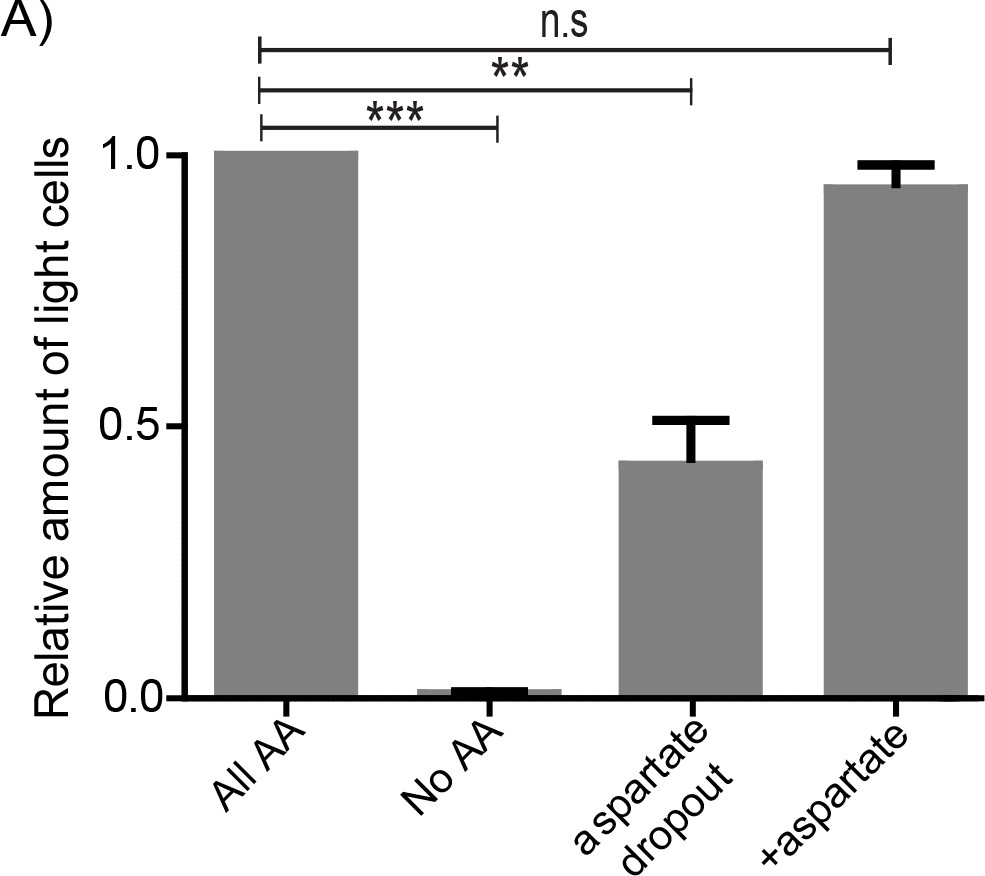
Amino acids, in particular aspartate is critical for the maintenance of light cell populations.
(A) The light cell population was calculated by spotting wild-type cells harboring the PPP reporter plasmid either in minimal media or minimal media supplemented with either all amino acids or aspartate or all amino acids without aspartate (aspartate dropout). After 7 days of growth, cells from the entire colony (for each media condition) were collected and the percentage of fluorescent cells from colonies grown in each media condition were quantified (2000 cells per colony and three colonies per media condition). Statistical significance was calculated using unpaired t test (** indicates p<0.01, *** indicates p<0.001) and error bars represent standard deviation.
Figure 3 with 5 supplements

An agent-based model for carbon-nitrogen budgeting reveals principles of metabolic heterogeneity via self-organization.
(A) A model schematic based on an experimental understanding of aspartate utilization by the two cell types in the system. Dark and light cells are colored accordingly. Dark cells take in aspartate, budget it for nitrogen (N) and carbon (C) needs. Some of the accumulating C is released into the extracellular environment as trehalose, triggering the switching into light cells and also acting as the primary C source for light cells as it diffuses in the 2D space. On the right, we have a representative simulated colony generated from a default parameter set. Parameters are indicated in the parentheses. (B) Varying the fraction of aspartate flux allocated towards nitrogen (N) in order to observe the simulated colony over the same length of time. When the majority of the flux is used for carbon (C) needs, the simulated colonies resemble experimental colonies. If less aspartate is allocated for C rather than N, the developed colonies no longer resemble the experimental colonies. (C) Varying the relative rate of aspartate uptake compared to trehalose uptake by the light cells in order to observe simulated colonies over the same length of time. If the rate is the same, as shown in the first simulated colony where AspU = 1.0, the colony is underdeveloped. A middle value of AspU = 4.0 generates colonies similar to experimental colonies, while for a large value of AspU on the right, the dark cell blocks and light cell blocks have similar division times and the final colony is larger.
Figure 3—figure supplement 1
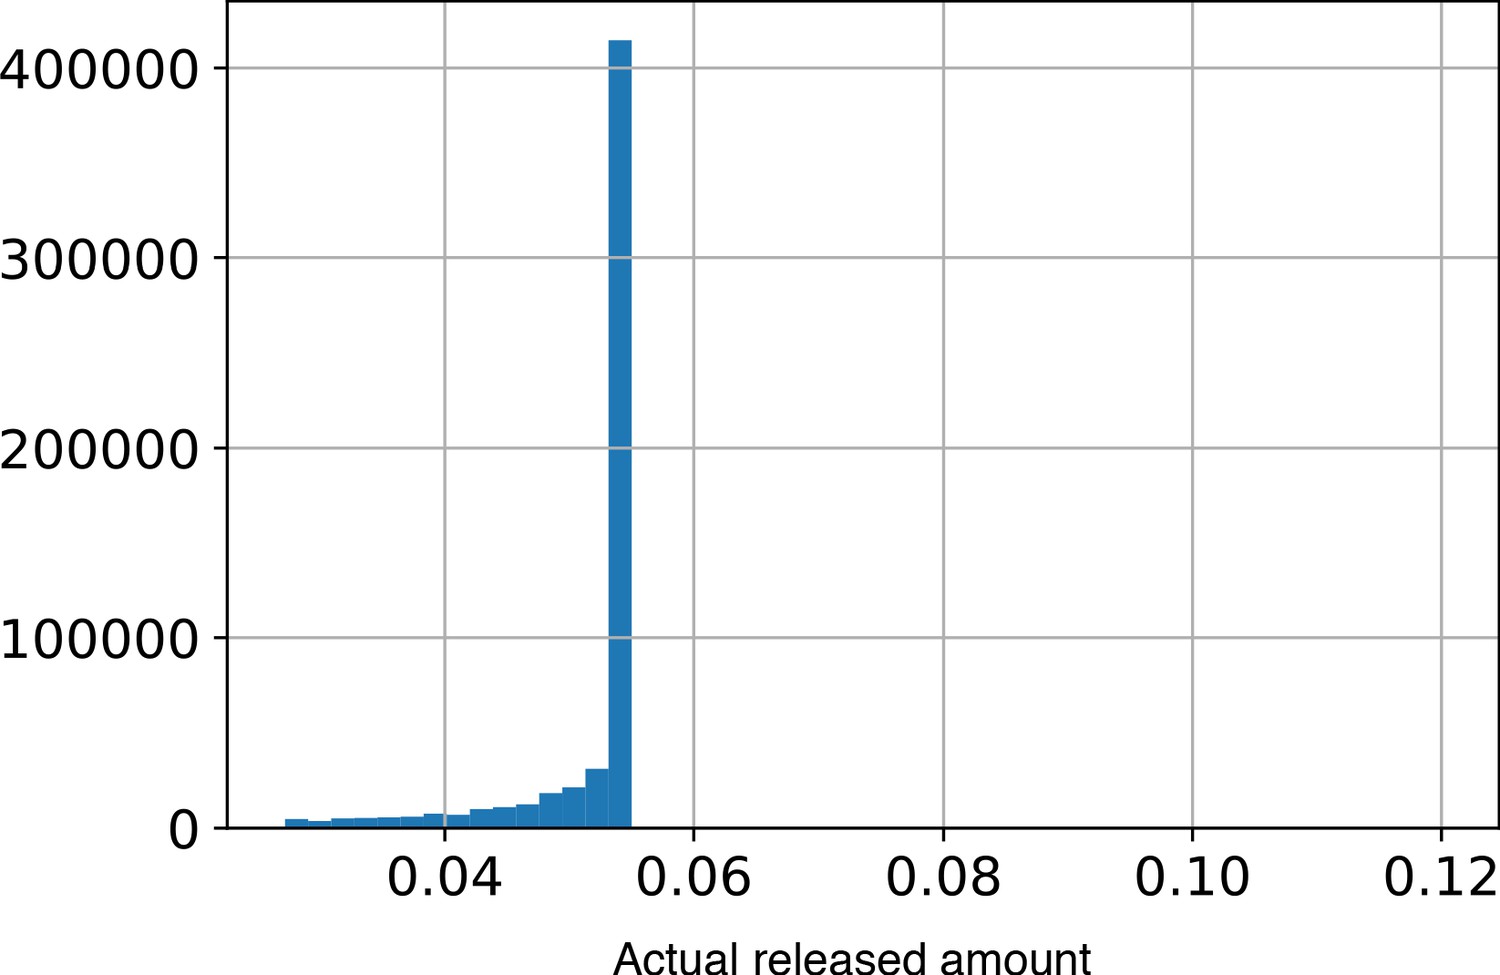
A histogram of the amount of trehalose secreted per unit time per dark cell throughout a simulation.
Dark cells secrete a fraction, Pf, of their internal carbon levels as trehalose. However, we place an upper limit on the absolute amount of secreted trehalose at 0.12 units/Time. This limit is meant to mimic realistic export conditions. An assumption made is that due to physiological constraints on the cell, the amount of trehalose exported/present outside should not be arbitrarily large. This figure shows that most of the time, the cells are operating well below this upper limit. This demonstrates that the rate of trehalose production in the system is governed by other processes of the model pertaining to uptake, budgeting and growth by division.
Figure 3—figure supplement 2
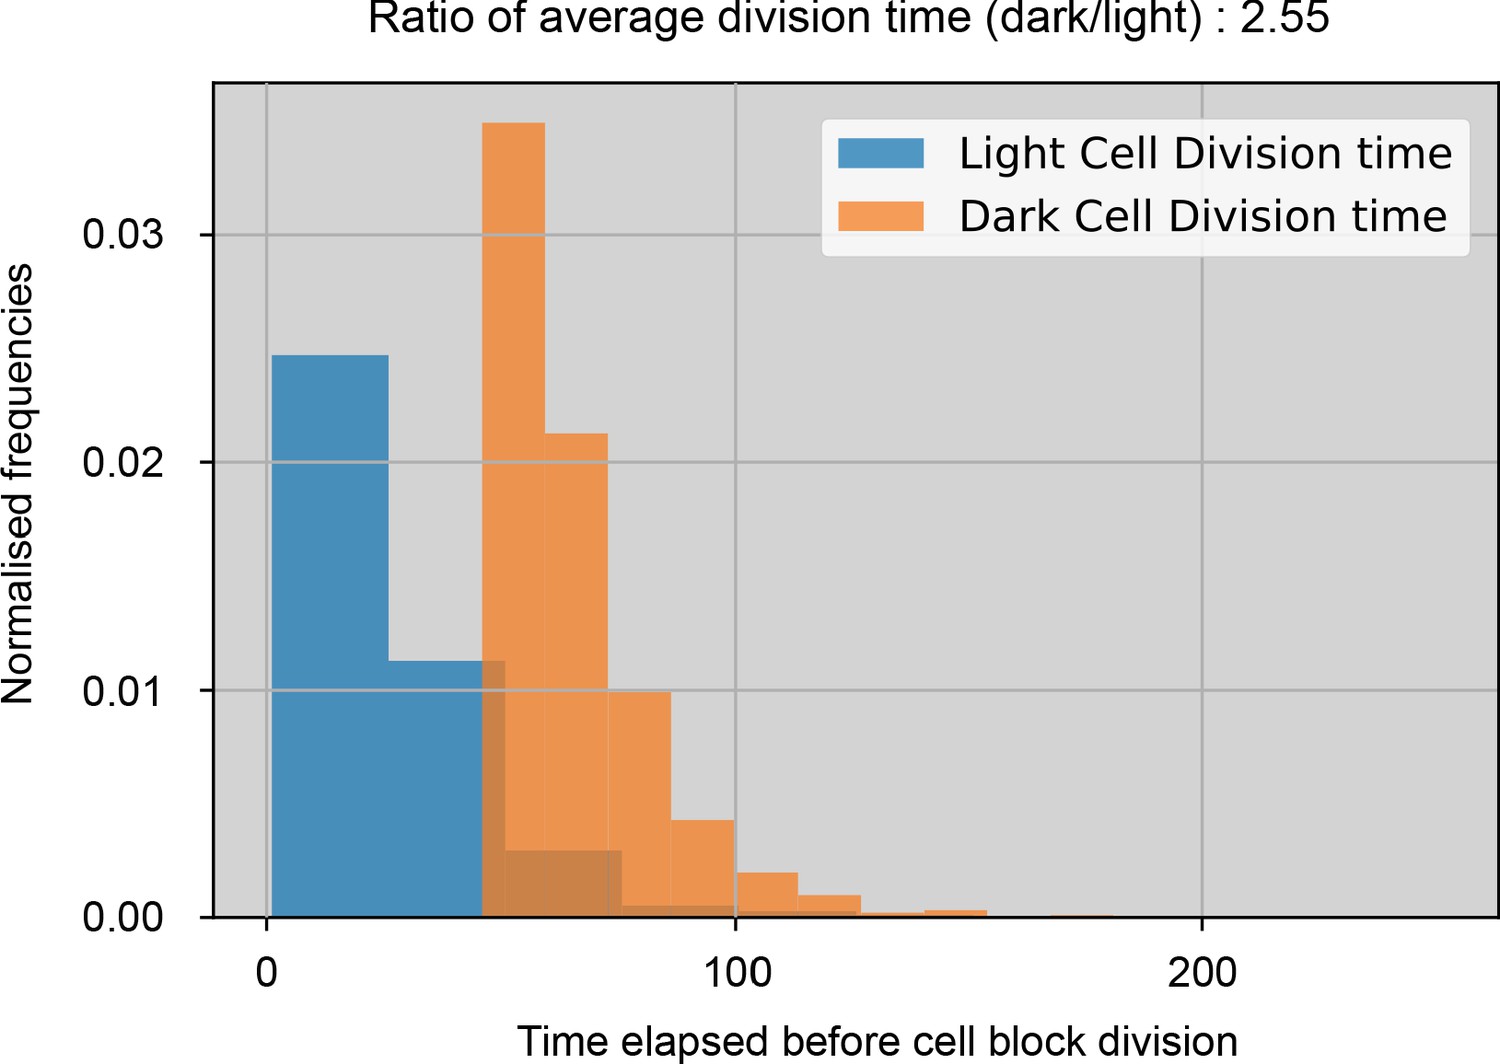
Normalized histograms of dark and light cell block division times through one simulation with default parameters.
The bins along the x-axis measure the time steps elapsed between a cell block’s birth and when it divides. The cell blocks have the same probability of division once they build up sufficient N and C reserves. These histograms illustrate that the division times in our simulation are different due to resource requirements being fulfilled at different times.
Figure 3—figure supplement 3
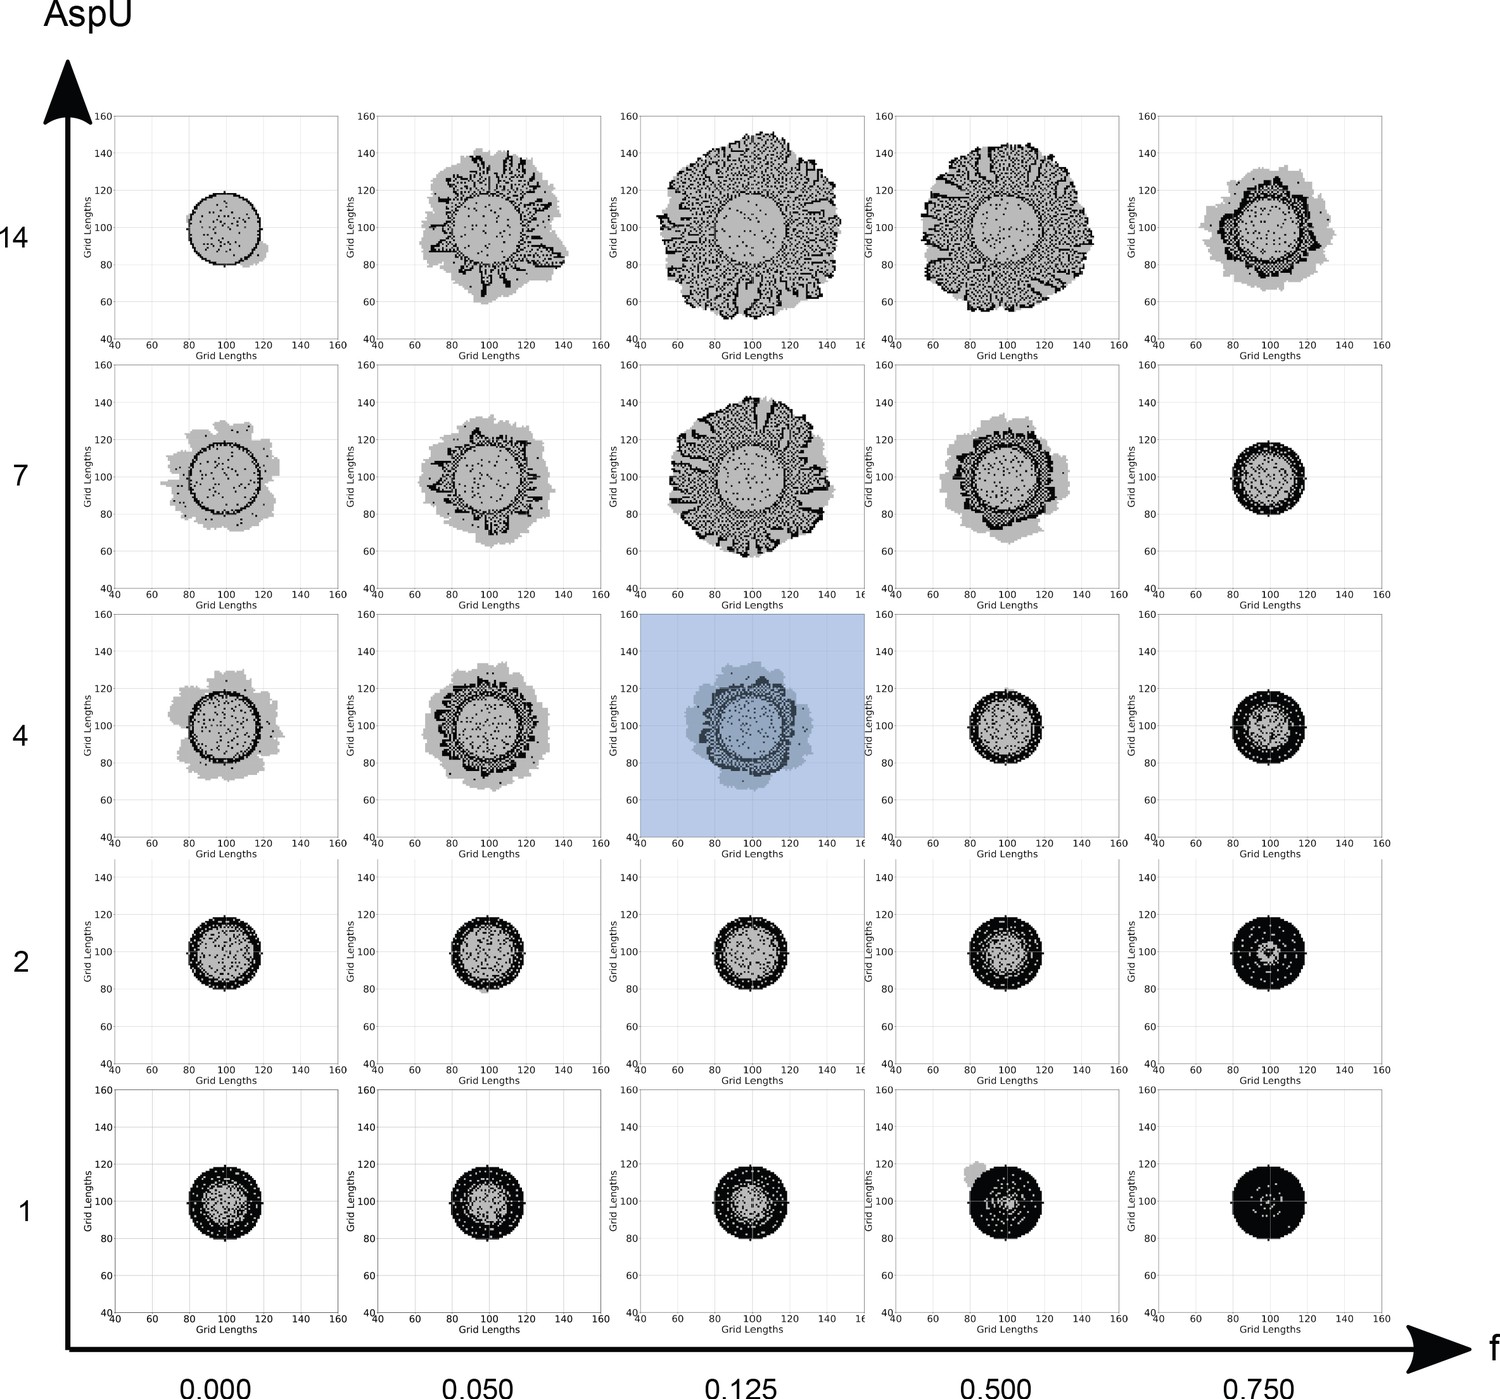
Different final colony compositions for different combinations of the main model parameters, ‘f’ and ‘AspU’.
Each panel is a generated colony using the values of ‘f’ and ‘AspU’ corresponding to its location. Note: the axes values are not on a linear or logarithmic scale but are chosen for representative purposes to show parametric trends. Increasing AspU increases the rate of aspartate influx into the system. Overall, this generates larger colonies. Since dark cell blocks are not limited by the trehalose production, they divide at about the same rate as light cell blocks. This is contrary to experimental observations where dark cells grow slower than light cells. With the parameter f, extremely low values allocate too little of the metabolic budget to nitrogen reserves. This results in slow growing colonies which have a higher fraction of light cell blocks. On the other hand, higher values allocate too much of the budget to nitrogen reserves. This slows down the rate of trehalose production, thereby slowing down the emergence of light cells and their proliferation and gives us smaller overall colonies. Thus, increasing both AspU and f together leads to realistic looking colonies as observed along the top diagonal elements in this figure. The blue shaded central panel in the figure is a colony generated using default values of f and AspU.
Figure 3—figure supplement 4
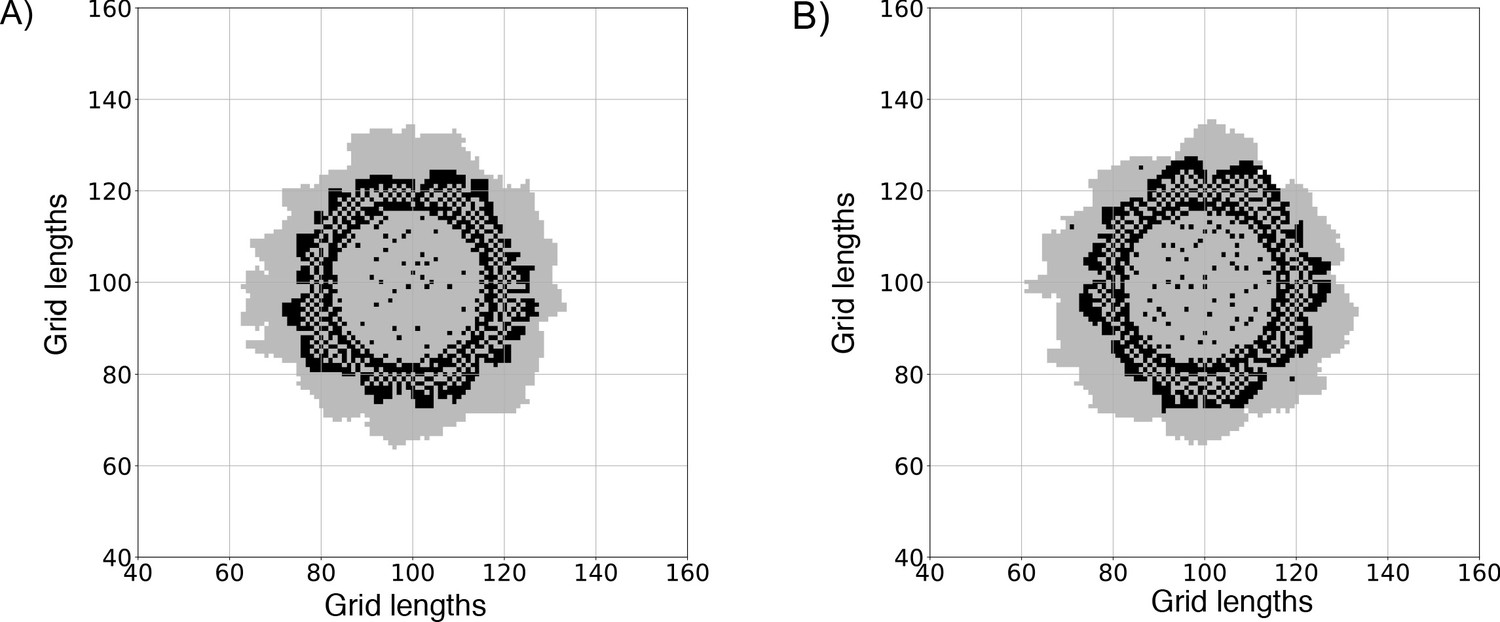
Comparing simulated colonies generated with a low-switching rule against the older no-switching rule (light switching to dark).
(A) A colony where light cell blocks are not allowed to switch to dark cell blocks during the simulation. This is similar to the original model implemented in Varahan et al., 2019. (B) A colony implemented using our current model, where light cell blocks can switch to dark cell blocks with a low probability (PLD = 10−4/Time), if the level of trehalose at their location is below a certain threshold (TLD = 10−4 units). The two panels illustrate how the colonies are not significantly different, but the current model does not constrain the light cells to remain fixed in their metabolic state.
Figure 3—figure supplement 5
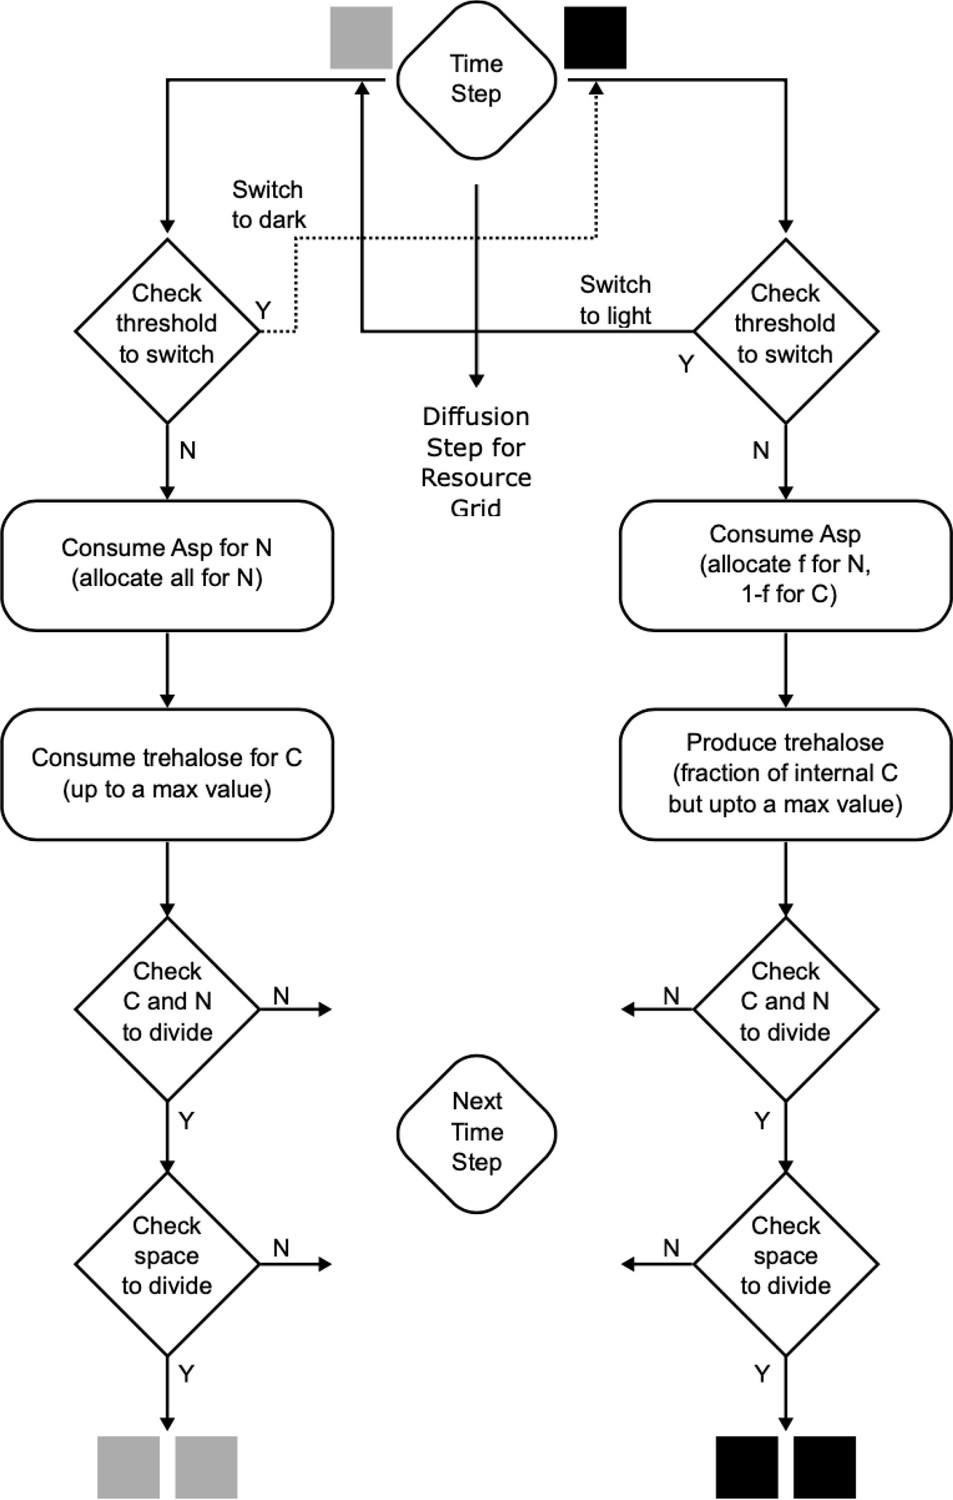
A flowchart of the simulation algorithm highlighting all the processes in the mathematical model.
A step-by-step description is provided in the Materials and methods section of the main text.
Figure 4
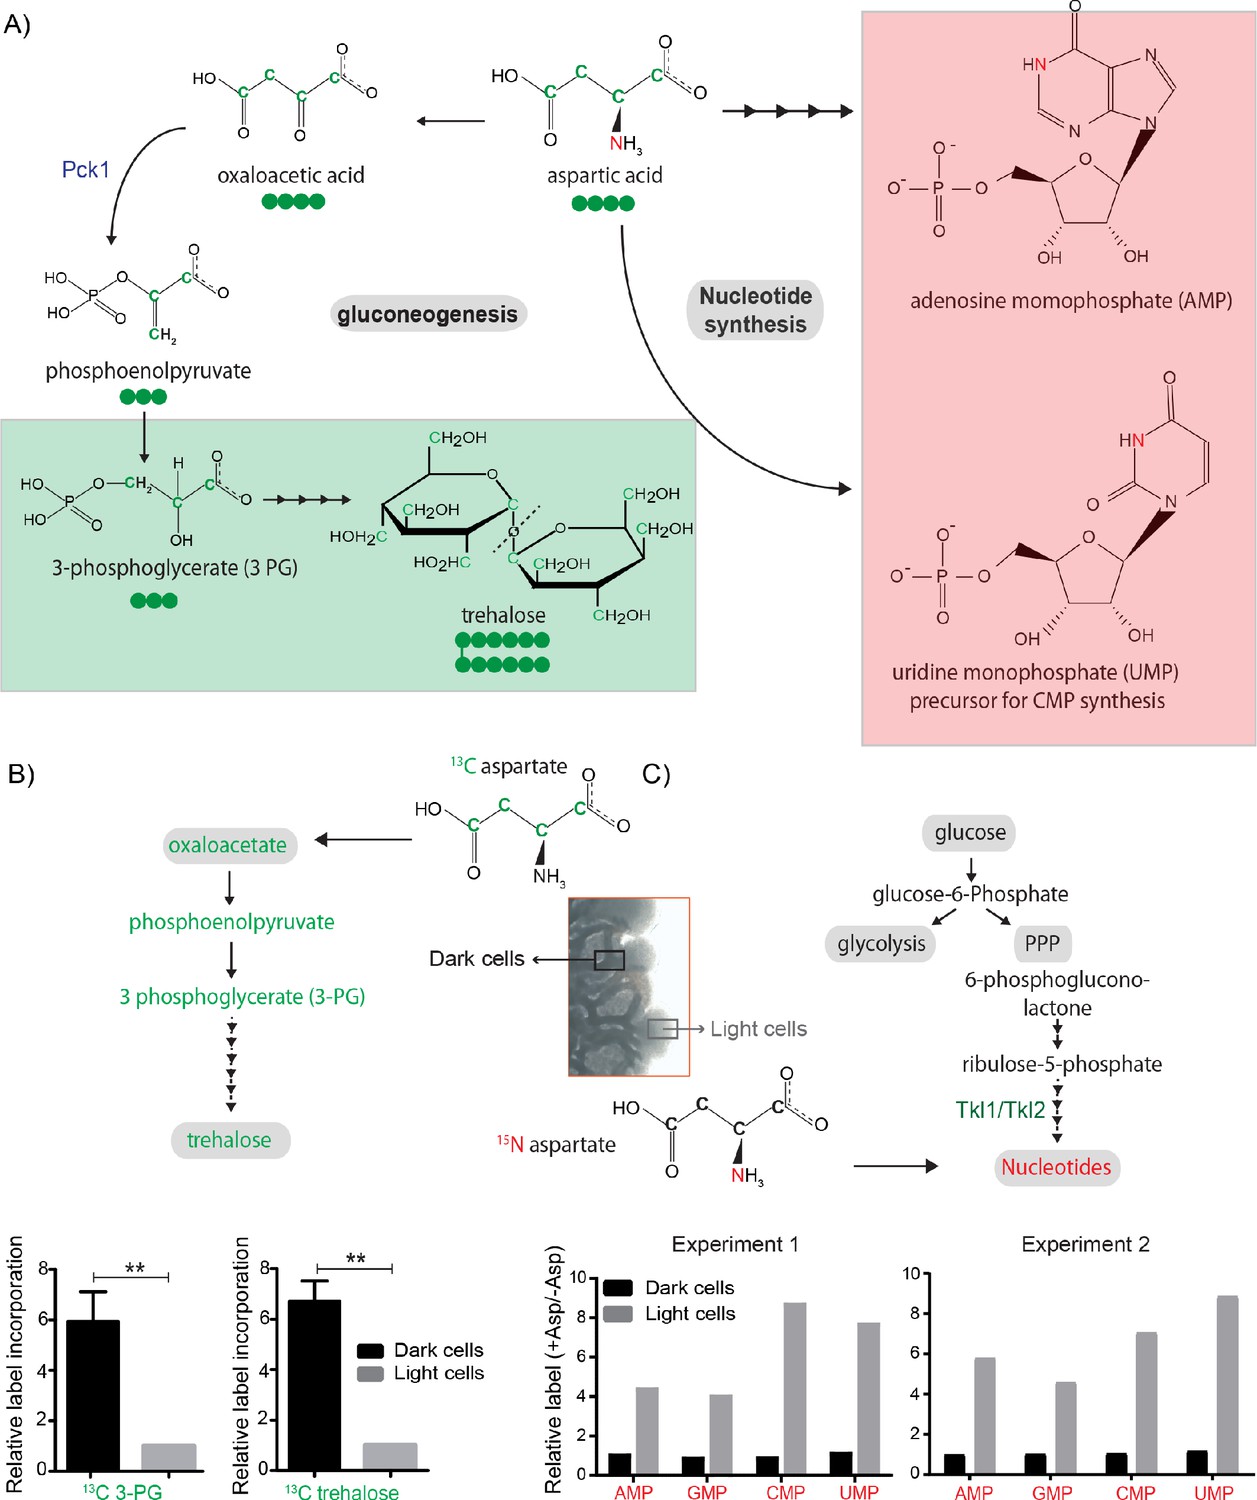
Aspartate is differentially utilized as a carbon or nitrogen currency in light and dark cells.
(A) Metabolic fates of aspartate: The carbon of aspartate (green) can be used for synthesis of molecules like trehalose via gluconeogenesis (green boxed). The nitrogen of aspartate (red) is incorporated into nucleotide precursors including inositol monophosphate (IMP) AND cytidine monophosphate (CMP) (red boxed). (B and C) Metabolic-flux based analysis comparing relative 13C incorporation from 13C labelled aspartate into newly synthesized gluconeogenic intermediate (3-phosphoglycerate) (n = 3) and trehalose, and 15N incorporation from 15N labelled aspartate into newly synthesized nucleotides, in light and dark cells (n = 2). Statistical significance was calculated using unpaired t test (** indicates p<0.01) and error bars represent standard deviation. For panel C, two independently carried out biological replicates are shown.
Figure 5
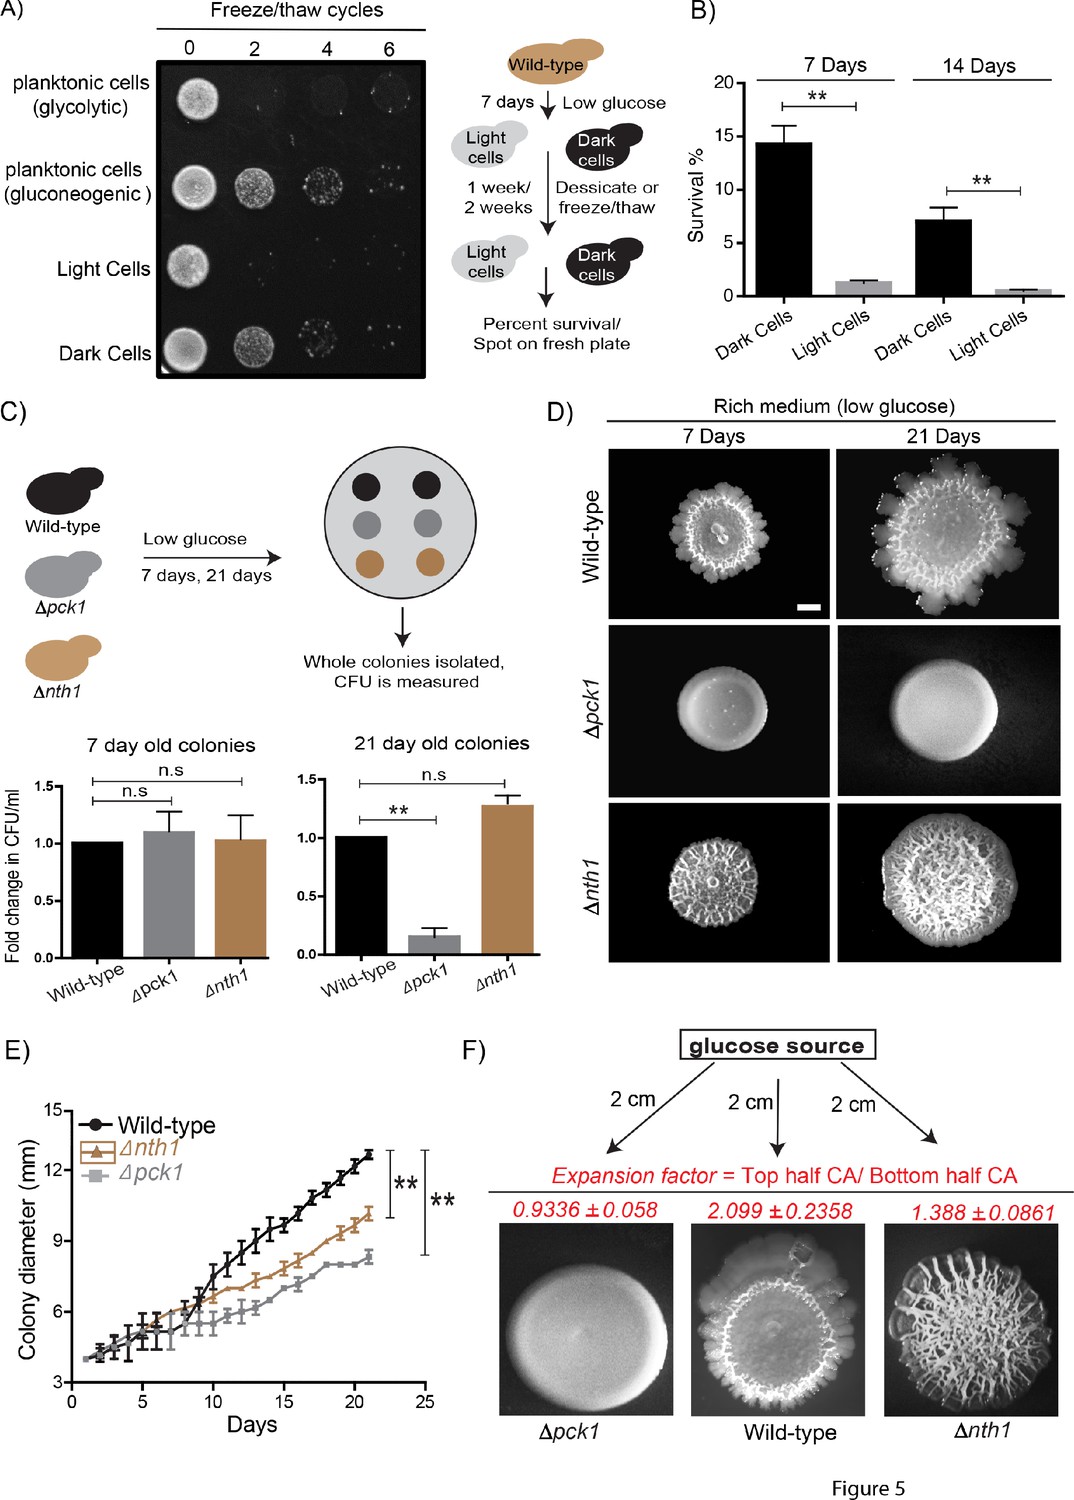
Dark and light cells exhibit division of labor and confer distinct survival and collective growth advantages to the whole colony.
(A) Equal numbers of light and dark cells were subjected to multiple freeze-thaw cycles, and survival estimated by spotting onto rich media plates and allowing growth for 18 hr. Cells grown in gluconeogenic medium (2% ethanol/glycerol) and glycolytic medium (2% glucose) were used as controls. (B) Desiccation tolerance of light and dark cells were measured after 7 days and 14 days (n = 3). Statistical significance was calculated using unpaired t test (** indicates p<0.01) and error bars represent standard deviation. (C) Long term viability of cells in wild-type (light and dark cells), Δnth1 (only dark cells) and Δpck1 (no light or dark cells) colonies were measured by growing colonies for either 7 or 21 days and collecting cells from the colonies and plating them in rich medium (n = 5). Statistical significance was calculated using unpaired t test (** indicates p<0.01) and error bars represent standard deviation. (D and E) Foraging responses of wild-type, Δnth1 and Δpck1 cells measured as a function of their ability to spread on a plate. Colony spreading was quantified by measuring the diameter of the colonies every day for 21 days (n = 3). Statistical significance was calculated using unpaired t test (** indicates p<0.01) and error bars represent standard deviation. Scale bar: 2 mm. (F) Directional foraging of light cells towards glucose was measured by growing wild-type cells, Δnth1 cells and Δpck1 cells on rich medium plates (low glucose) and placing a paper disc soaked in 50% glucose at a distance of 2 cm from the colonies (n = 3).
Figure 6
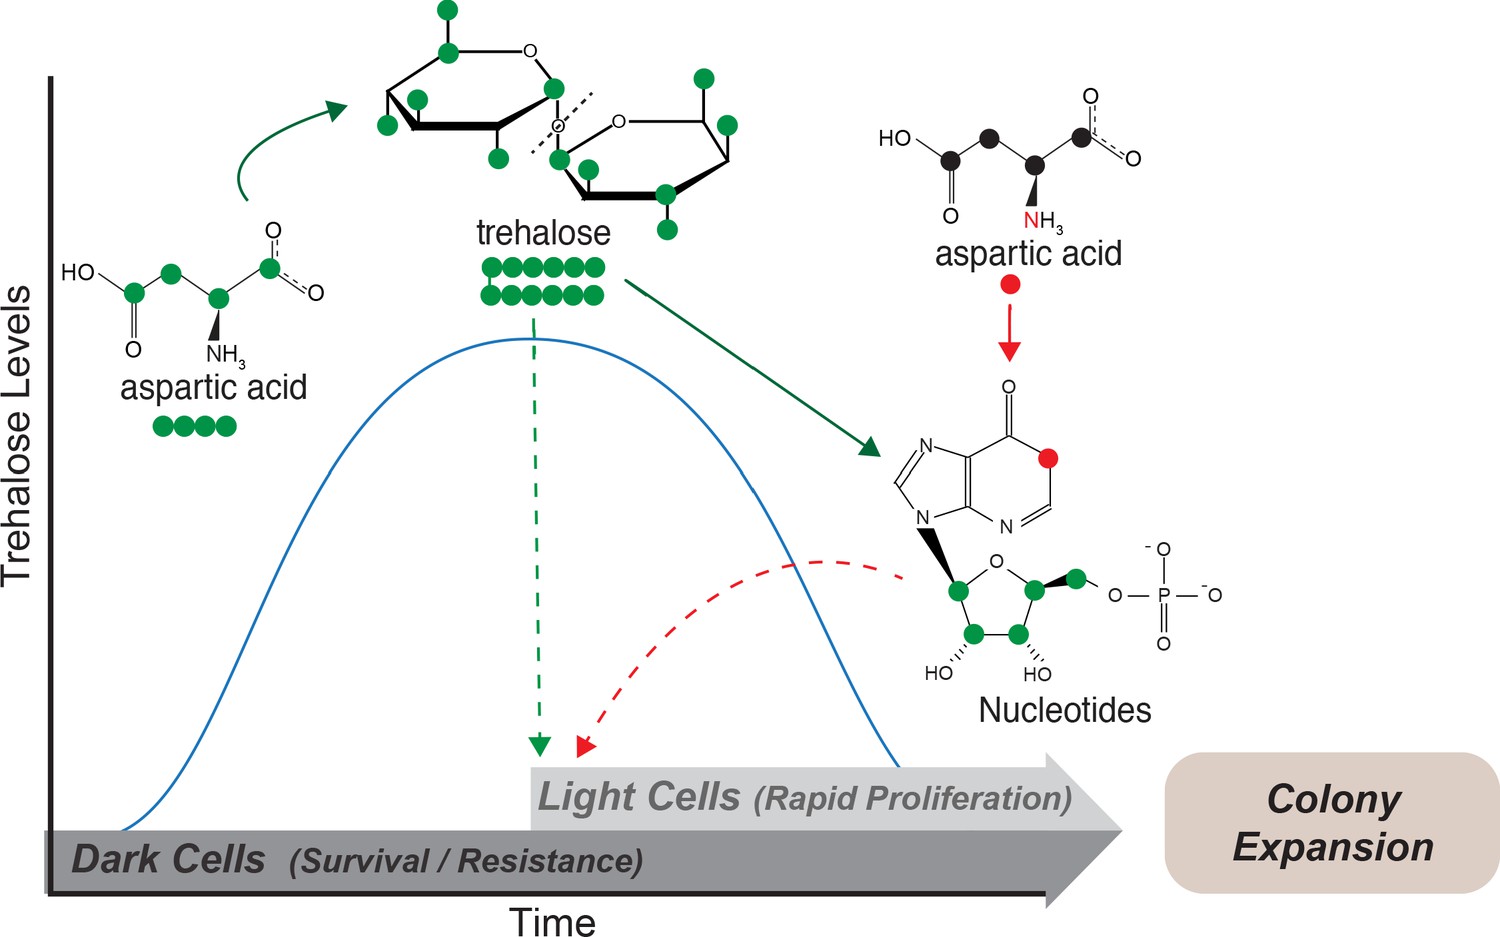
Model: Metabolite plasticity allowing differential carbon/nitrogen resource budgeting of aspartate drives metabolic specialization resulting in division of labor.
Cells in low glucose perform gluconeogenesis (Dark cells), as would be required in low glucose medium. During this process, dark cells predominantly budget aspartate for their carbon needs to synthesize trehalose. The accumulated trehalose reserves in the dark cells allow them to survive environmental challenges including desiccation and repeated freeze/thaw cycles. Trehalose also accumulates externally, and once threshold levels of external trehalose are reached, some cells stochastically switch to the light state and utilize this trehalose to fuel their high glycolysis and pentose phosphate pathway (PPP) activity. Cells that switch to the light cell state predominantly use aspartate as a ‘nitrogen’ source to synthesize nucleotides via PPP, while utilizing trehalose for their carbon needs. This makes light cells primed for proliferation, which in turn results in increased or directional colony expansion. This metabolic specialization and division of labor between the light and dark cells creates a cross-feeding system (built around trehalose), and allows the colony as a whole to survive unfavorable conditions and forage efficiently even in nutrient limiting conditions.
Videos
Video 1
Development of a simulated wild-type colony.
A simulation movie of the WT colony over 750 time-steps (~6 days in real time). The colony starts with 95–99% dark cells, which go through switching and growth phases as observed. This colony is generated using default parameter values in the model.
Video 2
Aspartate is allocated equally for Carbon and Nitrogen by dark cells.
A simulation movie where the budgeting fraction ‘f’ is 50%, i.e., 50% of the aspartate flux is allocated towards nitrogen reserves. The dark cell blocks cannot allocate sufficient carbon for themselves, leading to almost no divisions by the dark cell blocks while the light cells at the edge keep proliferating. For comparison, the default value of ‘f’ is 12.5%.
Video 3
Aspartate uptake rate by both types of cells is equal to trehalose uptake rate by light cells.
A simulation movie where the relative rate of aspartate uptake is equal to the trehalose uptake rate. (i.e. AspU = 1.0). In this case, the aspartate uptake by dark cells is much slower, which also leads to slower trehalose production, resulting in smaller colonies consisting of predominantly dark cell blocks.
Video 4
Aspartate uptake rate by both types of cells is much higher than trehalose uptake rate by light cells.
A simulation movie where the relative rate of aspartate uptake is high. (i.e. AspU = 8.0). In this case, the dark cells allocate adequate aspartate for both nitrogen and carbon requirements rapidly enough. This leads to both dark and light cells having nearly the same division rate.
Tables
Key resources table
| Reagent type (species) or resource | Designation | Source or reference | Identifiers | Additional information |
|---|---|---|---|---|
| Gene (Saccharomyces cerevisiae) | pck1 | Saccharomyces genome database (SGD) | SGD:S000001805 | |
| Gene (Saccharomyces cerevisiae) | fbp1 | Saccharomyces genome database (SGD) | SGD:S000004369 | |
| Gene (Saccharomyces cerevisiae) | nth1 | Saccharomyces genome database (SGD) | SGD:S000002408 | |
| Strain, strain background (Saccharomyces cerevisiae) | Prototrophic sigma1278b, MATa (WT) | Isolate from Fink Lab. | YBC16G1 | Wild-type strain. |
| Strain, strain background (Saccharomyces cerevisiae) | Δpck1 | This study | sigma1278b MAT a pck1::kanMX6 | |
| Strain, strain background (Saccharomyces cerevisiae) | Δfbp1 | This study | sigma1278b MAT a fbp1::kanMX6 | |
| Strain, strain background (Saccharomyces cerevisiae) | Δnth1 | Varahan et al., 2019 | sigma1278b MAT a nth1::kanMX6 | |
| Strain, strain background (Saccharomyces cerevisiae) | WT (pTKL1-mCherry) | Varahan et al., 2019 | Wild-type strain with pentose phosphate pathway reporter plasmid (mCherry with TKL1 promoter) | |
| Strain, strain background (Saccharomyces cerevisiae) | Δpck1 (pTKL1-mCherry) | This study | Δpck1 strain with pentose phosphate pathway reporter plasmid (mCherry with TKL1 promoter) | |
| Strain, strain background (Saccharomyces cerevisiae) | Δfbp1 (pTKL1-mCherry) | This study | Δfbp1 strain with pentose phosphate pathway reporter plasmid (mCherry with TKL1 promoter) | |
| Recombinant DNA reagent | pTKL1-mCherry | Varahan et al., 2019 | mCherry under the TKL1 promoter and CYC1 terminator. p417 centromeric plasmid backbone, G418R. | |
| Commercial assay or kit | Glucose (GO) Assay Kit | Sigma Aldrich | Cat. #: GAGO20-1KT | Kit used for the biochemical measurement of trehalose from cells. |
| Chemical compound, drug | 15N Aspartate | Cambridge isotope laboratories | Cat. #: NLM-718-PK | |
| Chemical compound, drug | 15N Ammonium sulphate | Cambridge isotope laboratories | Cat. #: NLM-713-PK | |
| Chemical compound, drug | 13C Aspartate | Cambridge isotope laboratories | Cat. #: CLM-1801-PK |
Table 1
Mass transitions used for LC-MS/MS experiments.
| Nucleotides | Formula | Parent/Product (positive polarity) | Comment (for 15N experiment) |
|---|---|---|---|
| AMP | C10H14N5O7P | 348/136 | Product has all N |
| 15N_AMP_1 | 349/137 | ||
| 15N_AMP_2 | 350/138 | ||
| 15N_AMP_3 | 351/139 | ||
| 15N_AMP_4 | 352/140 | ||
| 15N_AMP_5 | 353/141 | ||
| GMP | C10H14N5O8P | 364/152 | Product has all N |
| 15N_GMP_1 | 365/153 | ||
| 15N_GMP_2 | 366/154 | ||
| 15N_GMP_3 | 367/155 | ||
| 15N_GMP_4 | 368/156 | ||
| 15N_GMP_5 | 369/157 | ||
| CMP | C9H14N3O8P | 324/112 | Product has all N |
| 15N_CMP_1 | 325/113 | ||
| 15N_CMP_2 | 326/114 | ||
| 15N_CMP_3 | 327/115 | ||
| UMP | C9H13N2O9P | 325/113 | Product has all N |
| 15N_UMP_1 | 326/114 | ||
| 15N_UMP_2 | 327/115 | ||
| Trehalose and sugar phosphates | Formula | Parent/Product (negative polarity) | Comment (for 13C experiment) |
| Trehalose | C12H22O11 | 341.3/179.3 | |
| 13C_Trehalose_12 | 353.3/185.3 | Product has 6 C all of which are labeled | |
| 13C_3 PG_3 | 188/97 | ||
| G6P | C6H13O9P | 259/97 | Monitoring the phosphate release |
| 13C_G6P_6 | 265/97 | ||
| 6 PG | C6H13O10P | 275/97 | Monitoring the phosphate release |
Table 2
Model parameters.
| Main parameters | Notation | Default Value | Range of Variation |
|---|---|---|---|
| Fraction of aspartate flux allocated to N in dark cell blocks | f | 0.125 | 0.0–1.0 (0–100%) |
| Relative rate of aspartate uptake compared to trehalose uptake rate | AspU | 4.0 | 1.0–8.0 |
| Additional parameters | |||
| Yield (converting N to C) | Y | 0.31 C/N | |
| Fraction secreted as trehalose, per dark cell block | Pf | 0.049/Time | -- |
| Max secreted trehalose, per dark cell block | -- | 0.12 units/Time | -- |
| Extra N for light cells | ExN | 4.0 | -- |
| Aspartate consumed by dark and light cell blocks | AspU*Cmax | 0.2/Time | |
| Parameters from previous model | |||
| Growth rate (light and dark cell block) | g | 0.04/Time | -- |
| Max trehalose consumed by a light cell block | Cmax | 0.05 units/Time | |
| Switching threshold (dark to light) | TDL | 1.5 units | -- |
| Switching probability (dark to light) | PDL | 0.5/Time | |
| Switching threshold (light to dark) | TLD | 0.0001 units | |
| Switching probability (light to dark) | PLD | 0.0001/Time | |
| Scaled diffusion constant of trehalose | Deff | 0.24 L2/Time |
Additional files
Download links
A two-part list of links to download the article, or parts of the article, in various formats.
Downloads (link to download the article as PDF)
Open citations (links to open the citations from this article in various online reference manager services)
Cite this article (links to download the citations from this article in formats compatible with various reference manager tools)
Resource plasticity-driven carbon-nitrogen budgeting enables specialization and division of labor in a clonal community
eLife 9:e57609.
https://doi.org/10.7554/eLife.57609


