Neural signatures of α2-Adrenergic agonist-induced unconsciousness and awakening by antagonist
- Department of Anesthesia, Critical Care & Pain Medicine, Massachusetts General Hospital, Harvard Medical School, United States
Figures
Figure 1
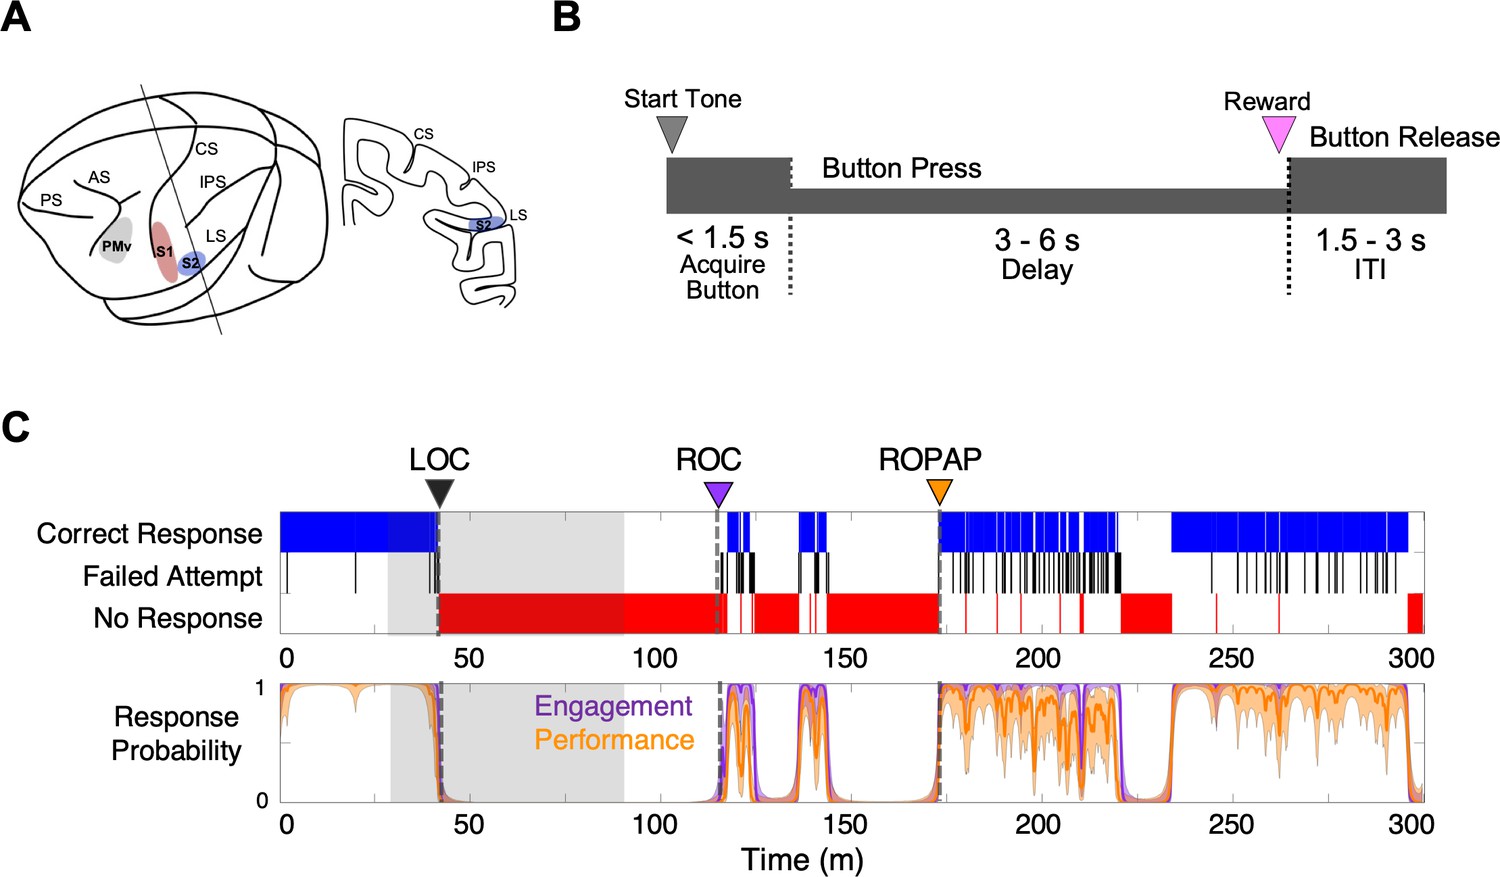
Experimental paradigm and behavioral responses.
(A) Location of the recording sites. Neural recording was performed in the primary somatosensory cortex (S1, red), the secondary somatosensory cortex (S2, blue), and ventral premotor cortex (PMv, gray). CS, central sulcus; IPS, intraparietal sulcus; LS, lateral sulcus; AS, acuate sulcus, and PS, principal sulcus. (B) Behavioral task. Sequence of events during behavioral trials. After the start tone (pure tone 1000 Hz, 100 msec), the monkey initiated a trial by placing the hand (ipsilateral to the recording site) on the button in front of the animal. The animal was required to keep its hand on the button until the end of the trial in order to receive a liquid reward (correct response). The animal then had to release the button during the inter-trial interval (ITI). (C) Typical behavioral response during dexmedetomidine induction and emergence. Following the start of dexmedetomidine infusion, failed attempts (black) increased briefly before the animal completely lost the response. Top: The animal’s trial-by-trial button response. Correct responses (blue), failed attempts (black), and no response (red). Bottom: Probability of the task engagement (correct responses and failed attempts, purple) and task performance (correct responses only, orange). LOC was defined as the time at which the probability of task engagement was decreased to less than 0.3, and ROC was defined as the first time, since being unconscious, at which the probability of task engagement was greater than 0.3. ROPAP was defined as the time at which the probability of task performance was returning to greater than 0.9 since being unconscious and remained so for at least 3 min. LOC is shown with a black arrow and dotted lines, ROC with a purple arrow and dotted lines, and ROPAP with an orange arrow and dotted lines (C). Dexmedetomidine was infused at 18 μg/kg/h for the first 10 min and then 4 μg/kg/h for 50 min (shaded area in C). The graphs represent one recording session in Monkey 1.
Figure 2
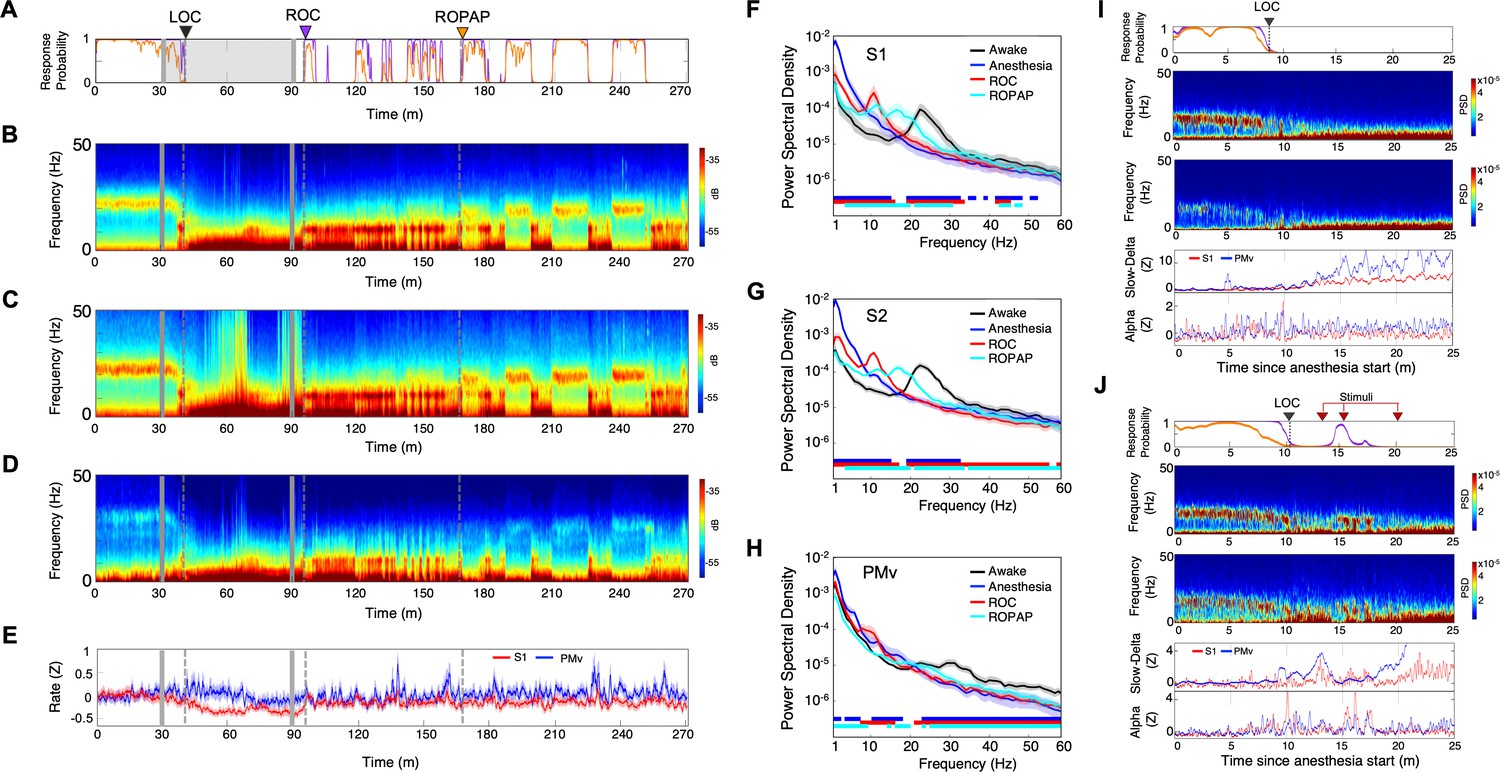
Distinctive neural changes are associated with α2-adrenergic agonist-induced LOC, ROC and ROPAP.
(A) Behavioral response. Probability of the task engagement (purple) and task performance (orange). (B) Local field potentials (LFP) time-domain spectrograms in S1. (C) LFP time-domain spectrograms in S2. (D) LFP time-domain spectrograms in PMv. (E) Average baseline firing rates in S1 (red) and PMv (blue). Firing rates were normalized to pre-anesthetic values using Z-scores. No significant differences between pre-anesthetic average and any following time point were found (ANOVA and post hoc Bonferroni multiple comparison tests). (F–H) Averaged frequency domain power spectra in S1 (n = 9 channels, F), S2 (n = 11 channels, G) and PMv (n = 10 channels, H). Traces are the averaged Welch’s power across channels with 95% confidence intervals shaded, during wakefulness (for one minute before anesthesia start, black), anesthesia (for one minute at the end of anesthetic infusion, blue), ROC (for one minute after ROC, red) and ROPAP (for one minute after ROPAP, cyan). Bottom lines represent those frequencies with significantly different values of average power density between awake and any other given condition as found by repeated measures ANOVA (ε-corrected p-value<0.05) and post hoc Bonferroni multiple comparison test (p-value<0.0083). (I) Behavioral response, spectrogram in S1 and PMv, the slow-delta (0.5–4 Hz) and alpha power (8–12 Hz) change during LOC. Power was normalized to pre-anesthetic values using Z-scores. (J) Behavioral response, spectrogram in S1 and PMv, the slow-delta (0.5–4 Hz) and alpha power (8–12 Hz) change during LOC with arousability testing. A series of non-aversive stimuli (ear-pulling, a loud white noise at 100 dB SPL for 5 s, and hand claps 3 times at 10 cm from face, shown with red arrows) were applied at 3, 5, and 10 min after initially detected LOC. LOC is shown with a black arrow and dotted lines, ROC with a purple arrow and dotted lines, and ROPAP with an orange arrow and dotted lines (A–E). Dexmedetomidine was infused at 18 μg/kg/h for the first 10 min and then 4 μg/kg/h for 50 min (gray lines in A–E).
Figure 3

Oscillatory dynamics are inter-regionally coherent through α2-adrenergic agonist-induced anesthesia and recovery.
(A) Behavioral response. Probability of the task engagement (purple) and task performance (orange). (B–D). Local field potentials (LFP) time-domain coherogram within S1 (B), S2 (C) and PMv (D). (E–G). Inter-regional LFP time-domain coherogram between S1 and S2 (E), S1 and PMv (F), and S2 and PMv (G). (H–M). Averaged frequency-domain coherence within S1 (n = 36 channel pairs, H), S2 (n = 55 channel pairs, I) and PMv (n = 45 channel pairs, J), and between S1-S2 (n = 99 channel pairs, K), S1-PMv (n = 90 channel pairs, L) and, S2-PMv (n = 110 channel pairs, M), at awake (for one minute before anesthesia start, black), anesthesia (for one minute before the end of anesthesia infusion, blue), ROC (for one minute after ROC, red) and ROPAP (for one minute after ROPAP, cyan). Coherence was averaged for a 1 min period across all pair-wise channel for each epoch. Average values are shown with shaded 95% confidence intervals. Bottom lines represent those frequencies with significantly different values of average coherence between awake and any other given condition as found by repeated measures ANOVA (ε-corrected p-value<0.05) and post hoc Bonferroni multiple comparison test (p-value<0.0083). LOC is shown with a black arrow and dotted lines, ROC with a purple arrow and dotted lines, and ROPAP with an orange arrow and dotted lines (A–G). Dexmedetomidine was infused at 18 μg/kg/h for the first 10 min and then 4 μg/kg/h for 50 min (gray lines in A–G).
Figure 4
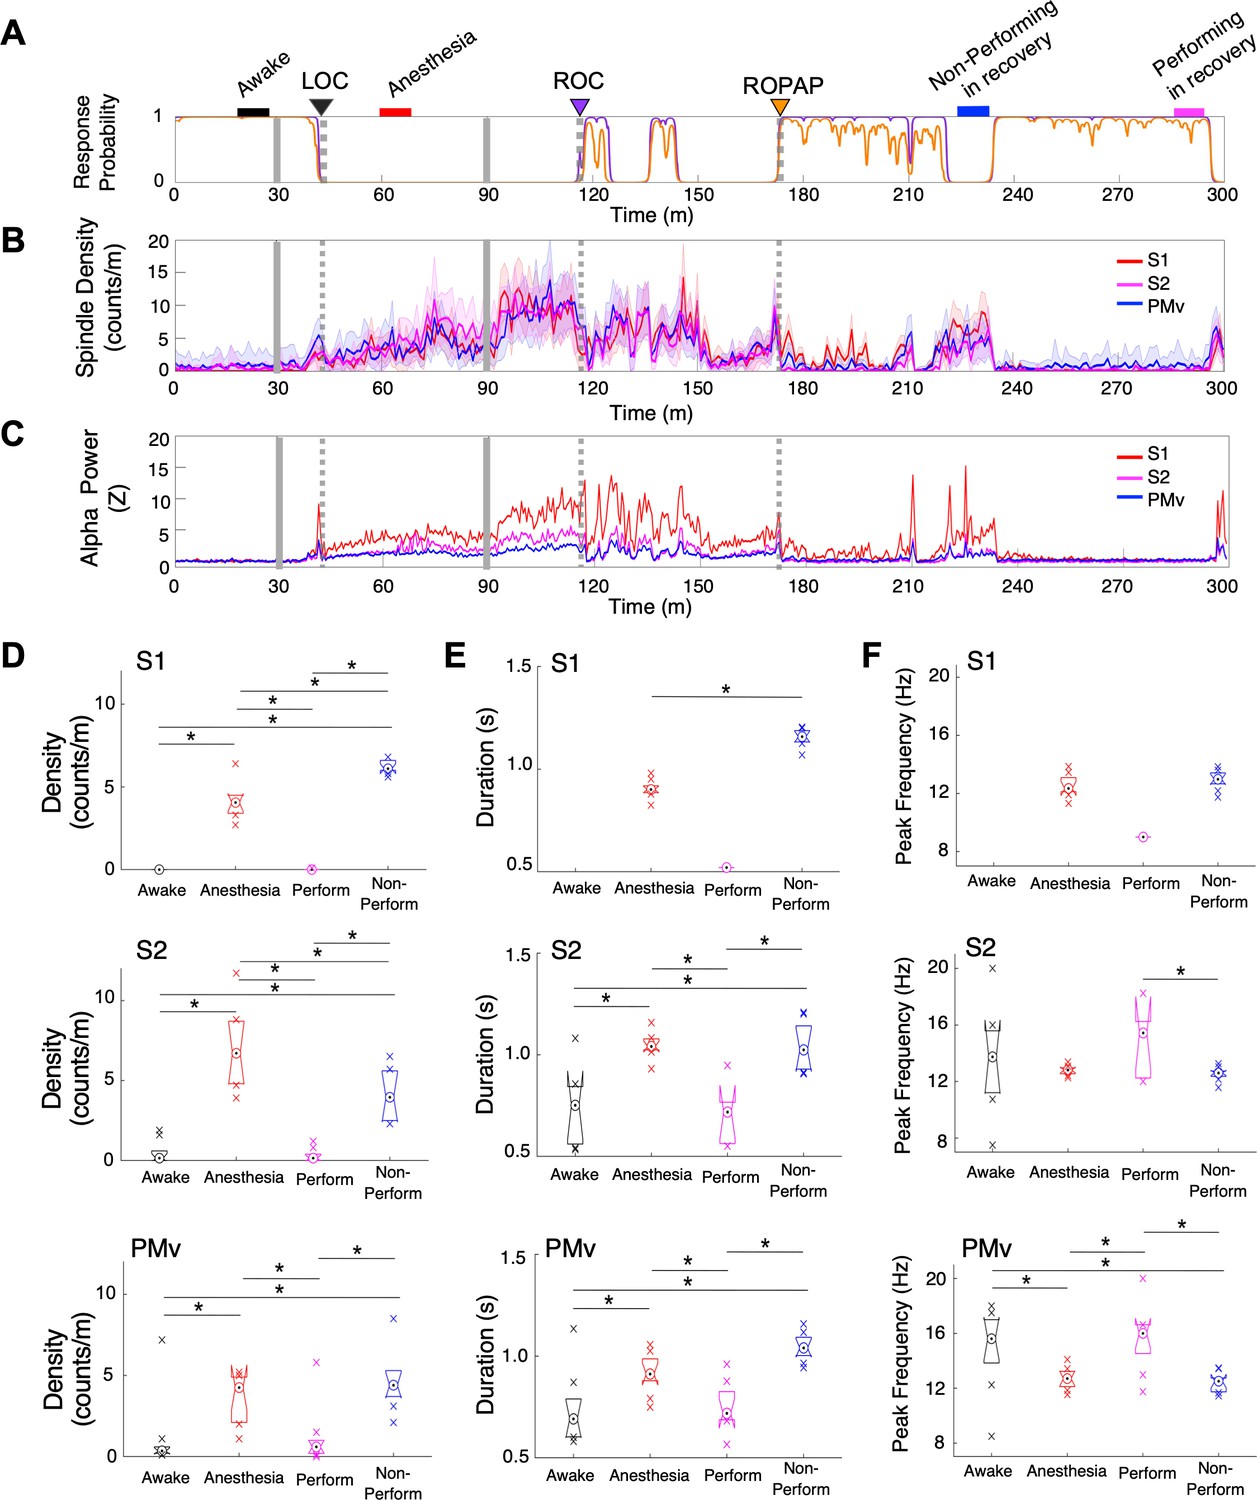
Spindle activity increases during early recovery following α2-adrenergic agonist-induced anesthesia.
(A) Behavioral response. Probability of the task engagement (purple) and task performance (orange). (B) Spindle density (counts/min) in 9–17 Hz in S1 (red trace), S2 (magenta trace) and PMv (blue trace). (C) Normalized power of alpha frequency (8–12 Hz) in S1 (red trace), S2 (magenta trace) and PMv (blue trace). (D–F). Spindle characteristics in S1 (top plots), S2 (middle plots) and PMv (bottom plots) of density (D), duration (E), and peak frequency (F). Box plots represent the median with 25th and 75th percentiles and single points are all values beyond. Asterisks indicate statistically significant difference (two-sided unpaired t-test, p<0.01). Comparisons were made between the 10 min periods: awake (for the last 10 min of wakefulness before anesthesia start, black bar); anesthesia (for 10 min during anesthetic infusion, red bar); non-performing after ROPAP (for 10 min of the non-performing period, blue bar); and performing after ROPAP (for the last 10 min of the performing period, pink bar) shown in A. LOC is shown with a black arrow and dotted lines, ROC with a purple arrow and dotted lines, and ROPAP with an orange arrow and dotted lines (A–C). Dexmedetomidine was infused at 18 μg/kg/h for the first 10 min and then 4 μg/kg/h for 50 min (gray solid lines in A–C).
Figure 5
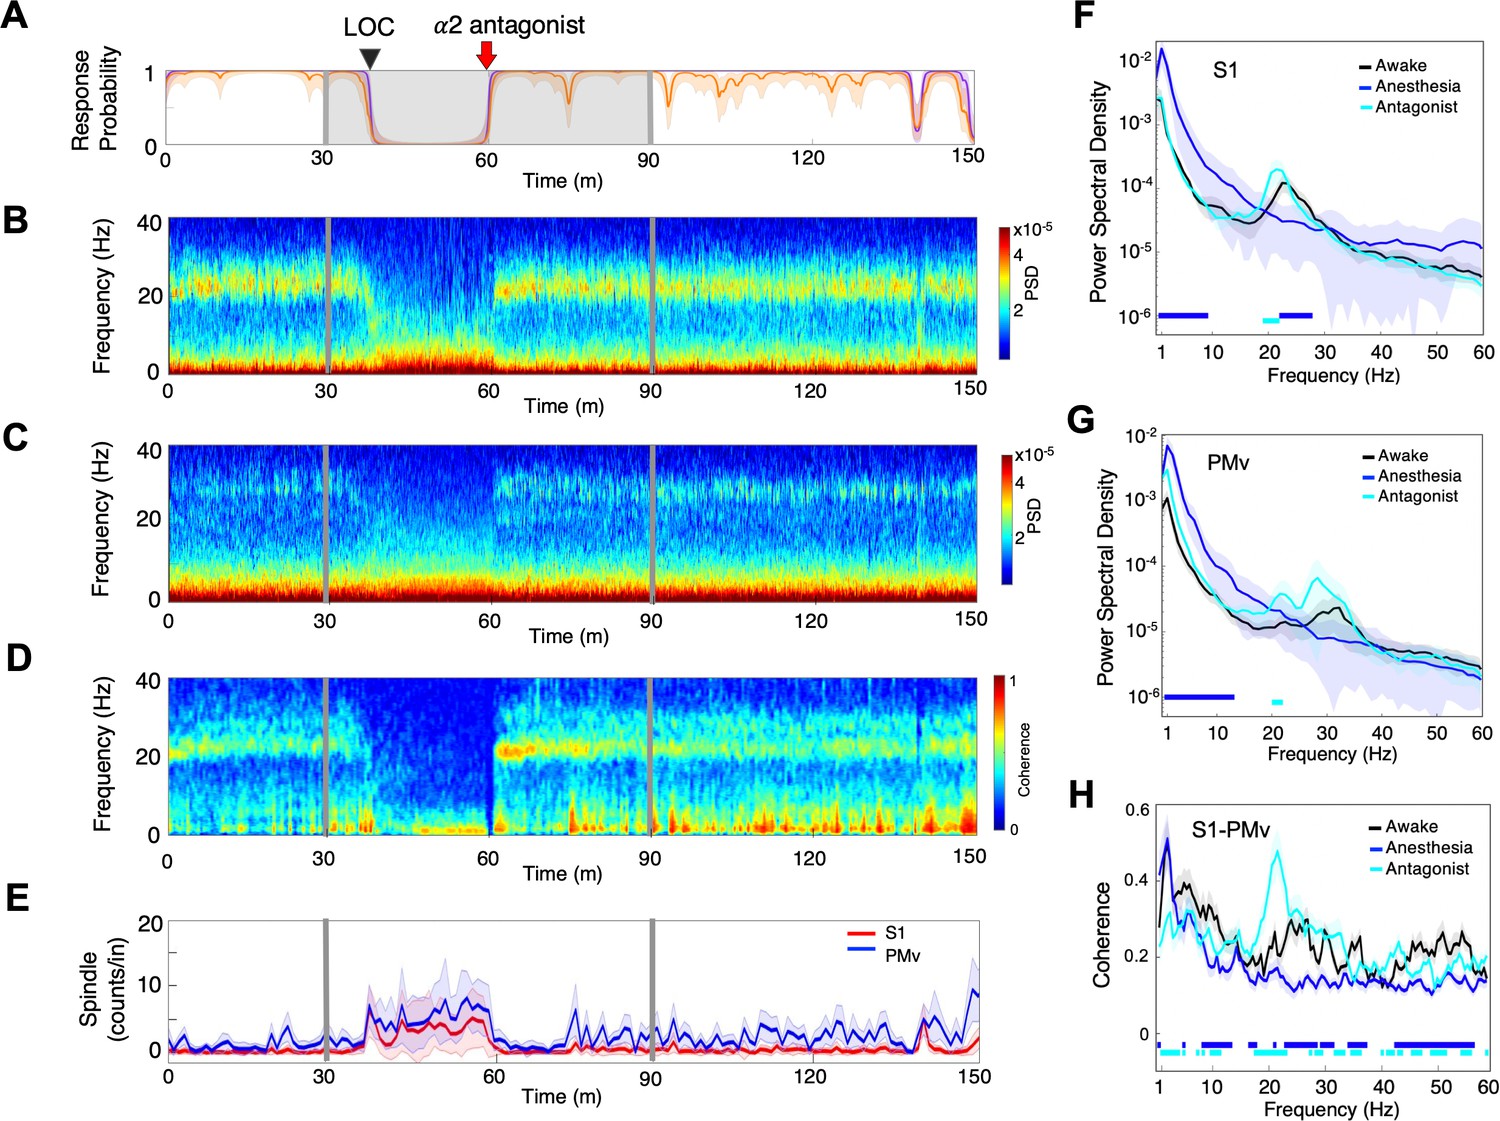
α2-adrenergic antagonist immediately restores top task performance and awake dynamics.
(A) Behavioral response. Probability of the task engagement (purple) and task performance (orange). (B) Local field potentials (LFP) time-domain spectrogram in S1. (C) LFP time-domain spectrogram in PMv. (D) LFP time-domain coherogram between S1 and PMv. (E) Spindle density (counts/min) in 9–17 Hz in S1 (red trace) and PMv (blue trace). (F) Averaged frequency-domain power spectra in S1 (n = 10 channels), (G) Averaged frequency-domain power spectra in PMv (n = 11 channels). Traces are the averaged Welch’s power across channels with shaded 95% confidence intervals, at awake (for one minute before anesthesia start, black), during anesthesia (for one minute immediately before α2-adrenergic antagonist injection, blue) and after antagonist (for one minute immediately following α2-adrenergic antagonist injection, cyan). Bottom lines represent those frequencies with significantly different values of average power density between awake and any other given condition (repeated measures ANOVA and post hoc Bonferroni multiple comparison test, p-value<0.017). (H) Averaged frequency-domain coherence between S1 and PMv (n = 110 channel pairs). Average lines are shown with shaded 95% confidence intervals. Bottom lines represent those frequencies with significantly different values of average coherence between awake and any other given condition (Friedman’s test and post hoc Bonferroni multiple comparison test, p-value<0.017). Coherence were averaged at awake (for one minute before anesthesia start, black), during anesthesia (for one minute immediately before antagonist injection, blue) and after antagonist (for one minute immediately following α2-adrenergic antagonist injection, cyan). LOC is shown with a black arrow and dotted lines (A–D). Dexmedetomidine was infused at 18 μg/kg/h for the first 10 min and then 4 μg/kg/h for 50 min (gray lines and shaded area in A–D). α2-adrenergic antagonist atipamezole 100 µg/kg was intravenously injected after 30 min of dexmedetomidine infusion (at the time of 60 min).
Figure 6
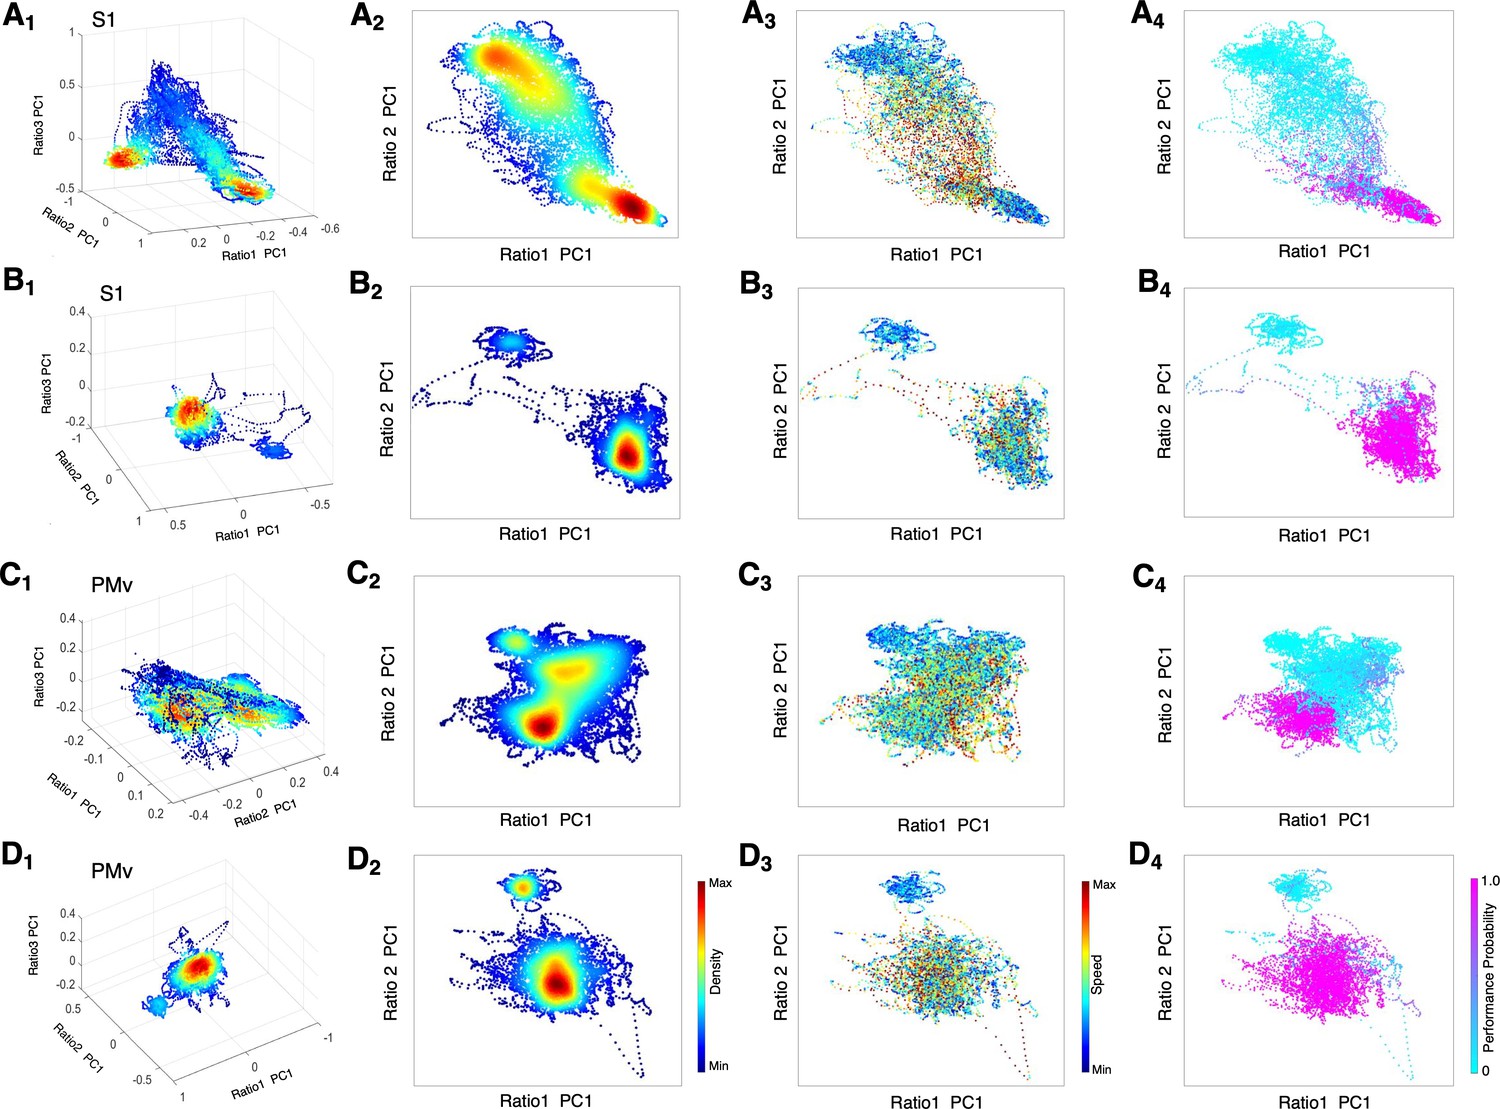
State space characterizes recovery through intermediate state without α2-antagonist and instant awakening with α2-antagonist.
(A1-D1) Density plots in 3D during anesthesia and recovery without antagonist in S1 (A1) and PMv (C1) and with antagonist in S1 (B1) and PMv (D1). The density heat-map was calculated with a kernel density estimator from the scatter data created using the first principal component from the three spectral ratios described in the methods. (A2-D2) Density plots in 2D during anesthesia and recovery without antagonist in S1 (A2) and PMv (C2) and with antagonist in S1 (B2) and PMv (D2). (A3-D3) Speed plots during anesthesia and recovery without antagonist in S1 (A3) and PMv (C3) and with antagonist in S1 (B3) and PMv (D3). The speed was calculated as the Euclidean distance between consecutive points and is represented as heat-map. (A4-D4) Task performance during anesthesia and recovery without antagonist in S1 (A4) and PMv (C4) and with antagonist in S1 (B4) and PMv (D4). The plots are color-coded according to the task performance probability. The data were analyzed for the period between LOC and the end of recording session. Each dot corresponds to a 1 s window for all plots. Dexmedetomidine was infused at 18 μg/kg/h for the first 10 min and then 4 μg/kg/h for 50 min in all sessions. α2-adrenergic antagonist atipamezole 100 µg/kg was intravenously injected at 30 min of dexmedetomidine infusion.
Tables
Table 1
Number of recording experiments in each animal.
| Recording site | Number of recording sessions | |||||
|---|---|---|---|---|---|---|
| Dexmedetomidine | Dexmedetomidine and antagonist | Arousability testing | No task control | Blind-folding control | ||
| Monkey 1 | S1, S2, PMv | 8 | 2 | 0 | 2 | 0 |
| Monkey 2 | S1, PMv | 9 | 3 | 2 | 2 | 2 |
-
Note: The recording sessions were performed with a minimum interval of 2 days in each animal.
Table 2
Characteristic oscillatory changes during dexmedetomidine-induced altered behavioral states.
| Behavioral state | Slow-Delta | Alpha | Beta | Spindle activity | |
|---|---|---|---|---|---|
| Wakefulness | minimal | absent | high | absent | Figure 2B,C,E,F Figure 4B |
| LOC | high with delay | transiently high | minimal | high | |
| Unresponsiveness | high | low | absent | high | |
| ROC | minimal* | high | absent | high | |
| ROPAP | minimal | minimal | high | minimal | |
| Arousal by external stimuli after LOC during dexmedetomidine infusion | minimal | transiently high | absent | NA | Figure 2H |
| Reversal by α2-adrenergic antagonist during dexmedetomidine infusion | minimal | absent | high | absent | Figure 5B,C,E,F,G |
-
Note: The characteristic changes of the frequency band power and spindle activity are summarized for each behavioral endpoint. *The slow-delta power was diminished at ROC, but frequently reappeared through early recovery until ROPAP.
Additional files
Download links
A two-part list of links to download the article, or parts of the article, in various formats.
Downloads (link to download the article as PDF)
Open citations (links to open the citations from this article in various online reference manager services)
Cite this article (links to download the citations from this article in formats compatible with various reference manager tools)
Neural signatures of α2-Adrenergic agonist-induced unconsciousness and awakening by antagonist
eLife 9:e57670.
https://doi.org/10.7554/eLife.57670


