Bimodal function of chromatin remodeler Hmga1 in neural crest induction and Wnt-dependent emigration
- Division of Biology and Biological Engineering, California Institute of Technology, United States
Figures
Figure 1 with 2 supplements
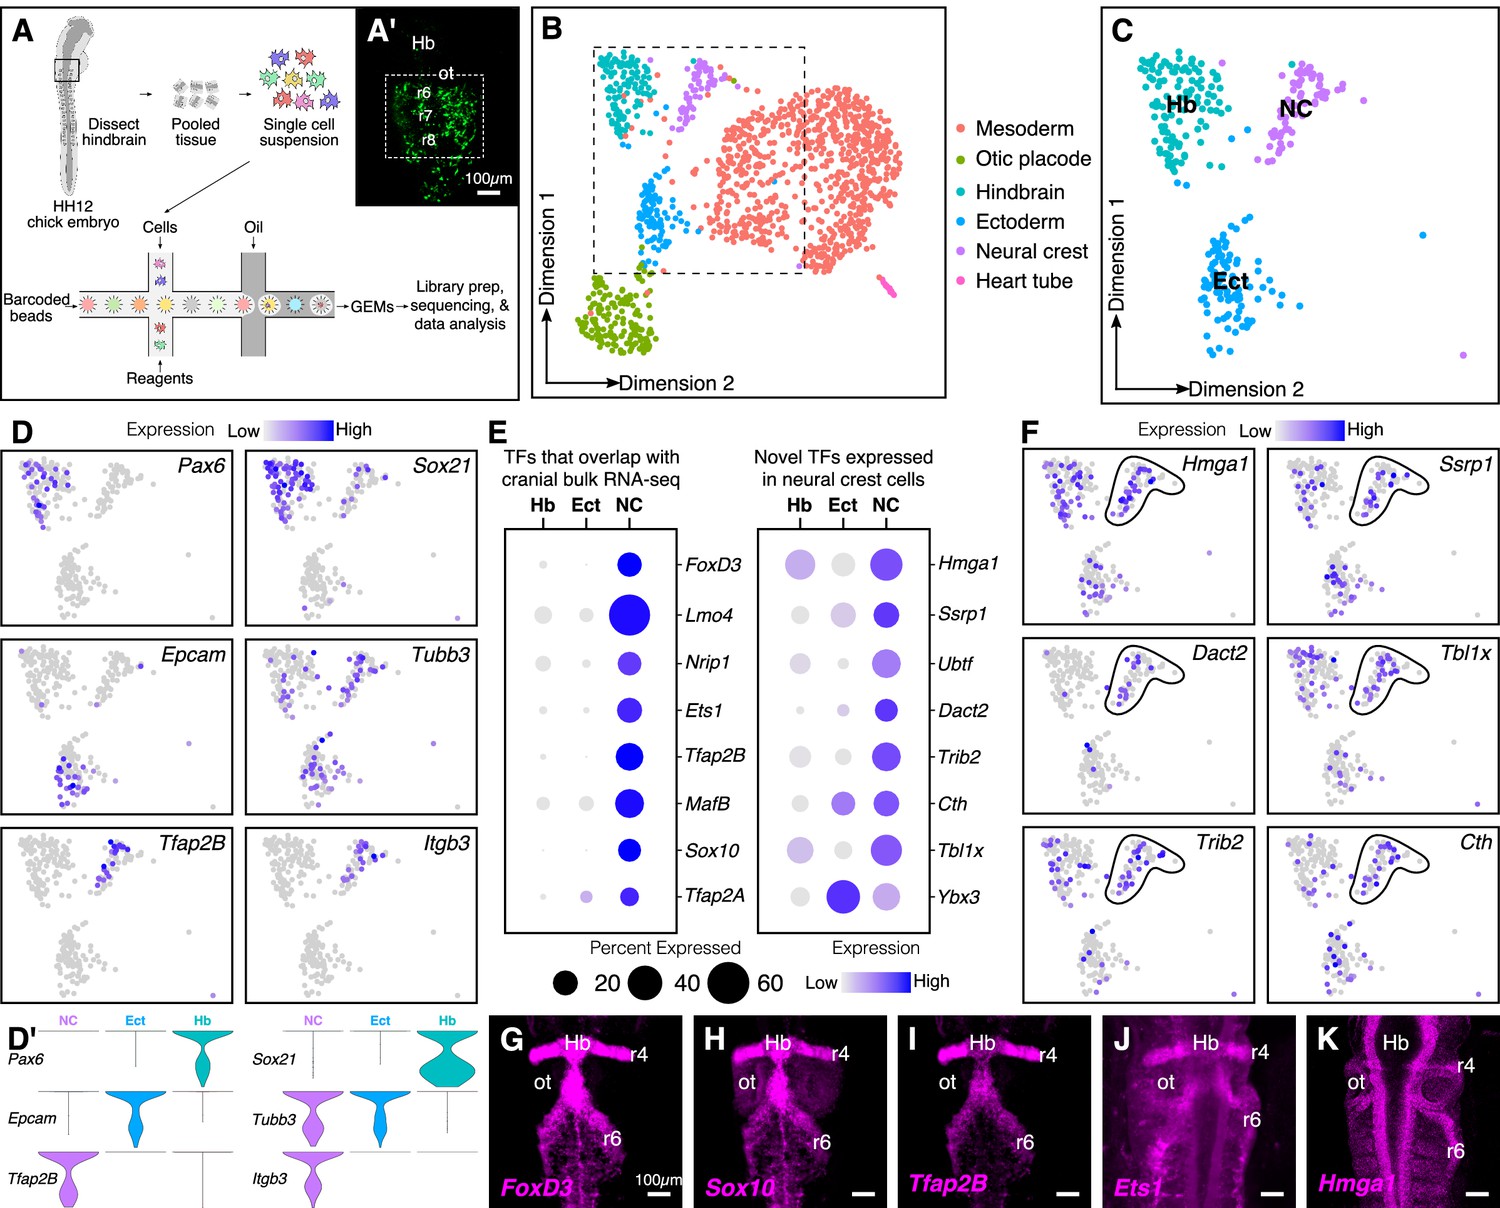
Single-cell (sc) RNA-seq of hindbrain neural crest reveals known and novel transcriptional regulators.
(A) Schematic diagram illustrating the pipeline for performing scRNA-seq on the 10X Genomics platform. Reporter expression mediated by the FoxD3-NC2 enhancer (A’) was used as reference to dissect the hindbrain of HH12 chick embryos. Barcoded GEMs generated from the single-cell suspension were sequenced at a median depth of 50,000 reads/cell. (B) Dimensional reduction using UMAP identifies six subpopulations (including the spike-in) contained within the dissociated embryonic hindbrain. (C) Subset of B showing cells from hindbrain (Hb), ectoderm (Ect), and neural crest (NC). (D–D’) Feature plots used to visualize the expression of known marker genes as a means of identifying subpopulations in (C) in low-dimensional space. Single-cell expression distribution for marker genes (D’) in each cluster is shown as violin plots. (E) Genes that were associated with the GO terms ‘DNA binding’, ‘regulation of transcription,’ or ‘transcription factor’ were characterized as transcriptional regulators and the relative expression and abundance of a subset of them was visualized as a dot plot. The size of each dot corresponds to the percentage of cells expressing that specific gene in a given cluster, while the color represents the average expression level. (F) Feature plots showing expression of previously uncharacterized transcription factors or chromatin remodelers expressed in neural crest cells. (G–K) Hybridization chain reaction was used to validate the expression of a few factors that were identified in (E). Dorsal view of the hindbrain of HH12 shows migratory neural crest streams at r4 and r6 surrounding the otic. Hb, hindbrain; ot, otic placode; r, rhombomere; nc, neural crest; ect, ectoderm. See also Figure 1—figure supplements 1 and 2.
Figure 1—figure supplement 1
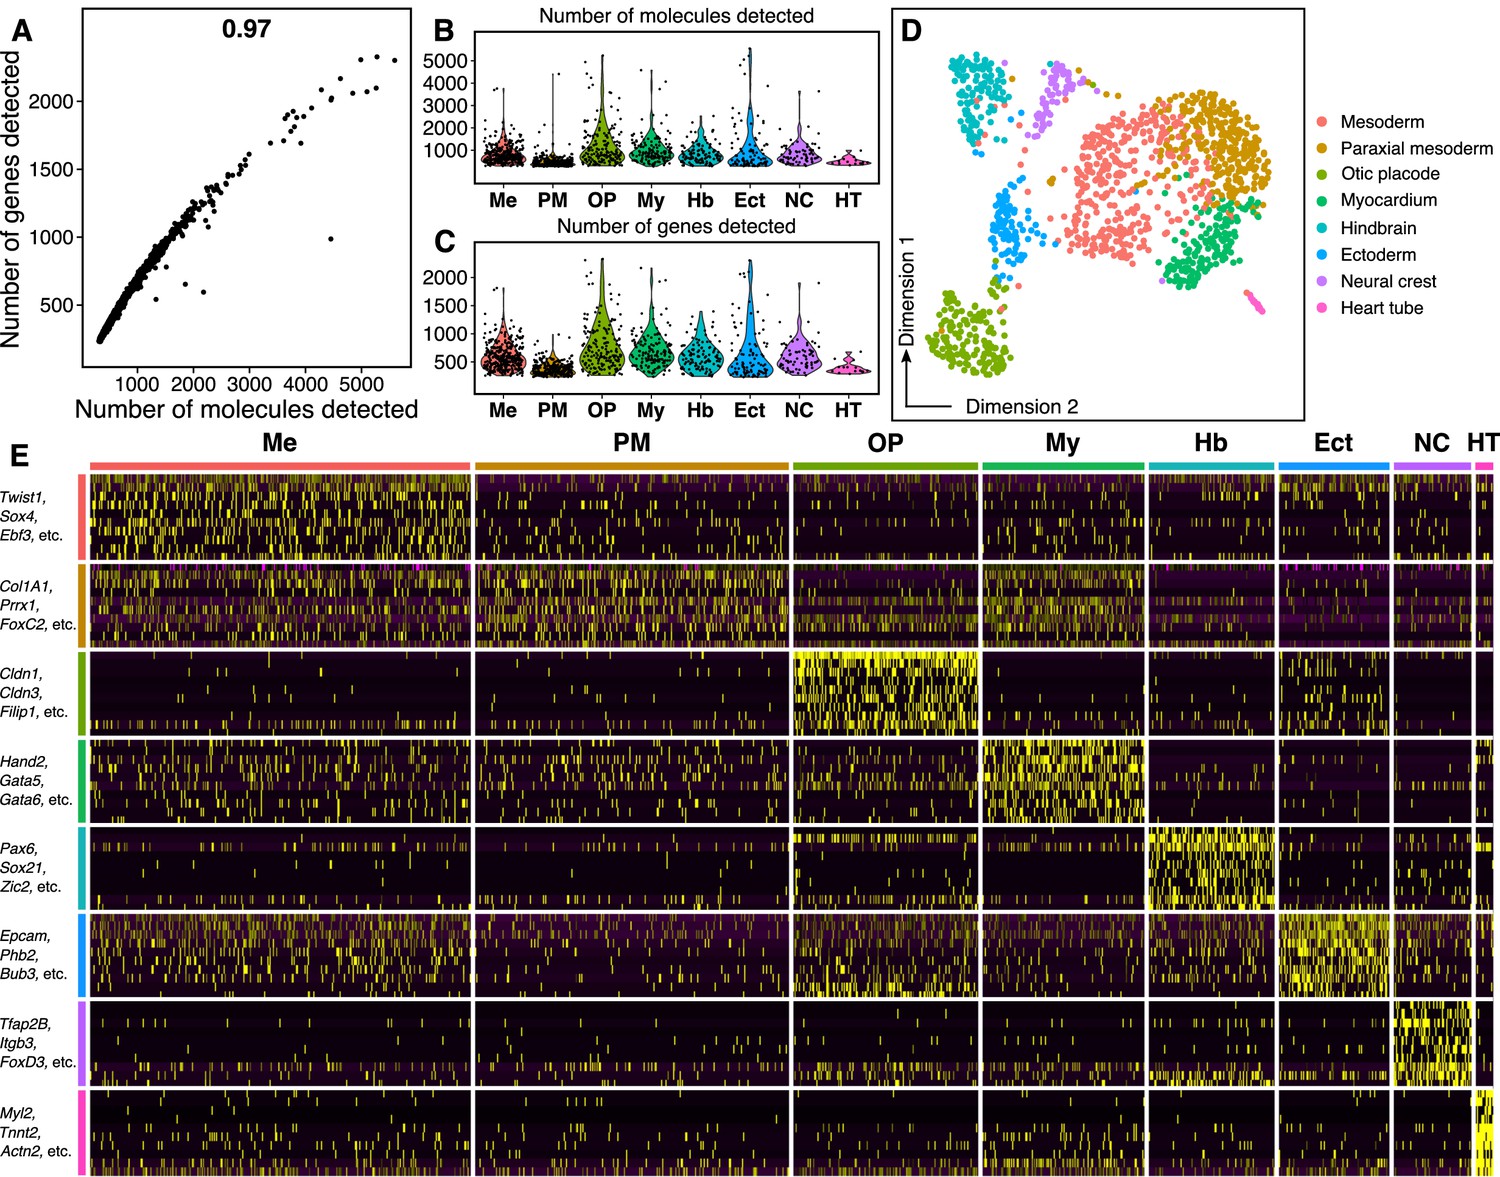
Quality of single-cell RNA-seq dataset.
(A) Scatter plot shows high correlation between the number of unique genes and the total number of molecules detected in each cell. (B–C) The distribution of total number of molecules (B) and number of unique genes (C) detected per cell across the eight cell types identified within the chick hindbrain. (D) Increasing the resolution parameter in the single-cell analysis pipeline to calculate a cell’s ‘nearest neighbor’ allowed identification of three subpopulations within the ‘mesoderm’ cluster displayed in Figure 1B. Based on marker gene expression, these subpopulations were identified as mesoderm (Twist1+), paraxial mesoderm (Prrx1+), and myocardium (Hand2+). (E) The expression of the top 10 most abundant genes from each subcluster was used to plot a heatmap, which also grouped into eight distinct categories, similar to (D). A subset of these abundant genes are labeled along the y-axis.
Figure 1—figure supplement 2
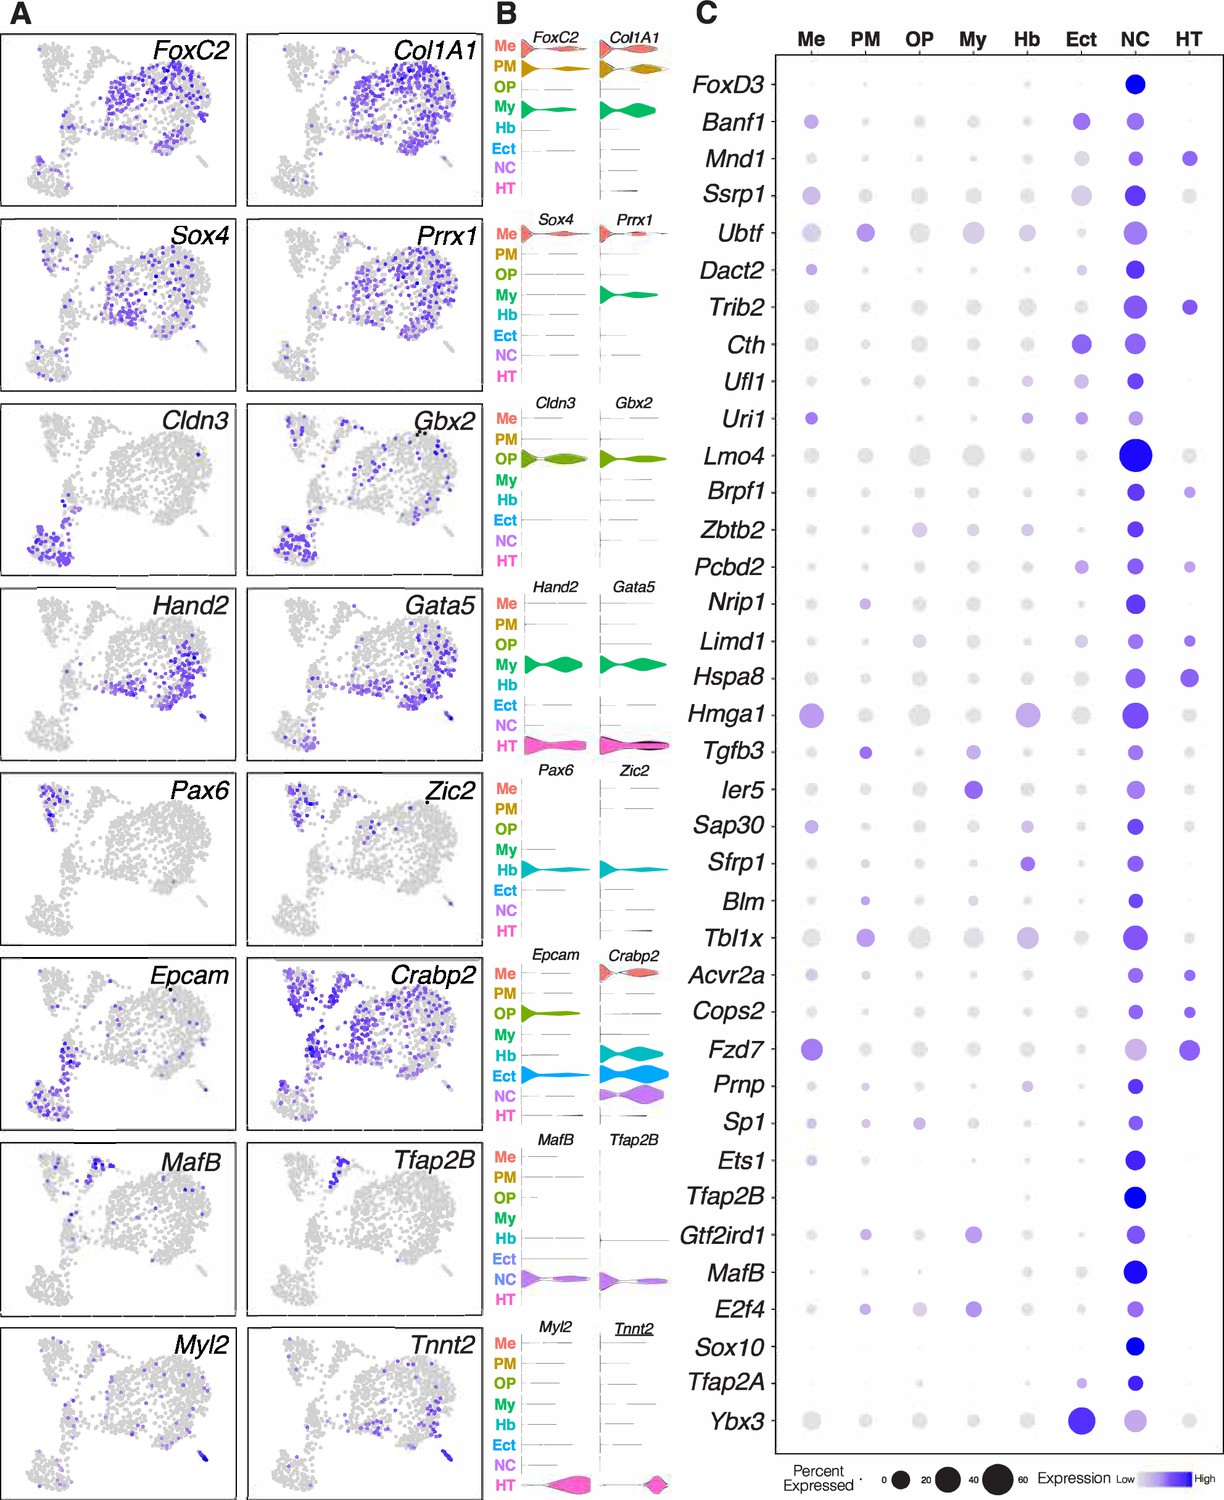
Identification of novel genes expressed in the neural crest.
(A) Feature plots showing expression of marker genes in low-dimensional space used to identify all eight sub-clusters within the chick hindbrain. (B) Violin plots showing the distribution of expression of these marker genes (A) in surrounding cell types. (C) Relative expression of all genes expressed in the neural crest cluster that share the GO terms ‘DNA binding’, ‘transcription factor’, and ‘regulation of transcription’. Several of these genes are transcriptional regulators and/or chromatin remodelers that are ubiquitously expressed in surrounding tissues. The radius of each point reflects the proportion of cells within individual clusters that express a specific gene, whereas the relative expression is reflected by the color of the point (grey – low/negative expression, blue – high expression). A subset of these genes are highlighted in Figure 1E.
Figure 2 with 1 supplement
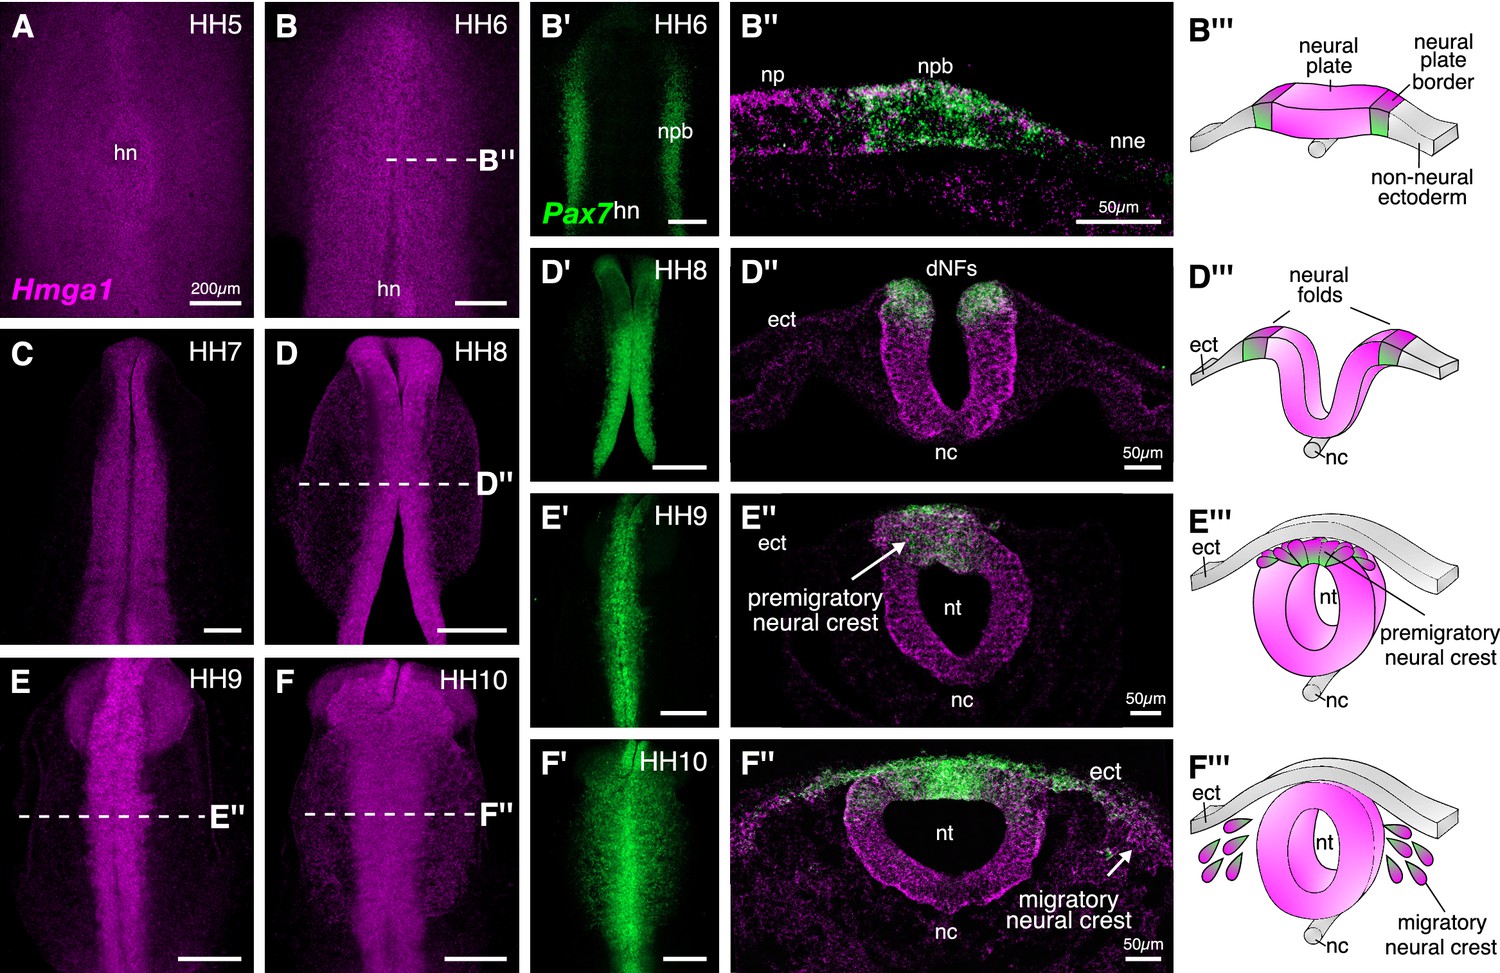
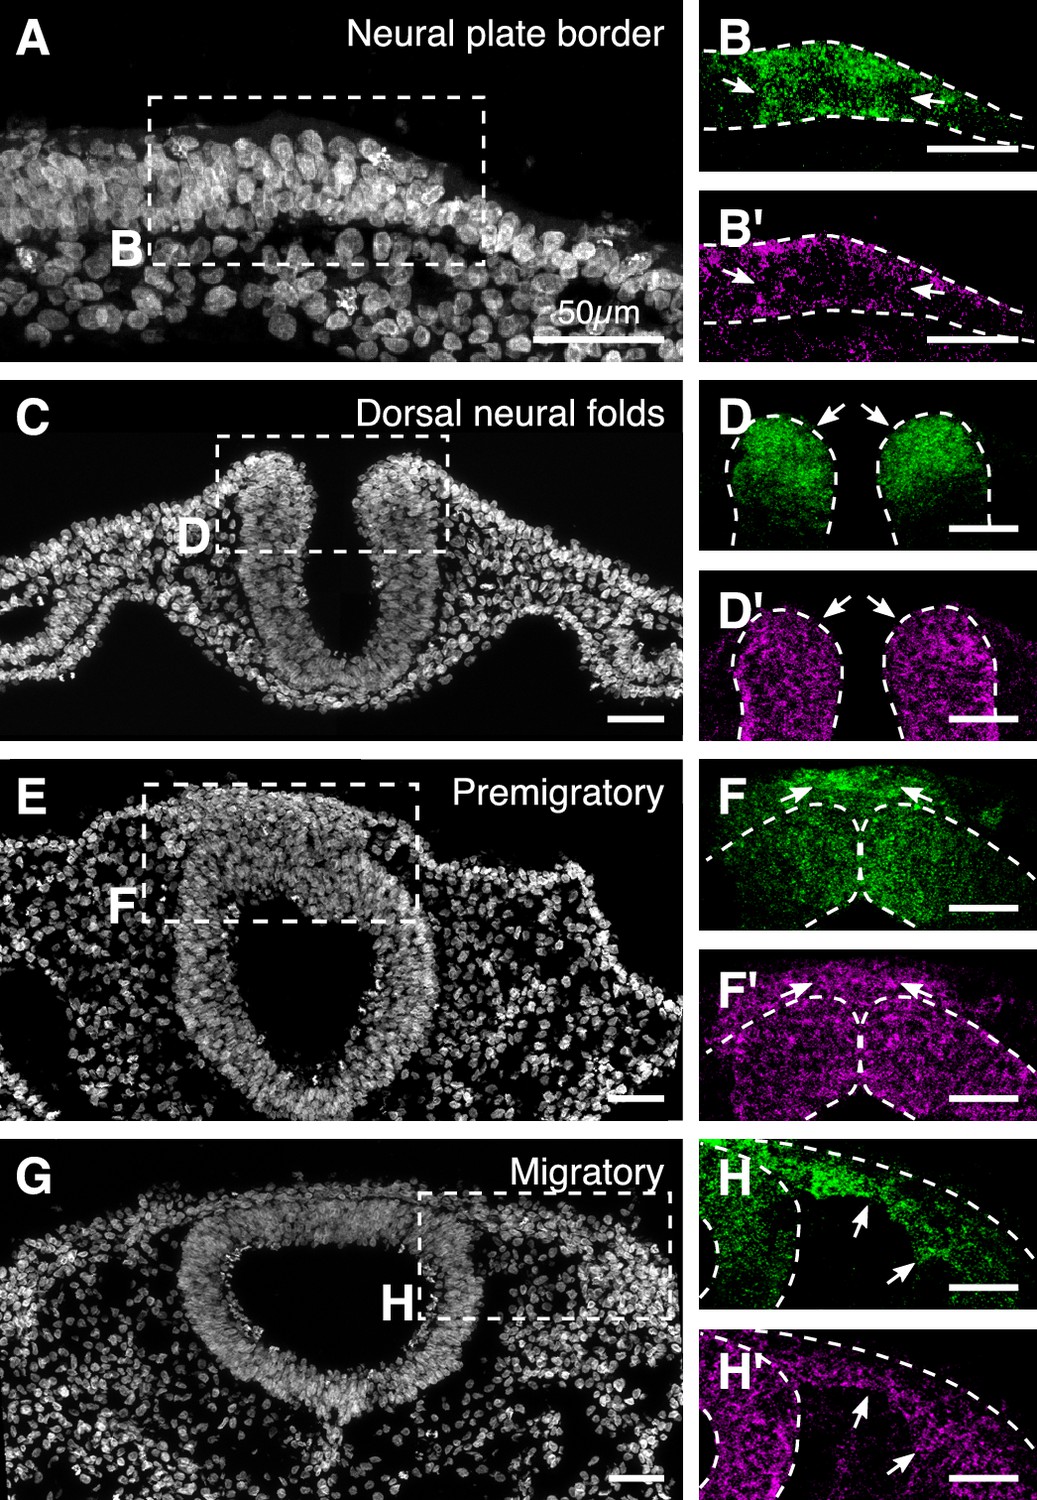
Hmga1 is expressed in the neural plate, neural plate border, and premigratory and migratory neural crest cells.
(A) HCR against Hmga1 at HH5 reveals expression in the neural plate and neural plate border. (B–B’) A wild-type HH6 chick embryo double-labeled with Hmga1 (B) and Pax7 (B’) probes. Hmga1 expression overlaps with Pax7 in the neural plate border. (B’’–B’’’) Transverse section through embryo in (B) shows Hmga1 and Pax7 transcripts in the neural plate and neural plate border, respectively, but not the non-neural ectoderm. (C–D’) As the neural folds elevate, Hmga1 expression is retained in the dorsal neural tube. (D’’–D’’’) Transverse section through embryo in (D) shows Hmga1 transcripts in the neural tube. (E–F) As neural crest cells delaminate (E’’’) and migrate laterally from the neural tube (F’’’), Hmga1 is expressed in emigrating (E’’) and migrating neural crest cells (F’’), along with Pax7 (E’ and F’). Arrow points towards delaminating (E’’) and migrating (F’’) cranial neural crest cells. hn, Hensen’s node; npb, neural plate border; np, neural plate; nne, non-neural ectoderm; ect, ectoderm; dNF, dorsal neural folds; nc, notochord; nt, neural tube. See also Figure 2—figure supplement 1.
Figure 2—figure supplement 1
Overlapping expression of Hmga1 and Pax7 in the neural crest visualized in individual channels.
(A-H) Transverse sections shown in Figure 2 stained with DAPI (A,C,E,G). The expression of Hmga1 and Pax7 overlapped in the neural plate border (B,B’; arrows), dorsal neural folds (D,D’; arrows), premigratory (F,F’; arrows), and migratory neural crest cells (H,H’; arrows).
Figure 3 with 1 supplement
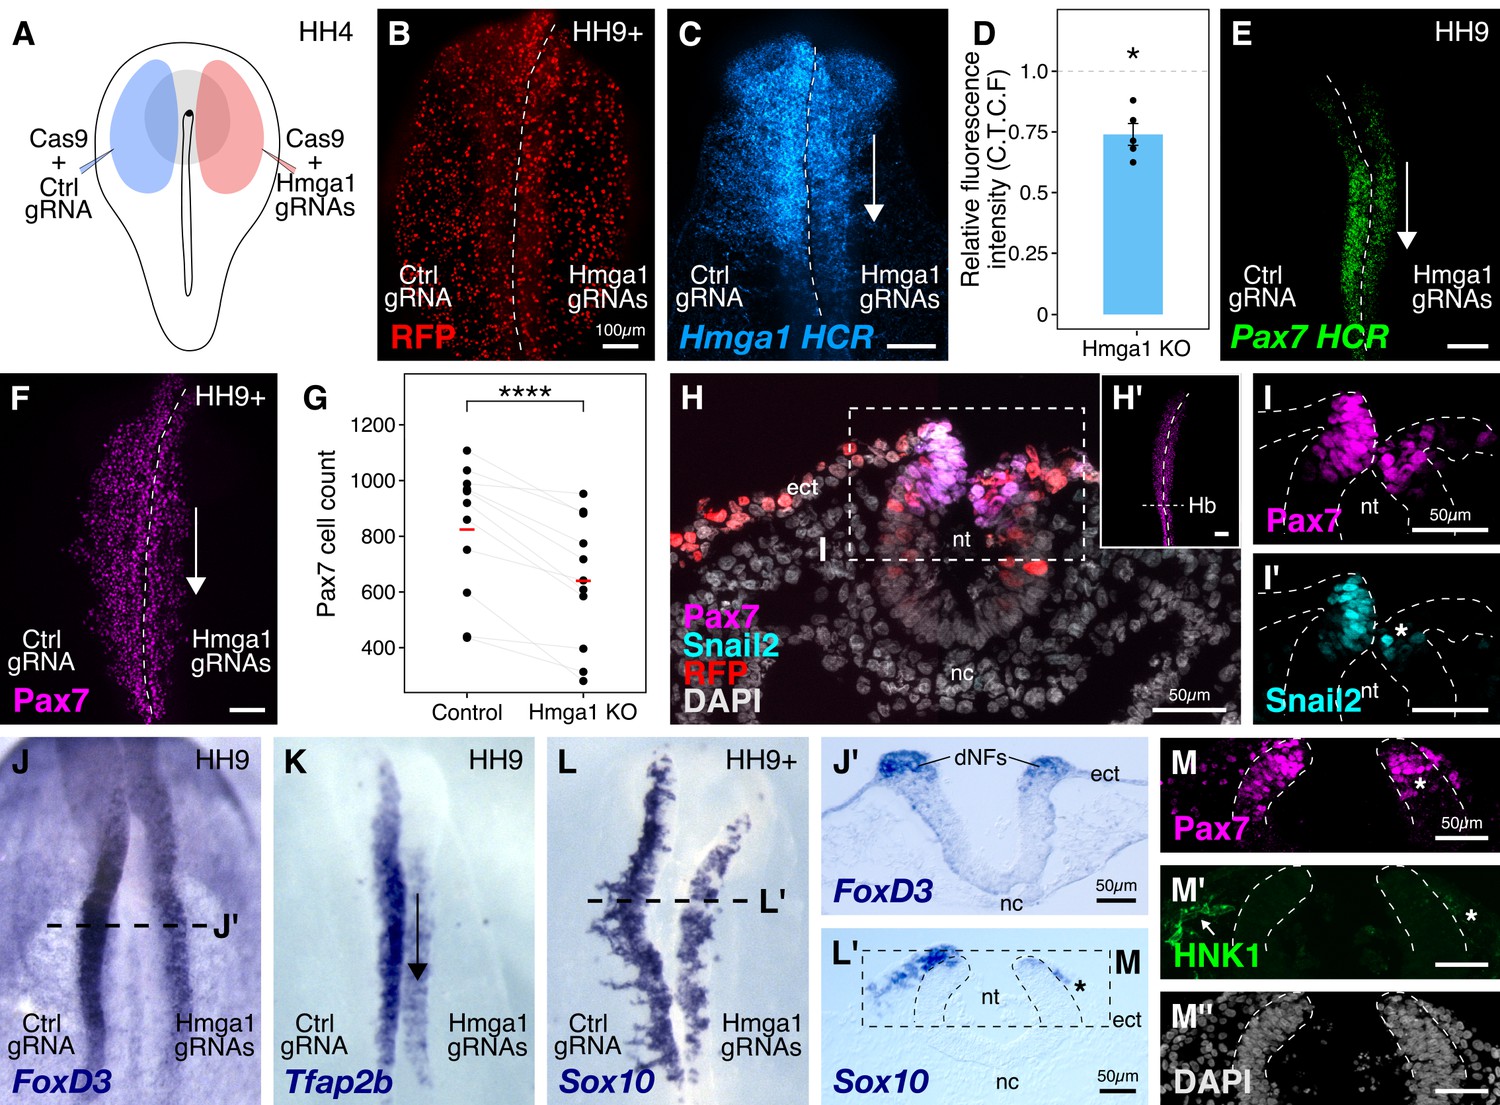
Hmga1 knockout results in loss of neural crest specification.
(A) The electroporation strategy for knocking out Hmga1 using CRISPR-Cas9 in gastrula stage chick embryos. (B) Electroporated embryos were allowed to develop until HH9+ and screened for the expression of H2B-RFP. (C) Electroporation of Cas9 and Hmga1 gRNAs on the right side resulted in loss of Hmga1 transcripts in the neural crest as confirmed using HCR. (D) Hmga1 expression in the neural crest quantified as corrected total cell fluorescence (CTCF) intensity in wholemount Hmga1-mutant embryos processed for HCR. A significant reduction in expression was observed (p-value<0.05, Wilcoxon rank test) on the experimental compared to the control side. A ratio of 1 (dotted line) corresponds to similar levels of Hmga1 expression on both sides. (E–F) Hmga1 knockout results in reduced Pax7 expression in the neural crest, likely resulting from a significant reduction in Pax7+ cell count (F) on the knockout compared to the control side (****p<0.0001, student’s t-test). (G–H) Transverse section through the hindbrain of a representative knockout embryo (G’) was stained for Pax7 (H) and the neural crest specifier Snail2 (H’). (I) Hmga1 knockout also resulted in a reduction of Pax7 transcripts on the knockout side. (J–L) Hmga1-mutant embryos were processed for in situ hybridization against neural crest specifier genes FoxD3 (J, J’), Tfap2b (K), and Sox10 (L, L’). (M) Transverse section through a representative embryo probed for the expression of Sox10 showed reduced expression of the migratory neural crest marker, HNK1. The expression of Pax7 (M’) was also reduced, while the thickness of the neural tube remained unchanged (M’’). See also Figure 3—figure supplement 1; Figure 3—source data 1, Figure 3—source data 2.
-
Figure 3—source data 1
Hmga1 HCR intensity whole mount embryos compared between Control and Hmga1-knockout sides in panel C.
- https://cdn.elifesciences.org/articles/57779/elife-57779-fig3-data1-v2.xlsx
-
Figure 3—source data 2
Pax7-positive cell counts in whole mount embryos compared between Control and Hmga1-knockout sides in panel G.
- https://cdn.elifesciences.org/articles/57779/elife-57779-fig3-data2-v2.xlsx
Figure 3—figure supplement 1

Knocking out Hmga1 in gastrula stage embryos.
(A) The genomic locus of Hmga1 in the chick genome. Two gRNAs, one targeting the splice donor site of exon three and another one targeting the splice donor site of exon four were designed to knock it out using CRISPR-Cas9. The protospacer adjacent motifs for both gRNAs lie in the intronic regions (highlighted in blue). (B) Electroporated embryos were allowed to develop until HH9+ and immunostained for the migratory neural crest marker HNK1. In the absence of Hmga1, neural crest cells failed to migrate properly on the experimental side. (C) Hmga1 knockout results in reduced c-Myc expression in premigratory neural crest. (D–E’’) Transverse section through a representative Hmga1-knockout embryo with FoxD3 mRNA labeled using in situ hybridization. Neural crest cells migrated normally on the control (arrow) compared to the knockout side (asterisk). While the thickness of the neural tube (E) was unaffected on the knockout side, the expression of Pax7 (E’) and HNK1 (E’’) was also reduced.
Figure 4 with 1 supplement

The effects of Hmga1 knockout on neural crest specification are Pax7-dependent.
(A-B) Transverse sections through a representative embryo show a dramatic reduction in the number of Pax7+ cells in the hindbrain (B, asterisk) as compared to the midbrain (A) at HH9/9+. As the hindbrain develops later than the midbrain due to the anterior-posterior progression of neural development, the effect on neural crest specification is more penetrant in the hindbrain (asterisk) due to the time lag between Cas9 plasmid electroporation and its activation in transfected cells. (C) The ratio of Pax7+ cells between the experimental and control sides quantified at the midbrain and hindbrain levels is significantly different (*p<0.05; student’s t-test). A ratio of 1 (dotted line) corresponds to a similar number of Pax7+ cells on both sides. (D) Electroporation strategy for knocking out Hmga1 using Cas9 protein and in vitro-transcribed gRNAs. This strategy was used to immediately reduce the levels of Hmga1 on the knockout side. (E) HCR against Hmga1 in mutant embryos shows dramatic transcriptional reduction on the experimental side (arrowhead). (F) Cas9-protein-mediated loss of Hmga1 resulted in downregulation of Pax7 expression in the neural plate border on the right side (experimental side; arrowhead). (G) Illustration of the neural plate border. (H–I’) Transverse section through embryo shown in F. Electroporation of the control ribonucleoprotein (RNP) complex had no effect on the expression of Pax7 in the neural plate border (H), whereas the knockout side showed an almost complete loss (I, asterisk). No difference in the thickness of the neural plate border was observed between the two sides (H’,I’). (J) Quantification of relative fluorescence intensity for Pax7 signal calculated as corrected total cell fluorescence (C.T.C.F) revealed a statistically significant difference between the control (left) and knockout (right) sides (**p<0.01, paired student’s t-test). (K–P’’) Representative Hmga1-mutant embryos that were processed for HCR against neural plate border genes Tfap2a (K; experimental side - arrowhead) and Msx1 (N; experimental side - arrowhead). While Hmga1 loss resulted in reduction of Pax7 transcripts on the experimental sides (M,P; asterisk) compared to the control sides (L,O), the expression of Tfap2a (L’,M’) and Msx1 (O’,P’) was relatively unchanged. No notable difference was observed in the thickness of the neural plate border (L’’,M’’,O’’,P’’). (Q) Transcriptional response to the loss of Hmga1 was quantified as the ratio of knockout versus control C.T.C.F per unit area. While Pax7 expression was significantly reduced (***p<0.001, paired student’s t-test), no significant difference in Msx1 expression was observed (n.s. p>0.05, paired student’s t-test). Dotted line represents unperturbed ratio. See also Figure 4—figure supplement 1; Figure 4—source data 1, Figure 4—source data 2, Figure 4—source data 3.
-
Figure 4—source data 1
Pax7-positive cell counts in transverse sections through the midbrain and hindbrain compared between Control and Hmga1-knockout sides in panel C.
- https://cdn.elifesciences.org/articles/57779/elife-57779-fig4-data1-v2.xlsx
-
Figure 4—source data 2
Pax7 corrected total cell fluorescence intensity in transverse sections through the neural plate border compared between Control and Hmga1-RNP-knockout sides in panel J.
- https://cdn.elifesciences.org/articles/57779/elife-57779-fig4-data2-v2.xlsx
-
Figure 4—source data 3
Pax7 and Msx1 HCR corrected total cell fluorescence intensity in transverse sections through the neural plate border compared between Control and Hmga1-RNP-knockout sides in panel Q.
- https://cdn.elifesciences.org/articles/57779/elife-57779-fig4-data3-v2.xlsx
Figure 4—figure supplement 1
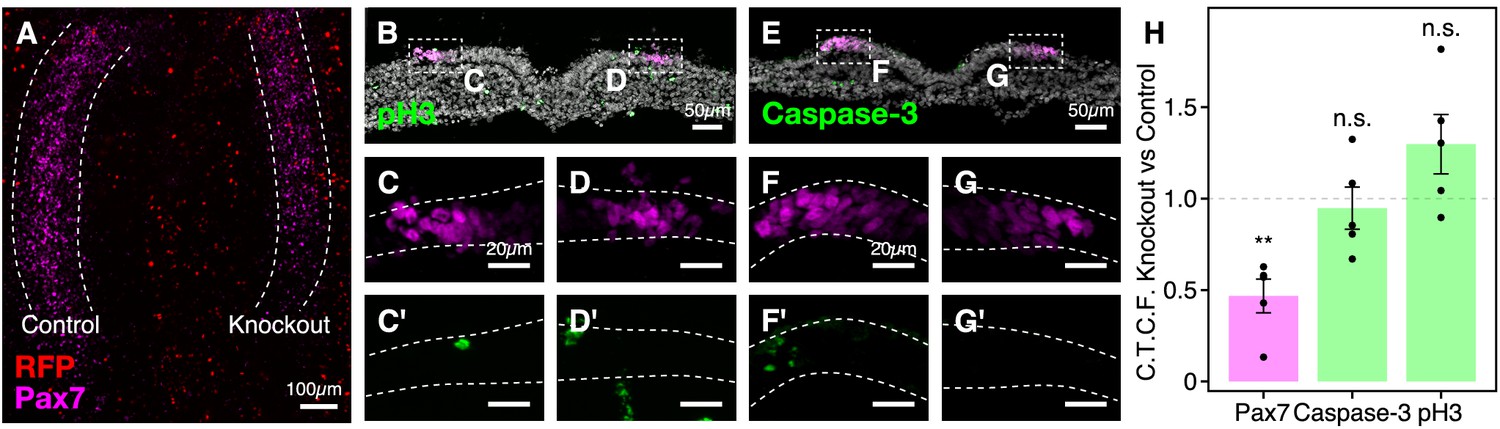
Hmga1 knockout does not affect neural crest cell proliferation and apoptosis.
(A) Whole mount embryo shown in Figure 4F. Nuclear RFP was electroporated as a transfection control. (B–G’) Adjacent transverse sections through embryo in A immunostained with antibodies against phospho-histone H3 (B,C’,D’) and cleaved-caspase-3 (E,F’,G’) as a readout for cell proliferation and apoptosis, respectively. While the levels of Pax7 protein (C,D,F,G) were downregulated in the absence of Hmga1, no notable difference was observed in the rate of proliferation or cell death between the experimental (right; D’,G’) and control (left; C’,F’) sides. (H) The relative fluorescence intensity for Pax7, cleaved-caspase-3, and phospho-histone H3 was measured as the ratio of corrected total cell fluorescence (C.T.C.F.) between the knockout versus the control side. The Pax7 fluorescence intensity was significantly reduced (**p<0.01, paired Student’s t-test) on the knockout side, whereas the difference between cleaved-caspase-3 and phospho-histone H3 relative intensities was not significant (n.s. p>0.05, paired Student’s t-test). Dotted line represents unperturbed ratio. See also Figure 4—figure supplement 1—source data 1.
-
Figure 4—figure supplement 1—source data 1
Pax7, Cleaved-caspase-3, and phospho-histone-H3 corrected total cell fluorescence intensity in transverse sections through the neural plate border compared between Control and Hmga1-RNP-knockout sides in panel H.
- https://cdn.elifesciences.org/articles/57779/elife-57779-fig4-figsupp1-data1-v2.xlsx
Figure 5
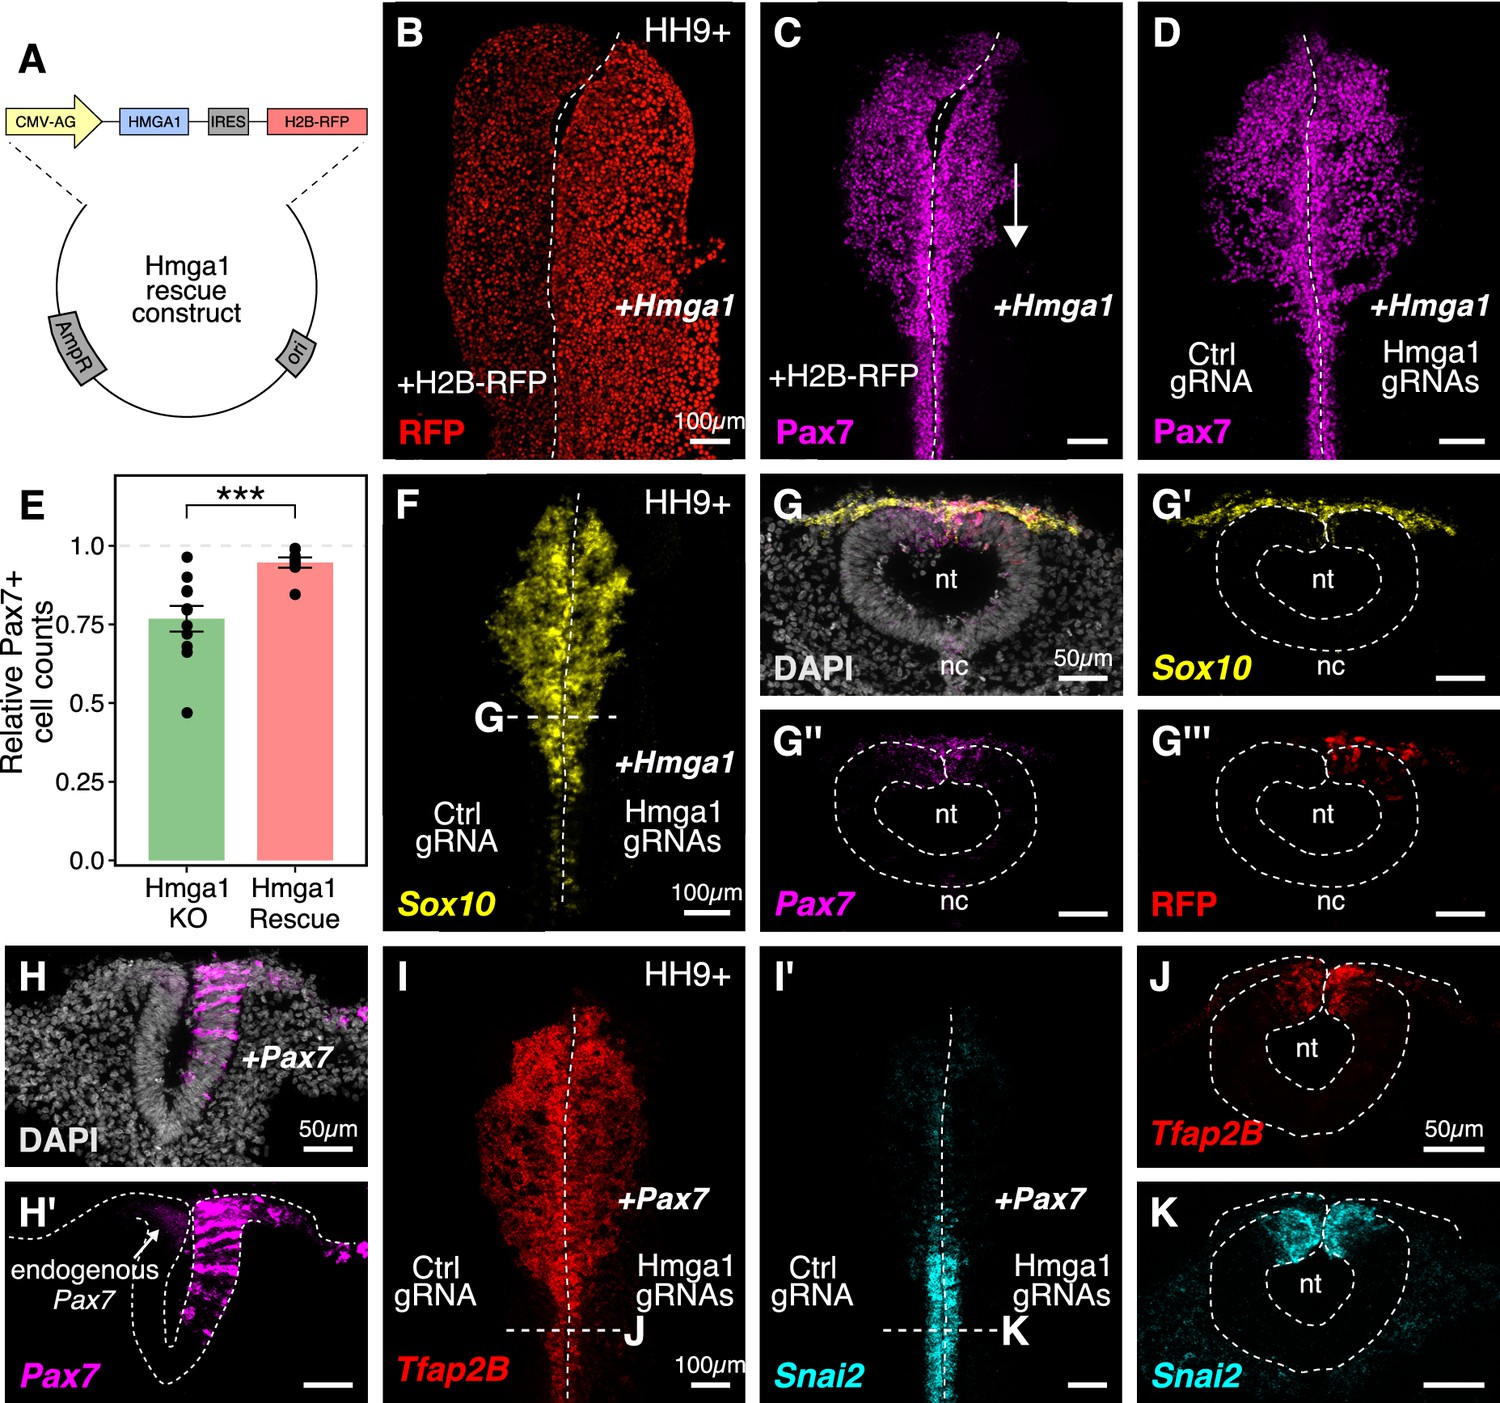
Ectopic expression of Hmga1 or Pax7 rescues cranial neural crest specification.
(A) Plasmid construct used to rescue Hmga1. An independent ribosome entry site (IRES) controls translation of nuclear RFP in transfected cells. The electroporation strategy for knocking out Hmga1 using CRISPR-Cas9 in gastrula stage chick embryos. (B) Embryos were electroporated with the ‘rescue’ construct on the right side and a control nuclear RFP plasmid on the left side. (C) Exogenous expression of the Hmga1 coding sequence under the regulation of a ubiquitous enhancer/promoter combination causes cranial neural crest migration defects. (D–G’’’) Overexpression of the coding sequence (G’’’) of Hmga1 compensates for its loss of function, rescuing proper cranial neural crest migration (D), as assayed by number of Pax7-positive neural crest cells (E), and expression of the neural crest specifier gene Sox10 (F) in migratory cranial neural crest (G,G’) and Pax7 in the dorsal neural tube (G’’). Electroporated embryos were allowed to develop until HH9+ and screened for the expression of H2B-RFP. (H–H’) The coding sequence for Pax7 was ectopically expressed in an Hmga1-knockout background. Transverse section through a representative embryo shows the comparison between endogenous (left) and overexpressed (right; arrow) Pax7 transcript levels in the dorsal neural tube. I-K. Ectopic expression of Pax7 rescued neural crest specification defects caused by the loss of Hmga1 as assayed by the expression of neural crest specifier genes Tfap2b (I) and Snai2 (I’) in transverse cross-sections through the hindbrain (J,K). nt, neural tube; nc, notochord. See also Figure 5—source data 1.
-
Figure 5—source data 1
Pax7-positive cell counts in transverse sections through the hindbrain compared between Control and Hmga1-rescue sides in panel E.
- https://cdn.elifesciences.org/articles/57779/elife-57779-fig5-data1-v2.xlsx
Figure 6 with 1 supplement
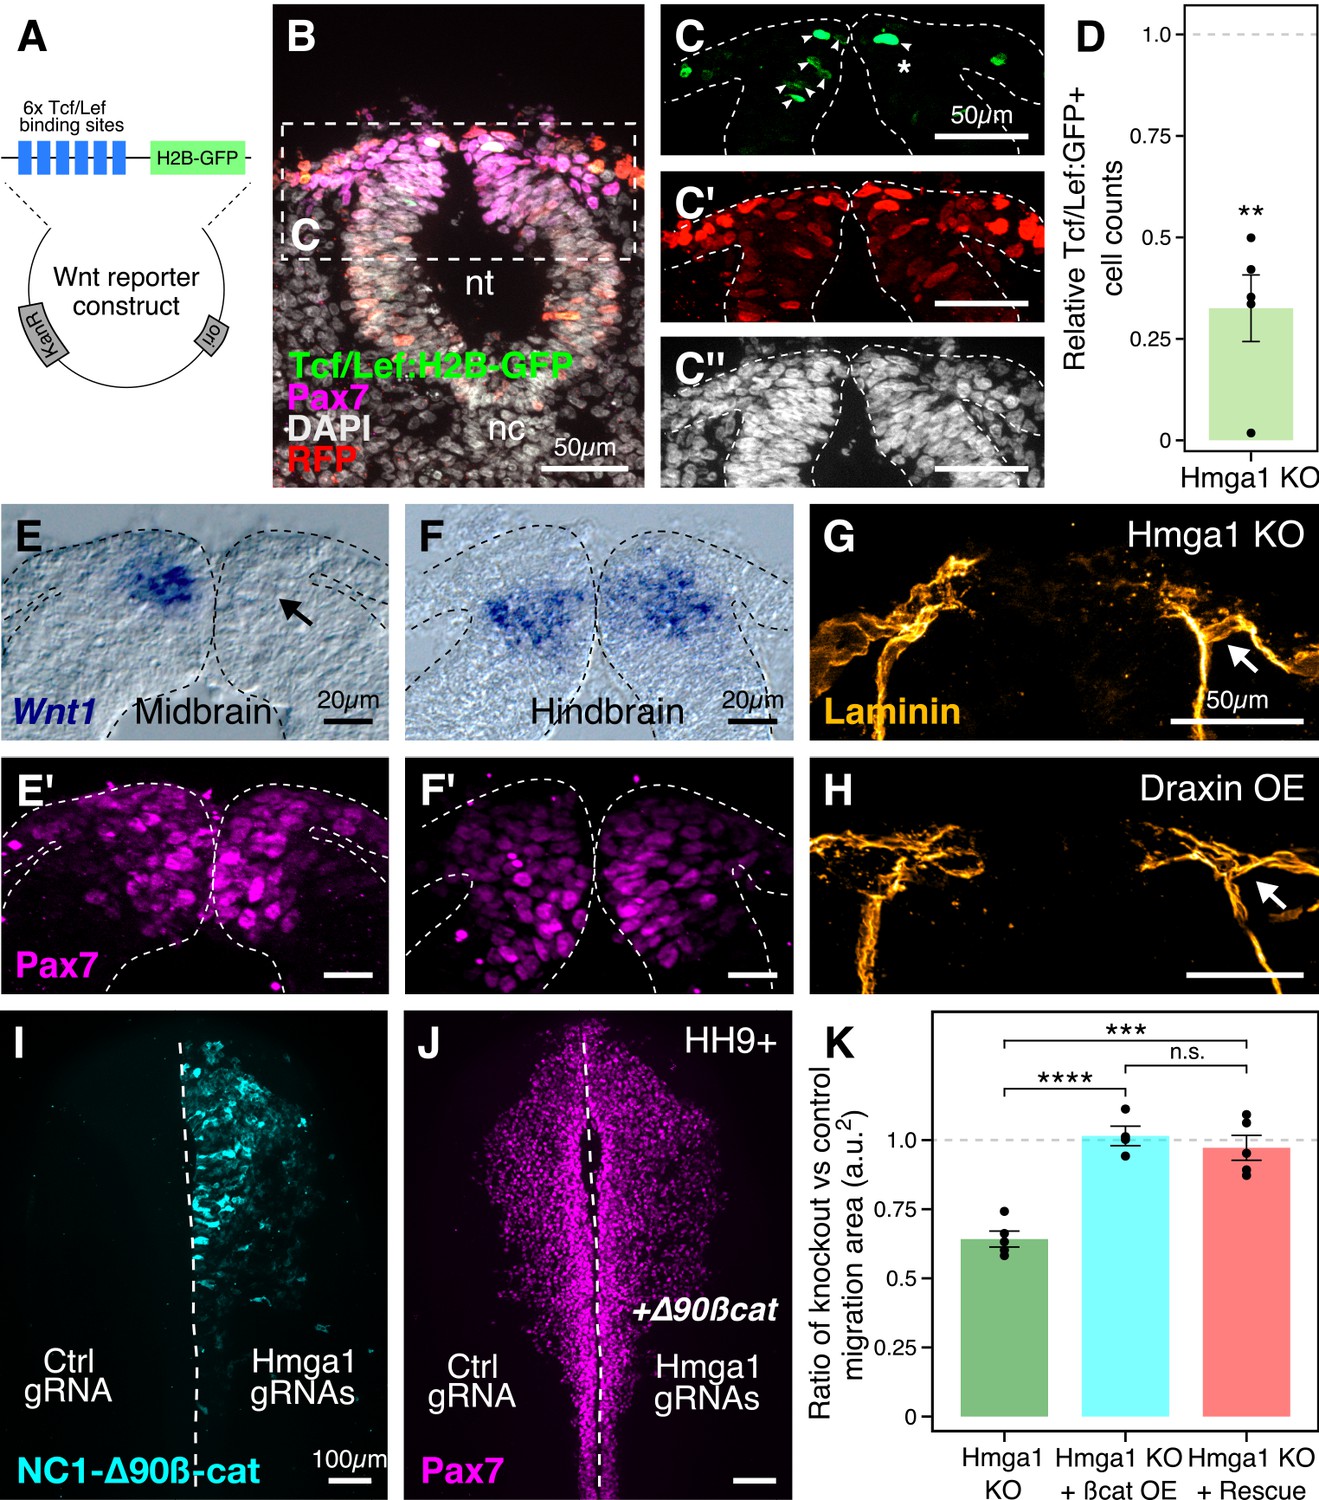
Hmga1 activates Wnt signaling pathway in delaminating neural crest cells.
(A) Plasmid construct used as a readout for Wnt activity (after Ferrer-Vaquer et al., 2010). Six TCF/Lef-binding sites together with a minimal promoter regulate the expression of nuclear GFP in transfected cells in response to Wnt signaling. (B) Transverse section through the midbrain of a representative HH9+ embryo immunostained for Pax7, GFP, RFP, and DAPI. (C–C’’) Individual channels of image in B focused on the dorsal neural tube. In the absence of Hmga1, Wnt reporter activity was downregulated, resulting in fewer cells that expressed nuclear GFP (arrowheads) on the right side (C), even though cells were uniformly transfected on both experimental and control sides (C’), and the thickness of the neural tube remained unaffected (C’’). (D) The reduction in Wnt reporter output was quantified as a ratio of number of cells that expressed nuclear GFP, and the number of cells that were successfully transfected and therefore expressed nuclear RFP. The observed difference in GFP+/RFP+ ratio between the knockout and control sides was statistically significant (**p<0.01, student’s t-test). (E–F) In situ hybridization against Wnt1 in an Hmga1-knockout background. Transverse section through the midbrain (E) and hindbrain (F) shows reduced and unchanged levels of Wnt1 ligand in the dorsal neural tube on the experimental (arrow) versus control neural tubes, respectively. (E’–F’) The number of Pax7-positive cells in the midbrain appeared unchanged (E’), while a reduction was observed in the hindbrain (F’). (G–H) Transverse section through a representative embryo where Hmga1 was knocked out using CRISPR plasmids (G), and an embryo where Draxin was ectopically expressed (H) on the right side, immunostained for Laminin. Similar to Draxin overexpression, Hmga1 loss resulted in a failure of basement membrane remodeling due to reduced canonical Wnt signaling in neural crest cells, causing the laminin channel to remain blocked on the experimental side (arrows). (I–J) Expression of stabilized ß-catenin (NC1-∆90ß-cat) in delaminating cranial neural crest of Hmga1-knockout embryos was sufficient to rescue the migration defect. (K) Quantification of area covered by cranial neural crest cells on the experimental versus control sides. In the absence of Hmga1, cranial neural crest cells fail to migrate properly, a defect that can be separately rescued in Hmga1-knockout background by overexpression (OE) of stabilized ß-catenin in delaminating cranial neural crest, or exogenous expression of Hmga1 coding sequence ectopically (Rescue). nt, neural tube; nc, notochord; KO, knockout; OE, overexpression. See also Figure 6—figure supplement 1, Figure 6—source data 1, Figure 6—source data 2.
-
Figure 6—source data 1
Ratio of Tcf/Lef:GFP-positive and RFP-positive cell counts in transverse sections through the midbrain compared between Control and Hmga1-knockout sides in panel D.
- https://cdn.elifesciences.org/articles/57779/elife-57779-fig6-data1-v2.xlsx
-
Figure 6—source data 2
Ratio of neural crest cell migration area between experimental and control sides in whole mount embryos compared between Hmga1-knockout, ß-catenin-overexpression, and Hmga1-rescue conditions in panel K.
- https://cdn.elifesciences.org/articles/57779/elife-57779-fig6-data2-v2.xlsx
Figure 6—figure supplement 1
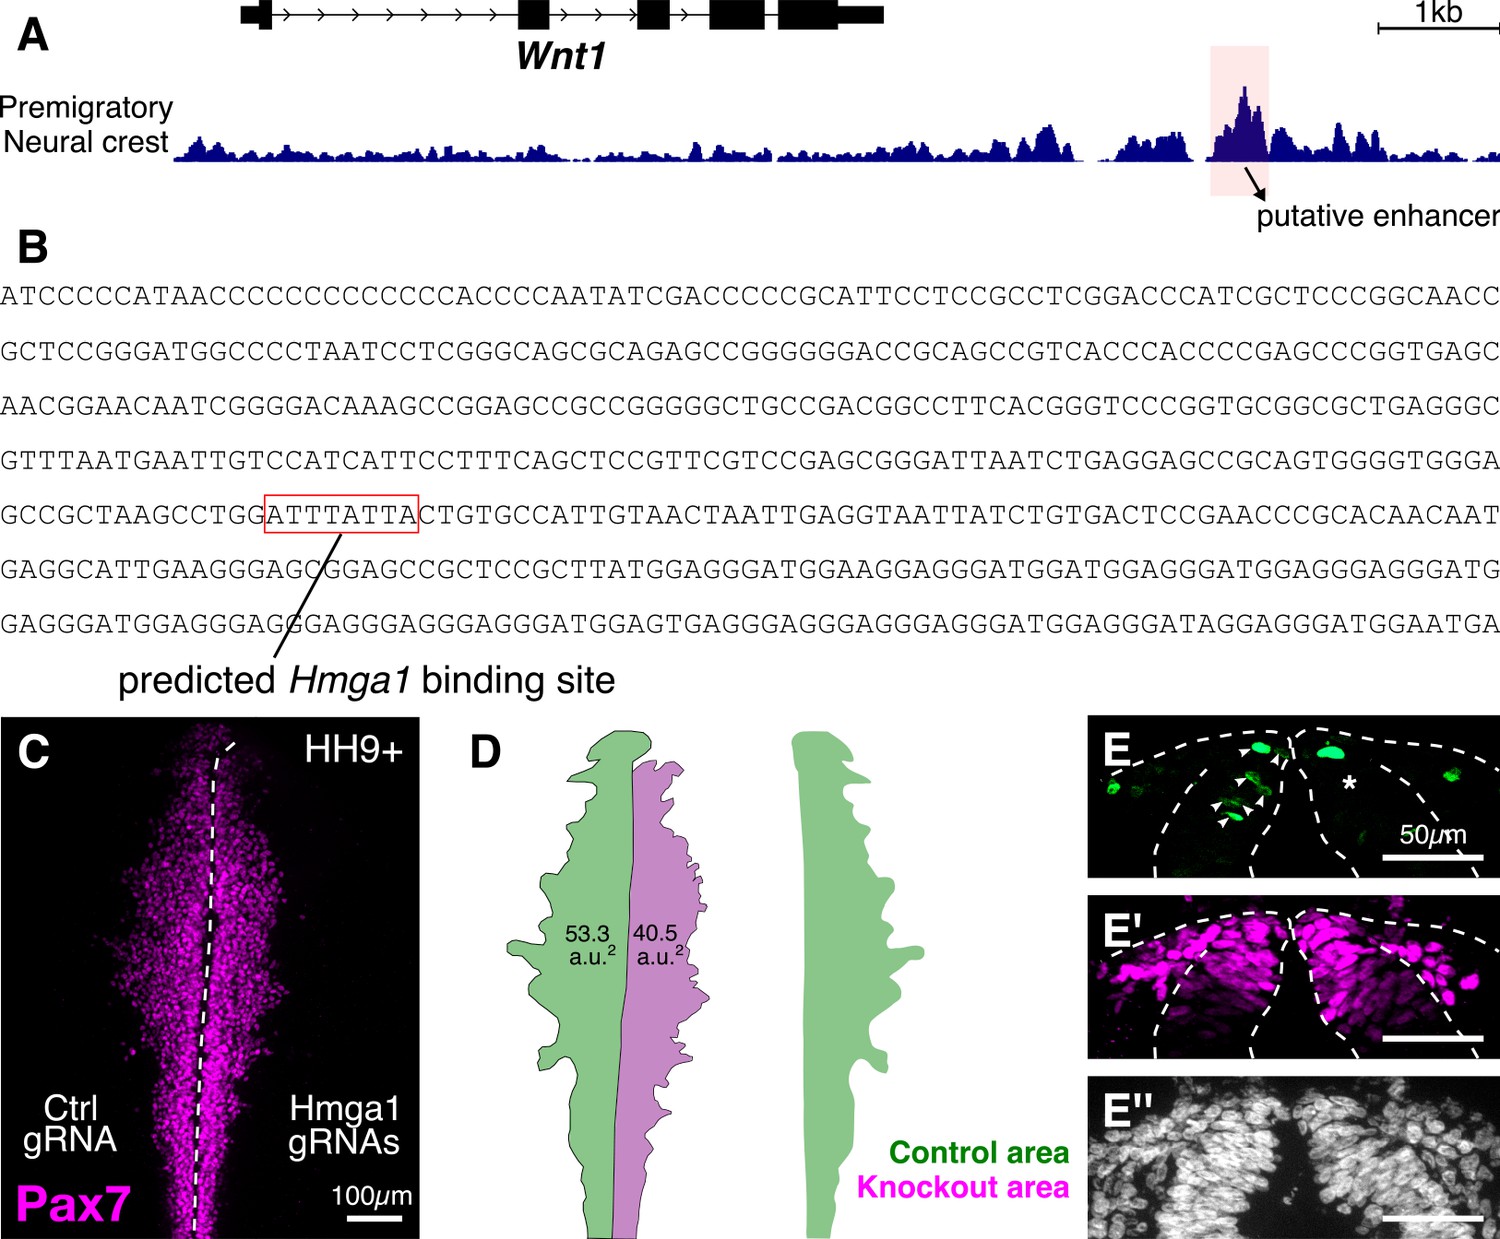
Hmga1 regulates Wnt1 expression in premigratory cranial neural crest cells.
(A) Genomic locus of Wnt1 obtained from the UCSC genome browser (Karolchik et al., 2003). ATAC-seq profile of premigratory cranial neural crest cells (from Williams et al., 2019) shows a putative Wnt1 enhancer upstream of the gene (highlighted in red). (B) Genomic sequence of the putative enhancer identified in (A) contains a predicted AT-rich Hmga1 binding motif (red box). (C) A representative Hmga1-knockout embryo immunostained for Pax7 shows a migration defect on the experimental side (right) compared to the control side (left). (D) The area covered by migratory cranial neural crest cells, marked by the position of the lateral-most leader cell, is reduced following Hmga1 knockout (green – control; 53.3 a.u.2, magenta – knockout; 40.5 a.u.2). An overlay of the two areas highlights this reduction. (E) Transverse section through the embryo shown in (C). The number of dorsal neural tube cells positive for canonical Wnt activity, as indicated by the nuclear GFP reporter expression (E), was significantly decreased following the loss of Hmga1 (shown in Figure 6C). However, the number of Pax7+ cells (E’) on either side of the dorsal neural tube were relatively similar, despite the observed migration defect in (C). No difference in the thickness of the neural tube (E’’) was observed (shown in Figure 6C’’).
Figure 7

Current model for Hmga1 function in chick neural crest development.
Our data suggest that Hmga1 plays temporally distinct roles in the neural plate border and dorsal neural tube. At the neural plate border, Hmga1 acts upstream of Pax7 and is required for proper neural crest specification. Later, in the dorsal neural tube, Hmga1 regulates the levels of Wnt1, thereby modulating the levels of canonical Wnt signaling to control neural crest delamination and subsequent migration.
Tables
Key resources table
| Reagent type (species) or resource | Designation | Source or reference | Identifiers | Additional information |
|---|---|---|---|---|
| Gene (Gallus gallus) | Hmga1 | UCSC genome browser | NM_204369.1 | |
| Strain, strain background (Gallus gallus) | G. gallus | Sun State Ranch (Monrovia, CA, USA) | ||
| Antibody | Mouse IgG1 anti-Pax7 | Developmental Studies Hybridoma Bank | RRID:AB_528428 | 1:10 |
| Antibody | Rabbit anti-Laminin | Sigma-Aldrich | RRID:AB_477163 | 1:1000 on sections |
| Antibody | Mouse IgM anti-HNK1 | Developmental Studies Hybridoma Bank | RRID:AB_2314644 | 1:5 |
| Antibody | Rabbit anti-RFP | MBL | RRID:AB_591279 | 1:500 |
| Antibody | Rabbit anti-Slug (C19G7) | Cell Signaling | RRID:AB_2239535 | 1:200 |
| Antibody | Goat IgG anti-GFP | Rockland | RRID:AB_218182 | 1:500 |
| Antibody | Rabbit anti-cleaved-caspase-3 | R and D systems | RRID:AB_2243952 | 1:500 on sections |
| Antibody | Mouse anti-phospho-histone H3 | Abcam | RRID:AB_443110 | 1:500 on sections |
| Recombinant DNA reagent | pCI-H2B-RFP (plasmid) | Betancur et al., 2010 | ||
| Recombinant DNA reagent | CAG > nls-Cas9-nls (plasmid) | Gandhi et al., 2017 | RRID:Addgene_99138 | |
| Recombinant DNA reagent | cU6.3>Ctrl. gRNA.f+e (plasmid) | Gandhi et al., 2017 | RRID:Addgene_99140 | |
| Recombinant DNA reagent | cU6.3>Hmga1.1. gRNA.f+e (plasmid) | This paper | Detailed in Materials and methods section ‘CRISPR-Cas9-mediated perturbations’ | |
| Recombinant DNA reagent | cU6.3>Hmga1.2. gRNA.f+e (plasmid) | This paper | Detailed in Materials and methods section ‘CRISPR-Cas9-mediated perturbations’ | |
| Recombinant DNA reagent | FoxD3-NC2:eGFP (plasmid) | Simões-Costa et al., 2012 | ||
| Recombinant DNA reagent | Tcf/Lef: H2B-GFP (plasmid) | Ferrer-Vaquer et al., 2010 | RRID:Addgene_32610 | |
| Recombinant DNA reagent | NC1-∆90β-cat (plasmid) | Hutchins and Bronner, 2018 | ||
| Recombinant DNA reagent | pCI-Pax7-IRES-H2B-RFP (plasmid) | Roellig et al., 2017 | ||
| Sequence-based reagent | Hmga1.1. gRNA | This paper | PCR primer | 5’-gCAGGAAGAAACCGGAGgta |
| Sequence-based reagent | Hmga1.2. gRNA | This paper | PCR primer | 5’-GCCAGCTCCAAAGGCAGGgt |
| Sequence-based reagent | AscI-V5-Fwd | This paper | PCR primer | 5’-ggcgcgccaccATGGCTGGTAAGCCTA |
| Sequence-based reagent | V5-Hmga1-Fwd | This paper | PCR primer | 5’-CTCCTCGGTCTCGATTCTagcgacgccggcgccaagcc |
| Sequence-based reagent | Hmga1OLP-V5-Rev | This paper | PCR primer | 5’-ggcttggcgccggcgtcgctAGAATCGAGACCGAGGAG |
| Sequence-based reagent | Hmga1-ClaI-Rev | This paper | PCR primer | 5’-ttatcgattcactgctcctcctcggatg |
| Sequence-based reagent | Hmga1.1 short guide oligo | This paper | PCR primer | 5’-GCGTAATACGACTCACTATAGGCAGGAAGAAACCGGAGGTAGTTTTAGAGCTAGAAATAGC |
| Sequence-based reagent | Hmga1.2 short guide oligo | This paper | PCR primer | 5’-GCGTAATACGACTCACTATAGGCCAGCTCCAAAGGCAGGGTGTTTTAGAGCTAGAAATAGC |
| Sequence-based reagent | Control short guide oligo | Hutchins and Bronner, 2018 | PCR primer | Detailed in Materials and methods section ‘CRISPR-Cas9-mediated perturbations’ |
| Sequence-based reagent | gRNA Primer 1 | Hutchins and Bronner, 2018 | PCR primer | Detailed in Materials and methods section ‘CRISPR-Cas9-mediated perturbations’ |
| Sequence-based reagent | gRNA Primer 2 | Hutchins and Bronner, 2018 | PCR primer | Detailed in Materials and methods section ‘CRISPR-Cas9-mediated perturbations’ |
| Sequence-based reagent | Guide-constant oligo | Hutchins and Bronner, 2018 | PCR primer | Detailed in Materials and methods section ‘CRISPR-Cas9-mediated perturbations’ |
| Commercial assay or kit | Chromium Single Cell 3’ Library and Gel Bead Kit v2 | 10X Genomics | Cat# PN-120267 | |
| Commercial assay or kit | Chromium Single Cell A Chip Kit | 10X Genomics | Cat# PN-1000009 | |
| Commercial assay or kit | Endofree maxi prep kit | Macharey Nagel | Cat# 740426.50 | |
| Commercial assay or kit | Agencourt AMPure XP beads | Beckman Coulter | Cat# A63880 | |
| Commercial assay or kit | Dynabeads MyOne SILANE | 10X Genomics | Cat# 2000048 | |
| Commercial assay or kit | SPRIselect Reagent Kit | Beckman Coulter | Cat# B23318 | |
| Commercial assay or kit | High Sensitivity DNA Kit | Agilent | Cat# 5067–4626 | |
| Commercial assay or kit | Qubit dsDNA HS Assay Kit | Thermo Fisher Scientific | Cat# Q32854 | |
| Software, algorithm | Fiji | Schindelin et al., 2012 | RRID:SCR_002285 | https://imagej.net/Fiji |
| Software, algorithm | Seurat | Butler et al., 2018 | RRID:SCR_007322 | https://satijalab.org/seurat/ |
| Software, algorithm | Inkscape | Inkscape | RRID:SCR_014479 | https://inkscape.org/ |
| Software, algorithm | Cellranger | 10X Genomics | ||
| Software, algorithm | 2100 Expert software | Agilent | RRID:SCR_014466 | |
| Other | Fluoromount-G | Southern Biotech | Cat# 0100–01 | |
| Other | DAPI | Thermo Fisher Scientific | Cat# D1306 | 1:10000 on sections |
Additional files
Download links
A two-part list of links to download the article, or parts of the article, in various formats.
Downloads (link to download the article as PDF)
Open citations (links to open the citations from this article in various online reference manager services)
Cite this article (links to download the citations from this article in formats compatible with various reference manager tools)
Bimodal function of chromatin remodeler Hmga1 in neural crest induction and Wnt-dependent emigration
eLife 9:e57779.
https://doi.org/10.7554/eLife.57779


