Mitochondrial volume fraction and translation duration impact mitochondrial mRNA localization and protein synthesis
- Department of Chemistry and Biochemistry, University of California San Diego, United States
- Department of Developmental and Cell Biology and Center for Complex Biological Systems, University of California Irvine, United States
- Division of Biological Science, Graduate School of Science, Nagoya University, Japan
- Department of Anatomy and Structural Biology, Albert Einstein College of Medicine, United States
- Gruss-Lipper Biophotonics Center, Albert Einstein College of Medicine, United States
- Department of Neuroscience, Albert Einstein College of Medicine, United States
- Janelia Research Campus, Howard Hughes Medical Institute, United States
Figures
Figure 1 with 2 supplements

mRNA association with mitochondria differs between fermentative and respiratory conditions.
(A) Experimental setup for live imaging. Mitochondria were visualized by Su9-mCherry and mRNAs were visualized by the single molecule MS2-MCP tethering system. Z-stacks were taken within 1.5 s for each individual channel, and multiple Z-stacks were merged into a series. (Right top) Z-projected image of a live cell. Cyan: mRNA, magenta: matrix. Scale bar, 2 µm. (Right bottom) Reconstructed mRNA and mitochondria. Yellow: mRNA, blue: mitochondria. (B) The proportion of mitochondrial associated mRNA per cell (n > 27) of the different mRNA species in fermentative and respiratory conditions. Error bar represents standard error of the mean (s.e.m.). (C) ATP3 mRNA and TIM50 mRNA expression number per cell. MCP-GFP foci were counted per cell (n > 27). (D) Atp3p-GFP and Tim50p-GFP fusion protein expression level using GFP fluorescent intensity per cell. (C)-(D) Statistical significance was assessed by Mann–Whitney U-test (****p<0.0001; ***p<0.001; **p<0.01; ns, no significant difference). (E) Atp3p-GFP and Tim50p-GFP fusion protein expression level using western blotting with anti-GFP antibody. Each dot represents an independent experiment. Error indicates standard deviation of three independent experiments.
Figure 1—figure supplement 1

Validation of live imaging mRNA foci by single molecule FISH.
(A) TOM22-tagged cells with or without CYC1p-MS2-CP-GFP(x4) were examined by a smFISH experiment. Fluorophore-conjugated multiple 20nt FISH probes were prepared to hybridize the ORF (Cy5) and MS2-tag (Cy3) as depicted. (B) The ratio of MS2-tag with ORF. Percentages of the co-localized foci from the ORF and MS2-tag in MS2-tag foci were calculated based on manual count (N>103). Error bar represents s.e.m. (C) Comparison between live imaging and FISH experiment foci number. The number of mRNA foci in live imaging and number of Cy3 Foci (MS2-tag) in FISH experiments were manually counted (N>43). Statistical significance was assessed by Mann–Whitney U-test (**** P < 0.0001; ** P < 0.01; ns, no significant difference).
Figure 1—figure supplement 2
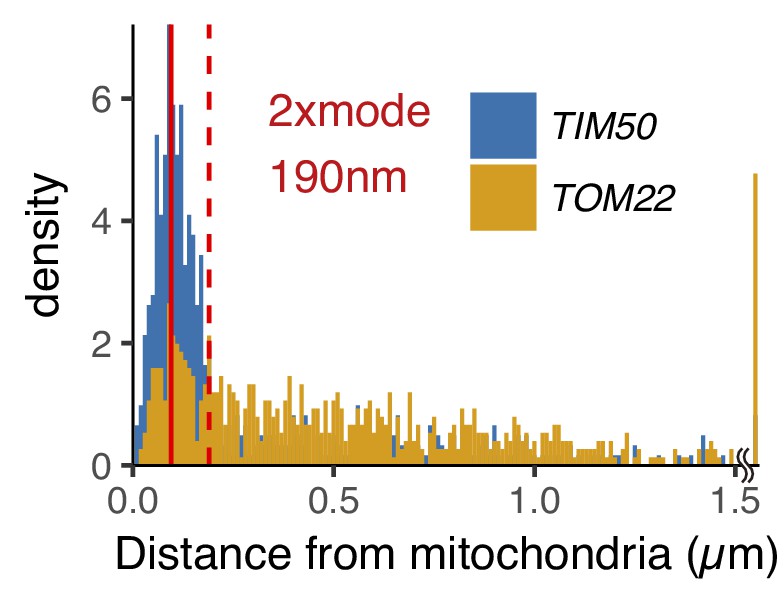
The distribution of mRNA-mitochondria distance in cycloheximide and 1,10-phenanthroline treated cells.
Number of foci in each mRNA is as follows: TIM50 mRNA, 582; TOM22 mRNA, 476. The red solid and dotted line indicate mode and 2x mode (0.19 µm) of the distance between mitochondria and TIM50 mRNA. The bin width is 0.01 µm.
Figure 2 with 5 supplements
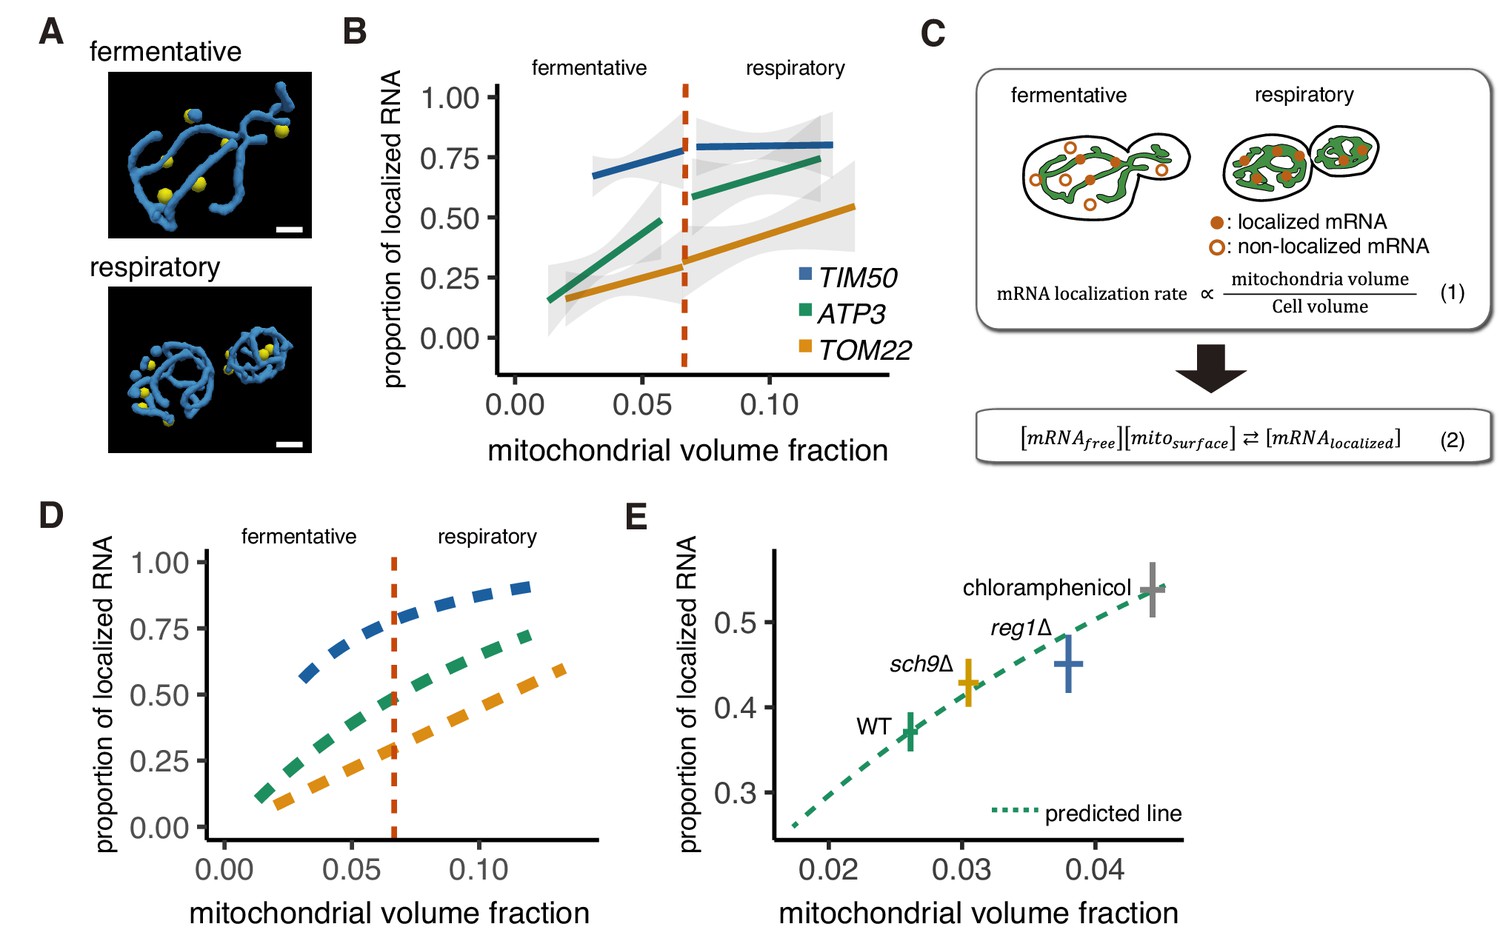
Mitochondrial volume fraction correlates with mRNA localization.
(A) Snapshot of reconstructed mitochondrial surface (blue) and TIM50 mRNA foci (yellow) in fermentative and respiratory conditions. Scale bar, 1 µm. (B) Relationship between the mitochondrial volume fraction and the proportion of mRNA localization to mitochondria. Trend line was depicted according to the best linear fit of the proportion of localization and mitochondrial volume fraction of single cells in each condition of different mRNAs (n > 27). Dotted red line marks the difference between fermentative and respiratory conditions for mitochondria volume fraction. Gray region surrounding the trend lines represents the 95% confidence interval (CI) for each line. (C) Schematic of in silico experiment. (Top) Brownian particle distribution indicates that mRNA localization rate correlates with mitochondrial volume fraction. (Bottom) Hypothetical thermodynamic equilibrium of binding of mRNA to mitochondria. [mRNAlocalized], mitochondrial localized mRNA; [mRNAfree], free diffusing mRNA; [mitosurface], mitochondrial surface where mRNA can bind. (D) Mitochondrial volume fraction and mRNA localization have stoichiometric correlation. Relationship of proportion of mRNA localization to mitochondria and mitochondrial volume fraction from mathematical modeling was plotted. Yellow line represents linearly fitted line for TOM22 mRNA. Green and blue lines were plotted through equilibrium constant of 2.4K0 and 8.8K0, respectively, as described in Materials and methods. (E) In glucose conditions, sch9∆ and reg1∆ mutant strains as well as chloramphenicol addition exhibit higher mitochondrial volume fraction and increase the localization of ATP3 mRNA to the mitochondria (n > 27). Predicted relationship of proportion of mRNA localization to mitochondria and mitochondrial volume fraction from mathematical modeling of WT strains was plotted as a green dotted line. Mean values of each axis for WT, mutant cells, and cells with chloramphenicol addition were plotted as crosses. Error bar represents s.e.m.
Figure 2—figure supplement 1
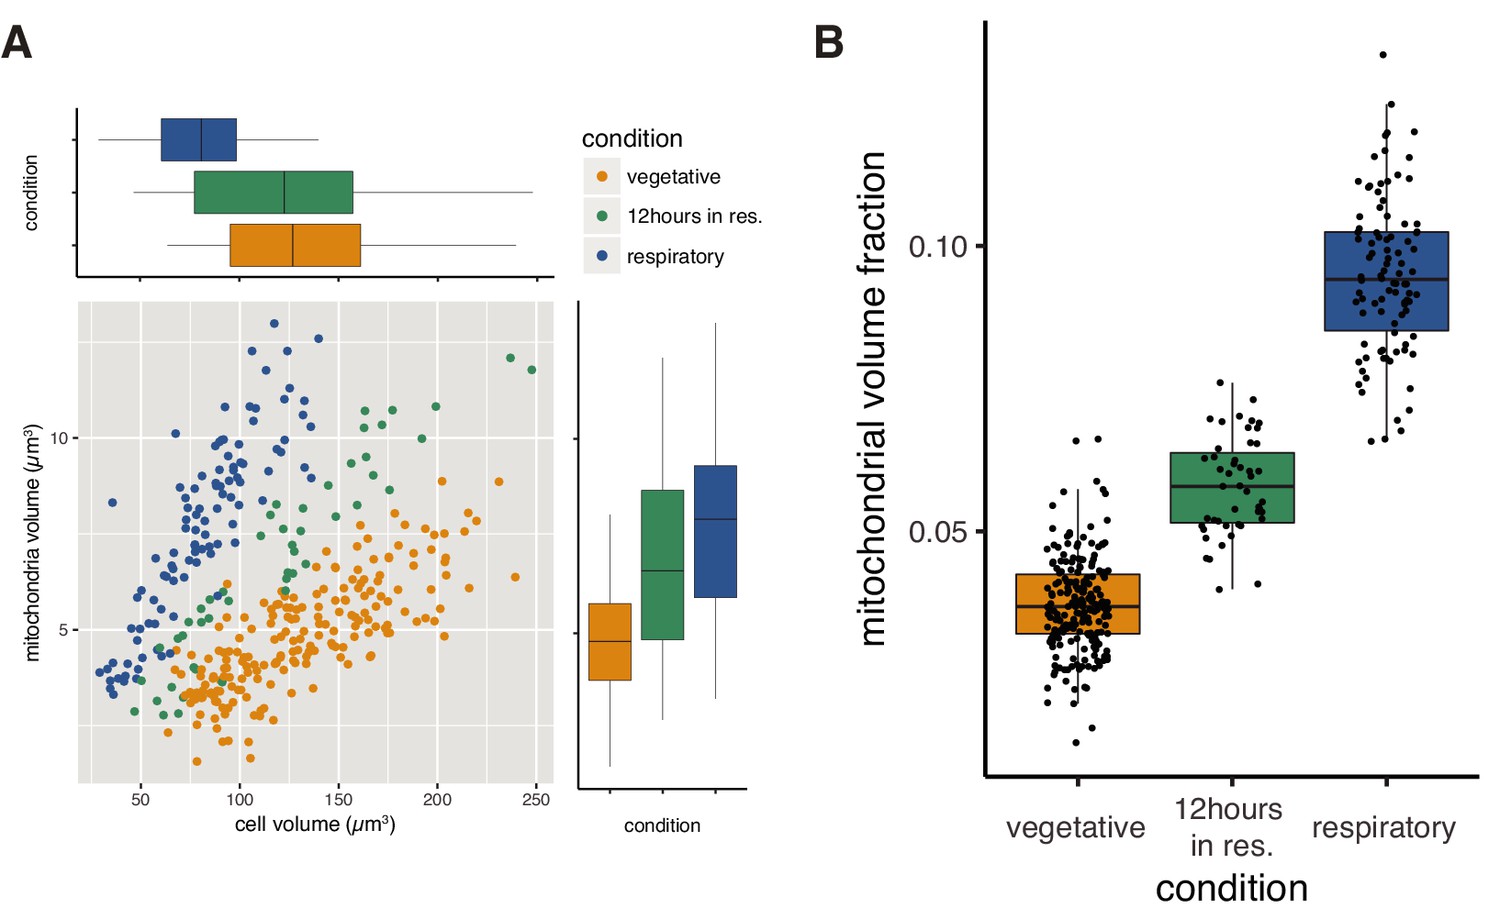
Higher mitochondrial volume fraction is a feature of respiratory conditions.
(A) Relationship of cell volume and mitochondrial volume of single cells in different growth conditions. “12 hours in res.” corresponds to cells grown in respiratory medium for twelve hours after fermentative grown, while normal respiratory samples were grown in respiratory medium for the duration of the experiment. (B) Mitochondrial volume fraction of single cells in different growth conditions.
Figure 2—figure supplement 2
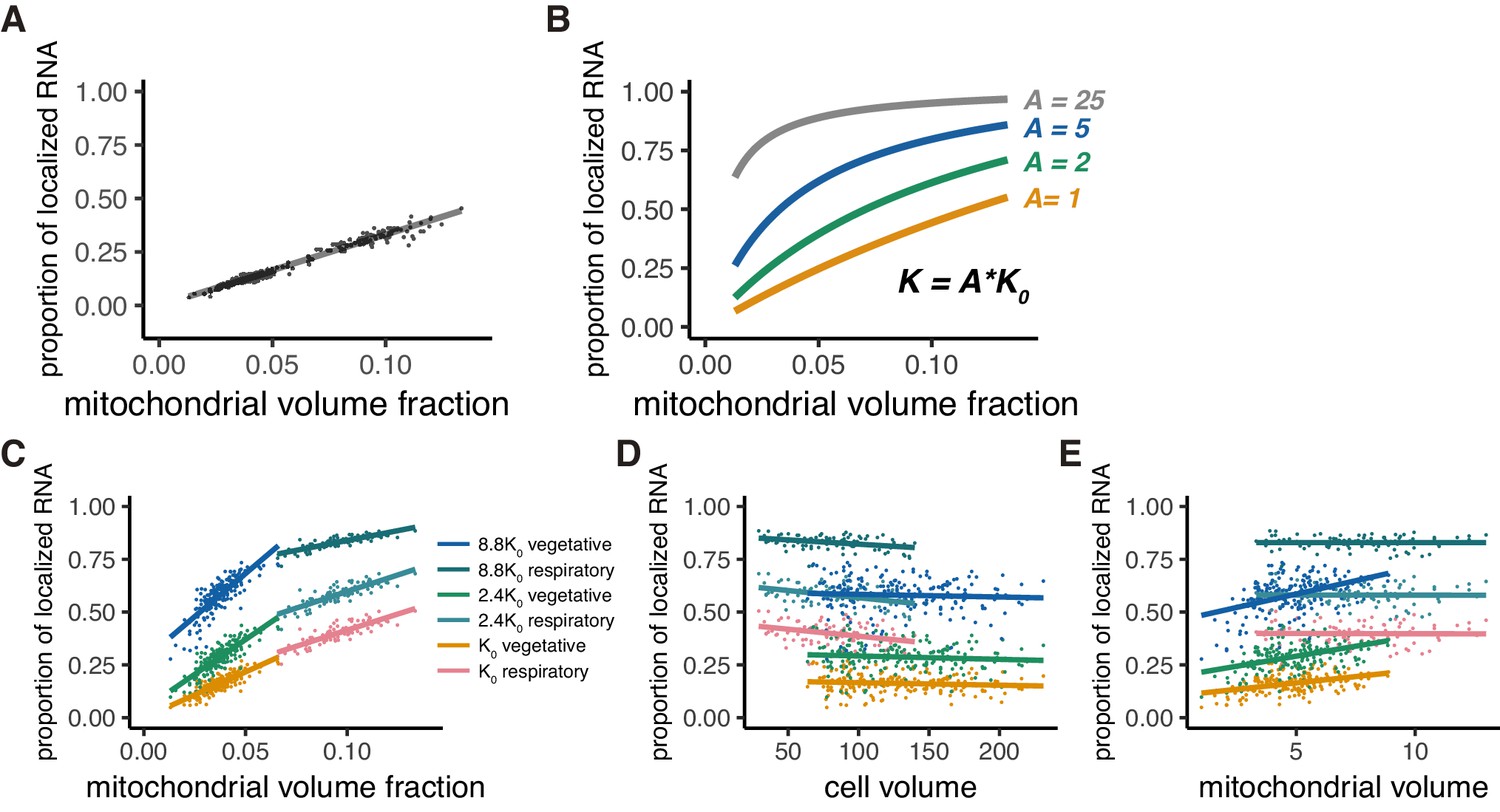
Mitochondrial volume fraction and mRNA localization have stoichiometric correlation.
(A) Relationship of proportion of mRNA localization to mitochondria and mitochondrial volume fraction from in silico experiments as described in Materials and methods (B) Relationship of proportion of mRNA localization to mitochondria and mitochondrial volume fraction acquired by thermodynamically defined A values. The green, blue, and gray lines were plotted through equilibrium constant of A = 2K0, 5K0, and 25K0, respectively, as described in Materials and methods. (C) Mitochondrial volume fraction and mRNA localization have a stoichiometric correlation. Linear regression lines of the proportion of mRNA localization to mitochondria and mitochondrial volume fraction were plotted. Each line represents a linearly fitted line for K0, 2.4K0, and 8.8K0 in fermentative and respiratory conditions, respectively. (D) Cell volume and mRNA localization do not have a stoichiometric correlation. The same data as (C) were summarized with cell volume as the x-axis. (E) Mitochondrial volume and mRNA localization do not have a stoichiometric correlation. The same data as (C) were summarized with mitochondrial volume as the x-axis.
Figure 2—figure supplement 3

Mitochondrial volume fraction correlates with ATP3 mRNA localization in WT, sch9∆ and reg1∆ mutant strains, and upon chloramphenicol addition.
(A) ATP3 mRNA proportion of association with mitochondria was measured in WT, sch9∆ and reg1∆ mutant strains, and upon chloramphenicol addition (WT + Chlo.) (n > 27). Error bar represents s.e.m. (B-F) Mitochondrial volume fraction (B), cell volume (C), mitochondrial volume (D), adjusted mitochondrial volume fraction (E), and vacuole volume fraction (F) in WT, mutant, and chloramphenicol conditions (n > 27). (G) Predicted relationship of proportion of mRNA localization to mitochondria and non-adjusted mitochondrial volume fraction from mathematical modeling of WT strains was plotted as green dotted lines. Mean value of each axis of WT, mutants cells, and cells from chloramphenicol added conditions were plotted as cross. Error bar represents s.e.m. (H, I) Relationship of the proportion of ATP3 mRNA localization to mitochondria and mitochondrial volume fraction from mathematical modeling. (I) Mitochondrial volume fraction was adjusted with effective cytoplasm volume. Green lines represent the relationship in WT cells, orange, blue, and grey lines represent sch9∆ and reg1∆ mutant cells, and chloramphenicol added condition respectively. Lines were plotted as described in Materials and methods.
Figure 2—figure supplement 4
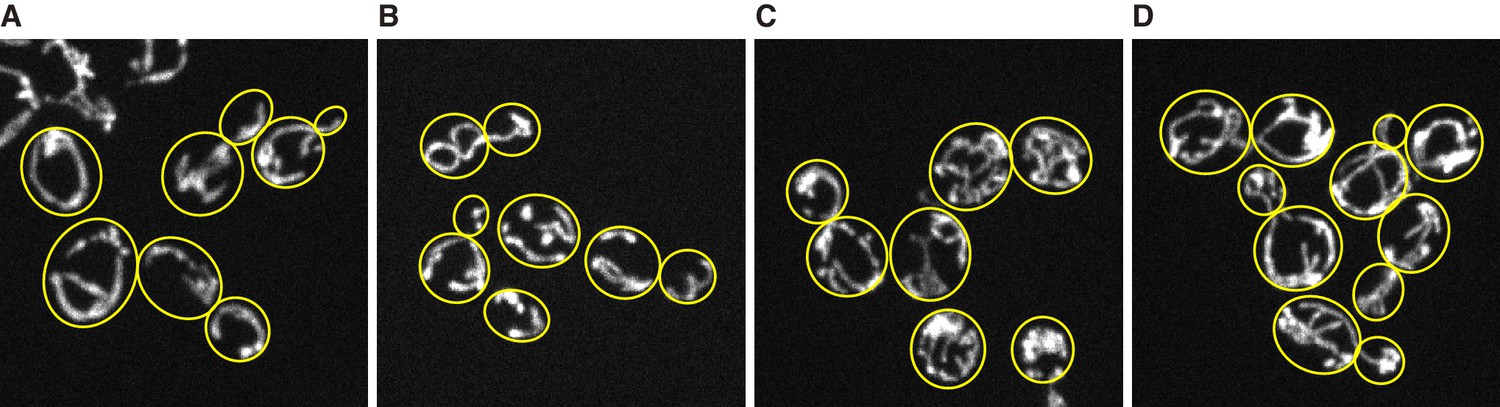
reg1∆ mutant strains and chloramphenicol addition increases mitochondrial volume fraction.
Z-projected image of mitochondria in live cells. (A) Wild type cells grown in YPAD medium. (B) sch9∆ mutant cells grown in YPAD medium. (C) reg1∆ mutant cells grown in YPAD medium. (D) Wild type cells grown in YPAD medium containing 1µg/ml of chloramphenicol. Mitochondria were visualized by Su9-mCherry. Yellow lines represent cell boundary.
Figure 2—figure supplement 5
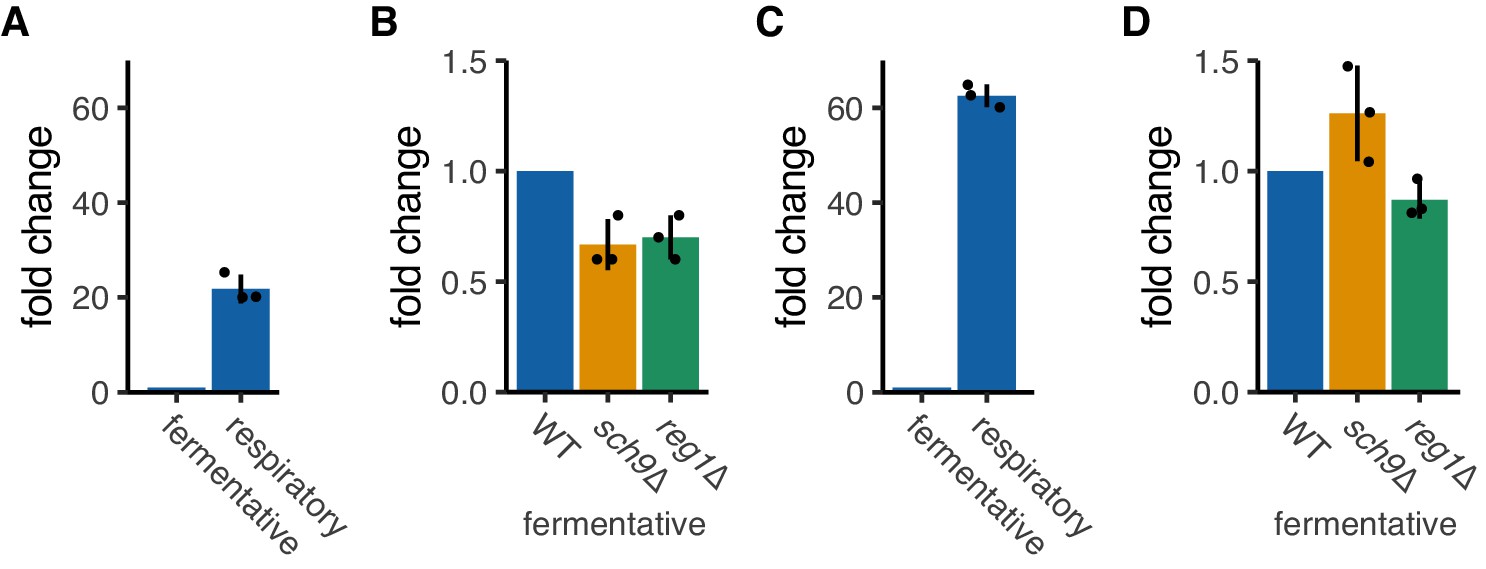
OM14 and OM45 transcripts level in fermentative and respiratory conditions.
(A, B) OM14 transcript levels were tested in fermentative and respiratory conditions (A) and mutant strains in fermentative condition (B). mRNA expression was analyzed with RT-qPCR using primers for OM14. (C, D) OM45 transcript levels were tested for fermentative and respiratory conditions (C) and mutant strains in fermentative condition (D). mRNA expression was analyzed with RT-qPCR using primers for OM45. (A-D) Each dot represents an independent experiment. Error bar represents standard deviation of three independent experiments.
Figure 3 with 2 supplements
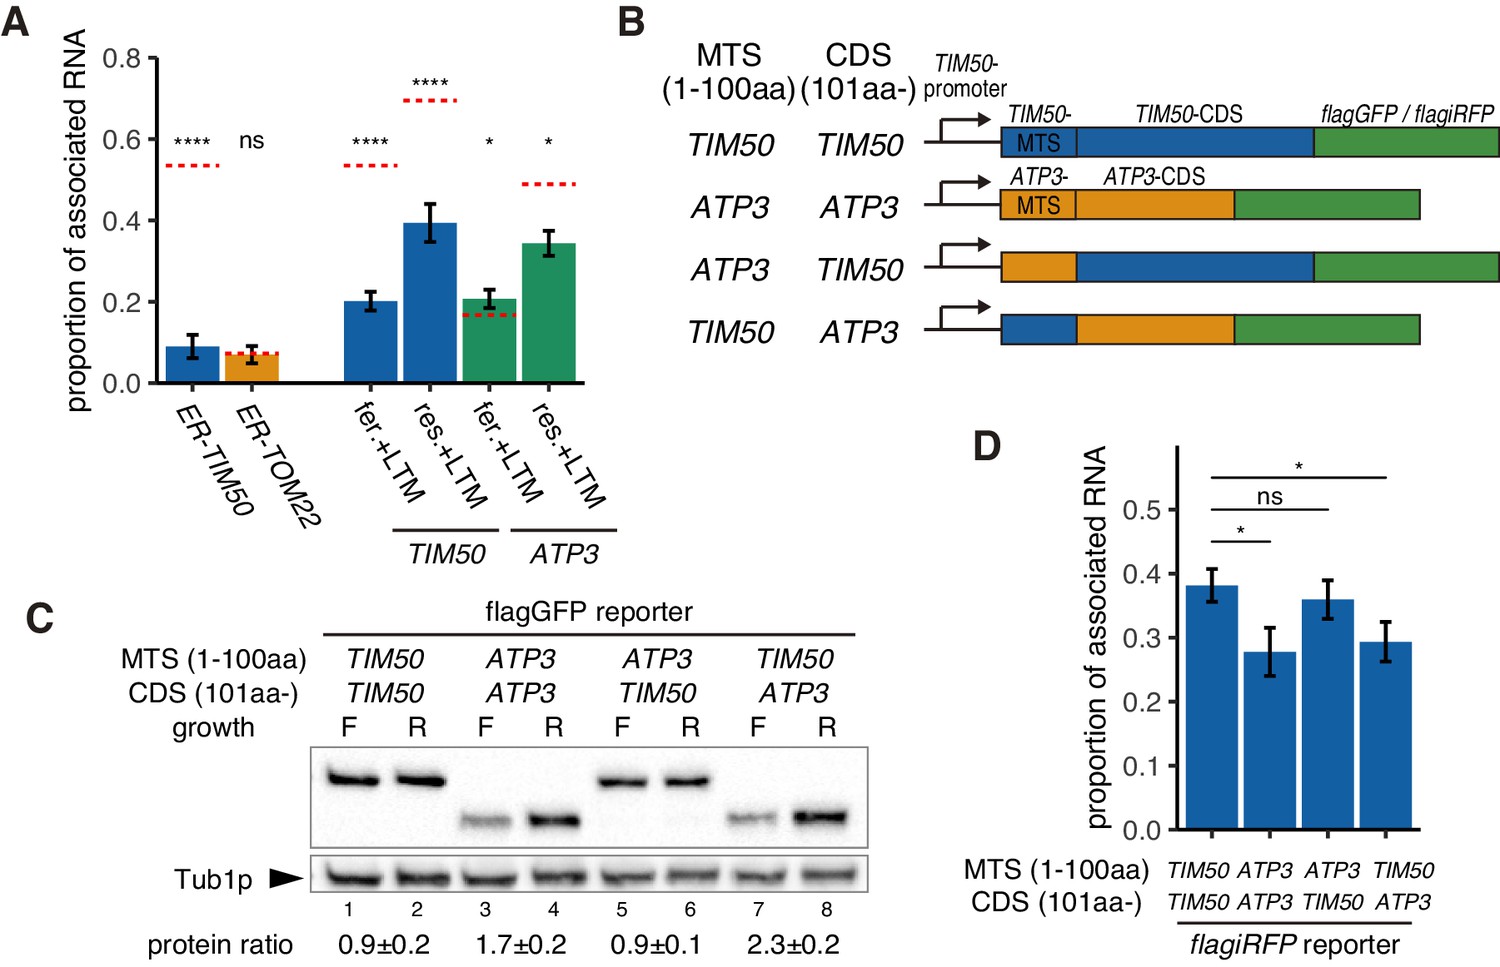
Increased protein synthesis and mRNA localization is regulated by the downstream coding sequence.
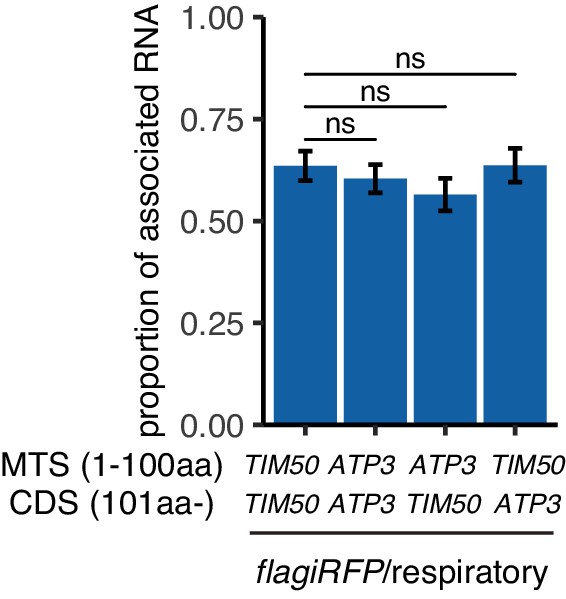
(A) An ER-localization signal and translation inhibitor drugs alter the proportion of mitochondrial associated mRNA per cell of the strains in Figure 1B (n > 20). LTM indicates 50 mM lactimidomycin for 20 min. Error bar represents s.e.m. Statistical significance compared with control (value in Figure 1B, red dotted line) was assessed by Mann–Whitney U-test (****p<0.0001; *p<0.05; ns, no significant difference). (B) Schematic of chimeric reporter genes for swapping of MTS (1-100aa) and CDS (101aa-) between TIM50 and ATP3. Chimeric genes were conjugated with either flagGFP or flagiRFP. (C) Protein expression from reporter genes with flagGFP depicted in (B). Growth ‘F’ represents fermentative and ‘R’ represents respiratory conditions. Tub1p was used as internal loading control. Protein expression ratio between respiratory and fermentative conditions is shown in the bottom row. Error indicates standard deviation of three independent experiments. (D) The proportion of mitochondrial associated mRNA per cell of reporter mRNAs with flagiRFP in fermentative conditions (n > 34). Error bar represents s.e.m. Statistical significance was assessed by Mann–Whitney U-test (*p<0.05; ns, no significant difference).
Figure 3—figure supplement 1
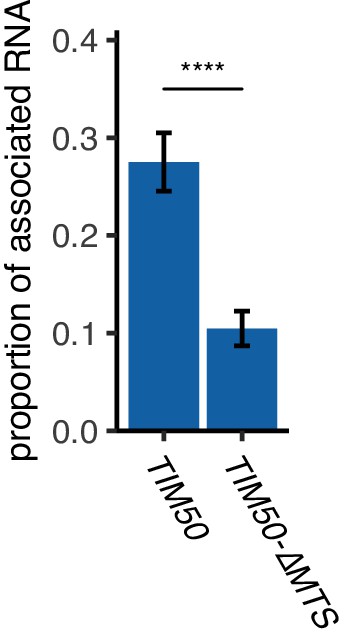
Mitochondrial targeting signal is required for TIM50 mRNA localization to mitochondria.
Deletion of MTS from TIM50 decreases mRNA association with mitochondria. The proportion of mitochondrial associated mRNA per cell (n > 30) of the TIM50-MS2tag and TIM50-∆MTS-MS2tag reporter mRNAs in fermentative condition. Error bar represents standard error of the mean (s.e.m.).
Figure 3—figure supplement 2
The reporter mRNAs show similar association with mitochondria in respiratory conditions.
The proportion of mitochondrial associated mRNA per cell of reporter mRNAs with flagiRFP in respiratory conditions (n > 30). Error bar represents s.e.m. Statistical significance was assessed by Mann–Whitney U-test (ns, no significant difference).
Figure 4 with 1 supplement
Decreased translational elongation localizes mRNA to mitochondria.
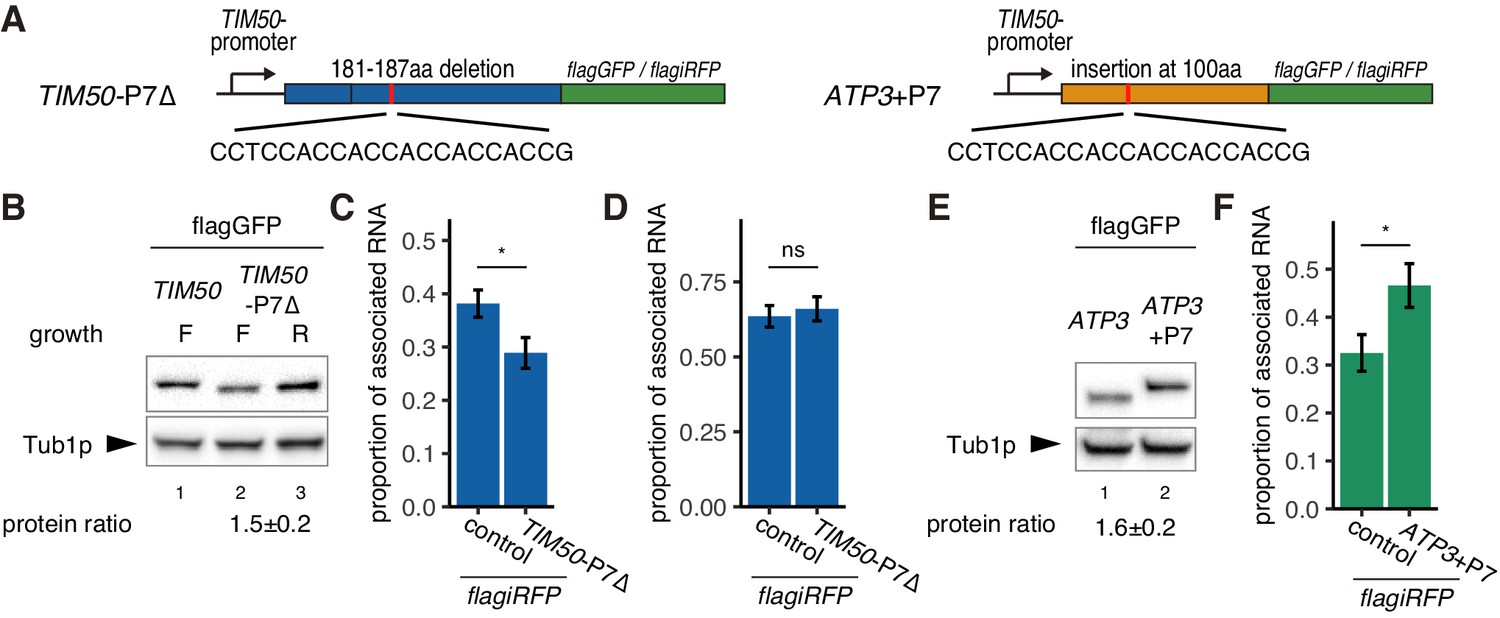
(A) Schematic of deletion of polyproline sequence from TIM50-flagGFP/flagiRFP reporter gene and insertion of polyproline sequence into ATP3- flagGFP/flagiRFP reporter gene. These constructs are called TIM50-P7∆ and ATP3+P7. (B) Protein expression from reporter genes TIM50-flagGFP and TIM50-P7∆-flagGFP. Growth ‘F’ and ‘R’ correspond to fermentative and respiratory conditions, respectively. Tub1p was used as internal loading control. Protein expression ratio between respiratory and fermentative conditions is shown in the bottom row. Error indicates standard deviation of three independent experiments. (C, D) The proportion of the mitochondrial associated mRNA per cell (n > 20) of the reporter mRNAs TIM50-flagiRFP and TIM50-P7∆-flagiRFP in fermentative (C) and respiratory (D) conditions. (E) Protein expression from reporter genes ATP3-flagGFP and ATP3+P7-flagGFP in respiratory condition. Tub1p was used as internal loading control. Protein expression ratio between the reporter genes is shown in the bottom row. Error indicates standard deviation of three independent experiments. (F) The proportion of mitochondrial associated mRNA per cell (n > 29) of the reporter mRNAs ATP3-flagiRFP and ATP3+P7∆-flagiRFP in fermentative conditions.
Figure 4—figure supplement 1
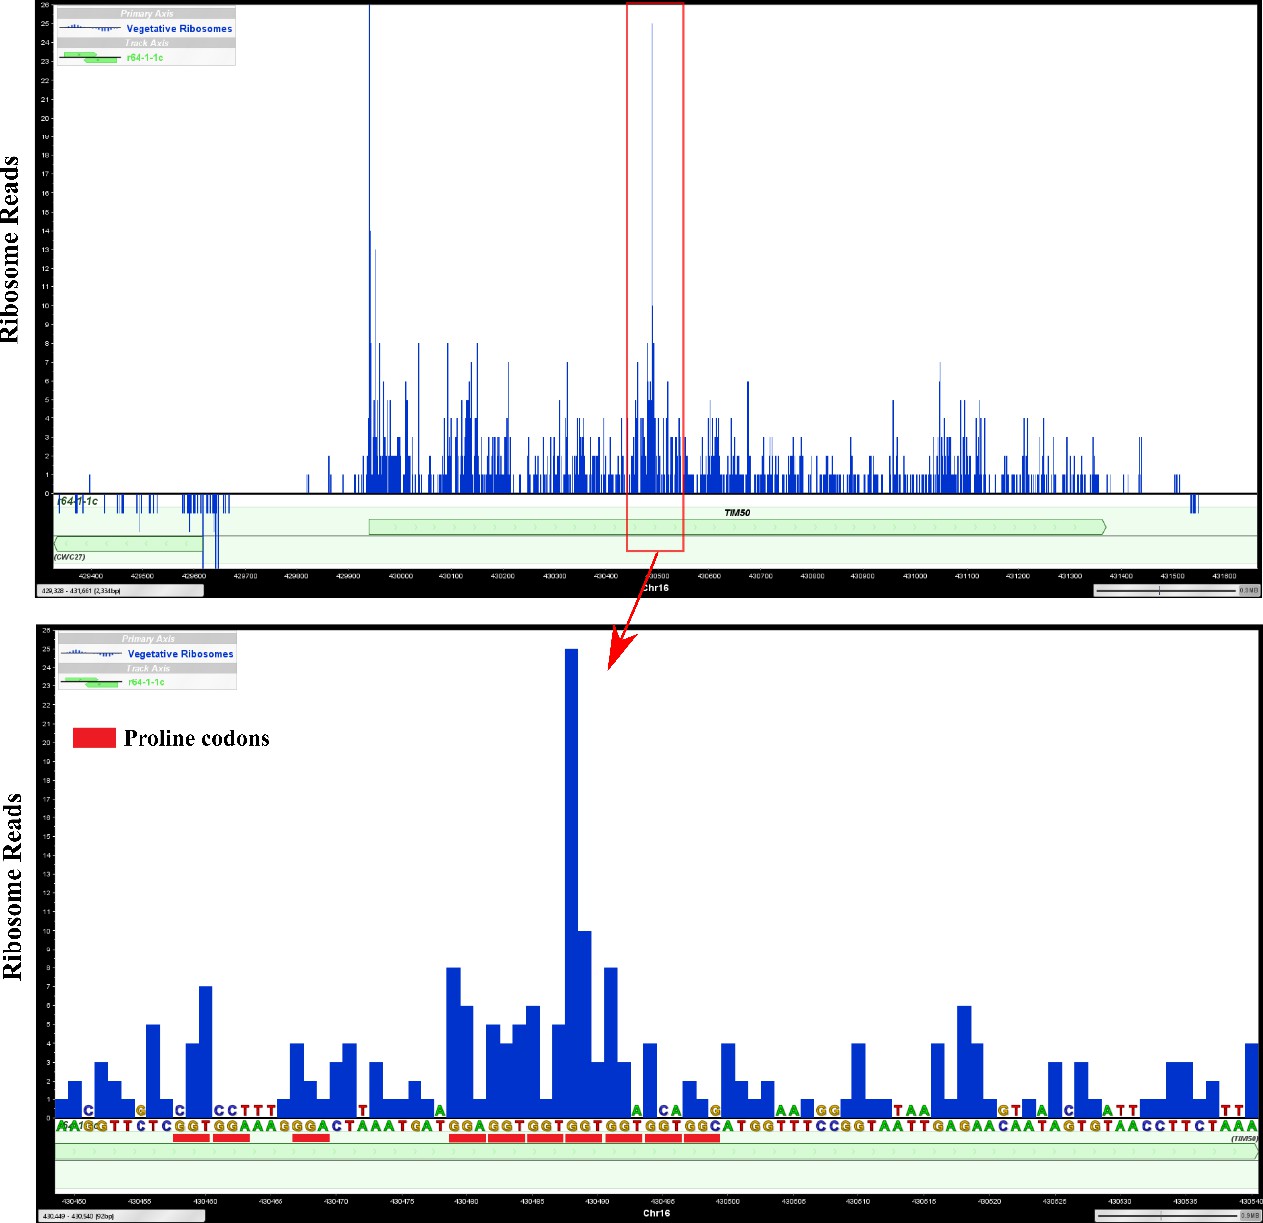
Ribosomes are enriched at a polyproline sequence of TIM50 mRNA in a previously generated ribosome profiling dataset.
Proline codons were highlighted with red lines below TIM50 DNA sequences. A site position of ribosome-covered fragments from a previous ribosome profiling dataset (Zid and O’Shea, 2014) are shown as ribosome reads.
Figure 5 with 2 supplements
Decreased translational elongation localizes mRNA to mitochondria.
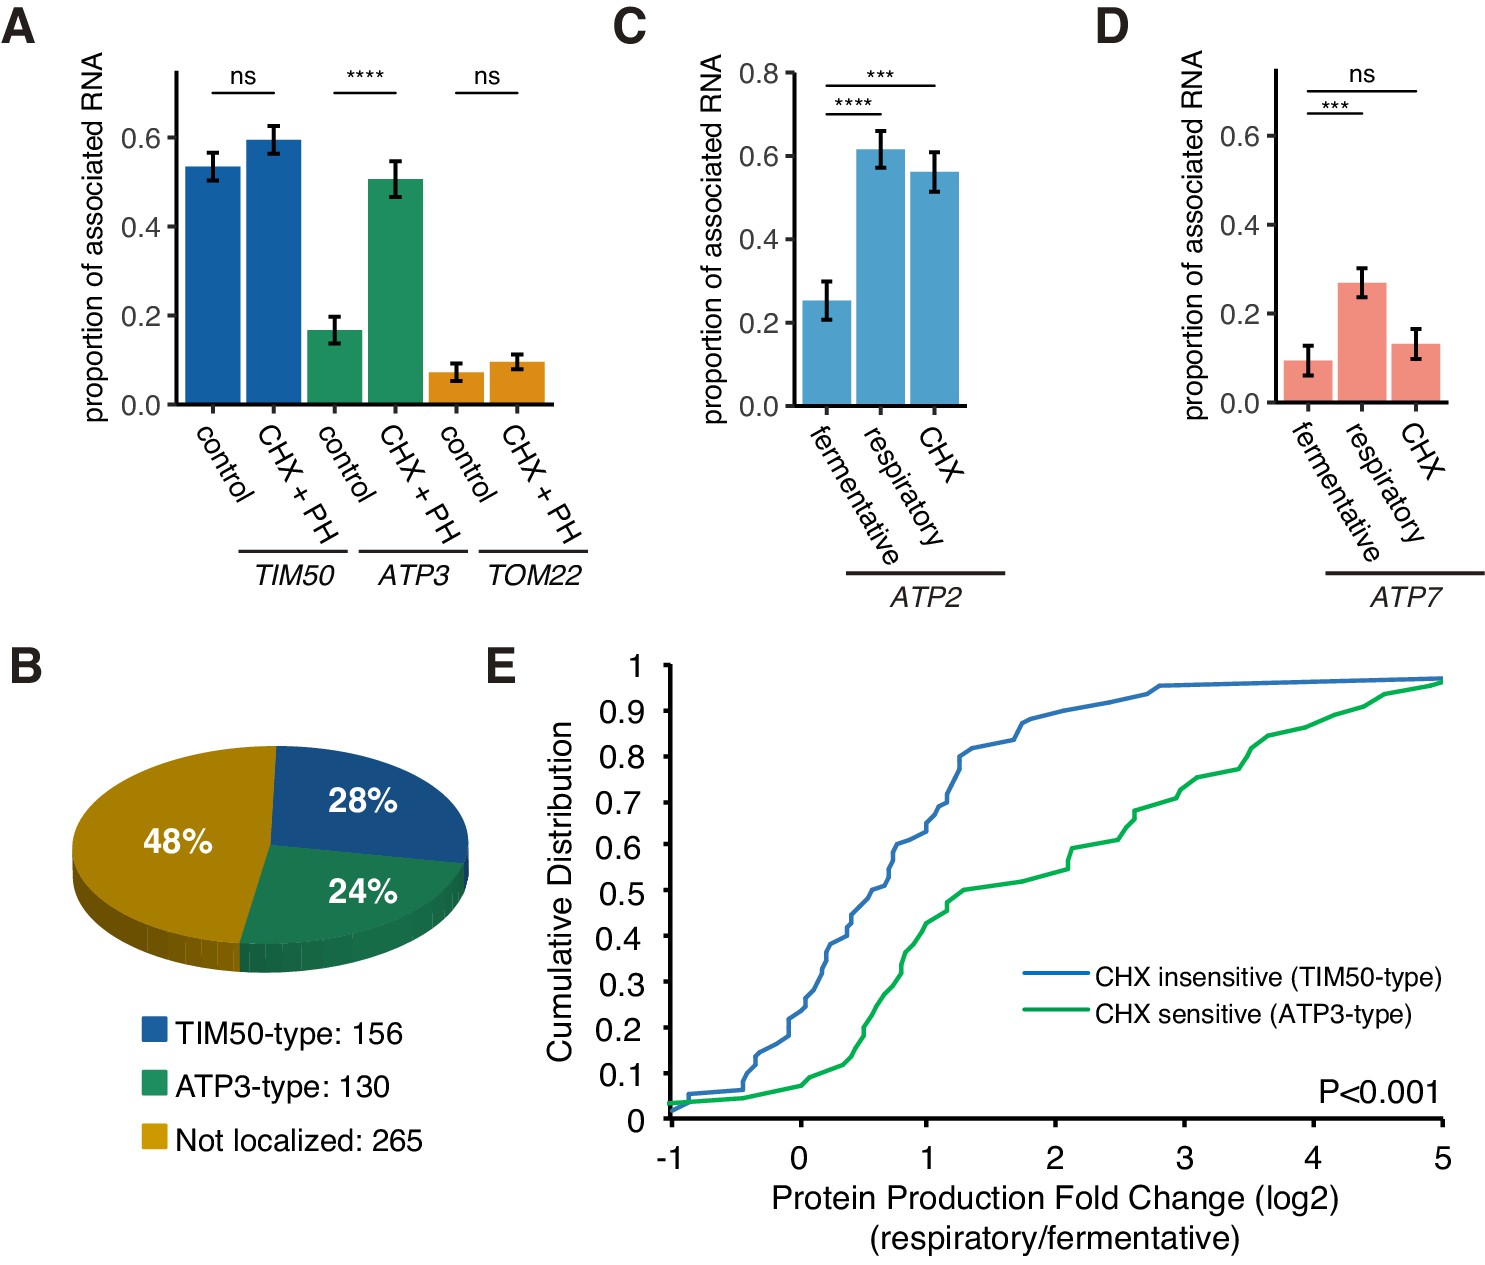
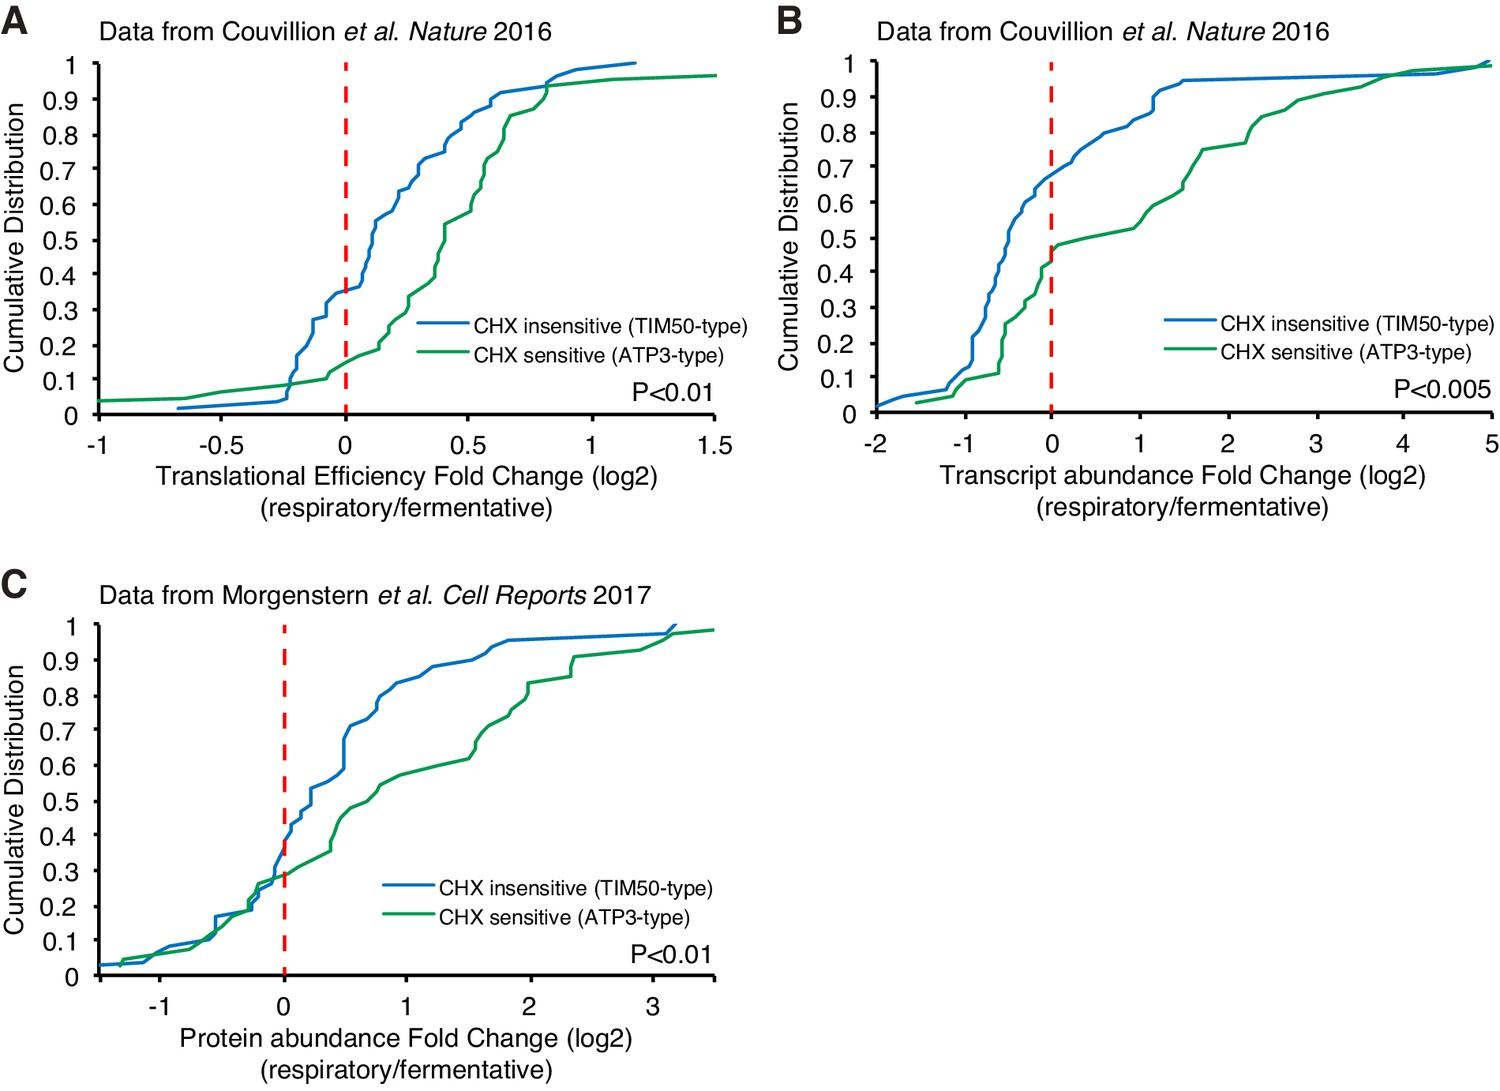
(A) Translational inhibitor drugs alter the proportion of mitochondrial-associated mRNA per cell (n > 43) of the strains in Figure 1C. CHX+PH indicates 100 µg/mL cycloheximide and 200 µg/mL 1,10-Phenanthroline for 10 min in fermentative condition. Error bar represents s.e.m. (B) Percent distribution of TIM50 and ATP3 mRNA mitochondrial localization behavior in annotated mitochondria protein encoding genes. We re-summarized and classified TIM50-type mRNA as enriched at the mitochondria regardless of CHX addition and ATP3-type mRNA as enriched at the mitochondria only upon CHX addition using proximity ribosome profiling data of annotated mitochondria protein encoding genes (Mitop2) (Elstner et al., 2009; Williams et al., 2014). All other mRNAs were considered not localized. (C)-(D) The proportion of the mitochondrial associated mRNA per cell (n > 16) of MS2-tagged endogenous ATP2 and ATP7 mRNAs in fermentative, respiratory, and CHX-treated for 10 min in fermentative conditions. Error bar represents s.e.m. Statistical significance in this figure was assessed by Mann–Whitney U-test (****p<0.0001; ***p<0.001; **p<0.01; *p<0.05; ns, no significant difference). (E) Protein production is increased upon a switch from fermentative to respiratory conditions in ATP3-type genes. Cumulative distribution of protein production (ribosome reads) (Couvillion et al., 2016) of TIM50-type (n = 60) and ATP3-type genes (n = 44) were depicted with blue and green lines, respectively. Statistical significance in this figure was assessed by Student’s t-test. Source data of ribosome profiling used for the analysis are summarized in the Source data 1.
-
Figure 5—source data 1
Summary of transcriptomics and proteomics from previously published data.
Mitochondrial enrichment of mRNA with and without addition of cycloheximide (Williams et al., 2014), MLR Classification (Saint-Georges et al., 2008), translational efficiency and transcript abundance from previous ribosome profiling dataset (Couvillion et al., 2016), and protein abundance from previous mass spectrometry dataset (Morgenstern et al., 2017) were summarized in the Table.
- https://cdn.elifesciences.org/articles/57814/elife-57814-fig5-data1-v1.xlsx
Figure 5—figure supplement 1

Mitochondrial volume fraction correlates with ATP2 mRNA localization.
Relationship between the mitochondrial volume fraction and the proportion of ATP2 mRNA (pink) localization to mitochondria with TIM50, ATP3, and TOM22 mRNA, which are copied from Figure 2B. Trend line was depicted according to the best linear fit of the proportion of localization and mitochondrial volume fraction of single cells in each condition of different mRNAs (n > 15). Gray regions surrounding the trend lines represent the 95 confidence interval (CI) for each line.
Figure 5—figure supplement 2
Respiration induced increased protein production.
(A, B) Translational efficiency (A) and transcript abundance (B) increase upon a switch from fermentative to respiratory conditions for ATP3-type genes. Cumulative distribution of translational efficiency and transcript abundance from previous ribosome profiling dataset (Couvillion et al., 2016) of TIM50-type and ATP3-type genes are depicted with blue and green lines, respectively. (C) Protein abundance increases upon switch from fermentative to respiratory conditions in ATP3-type genes. Cumulative distribution of protein abundance from previous mass spectrometry dataset (Morgenstern et al., 2017) of TIM50-type and ATP3-type genes are depicted with blue and green lines, respectively. Statistical significance in this figure was assessed by Student’s t-test. Source data of transcriptomics and proteomics used for the analysis were summarized in the Source data 1.
Figure 6 with 3 supplements
mRNA localization to mitochondria enhances its translation.
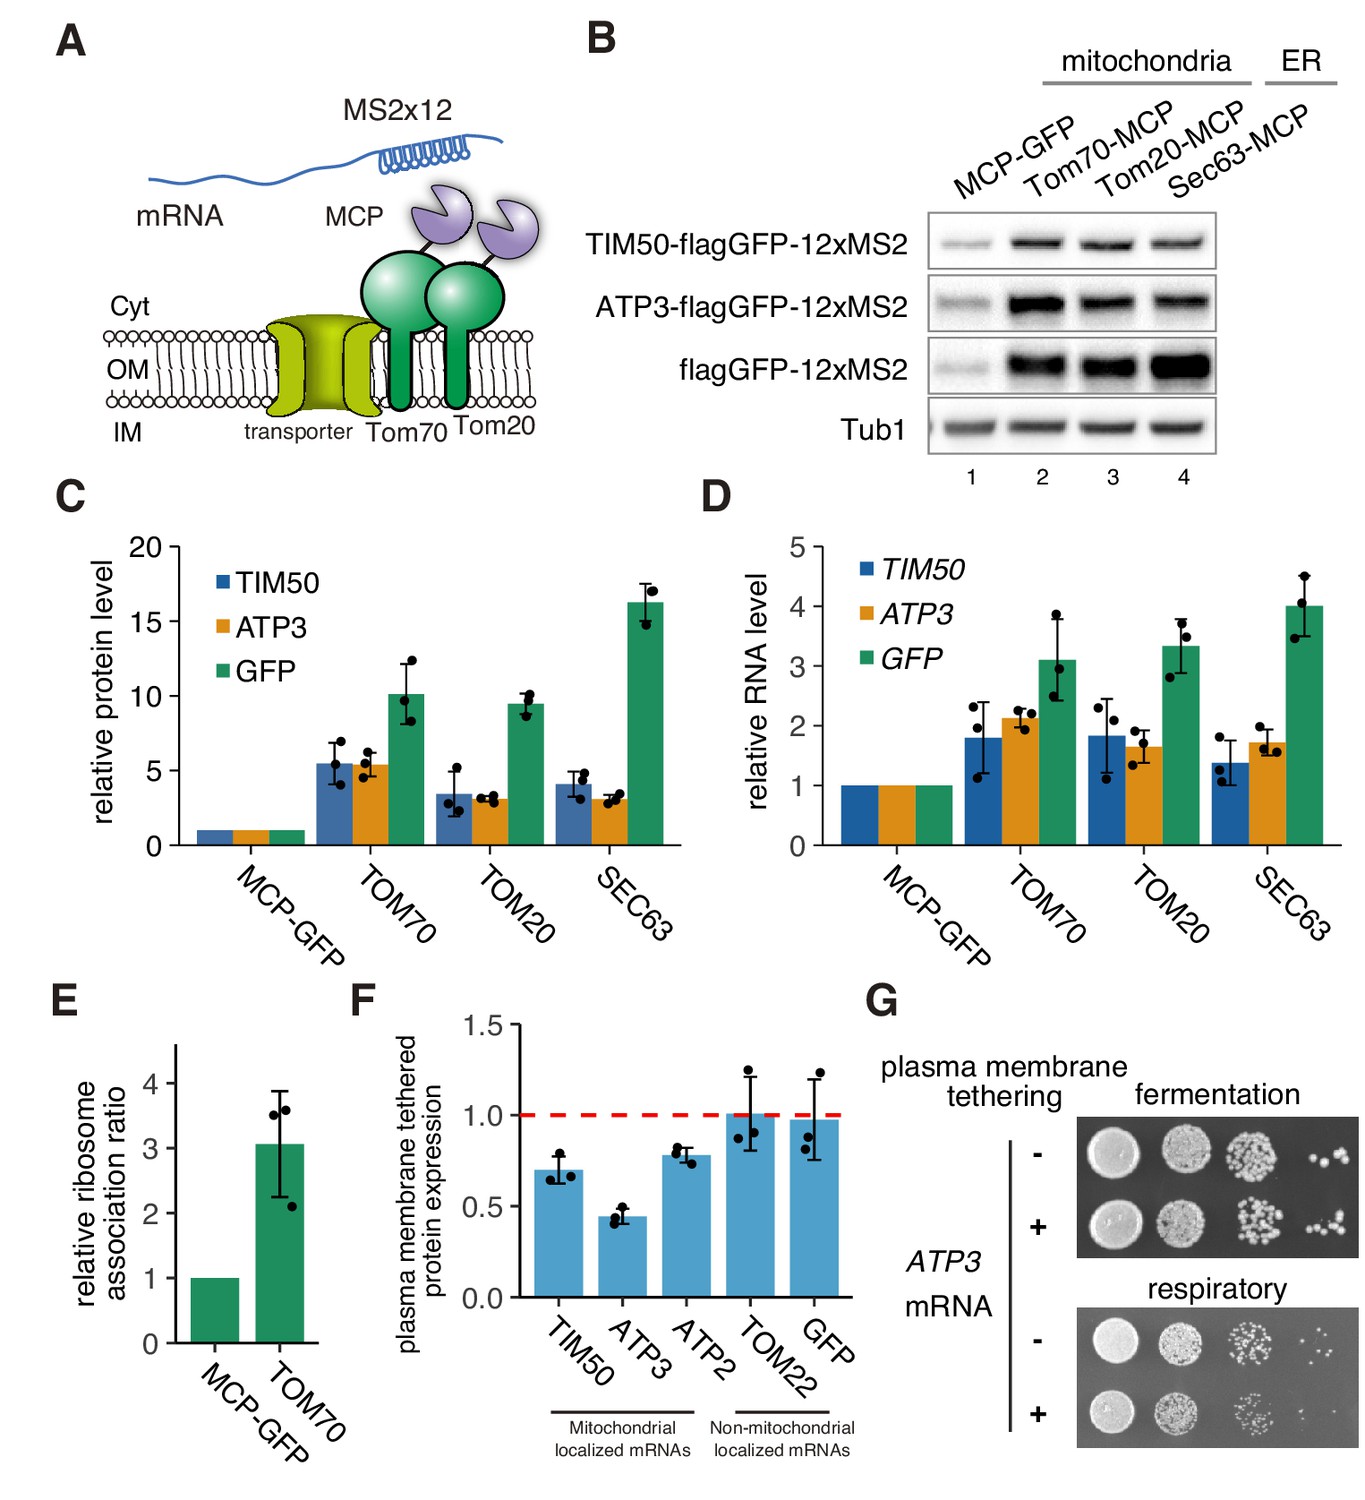
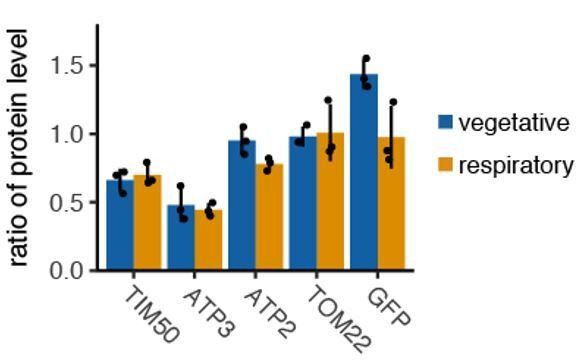
(A) Schematic of artificial mRNA tethering to mitochondria using MS2-MCP system. mRNAs harboring a MS2 tandem sequence were tethered to mitochondria through C-terminus MCP tagged Tom70p or Tom20p. (B) Protein expression analysis of reporter mRNAs, which are tethered to mitochondria (lanes 2, 3) or ER (lane 4). Protein expression was analyzed using an anti-GFP antibody. Tub1p in the strain harboring flagGFP-12xMS2 reporter genes was used as an internal control. (C) Quantification of (B). Protein expression was normalized to the No-MCP strains. (D) Expression level of reporter mRNAs tethered to mitochondria or ER. mRNA expression was analyzed with RT-qPCR using primers for flagGFP. (E) Relative ribosome association rate of flagGFP-12xMS2 expressed with MCP-GFP or TOM70-MCP was calculated by comparison between RNA levels from ribosome-bound and free fractions from sucrose gradient polysome fractionation. RNA levels were quantified via qPCR. (F) Protein expression analysis in anchored-away conditions. Protein expression levels in each strain in respiratory conditions were determined by western blotting using anti-flag antibody. Protein expression ratio between strains with and without CaaX is shown as a bar graph. (C)-(F), Each dot represents an independent experiment. Error bar represents standard deviation of three independent experiments. (G) Growth assay for plasma membrane localized mRNA, which consists of an integrated MS2 sequence into the 3’-UTR of genomic DNA. TIM50 and ATP3 mRNAs were anchored away to the plasma membrane using CaaX-tag harbored MCP-GFP proteins. Cell growth was tested on YPAD (fermentative) and YPAGE (respiratory) conditions at 30°C for 2 days and 3 days, respectively.
Figure 6—figure supplement 1
Protein and mRNA expression levels of artificially tethered reporter mRNAs.
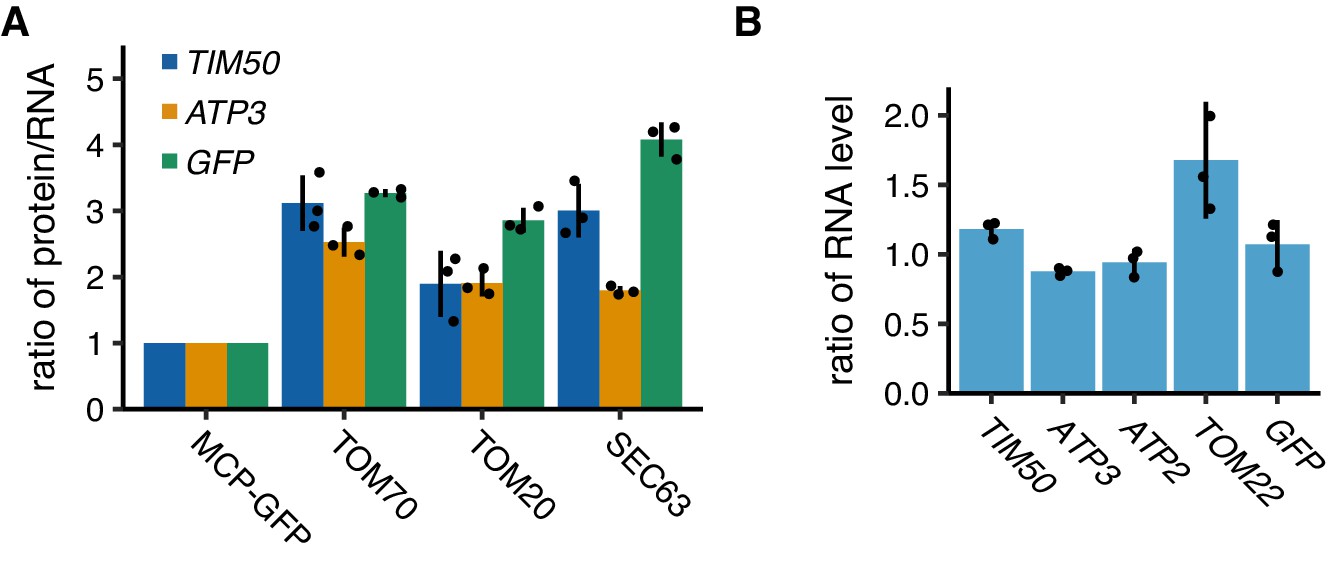
(A) Ratio of protein versus mRNA expression level of reporter mRNAs tethered to mitochondria (TOM70 and TOM20) or ER (SEC63) in Figure 6B–D. (B) Expression level of reporter mRNAs tethered to plasma membrane. mRNA expression was analyzed using RT-qPCR for flagGFP. (A, B) Each dot represents an independent experiment. Error indicates standard deviation of three independent experiments.
Figure 6—figure supplement 2
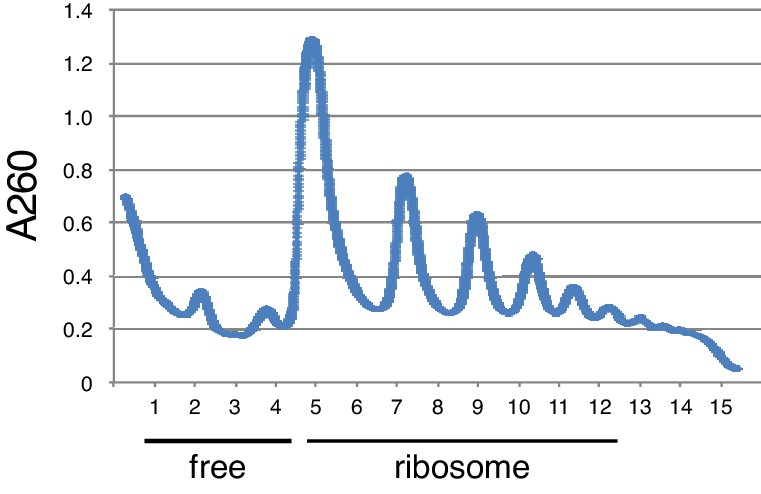
Ribosome-free and ribosome-bound fraction from Polysome analysis.
Ribosome-free and ribosome-bound fraction (monosome – polysome) was combined to analyse fractionated RNA level by RT-qPCR.
Figure 6—figure supplement 3
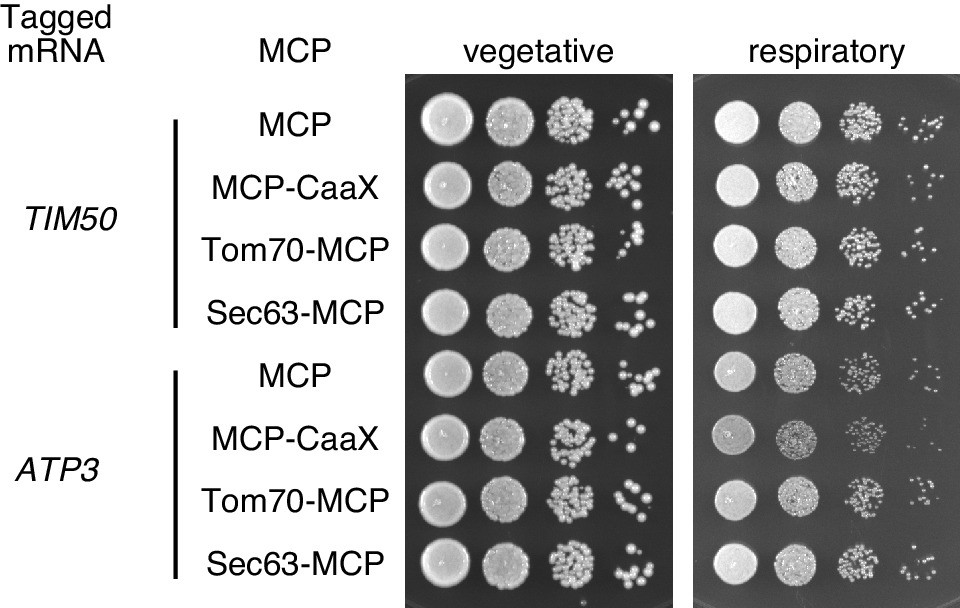
Growth assay for strains with mRNA tethered to either mitochondria, ER, or plasma membrane.
TIM50 and ATP3 mRNAs were localized to the plasma membrane using CaaX-tag harbored MCP-GFP proteins, to mitochondria by tethering to TOM70-MCP, or to ER by tethering to Sec63-MCP. The growth was tested on YPAD (fermentative) and YPAGE (respiratory) conditions at 30°C for two days and three days, respectively. We took stationary phase cells and made 10x serial dilutions of them before plating.
Figure 7
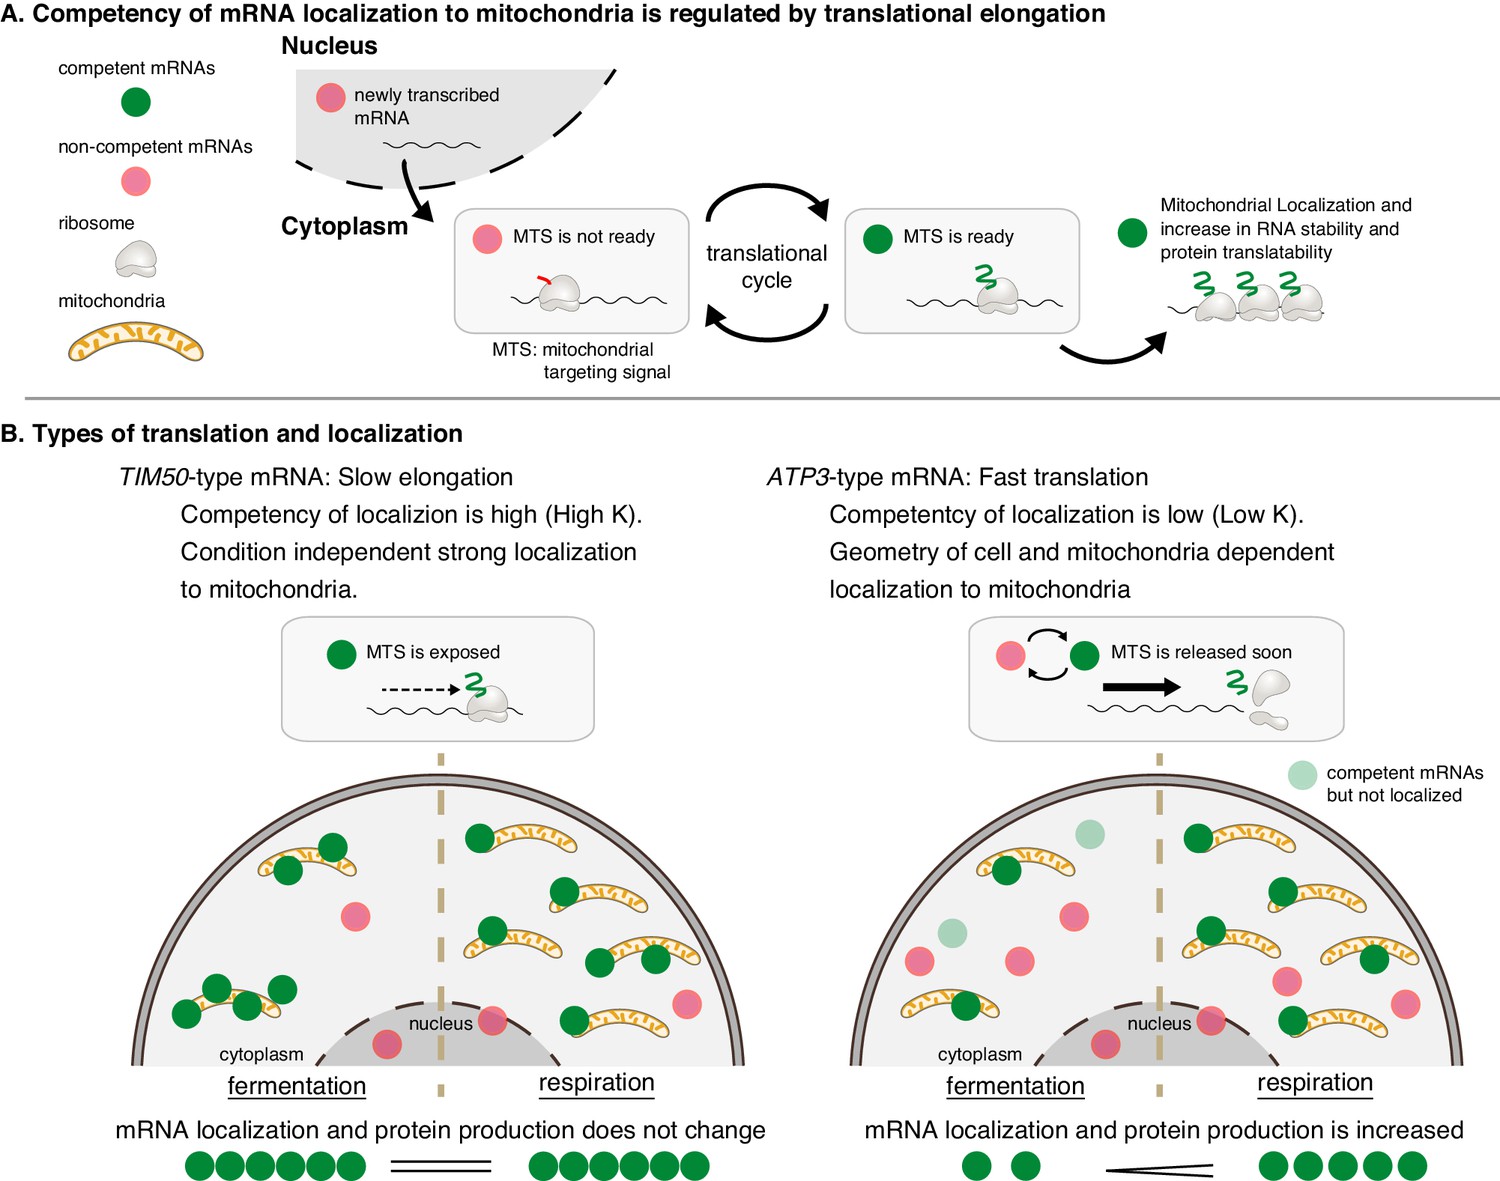
Mitochondrial volume fraction controls protein synthesis of nuclear-encoded mitochondrial proteins.
(A) Competency of mRNA localization to mitochondria is regulated by translational elongation. After the MTS is translated and exposed from the ribosome the mRNA becomes competent for localization to the mitochondria for as long as the mRNA is associated with the nascent chain. Slow elongation will extend the time an mRNA is competent. Mitochondrially localized mRNAs experience an increase in RNA stability and protein translatability. (B) Mitochondria can coordinate gene expression during times of metabolic need via mitochondrial-volume-fraction-based control and simple chemical kinetics of nuclear-encoded mRNA localization. TIM50-type: mRNAs with high affinity to mitochondria are always associated with mitochondria and thus not much affected by geometrical features. ATP3-type: mRNAs with low affinity for mitochondria localization are greatly affected by geometrical features of cells, that is mitochondrial volume fraction. Fast translation elongation leads to quick release of the mRNA/nascent chain complex, and results in a quick return to a non-competent state. When mitochondrial volume fraction is high in respiratory conditions, mRNA localization to mitochondria is increased, and protein synthesis is induced by its localization.
Author response image 1
Tethering to plasmamembrane reduce protein production in vegetative and fermentative condition.
N=3.
Videos
Video 1
Z-projection of live imaging of mRNA and mitochondria in cycloheximide and 1,10-phenanthroline treated cells.
TIM50 and TOM22 mRNA were visualized 10 minuetes after the addition of cycloheximide and 1,10-phenanthroline in fermentative condition. (Left) TIM50 mRNA (Right) TOM22 mRNA. Cyan: mRNA, magenta: matrix.
Video 2
Z-projection of live imaging of mRNA and mitochondria in fermentative condition.
TIM50, ATP3 and TOM22 mRNA were visualized in fermentative condition. (Top) TIM50 mRNA (Middle) ATP3 mRNA (Bottom) TOM22 mRNA. Cyan: mRNA, magenta: matrix.
Tables
Table 1
mRNAs of conserved ATP synthetase components are localized to mitochondria in respiratory and CHX conditions.
ATP complex gene conservation was obtained from published annotation (Rühle and Leister, 2015) and we obtained data of CHX-dependent mitochondrial localization from proximity ribosomal profiling data (Williams et al., 2014). The CHX-dependent localization data were consistent with our study. Respiratory-specific localization was determined in this study.
| Complex | Subunit | Gene | Mitochondrial localization | Respiratory specific localization | ||
|---|---|---|---|---|---|---|
| -CHX | +CHX | |||||
| Conserved from bacteria to eukaryote | F1 | α | ATP1 | no | yes | yes |
| β | ATP2 | no | yes | yes | ||
| γ | ATP3 | no | yes | yes | ||
| OSCP/δ | ATP5 | no | yes | NA | ||
| ε | ATP16 | no | no | NA | ||
| F0 | b | ATP4 | no | yes | NA | |
| non-conserved | all the others | no | no | NA (ATP7: no) | ||
| Rühle and Leister, 2015 | Williams et al., 2014 | This study | ||||
Additional files
-
Supplementary file 1
Yeast strains and plasmids used in this study.
- https://cdn.elifesciences.org/articles/57814/elife-57814-supp1-v1.docx
-
Supplementary file 2
List of oligonucleotides used for plasmid construction.
- https://cdn.elifesciences.org/articles/57814/elife-57814-supp2-v1.docx
-
Transparent reporting form
- https://cdn.elifesciences.org/articles/57814/elife-57814-transrepform-v1.docx
Download links
A two-part list of links to download the article, or parts of the article, in various formats.
Downloads (link to download the article as PDF)
Open citations (links to open the citations from this article in various online reference manager services)
Cite this article (links to download the citations from this article in formats compatible with various reference manager tools)
Mitochondrial volume fraction and translation duration impact mitochondrial mRNA localization and protein synthesis
eLife 9:e57814.
https://doi.org/10.7554/eLife.57814


