Functional interrogation of HOXA9 regulome in MLLr leukemia via reporter-based CRISPR/Cas9 screen
- Division of Hematology/Oncology, University of Alabama at Birmingham, United States
- O’Neal Comprehensive Cancer Center, University of Alabama at Birmingham, United States
- Department of Tumor Cell Biology, St. Jude Children’s Research Hospital, United States
- Cancer Biology Program/Comprehensive Cancer Center, St. Jude Children’s Research Hospital, United States
- Department of Pharmaceutical Sciences, St. Jude Children’s Research Hospital, United States
- Department of Computational Biology, St. Jude Children’s Research Hospital, United States
- Department of Chemical Biology and Therapeutics, St. Jude Children's Research Hospital, United States
- Department of Biomedical Engineering School of Engineering, University of Alabama at Birmingham, United States
Figures
Figure 1 with 2 supplements
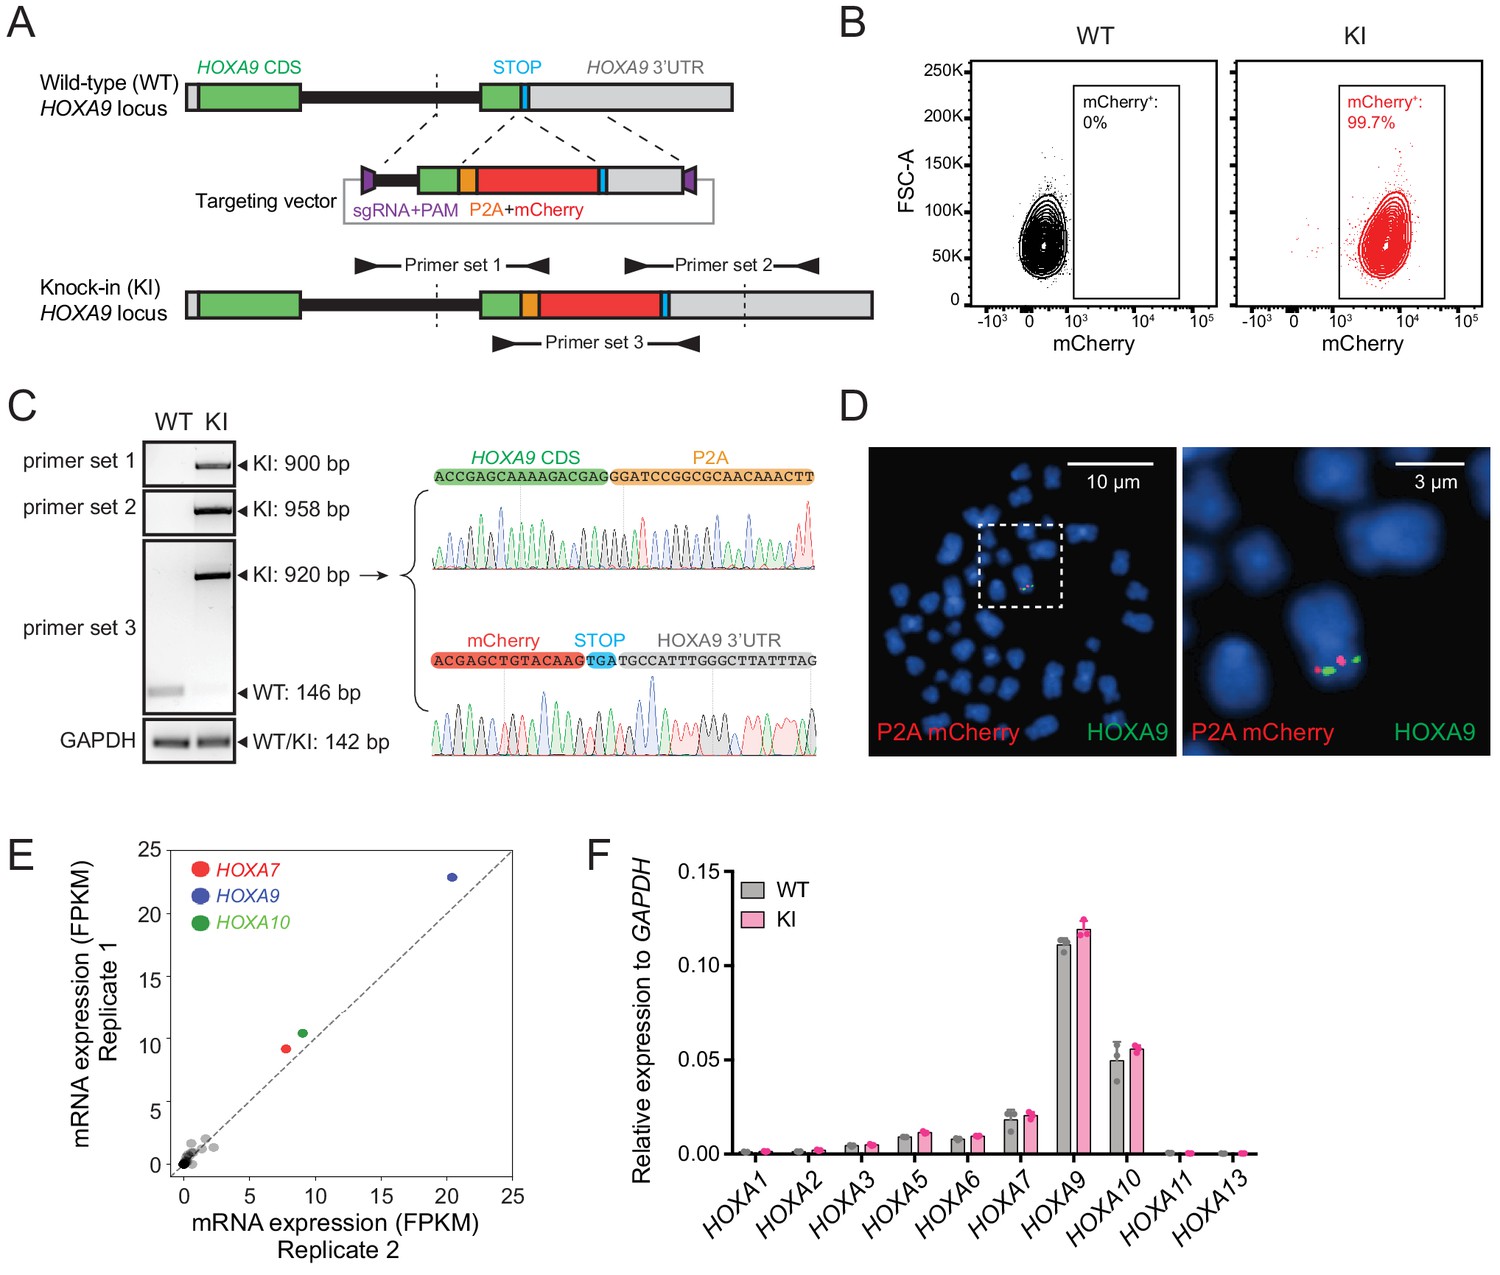
Establishment and characterization of the HOXA9P2A-mCherry reporter human MLLr leukemia cell line.
(A) Schematic diagram of the knock-in design and genotyping PCR primer design for the HOXA9P2A-mCherry reporter allele. (B) Flow cytometry analysis of HOXA9P2A-mCherry reporter cells. Wild-type SEM cells were used as negative controls. (C) Genotyping PCR products from the 5′ and 3′ knock-in boundaries were sequenced to verify the seamless knock-in of the mCherry reporter gene to the endogenous locus. (D) Fluorescence in situ hybridization of the P2A-mCherry knock-in cassette in HOXA9P2A-mCherry reporter cells. The P2A-mCherry DNA was labeled with a red-dUTP by nick translation, and a HOXA9 BAC clone was labeled with a green-dUTP. The cells were then stained with 4,6-diamidino-2-phenylindole (DAPI) to visualize the nuclei. A representative metaphase cell image is shown for the pattern of hybridization (pairing of red and green signals). (E) RNA-seq data of all HOXA cluster genes were illustrated as log2 (normalized numbers of FPKM) from two replicate samples of SEM cells. HOXA7, HOXA9, and HOXA10 were highlighted by color code. (F) Q-PCR analysis confirmed the unaffected HOXA cluster gene transcription between HOXA9P2A-mCherry reporter (KI) and WT SEM cells. Data shown are means ± SEM from replicate independent experiments. *p<0.05 of two-tailed Student’s t test.
Figure 1—figure supplement 1
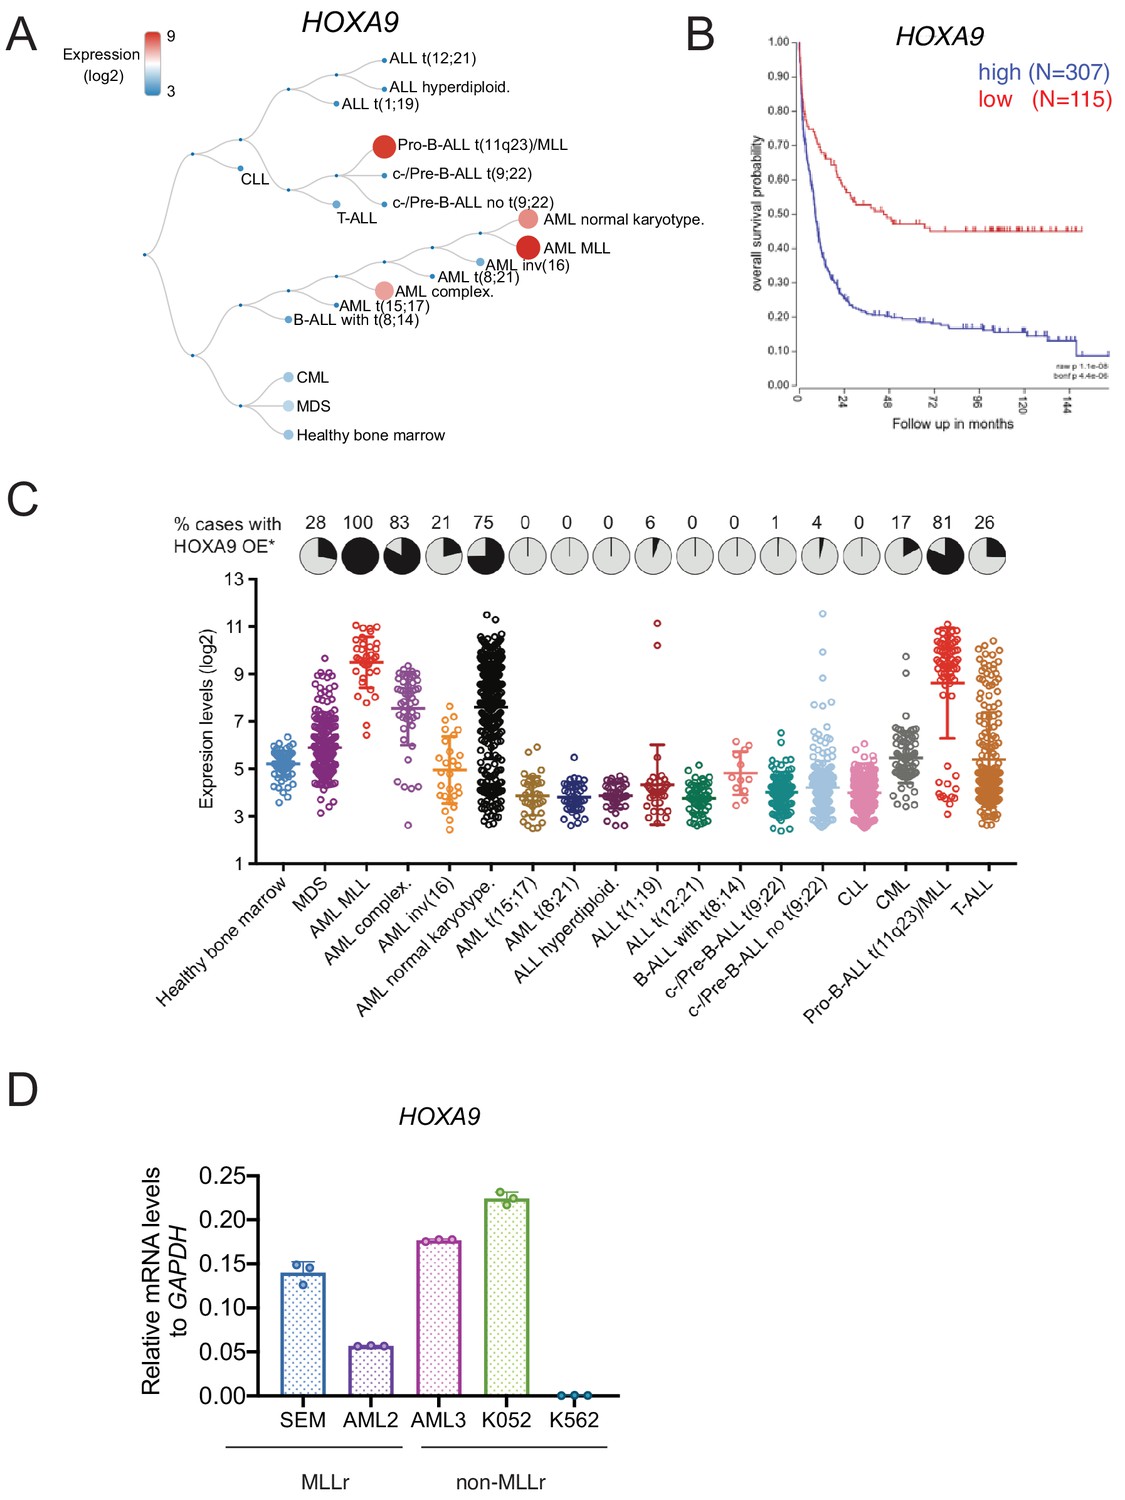
HOXA9 expression profiling in leukemia.
(A) HOXA9 expression in different leukemia lineages (GSE13159). (B) Kaplan-Meier survival curve indicated the poor outcome associated with high HOXA9 expression (GSE13159). (C) HOXA9 expression was revealed by leukemia subtypes in MILE leukemia study cohort (bloodspot). (D) HOXA9 mRNA level was assessed by Q-PCR in MLLr and non-MLLr leukemia cell lines.
Figure 1—figure supplement 2

Cytogenetic characterization HOXA9 knock-in allele in MLLr SEM and OCI-AML2 cells.
(A) The genomic HOXA9 location was highlighted in human chromosome 7. (B) Karyotype analysis of parental MLLr SEM cells indicating the mono-allelic deletion of partial segment in chromosome 7 containing the HOXA cluster (red arrow). Black arrows indicated other chromosome alterations including t4,11 translocation and trisomy 8. (C) Chromosome analysis of spectral karyotyping (SKY) was conducted by using a commercially prepared SKY probe from Applied Spectral Imaging (Carlsbad, CA) on HOXA9 reporter cells. Translocation between chr4 and chr11, trisomy eight and micro-deletion of chr7 was confirmed. (D) FISH analysis confirming the co-localization of HOXA9 and mCherry in targeted SEM cells at interphase (left) and metaphase (right). The P2A-mCherry DNA was labeled with a red-dUTP by nick translation, and an HOXA9 BAC clone was labeled with a green-dUTP. The cells were then stained with 4,6-diamidino-2-phenylindole (DAPI) to visualize the nuclei. A representative cell image is shown for the pattern of hybridization (pairing of red and green signals). SEM has one copy of the HOXA cluster. (E) FISH analysis confirming the co-localization of HOXA9 and mCherry in targeted OCI-AML2 cells at interphase (left) and metaphase (right). The P2A-mCherry DNA was labeled with a red-dUTP by nick translation, and an HOXA9 BAC clone was labeled with a green-dUTP. The cells were then stained with 4,6-diamidino-2-phenylindole (DAPI) to visualize the nuclei. A representative cell image is shown for the pattern of hybridization (pairing of red and green signals). OCI-AML2 has two copies of the HOXA cluster.
Figure 2 with 1 supplement
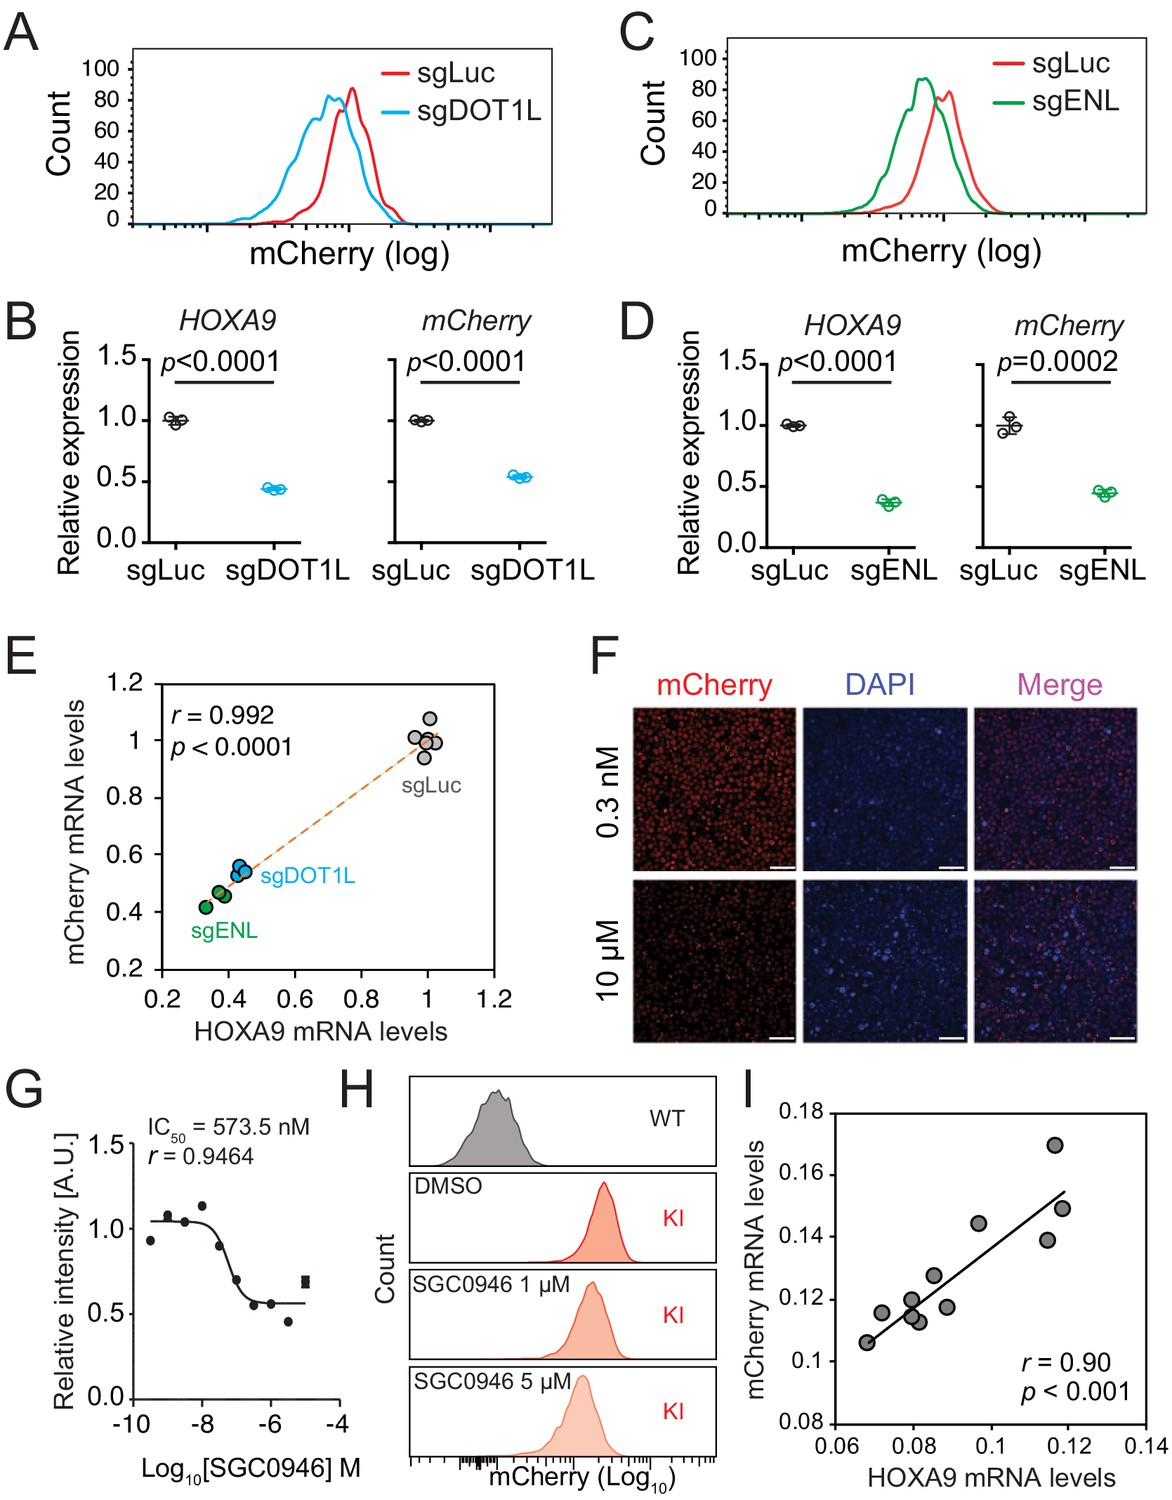
The HOXA9P2A-mCherry reporter allele recapitulates endogenous transcription of HOXA9 in MLLr SEM cells.
(A) Flow cytometry analysis of the HOXA9P2A-mCherry cells targeted with luciferase-sgRNA (sgLuc) and DOT1L-sgRNA (sgDOT1L). (B) Q-PCR analysis of the HOXA9P2A-mCherry cells targeted with sgLuc and sgDOT1L by using specific primers targeting the mRNA sequences of mCherry and HOXA9. Three biological replicates were performed. Data shown are means ± SEM from replicate independent experiments. The p-value was calculated by performing a two-tailed t-test. (C) Flow cytometry analysis of the HOXA9P2A-mCherry cells targeted with luciferase-sgRNA (sgLuc) and ENL-sgRNA (sgENL). (D) Q-PCR analysis of the HOXA9P2A-mCherry cells targeted with sgLuc and sgENL by using specific primers targeting the mRNA sequence of mCherry and HOXA9. Three biological replicates were performed. The p-value was calculated by performing a two-tailed t-test. (E) The correlation of transcription reduction in mCherry and HOXA9 in response to CRISPR–mediated targeting was calculated by Pearson’s correlation test. (F) Fluorescence imaging was performed on the HOXA9P2A-mCherry cells treated with various dosages of DOT1L inhibitor SGC0946 for six days. Representative images were shown for comparison between 0.3 nM and 10 µM dosages. For each dosage treatment, four replicates were conducted (scale bar 50 μm). (G) Fluorescence curve was generated according to mCherry intensity in response to dosage-dependent treatment of drug for 6 days. About 20,000 cells were split in each of the 384-well at the starting time point. (H) Flow cytometry analysis of the HOXA9P2A-mCherry cells treated with DMSO and various dosages of the DOT1L inhibitor SGC0946. (I) Q-PCR analysis of the HOXA9P2A-mCherry cells with or without the 6-day treatment of the DOT1L inhibitor SGC0946 by using specific primers targeting the mRNA sequences of mCherry and HOXA9. The correlation of transcription reduction in mCherry and HOXA9 in response to inhibitor–mediated transcription repression was calculated by performing Pearson’s correlation test.
Figure 2—figure supplement 1
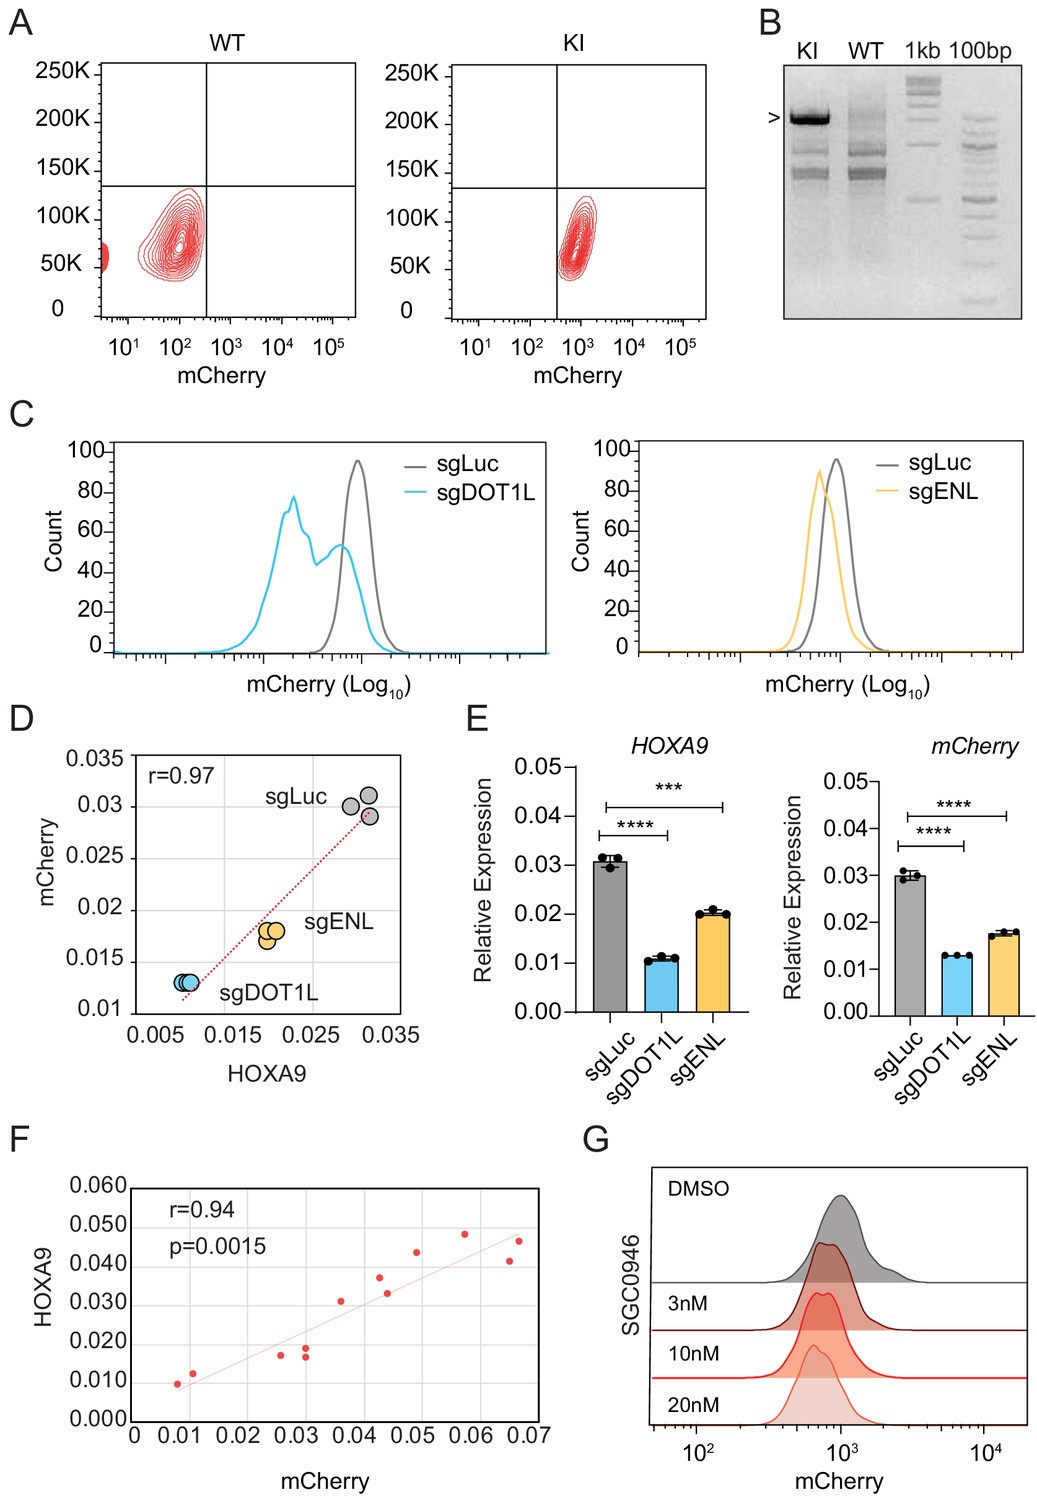
The HOXA9P2A-mCherry reporter allele recapitulates endogenous transcription of HOXA9 in MLLr OCI-AML2 cells.
(A) Flow cytometry analysis of the HOXA9P2A-mCherry cells compared with parental wildtype cells. (B) Genotyping PCR was conducted to confirm the successful knock-in. (C) Flow cytometry analysis of the HOXA9P2A-mCherry cells targeted with luciferase-sgRNA (sgLuc), DOT1L-sgRNA (sgDOT1L) and ENL-sgRNA (sgENL). (D) The correlation of transcription reduction in mCherry and HOXA9 in response to CRISPR–mediated targeting was calculated by Pearson’s correlation test. (E) Q-PCR analysis of the HOXA9P2A-mCherry cells targeted with sgLuc, sgDOT1L and sgENL by using specific primers targeting the mRNA sequences of mCherry and HOXA9. Three biological replicates were performed. Data shown are means ± SEM from replicate independent experiments. The p-value was calculated by performing a two-tailed t-test. (F) Flow cytometry analysis of the HOXA9P2A-mCherry cells treated with DMSO and various dosages of the DOT1L inhibitor SGC0946. (G) Fluorescence imaging was performed on the HOXA9P2A-mCherry cells treated with various dosages of DOT1L inhibitor SGC0946 for six days. Representative images were shown for comparison between 3, 10, and 20 nM dosages. For each dosage treatment, four replicates were conducted (scale bar 50 μm).
Figure 3 with 3 supplements
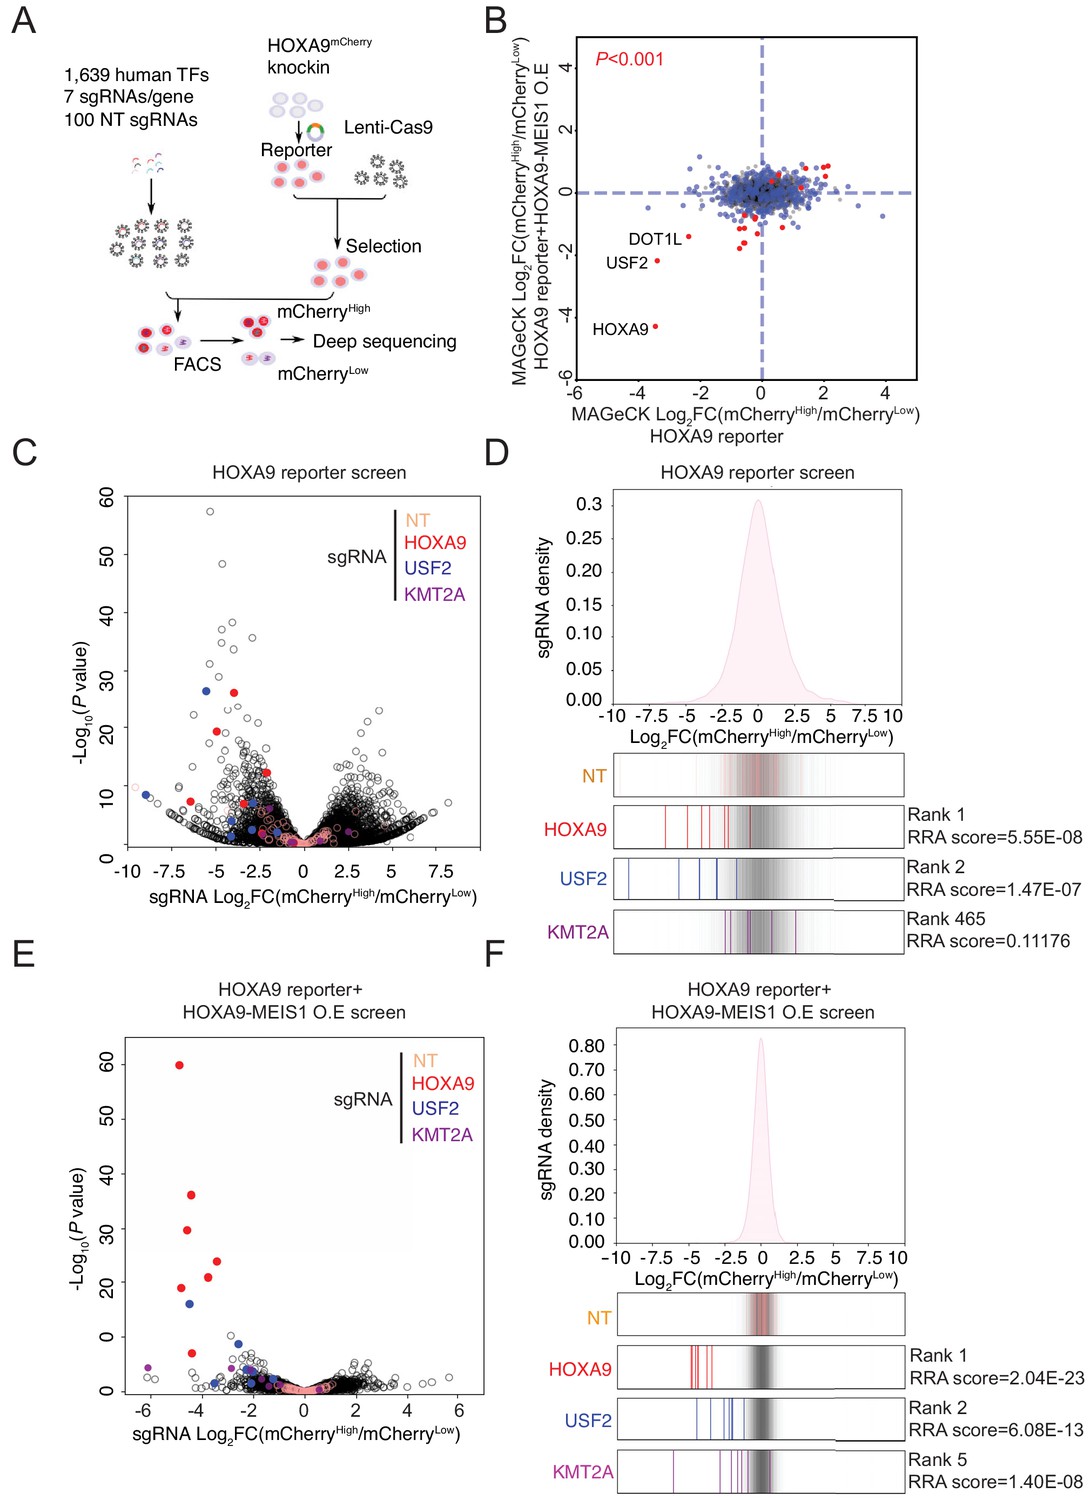
Pooled CRISPR/Cas9 screening identified a novel transcription factor, USF2, regulating HOXA9.
(A) Schematic diagram of a working model of loss-of-function CRISPR screening targeting 1639 human transcription factors. (B) The enrichment score of seven sgRNAs against each transcription factor was combined by the MAGeCK algorithm. Positive regulators of HOXA9 were compared between parental reporter strain and HOXA9-MEIS1 overexpressed screens. Overlapped top hits including HOXA9, USF2 and DOT1L were highlighted. (C) The overall distribution of all sgRNAs from the parental SEM HOXA9 reporter screening was shown based on the p-value and the DEseq2 score calculated by Log2[Fold Change (mCherryHigh/mCherryLow)]. NT, HOXA9, USF2 and KMT2A sgRNAs were highlighted by different color code. (D) The ratio for all sgRNAs targeting HOXA9, USF2, and KMT2A, are shown between mCherryHigh and mCherryLow sorted population. NT sgRNAs were overlaid on a gray gradient depicting the overall distribution. NT: 100 sgRNAs. Transcription factors: seven sgRNAs/each. RRA score of each gene was collected from MAGeCK analysis. (E) The overall distribution of all sgRNAs from the HOXA9-MEIS1 overexpressing SEM HOXA9 reporter screening was shown based on the p-value and the DEseq2 score calculated by Log2[Fold Change (mCherryHigh/mCherryLow)]. NT, HOXA9, USF2 and KMT2A sgRNAs were highlighted by different color code. (F) The ratio for all sgRNAs targeting HOXA9, USF2, and KMT2A, are shown between mCherryHigh and mCherryLow sorted population. NT sgRNAs were overlaid on a gray gradient depicting the overall distribution. NT: 100 sgRNAs. Transcription factors: seven sgRNAs/each. RRA score of each gene was collected from MAGeCK analysis.
Figure 3—figure supplement 1
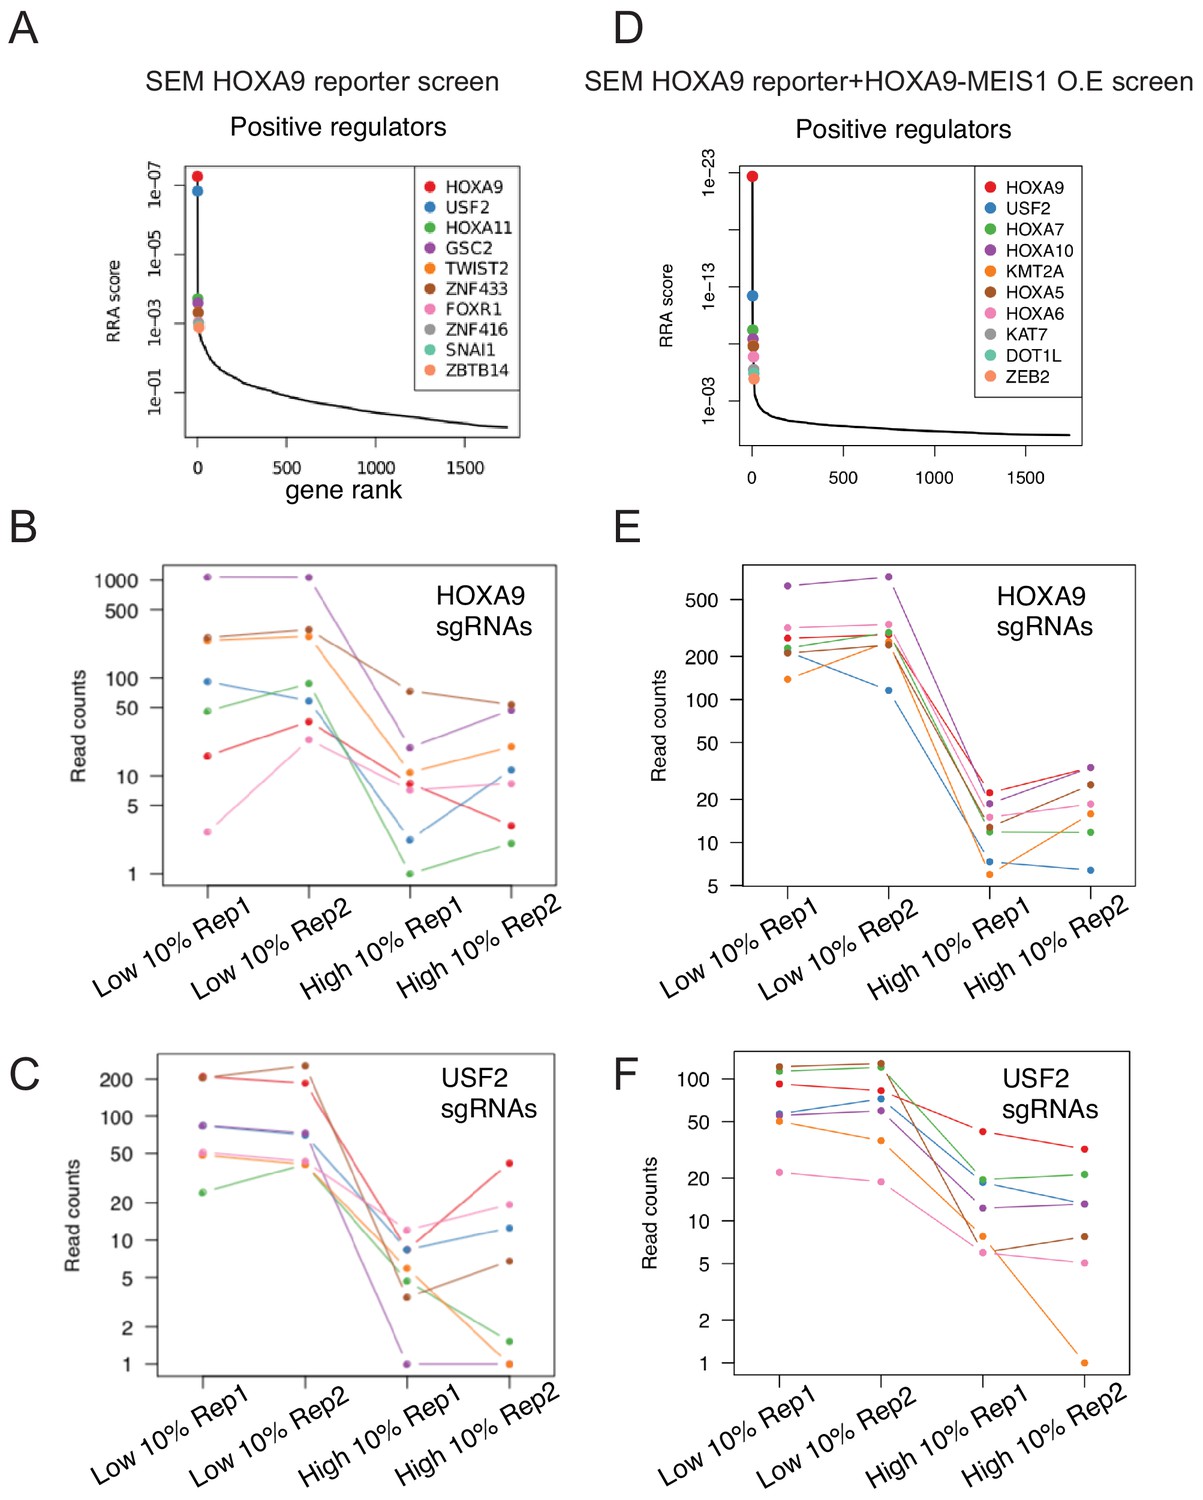
CRISPR screen and data analysis by MAGeCK.
(A) Gene ranking of the top 10 positive and negative candidate regulators of HOXA9 enriched from parental SEM reporter screening by MAGeCK algorithm. (B) Normalized sgRNA count distribution of each of seven sgRNAs against HOXA9. (C) Normalized sgRNA count distribution of each of seven sgRNAs against USF2. (D) Gene ranking of the top 10 positive and negative candidate regulators of HOXA9 enriched from HOXA9-MEIS1 overexpressing SEM reporter screening by MAGeCK algorithm. (E) Normalized sgRNA count distribution of each of seven sgRNAs against HOXA9. (F) Normalized sgRNA count distribution of each of seven sgRNAs against USF2.
Figure 3—figure supplement 2
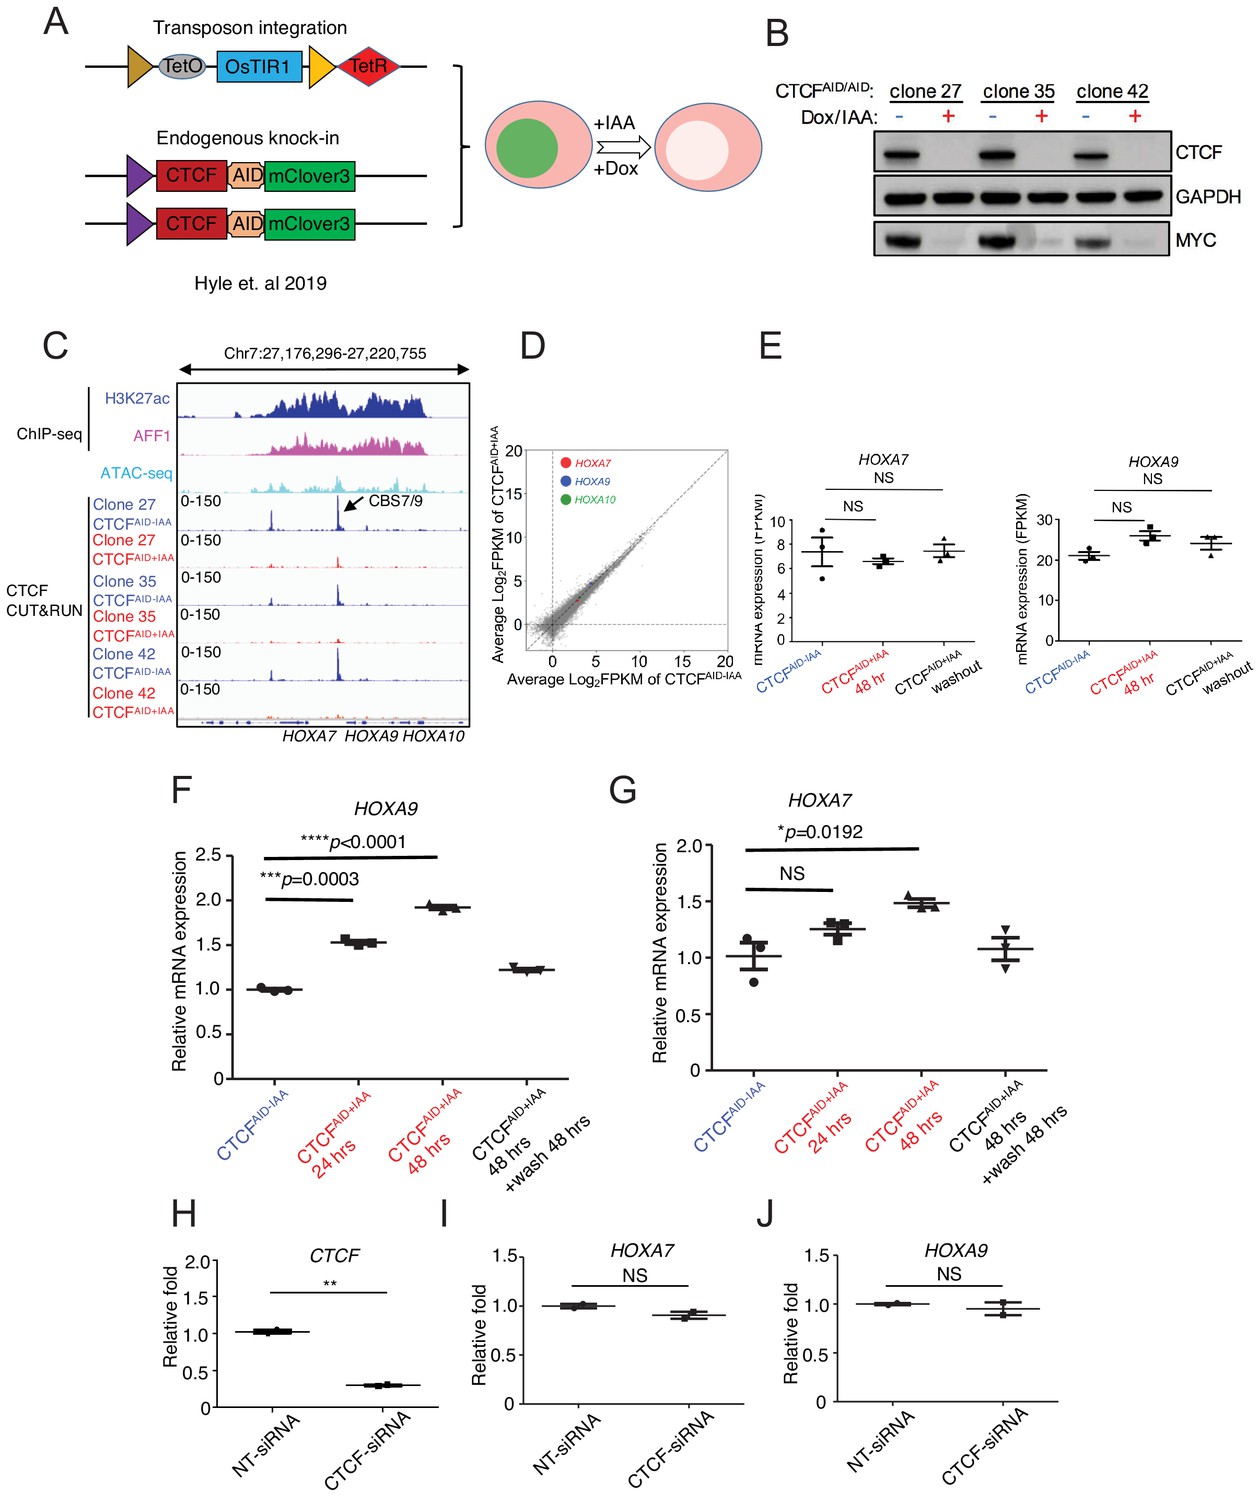
CTCF is dispensable for maintaining HOXA9 expression in MLLr SEM cells.
(A) Flow diagram of auxin-inducible degradation model to acutely deplete endogenous CTCF protein. Dox, doxycycline; IAA: auxin. (B) Immunoblotting analysis of CTCFAID and MYC in three bi-allelic knock-in clones 27, 35, and 42 with or without auxin (IAA) treatment. GAPDH was used as a loading control. (C) CTCF Cut and Run tracks shown at the selective viewpoint of the HOXA9 locus where significant reduction of CTCF binding at CBS7/9 occurs following 48 hr IAA treatment in clones 27, 35, and 42. Publicly available ChIP-seq tracks of CTCF, AFF1 and H3K27ac were included to indicate the open chromatin status of the locus. (D) RNA-seq profiles of HOXA7, HOXA9, and HOXA10 in CTCF-depleted SEM cells. (E) Quantification of HOXA7 and HOXA9 levels in three knock-in clones of CTCF depleted SEM cells using RNA-seq data. (F) Q-PCR analysis of HOXA9 was conducted to monitor the transcriptional response to CTCF depletion for 24, 48 hr and washout from three biological replicates; clones 27, 35, and 42 (N = 3). Data shown are means ± SEM from three independent experiments. *p<0.05, **p<0.01, ***p<0.001, ****p<0.0001, two-tailed Student’s t test. (G) Q-PCR analysis of HOXA9 was conducted to monitor the transcriptional response to CTCF depletion for 24, 48 hr and washout from three biological replicates; clones 27, 35, and 42 (N = 3). Data shown are means ± SEM from three independent experiments. *p<0.05, two-tailed Student’s t test. (H) SEM cells were electroporated with CTCF-siRNA and NT-siRNA. Q-PCR was conducted 24 hr post-electroporation to monitor CTCF expression. Data shown are means ± SEM from two independent experiments. **p<0.01, two-tailed Student’s t test. (I) SEM cells were electroporated with CTCF-siRNA and NT-siRNA. Q-PCR analysis was conducted 24 hr post-electroporation to monitor HOXA7 expression. Data shown are means ± SEM from two independent experiments. *p<0.05, two-tailed Student’s t test. (J) SEM cells were electroporated with CTCF-siRNA and NT-siRNA. Q-PCR was conducted 24 hr post-electroporation to monitor HOXA9 expression. Data shown are means ± SEM from two independent experiments. *p<0.05, two-tailed Student’s t test.
Figure 3—figure supplement 3
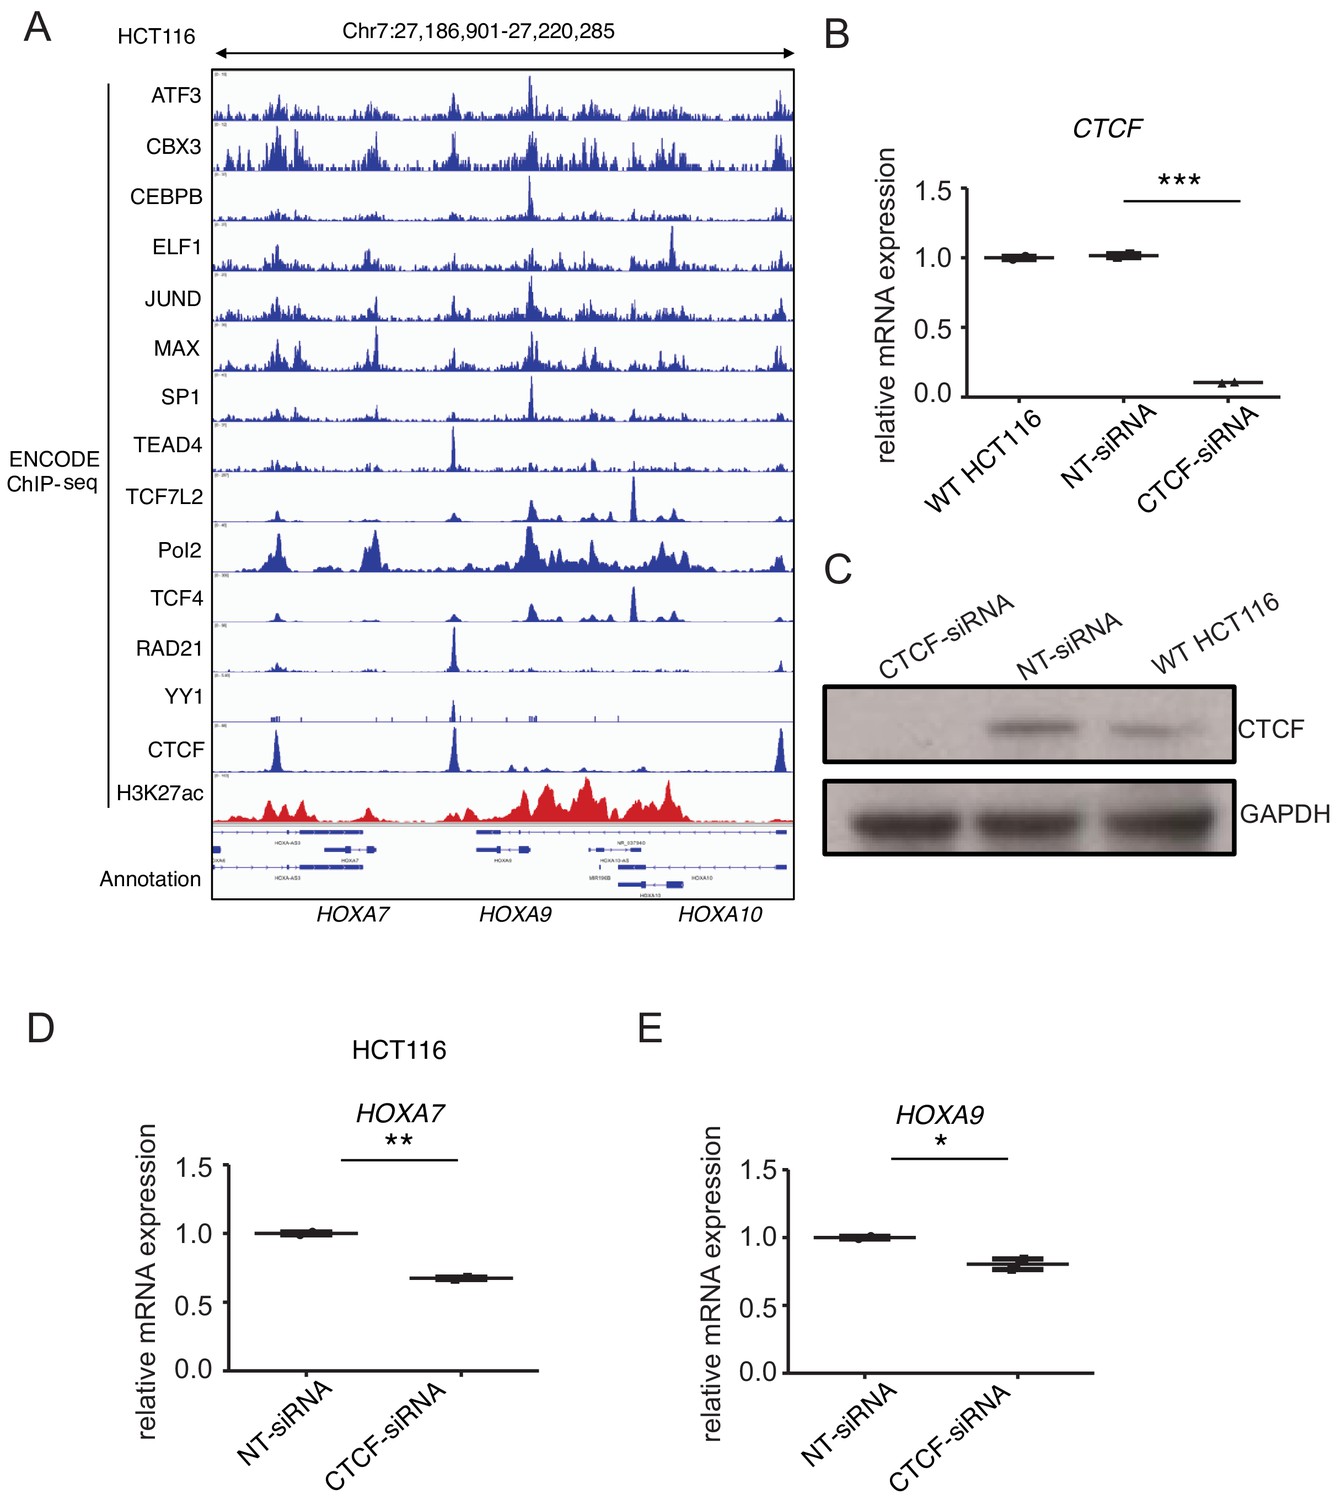
CTCF regulates HOXA9 expression in human colorectal cancer HCT116 cells.
(A) ChIP-seq tracks from publicly available ENCODE dataset demonstrated the enriched transcription factor occupancy at CBS7/9 in HCT116 cells RNA-seq profiles of HOXA7, HOXA9, and HOXA10 in CTCF depleted SEM cells. (B) Q-PCR analysis of CTCF in HCT116 cells transfected with CTCF-siRNAs and NT-siRNAs for 48 hr. Data are means ± SEM from two independent experiments. ***p<0.001, Student’s t test. (C) Immunoblotting confirmed the siRNA-mediated inhibition of CTCF at protein level. (D) Q-PCR analysis of HOXA7 in HCT116 cells transfected with CTCF-siRNAs and NT-siRNAs for 48 hr. Data are means ± SEM from two independent experiments. **p<0.01, Student’s t test. (E) Q-PCR analysis of HOXA9 in HCT116 cells transfected with CTCF-siRNAs and NT-siRNAs for 48 hr. Data are means ± SEM from two independent experiments. *p<0.05, Student’s t test.
Figure 4 with 1 supplement
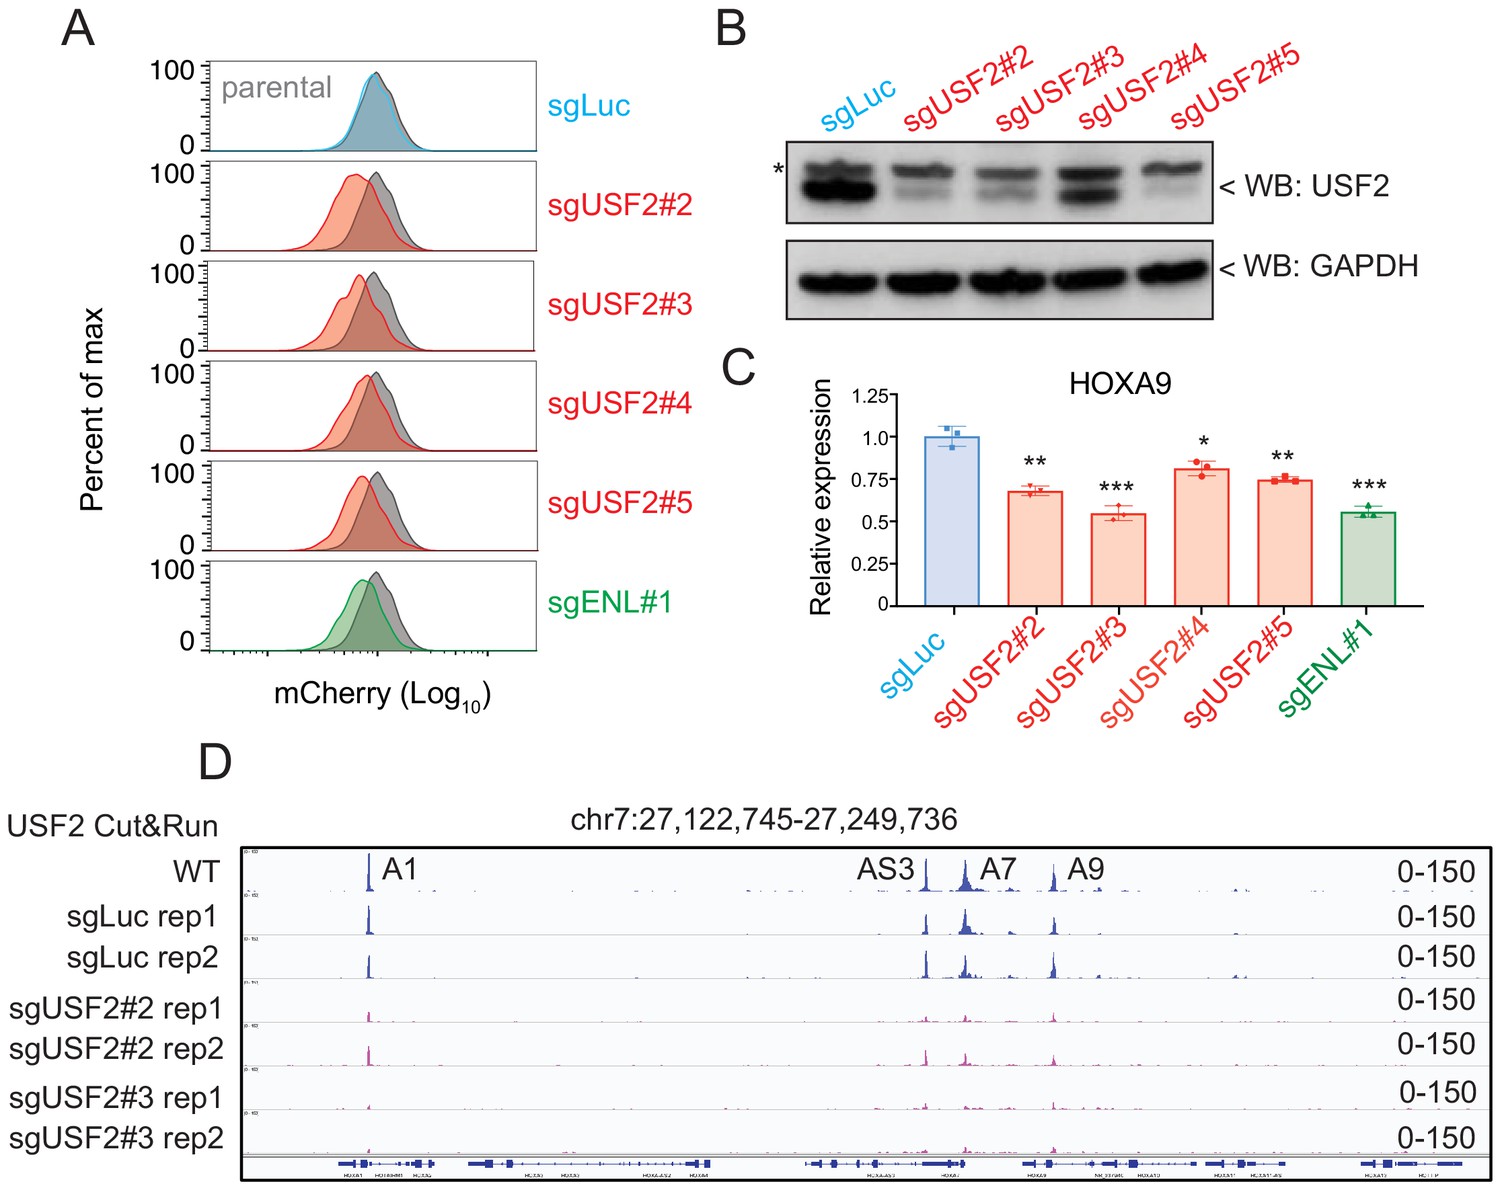
USF2 is required to maintain HOXA9 expression in MLLr leukemia.
(A) Flow cytometry analysis was performed at day 8 on the HOXA9P2A-mCherry cells targeted with lentiviral Cas9 and four sgRNAs against USF2. The sgENL-targeted cells were used as positive controls while sgLuc targeted cells were used as negative controls. (B) Q-PCR analysis was conducted on the USF2-targeted cells to monitor the reduction of HOXA9. The sgENL targeted cells were used as positive controls while sgLuc-targeted cells were used as negative controls. Data shown are means ± SEM from three independent experiments. *p<0.05, **p<0.01, ***p<0.001, two-tailed Student’s t test. (C) Immunoblotting of USF2 in USF2 sgRNAs targeted cells. '*' denoted non-specific bands. (D) USF2 occupancy changes in sgLuc and sgUSF2-targeted SEM cells were characterized in HOXA9 locus (A1, HOXA1; AS3, HOXA-AS3; A7, HOXA7; A9, HOXA9).
Figure 4—figure supplement 1
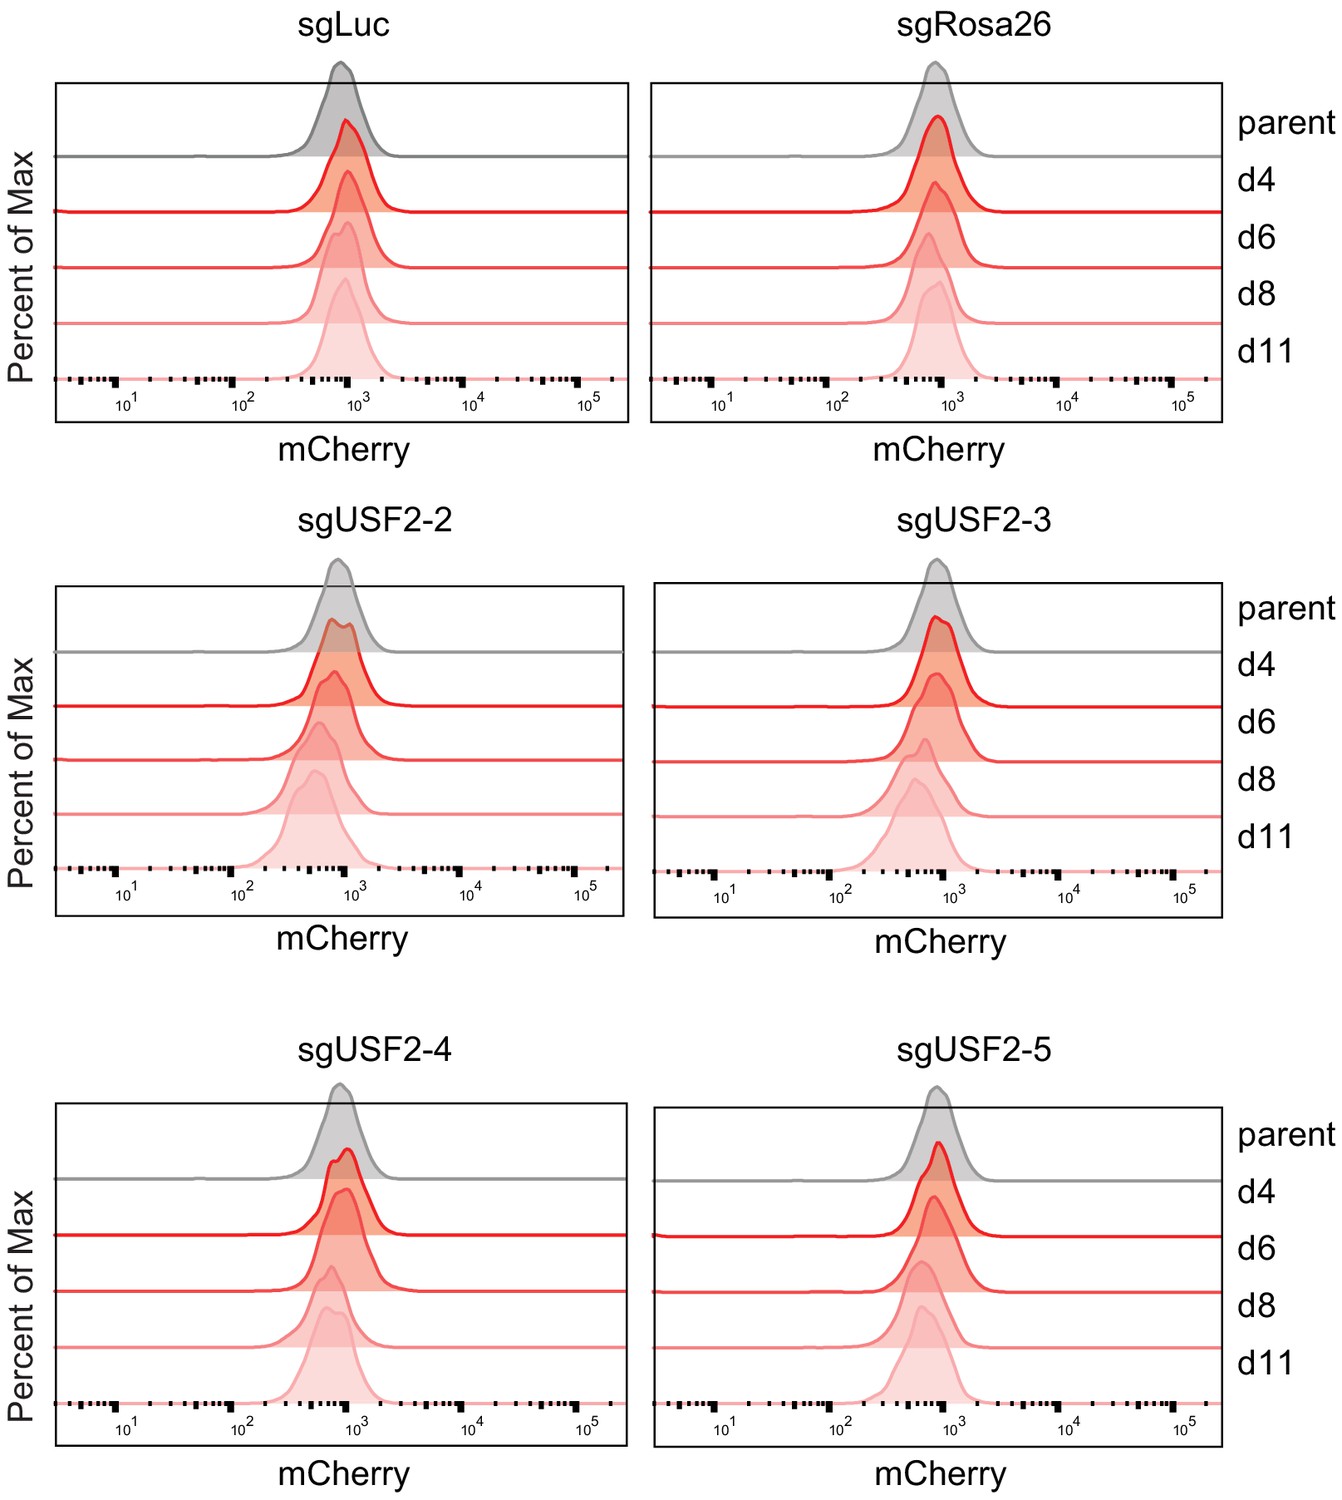
Time-course knock-down of USF2 and consequent HOXA9 expression analysis.
Flow cytometry analysis was performed at day 0, 4, 6, 8, and 11 on the HOXA9P2A-mCherry cells targeted with lentiviral Cas9 and four sgRNAs against USF2. The sgLuc- and sgRosa26-targeted cells were included as negative controls.
Figure 5 with 3 supplements
USF1 and USF2 synergistically regulate HOXA9 expression in MLLr leukemia.
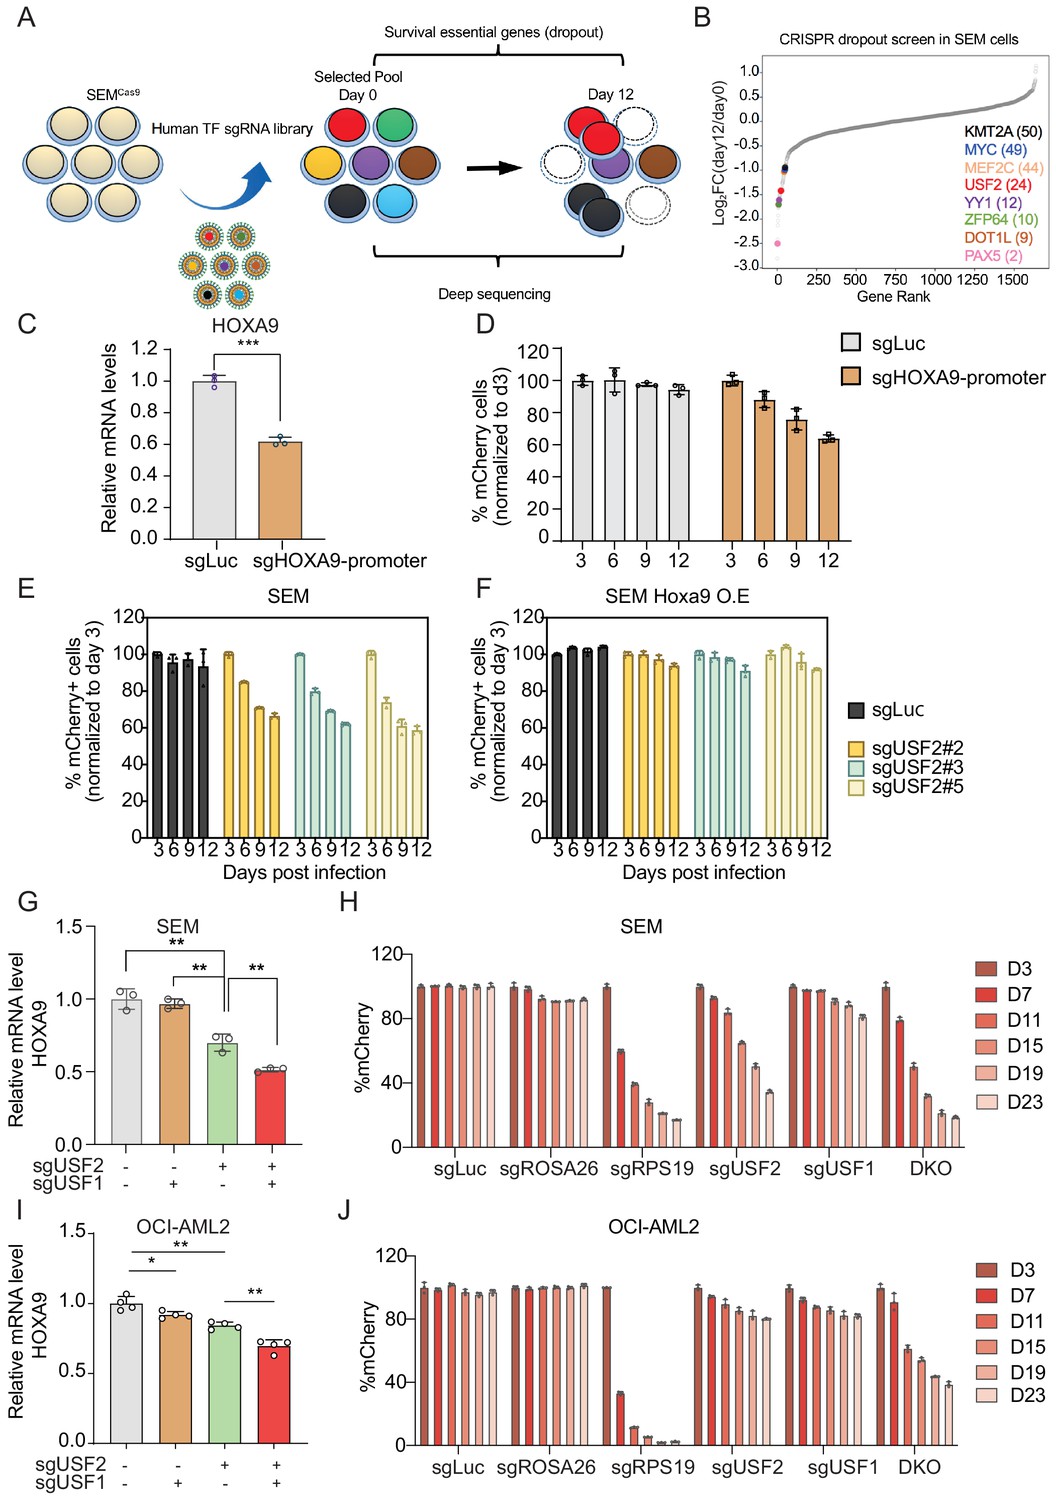
(A) Flow diagram of dropout CRISPR screening procedure. (B) Gene ranking of all transcription factors from dropout screening was illustrated. The enrichment score of seven sgRNAs against each transcription factor was combined by the MAGeCK algorithm. (C) Q-PCR was conducted to monitor HOXA9 expression upon CRISPR targeting on its promoter. (D) Competitive proliferation assay was conducted by infecting SEMCas9 cells with Lentiviral-mCherry-sgRNAs against HOXA9 promoter at about 50% efficiency. The mCherry% was quantified every three days by flow cytometry to evaluate the growth disadvantage. (E) Competitive proliferation assay was conducted by infecting SEMCas9 cells with Lentiviral-mCherry-sgRNAs against luciferase (sgLuc) and USF2 (sgUSF2#2, 2#3 and 2#5) at about 50% efficiency. The mCherry% was quantified every 3 days by flow cytometry to evaluate the growth disadvantage. (F) Rescued competitive proliferation assay was conducted by infecting SEM cells overexpressing ectopic Hoxa9 with Lentiviral-mCherry-sgRNAs against luciferase (sgLuc) and USF2 (sgUSF2#2, 2#3 and 2#5) at about 50% efficiency. The mCherry% was quantified every 3 days by flow cytometry to evaluate the growth disadvantage. (G) Q-PCR analysis was conducted on the sgUSF2, sgUSF1 and sgUSF1/2-targeted SEM cells to monitor the reduction of HOXA9. Data shown are means ± SEM from three independent experiments. **p<0.01, two-tailed Student’s t test. (H) Competitive proliferation assay was conducted by infecting SEMCas9 cells with Lentiviral-mCherry-sgLuc, sgUSF1, sgUSF2, and sgUSF1/2 (DKO) at about 50% efficiency. The mCherry% was quantified at days 3, 7, 11, 15, 19, and 23 by flow cytometry to evaluate the growth disadvantage. A guide RNA targeting the survival essential gene RPS19 was included as a positive control for Cas9 activity. Guide RNAs targeting Luciferase gene (sgLuc) and the human ROSA26 gene (sgROSA26) were included as a negative control. (I) Q-PCR analysis was conducted on the sgUSF2, sgUSF1 and sgUSF1/2 targeted OCI-AML2 cells to monitor the reduction of HOXA9. Data shown are means ± SEM from three independent experiments. *p<0.05, **p<0.01, two-tailed Student’s t test. (J) Competitive proliferation assay was conducted by infecting OCI-AML2Cas9 cells with Lentiviral-mCherry-sgLuc, sgUSF1, sgUSF2, and sgUSF1/2 (DKO) at about 50% efficiency. The mCherry% was quantified at days 3, 7, 11, 15, 19, and 23 by flow cytometry to evaluate the growth disadvantage. A guide RNA targeting the survival essential gene RPS19 was included as a positive control for Cas9 activity. Guide RNAs targeting Luciferase gene (sgLuc) and the human ROSA26 gene (sgROSA26) were included as negative controls.
Figure 5—figure supplement 1
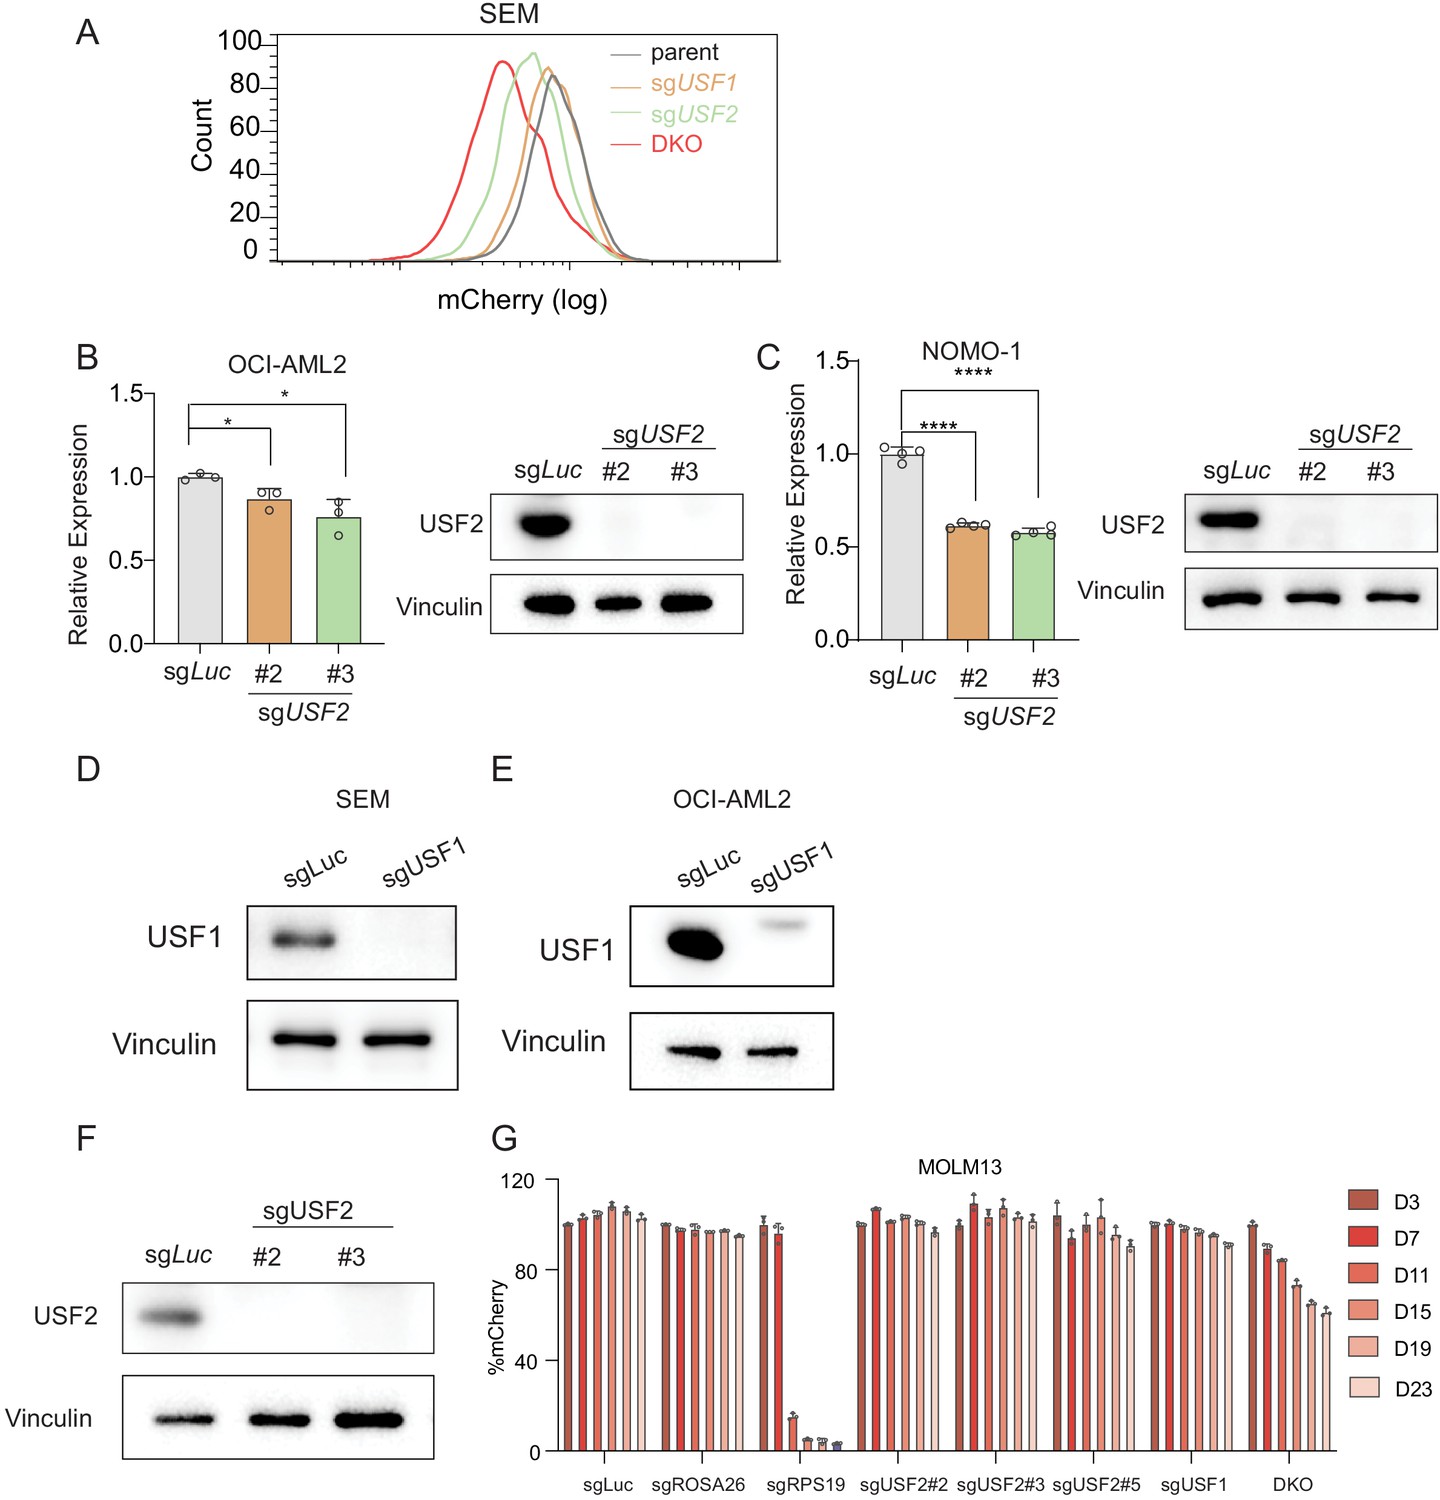
USF2 depletion in MLLr leukemia cells.
(A) Flow cytometry analysis was performed on the HOXA9P2A-mCherry SEM cells targeted with lentiviral Cas9 and sgRNAs against USF1, USF2, and USF1/2 (DKO). (B) Q-PCR was performed to validate the transcriptional regulation of HOXA9 upon USF2 targeting by two sgRNAs (sgUSF2#2 and sgUSF2#3) in OCI-AML2 cells. Immunoblotting confirmed the complete depletion of USF2. (C) Q-PCR was performed to validate the transcriptional regulation of HOXA9 upon USF2 targeting by two sgRNAs (sgUSF2#2 and sgUSF2#3) in NOMO-1 cells. Immunoblotting confirmed the complete depletion of USF2. (D) Immunoblotting confirmed the complete depletion of USF1 in SEM cells upon USF1 targeting by a sgRNA. (E) Immunoblotting confirmed the complete depletion of USF1 in OCI-AML2 cells upon USF1 targeting by a sgRNA. (F) Immunoblotting confirmed the complete depletion of USF2 in MOLM13 cells USF2 targeting by two sgRNAs (sgUSF2#2 and sgUSF2#3). (G) Competitive proliferation assay was conducted by infecting MOLM13Cas9 cells with Lentiviral-mCherry-sgRNAs against luciferase (sgLuc) and USF2 (sgUSF2#2, 2#3 and 2#5) at about 50% efficiency. The mCherry% was quantified at days 0, 3, 7, 11, 15, 19, and 23 by flow cytometry to evaluate the growth disadvantage. A guide RNA targeting the survival essential gene RPS19 was included as a positive control for Cas9 activity. Guide RNAs targeting Luciferase gene (sgLuc) and the human ROSA26 gene (sgROSA26) were included as negative controls.
Figure 5—figure supplement 2
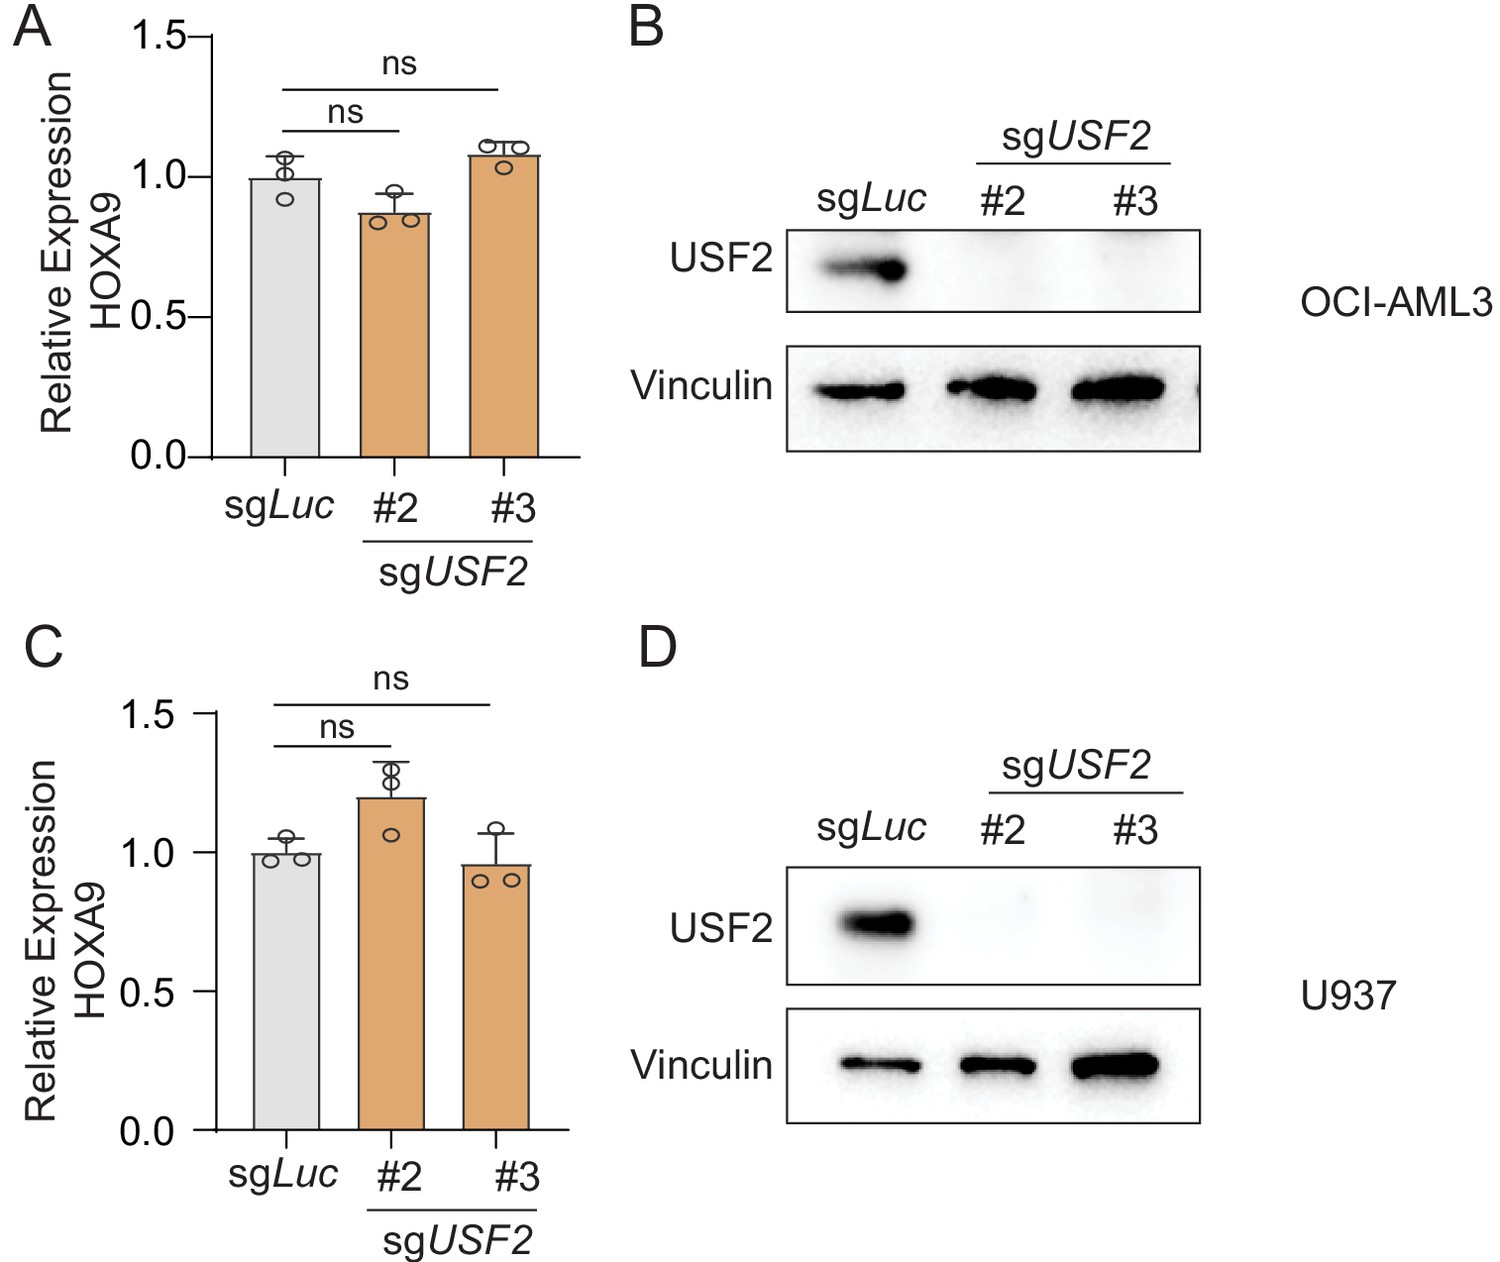
USF2 depletion in non-MLLr leukemia cells.
(A) Q-PCR was performed to validate the transcriptional impact of HOXA9 upon USF2 targeting by two sgRNAs (sgUSF2#2 and sgUSF2#3) in OCI-AML3 cells. Immunoblotting confirmed the complete depletion of USF2. (B) Immunoblotting confirmed the complete depletion of USF2 in OCI-AML3 cells upon USF2 targeting by a sgRNA. (C) Q-PCR was performed to validate the transcriptional impact of HOXA9 upon USF2 targeting by two sgRNAs (sgUSF2#2 and sgUSF2#3) in U937 cells. Immunoblotting confirmed the complete depletion of USF2. (D) Immunoblotting confirmed the complete depletion of USF2 in U937 cells upon USF2 targeting by a sgRNA.
Figure 5—figure supplement 3
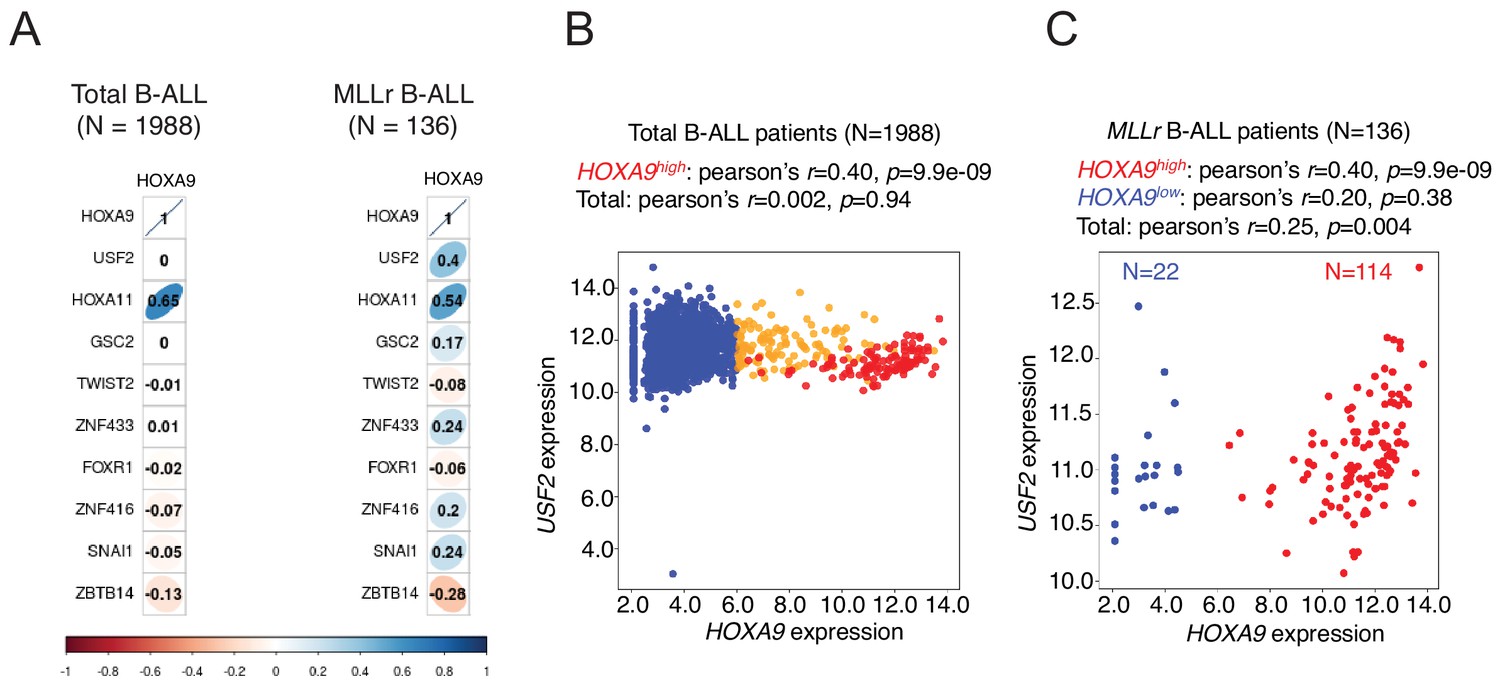
Transcriptional correlation between USF2 and HOXA9 in patient cohorts.
(A) Pearson’s correlation of transcriptional levels of HOXA9 and top 10 positive regulators identified from TF screen in a cohort of 1988 B-ALL patients (Gu et al., 2019). (B) Pearson’s correlation of transcriptional levels of HOXA9 and USF2 in a cohort of 1988 B-ALL patients (Gu et al., 2019). (C) Pearson’s correlation of transcriptional levels of HOXA9 and USF2 in a cohort of 136 MLLr B-ALL patients (Gu et al., 2019).
Tables
Key resources table
| Reagent type (species) or resource | Designation | Source or reference | Identifiers | Additional information |
|---|---|---|---|---|
| Cell line (Homo sapiens) | SEM | DSMZ | ACC546 | CVCL_0095 |
| Cell line (Homo sapiens) | NOMO-1 | DSMZ | ACC542 | CVCL_1609 |
| Cell line (Homo sapiens) | OCI-AML2 | DSMZ | ACC99 | CVCL_1619 |
| Cell line (Homo sapiens) | OCI-AML3 | DSMZ | ACC582 | CVCL_1844 |
| Cell line (Homo sapiens) | MOLM13 | DSMZ | ACC554 | CVCL_2119 |
| Cell line (Homo sapiens) | U937 | ATCC | CRL-1593.2 | CVCL_0007 |
| Cell line (Homo sapiens) | 293T | ATCC | CRL-3216 | CVCL_0063 |
| Cell line (Homo sapiens) | SEM-HOXA9P2A-mCherry | This eLife study | Reporter derived from SEM cells via knock-in | Cell line is available upon request to Dr. Chunliang Li |
| Cell line (Homo sapiens) | OCI-AML2-HOXA9P2A-mCherry | This eLife study | Reporter derived from OCI-AML2 cells via knock-in | Cell line is available upon request to Dr. Chunliang Li |
| Antibody | Anti-USF2 (Rabbit polyclonal) | Novus | NBP1-92649 | IP, IB (1:2,000) AB_11007053 |
| Antibody | Anti-USF1 | Proteintech | 22327–1-AP | IB (1: 2,000) AB_2060867 |
| Antibody | Anti-CTCF (Rabbit polyclonal) | Abcam | ab70303 | IB (1:1,000) AB_1209546 |
| Antibody | Anti-MYC (Rabbit polyclonal) | Cell Signaling Technology | 9402 | IB (1:1000) AB_2151827 |
| Antibody | Anti-GAPDH | Thermo Fisher Scientific | AM4300 | IB (1:10,000) AB_437392 |
| Antibody | Anti-Vinculin | Proteintech | 26520–1-AP | IB (1:2,000) AB_2868558 |
| Sequence-based reagent | U6-Forward sequencing primer | This paper | sgRNA sequencing primer | 5’GAGGGCCTATTTCCCATGAT3’ |
| Sequence-based reagent | sgRNA sequence | This paper | sgRNA targeting HOXA9 on C-terminus | 5’AAAGACGAGTGATGCCATTT3’ |
| Sequence-based reagent | HOXA9 5’HA cloning primer F | This paper | HOXA9 knockin reporter cloning | 5’GGCCGATTCCTTCCACTTCT3’ |
| Sequence-based reagent | HOXA9 5’HA cloning primer R | This paper | HOXA9 knockin reporter cloning | 5’TCACTCGTCTTTTGCTCGGT3’ |
| Sequence-based reagent | HOXA9 3’HA cloning primer F | This paper | HOXA9 knockin reporter cloning | 5’ACCGAGCAAAAGACGAGTGA3’ |
| Sequence-based reagent | HOXA9 3’HA cloning primer R | This paper | HOXA9 knockin reporter cloning | 5’CACTGTTCGTCTGGTGCAAA3’. |
| Sequence-based reagent | Infusion cloning F | This paper | HOXA9 knockin reporter cloning | 5’AAGACCGAGCAAAAGACGAGGGATCCGGCGCAACAAACTT3’ |
| Sequence-based reagent | Infusion cloning R | This paper | HOXA9 knockin reporter cloning | 5’AATAAGCCCAAATGGCATCACTTGTACAGCTCGTCCATGC3‘ |
| Sequence-based reagent | Infusion cloning of mCherry F | This paper | HOXA9 knockin reporter cloning | 5’AAAGACGAGTGATGCCATTTGGGATGAGGCTGCGGGCGAC3’ |
| Sequence-based reagent | Infusion cloning of mCherry R | This paper | HOXA9 knockin reporter cloning | 5’AAAGACGAGTGATGCCATTTGGGTATATATACAATAGACAAGACAGGAC3’ |
| Sequence-based reagent | DOT1L-sgRNA | This paper | sgRNA sequence | 5’TCAGCTTCGAGAGCATGCAG3’ |
| Sequence-based reagent | ENL-sgRNA | This paper | sgRNA sequence | 5’TCACCTGGACGGTGCACTGG3’ |
| Sequence-based reagent | USF2-sgRNA#2 | This paper | sgRNA sequence | 5’AGAAGAGCCCAGCACAACGA3’ |
| Sequence-based reagent | USF2-sgRNA#3 | This paper | sgRNA sequence | 5’TGTTTTCCGCAGTGGAGCGG3’ |
| Sequence-based reagent | USF2-sgRNA#4 | This paper | sgRNA sequence | 5’CCGGGGATCTTACCTGGCGG3’ |
| Sequence-based reagent | USF2-sgRNA#5 | This paper | sgRNA sequence | 5’CAGCCACGACAAGGGACCCG3’ |
| Sequence-based reagent | USF1-sgRNA | This paper | sgRNA sequence | 5’CTATACTTACTTCCCCAGCA3’ |
| Sequence-based reagent | Luciferase-sgRNA | This paper | sgRNA sequence | 5’CCCGGCGCCATTCTATCCGC3’ |
| Sequence-based reagent | ROSA26-sgRNA | This paper | sgRNA sequence | 5’ACCTACCACACTAGCCCGA3’ |
| Sequence-based reagent | RPS19-sgRNA | This paper | sgRNA sequence | 5’GTAGAACCAGTTCTCATCGT3’ |
| Sequence-based reagent | HOXA9-promoter sgRNA | This paper | sgRNA sequence | 5’GATTTCATGTAACAACTTGG3’ |
| Sequence-based reagent | CTCF-F | This study | Q-PCR primer | 5’TTTGTCTGTTCTAAGTGTGGGAAA3’ |
| Sequence-based reagent | CTCF-R | This study | Q-PCR primer | 5’TTAGAGCGCATCTTTCTTTTTCTT3’ |
| Sequence-based reagent | GAPDH-F | This study | Q-PCR primer | 5’AGGGCTGCTTTTAACTCTGGT3’ |
| Sequence-based reagent | GAPDH-R | This study | Q-PCR primer | 5’CCCCACTTGATTTTGGAGGGA3’ |
| Sequence-based reagent | ACTB-F | This study | Q-PCR primer | GAGCACAGAGCCTCGCCTTT |
| Sequence-based reagent | ACTB-R | This study | Q-PCR primer | GAGCGCGGCGATATCATCA |
| Sequence-based reagent | HOXA1-F | This study | Q-PCR primer | 5’CCAGCCACCAAGAAGCCTGT3’ |
| Sequence-based reagent | HOXA1-R | This study | Q-PCR primer | 5’CCAGTTCCGTGAGCTGCTTG3’ |
| Sequence-based reagent | HOXA2-F | This study | Q-PCR primer | 5’ACAGCGAAGGGAAATGTAAAAGC3’ |
| Sequence-based reagent | HOXA2-R | This study | Q-PCR primer | 5’GGGCCCCAGAGACGCTAA3’ |
| Sequence-based reagent | HOXA3-F | This study | Q-PCR primer | 5’TGCAAAAAGCGACCTACTACGA3’ |
| Sequence-based reagent | HOXA3-R | This study | Q-PCR primer | 5’CGTCGGCGCCCAAAG3’ |
| Sequence-based reagent | HOXA4-F | This study | Q-PCR primer | 5’CGTGGTGTACCCCTGGATGA3’ |
| Sequence-based reagent | HOXA4-R | This study | Q-PCR primer | 5’AAGACCTGCTGCCGGGTGTA3’ |
| Sequence-based reagent | HOXA5-F | This study | Q-PCR primer | 5’TCTACCCCTGGATGCGCAAG3’ |
| Sequence-based reagent | HOXA5-R | This study | Q-PCR primer | 5’AATCCTCCTTCTGCGGGTCA3’ |
| Sequence-based reagent | HOXA6-F | This study | Q-PCR primer | 5’TGGATGCAGCGGATGAACTC3’ |
| Sequence-based reagent | HOXA6-R | This study | Q-PCR primer | 5’CCGTGTCAGGTAGCGGTTGA3’ |
| Sequence-based reagent | HOXA7-F | This study | Q-PCR primer | 5’TCTGCAGTGACCTCGCCAAA3’ |
| Sequence-based reagent | HOXA7-R | This study | Q-PCR primer | 5’AGCGTCTGGTAGCGCGTGTA3’ |
| Sequence-based reagent | HOXA9-F | This study | Q-PCR primer | 5’AAAAACAACCCAGCGAAGGC3’ |
| Sequence-based reagent | HOXA9-R | This study | Q-PCR primer | 5’ACCGCTTTTTCCGAGTGGAG3’ |
| Sequence-based reagent | HOXA10-F | This study | Q-PCR primer | 5’CCTTCCGAGAGCAGCAAAGC3’ |
| Sequence-based reagent | HOXA10-R | This study | Q-PCR primer | 5’CAGCGCTTCTTCCGACCACT3’ |
| Sequence-based reagent | HOXA11-F | This study | Q-PCR primer | 5’ACAGGCTTTCGACCAGTTTTTC3’ |
| Sequence-based reagent | HOXA11-R | This study | Q-PCR primer | 5’CCTTCTCGGCGCTCTTGTC3’ |
| Sequence-based reagent | HOXA13-F | This study | Q-PCR primer | 5’ACTCTGCCCGACGTGGTCTC3’ |
| Sequence-based reagent | HOXA13-R | This study | Q-PCR primer | 5’TTCGTGGCGTATTCCCGTTC3’ |
| Sequence-based reagent | mCherry-F | This study | Q-PCR primer | 5’CACTACGACGCTGAGGTCAA3’ |
| Sequence-based reagent | mCherry-R | This study | Q-PCR primer | 5’TAGTCCTCGTTGTGGGAGGT3’ |
| Sequence-based reagent | siRNA: nontargeting control | Thermo Fisher | siRNA oligo | Silencer Select |
| Sequence-based reagent | siRNA: CTCF | Thermo Fisher | siRNA oligo | Silencer Select |
| Sequence-based reagent | DNA oligo pool | CustomArray | sgRNA synthesis | |
| Commercial assay or kit | In-Fusion HD Cloning | Clontech | 638909 | |
| Commercial assay or kit | Polybrene | EMD Millipore | TR-1003-G | |
| Commercial assay or kit | DAPI | Sigma | D9542-10MG | |
| Commercial assay or kit | Lonza nucleofector Kit | Lonza | VCA-1003 | |
| Commercial assay or kit | Q5 High-Fidelity DNA Polymerase | New England Biolabs | M0491L | |
| Commercial assay or kit | CloneAMP HiFI PCR Premix | Clontech | 639298 | |
| Commercial assay or kit | Quick-DNA Miniprep Kit | Zymo | D3025 | |
| Commercial assay or kit | NEB Next UltraII DNA Library Prep Kit | NEB | E7645S | |
| Commercial assay or kit | ZymoPURE II Plasmid Midiprep Kit | Zymo | D4201 | |
| Commercial assay or kit | TRIzol | Thermo Fisher Scientific | 15596026 | |
| Commercial assay or kit | High-Capacity cDNA Reverse Transcription Kit | Applied Biosystems | 4374966 | |
| Commercial assay or kit | FAST SYBR Green Master Mix | Applied Biosystems | 4385612 | |
| Recombinant DNA reagent | pSpCas9(BB)−2A-GFP | Addgene | 48138 | PX458 |
| Recombinant DNA reagent | TOPO-cloning vector | Thermo Fisher Scientific | 450641 | |
| Recombinant DNA reagent | Lenti-Cas9-Blast plasmid | Addgene | 83480 | |
| Recombinant DNA reagent | Lenti-Guide-Puro plasmid | Addgene | 52963 | |
| Recombinant DNA reagent | LRCherry2.1 | Addgene | 108099 | |
| Recombinant DNA reagent | LRNeo-2.1 vector | This study | Subclone from LRCherry2.1 | |
| Recombinant DNA reagent | Lenti-Guide-Puro-IRES-CFP plasmid | This study | Subclone from Lenti-Guide-Puro | |
| Recombinant DNA reagent | HOXA9-MEIS1 OE | This study | Subclone from mouse cDNA | |
| Recombinant DNA reagent | mHoxa9 OE | This study | Subclone from mouse cDNA | |
| Chemical compound, drug | Puromycin | InvivoGen | ant-pr-1 | |
| Chemical compound, drug | Neomycin | GeminiBio | 400–121P | |
| Chemical compound, drug | Blasticidine | Gibco | A1113903 | |
| Chemical compound, drug | SGC0946 | MedChemExpress | HY-15650 | DOT1L inhibitor |
| Software, algorithm | Fluorescene Imaging | Perkin Elmer | Columbus Image Data Storage and Analysis system | |
| Software, algorithm | MAGeCK | https://sourceforge.net/ p/mageck/wiki/Home/ | PMID:25476604 | |
| Software, algorithm | MACS2 | https://github.com/macs3-project/MACS; Zhang et al., 2008 | ||
| Software, algorithm | Cutadapt | https://cutadapt.readthedocs.io/en/v1.9.1/installation.html | 1.9.1 | |
| Software, algorithm | BWA | https://github.com/lh3/bwa/releases; Li, 2013 | 0.7.17-r1188 | |
| Software, algorithm | Samtools | http://www.htslib.org/ | Htslib 1.6 | |
| Software, algorithm | IGV | http://software.broadinstitute.org/software/igv/ | IGV2.3.97 | |
| Software, algorithm | ChIPseeker | https://guangchuangyu.github.io/software/ChIPseeker/; Yu et al., 2015 | ||
| Software, algorithm | TRANSFAC | http://gene-regulation.com/pub/databases.html | ||
| Software, algorithm | JASPAR | http://jaspar.genereg.net/ | 8th release (2020) | |
| Software, algorithm | FIMO | http://meme-suite.org/doc/fimo.html | ||
| Software, algorithm | DESeq2 | https://bioconductor.org/packages/release/bioc/html/DESeq2.html | ||
| Software, algorithm | GraphPad Prism | version 8.0 | ||
| Software, algorithm | Flowjo | version 10.0 | ||
| Software, algorithm | Bowtie | http://bowtie-bio.sourceforge.net/index.shtml | ||
| Software, algorithm | BamCoverage | https://deeptools.readthedocs.io/en/develop/content/tools/bamCoverage.html |
Additional files
-
Supplementary file 1
Oligo information used in this paper.
- https://cdn.elifesciences.org/articles/57858/elife-57858-supp1-v2.xlsx
-
Supplementary file 2
Raw count information related to CRISPR screen.
- https://cdn.elifesciences.org/articles/57858/elife-57858-supp2-v2.xlsx
-
Transparent reporting form
- https://cdn.elifesciences.org/articles/57858/elife-57858-transrepform-v2.docx
Download links
A two-part list of links to download the article, or parts of the article, in various formats.
Downloads (link to download the article as PDF)
Open citations (links to open the citations from this article in various online reference manager services)
Cite this article (links to download the citations from this article in formats compatible with various reference manager tools)
Functional interrogation of HOXA9 regulome in MLLr leukemia via reporter-based CRISPR/Cas9 screen
eLife 9:e57858.
https://doi.org/10.7554/eLife.57858


