Profiling of myristoylation in Toxoplasma gondii reveals an N-myristoylated protein important for host cell penetration
- Signalling in Apicomplexan Parasites Laboratory, The Francis Crick Institute, United Kingdom
- Institute for Advanced Biosciences, Team Membrane Dynamics of Parasite-Host Cell Interactions, CNRS UMR5309, INSERM U1209, Université Grenoble Alpes, France
- Department of Chemistry, Imperial College London, Molecular Sciences Research Hub, White City Campus, United Kingdom
- The Peptide Chemistry STP, The Francis Crick Institute, United Kingdom
- Department of Life Sciences, Imperial College London, South Kensington, United Kingdom
Figures
Figure 1 with 1 supplement

Metabolic labelling allows for enrichment and visualisation of myristoylated and GPI-anchored proteins in T. gondii.
(A) Metabolic labelling workflow. (B) In gel fluorescence visualisation of YnMyr-dependent enrichment without and with the base treatment (top) and western blot with α-SFP1 (TGGT1_289540) showing the loading control (bottom). (C) Western blot analysis of YnMyr-dependent pull down for known myristoylated and GPI-anchored proteins GAP45 and SAG1, respectively. White space was used to indicate where gel lanes were not contiguous. See also Figure 1—figure supplement 1.
Figure 1—figure supplement 1
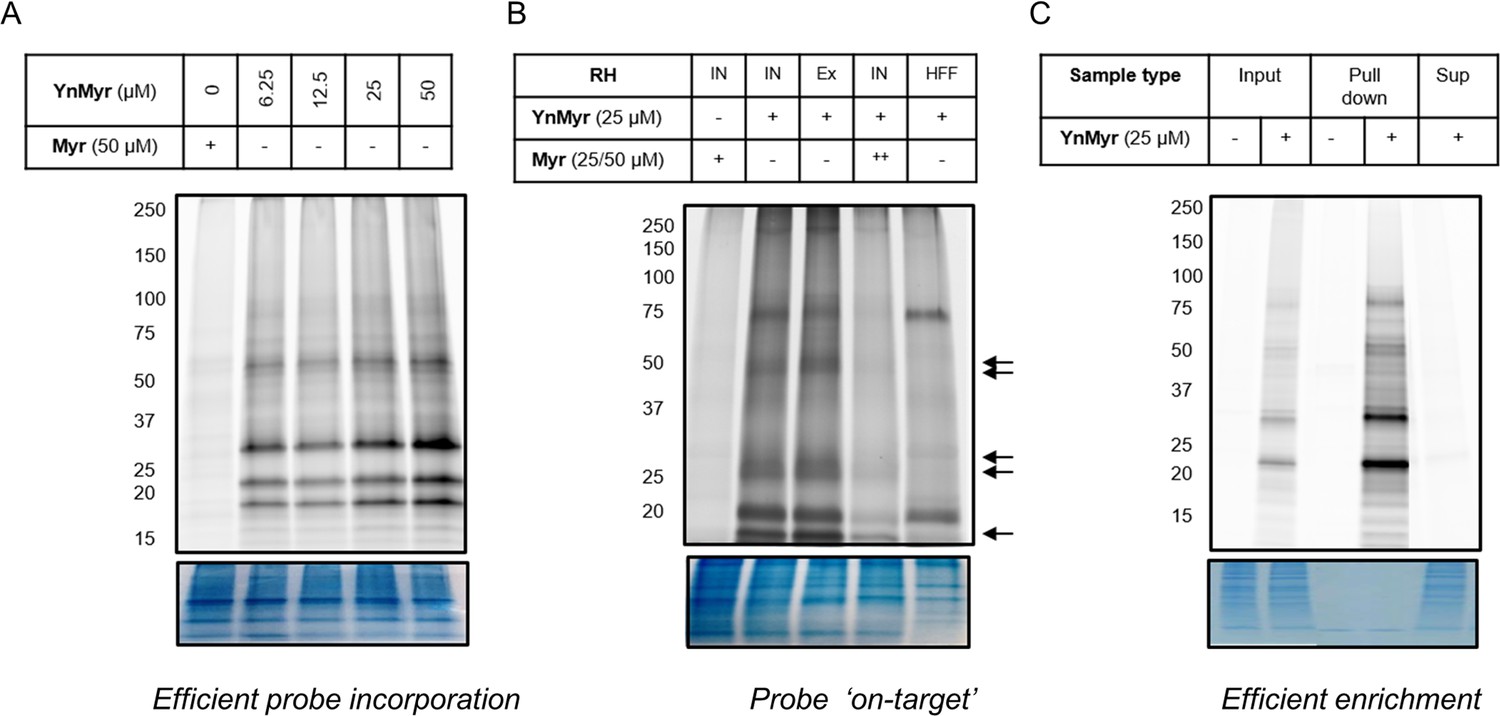
Metabolic labelling optimisation.
(A) In gel fluorescence imaging of protein labelling with increasing concentrations of YnMyr over a 16 hr period in RH parasites. (B) In gel fluorescence visualisation of protein labelling with YnMyr in intracellular (IN) and syringe lysed extracellular (Ex) RH parasites as well as in uninfected human foreskin fibroblasts (HFFs). Parasite-specific bands are indicated by arrows. Tagging with YnMyr is outcompeted by excess myristate (50 µM = ++). (C) In gel fluorescence analysis of YnMyr-dependent pull down efficiency, Sup = supernatant after enrichment. All bottom panels show loading control by Coomassie staining.
Figure 2 with 1 supplement
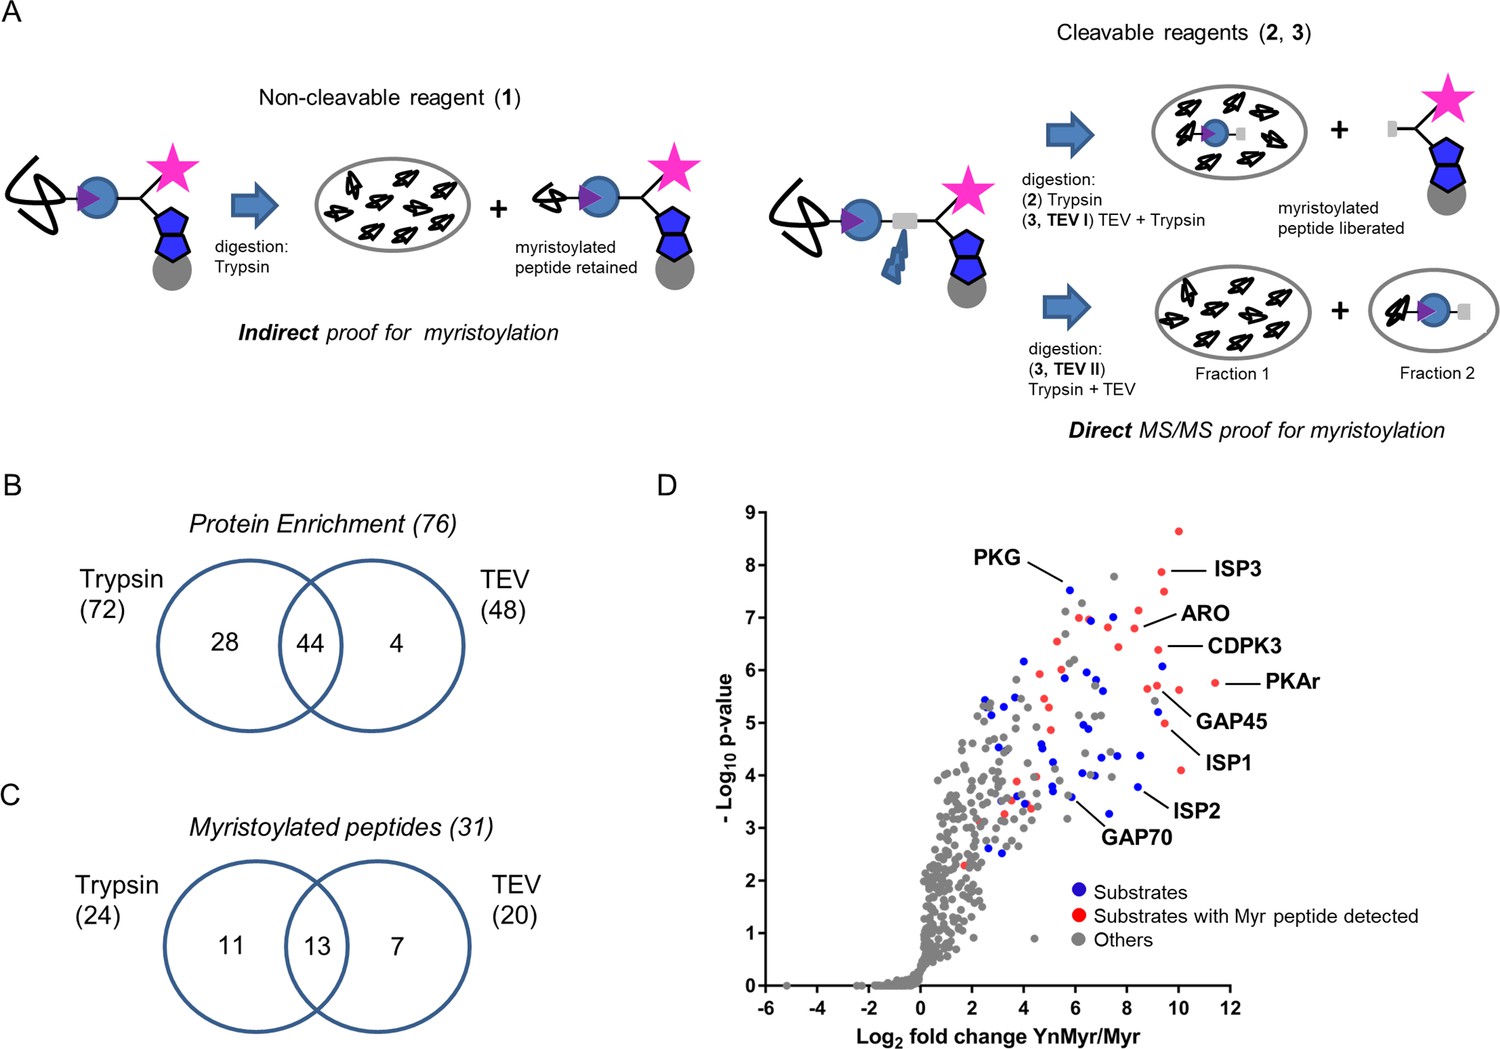
Identification of the YnMyr-enriched proteome in T. gondii.
(A) Schematic representation of the MS workflow using non-cleavable and cleavable capture reagents. (B) Venn diagram illustrating the overlap between significantly YnMyr-enriched proteins identified with capture reagents 2 and 3. The number of significantly enriched proteins per reagent and in total is given in parenthesis. (C) Venn diagram showing the overlap in myristoylated peptide discovery between the two cleavable capture reagents used in this study. The number of modified peptides identified with each reagent and in total is given in parenthesis. (D) Label free quantification of the log2 fold changes in YnMyr enrichment over the Myr control plotted against the statistical significance for all parasite proteins detected in this study using reagent 2. Proteins with N-terminal glycine and significant, base-insensitive enrichment with at least two capture reagents are highlighted in blue and red subject to the presence of a myristoylated peptide. All other identified proteins (YnMyr-enriched with only one reagent, background and GPI-anchors) are represented in grey. See also Figure 2—figure supplement 1, Supplementary file 1 and Supplementary file 2.
Figure 2—figure supplement 1
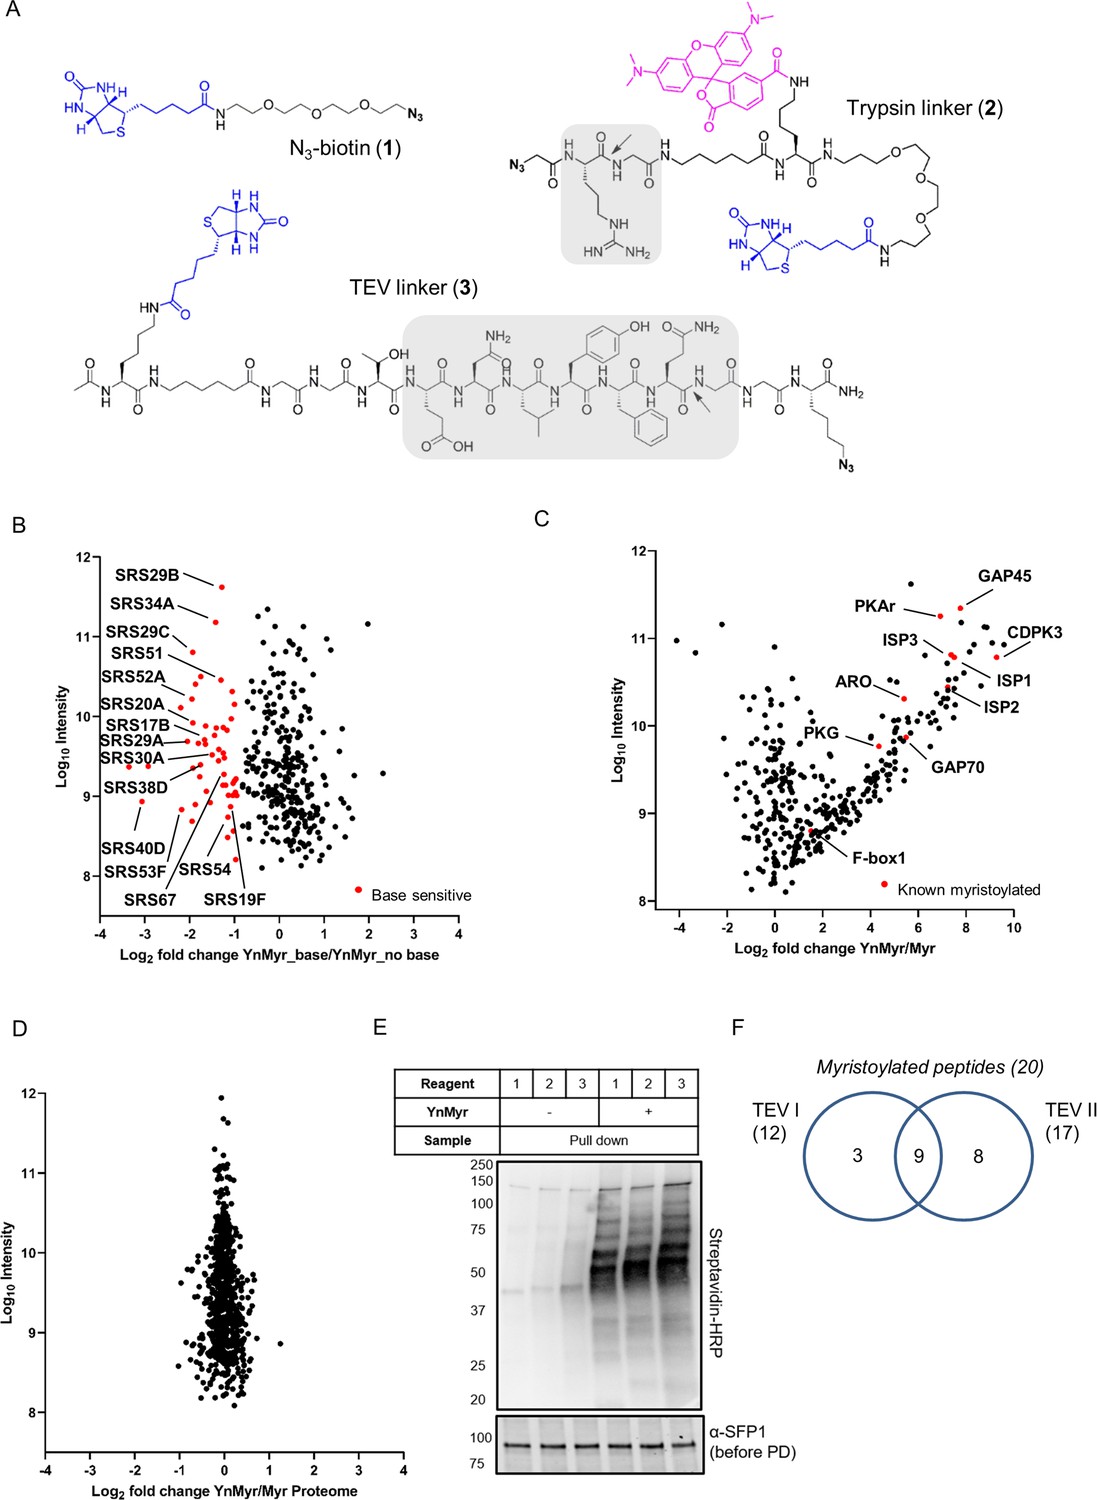
Identification of the YnMyr-enriched proteome in T. gondii.
(A) Structures of capture reagents used in this study with key functional components highlighted: biotin and azide moieties in blue and bold, respectively, cleavable linkers in grey with the cleavage site indicated by arrows (B) Label free quantification of YnMyr enrichment in base-treated vs untreated samples. Proteins with log2 fold change < −1 are assigned as base sensitive (YnMyr incorporation through ester bonds) and are highlighted in red. See also Supplementary file 1. (C) Label free quantification of YnMyr enrichment. Known myristoylated proteins used to determine enrichment threshold (log2 fold change > 2) are highlighted in red. See also Supplementary file 1. (D) Label free quantification of change in total protein abundance between YnMyr and Myr samples. See also Supplementary file 1. (E) Evaluation of YnMyr-dependent enrichment efficiency for capture reagents used in this study. Visualisation performed by western blotting with Streptavidin-HRP, SFP1 (TGGT1_289540) was used as loading control. (F) Venn diagram illustrating the overlap between myristoylated peptides identified with reagent 3 used in TEV I vs TEV II strategy. The number of peptides per strategy and in total is given in parenthesis.
Figure 3 with 1 supplement
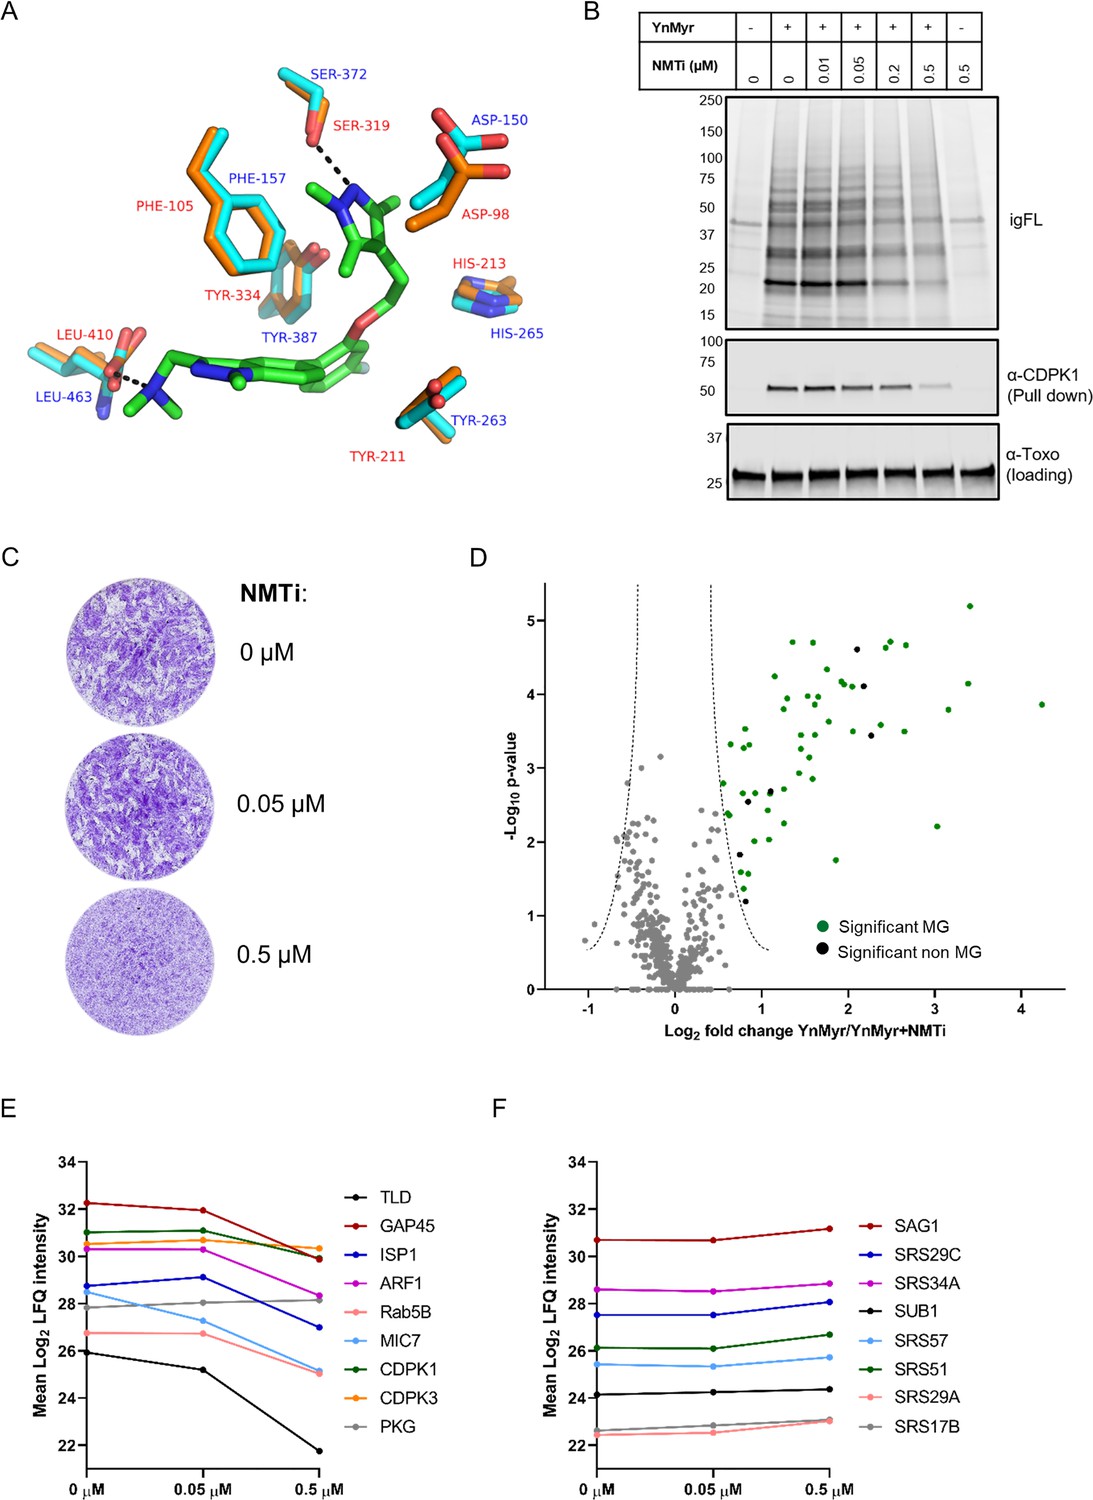
Chemical inhibition of TgNMT and substrate response.
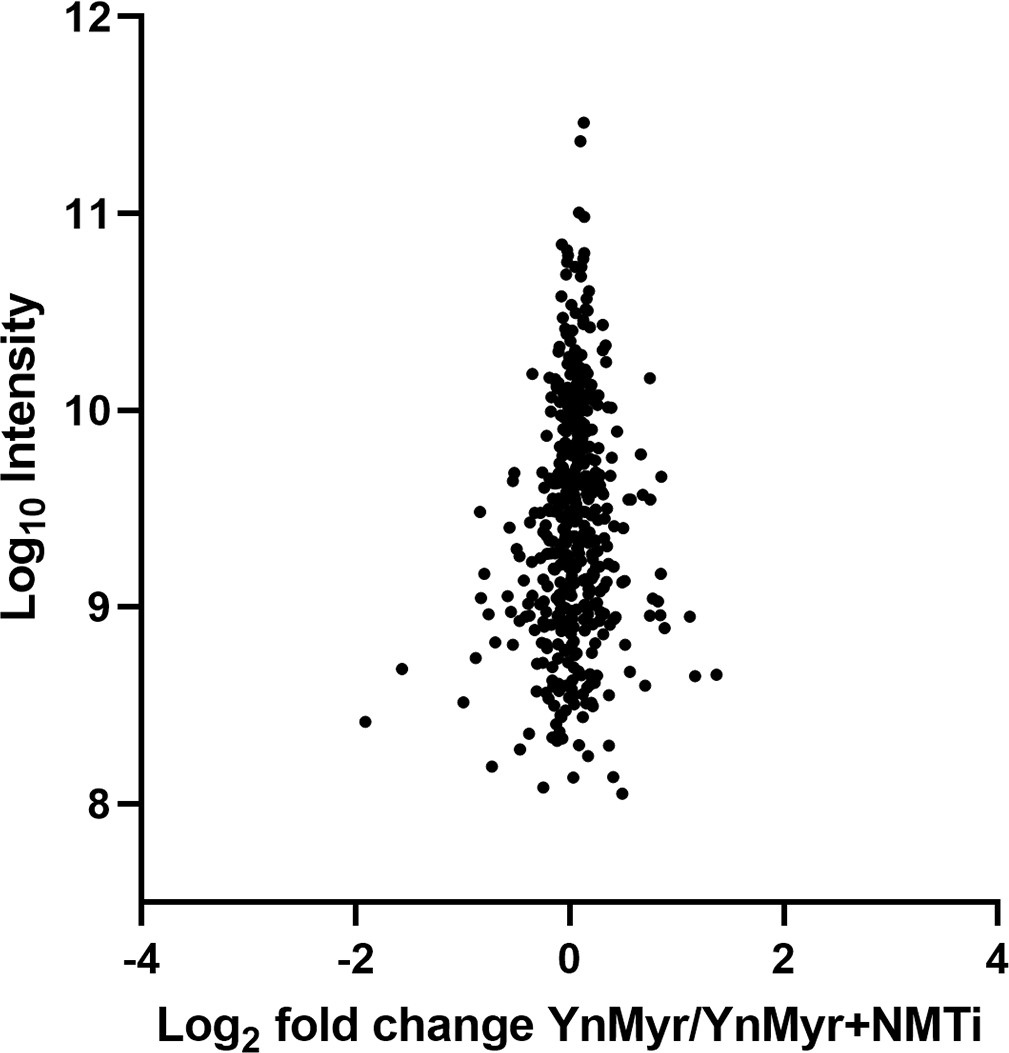
(A) Prediction of IMP-1002 interaction with TgNMT based on the PvNMT crystal structure. Crystal structure of the PvNMT (PDB: 6MB1, Schlott et al., 2019) active site (orange, red text) with IMP-1002 inhibitor bound, overlaid with a TgNMT model (cyan, blue text). Hydrogen bonds between key PvNMT residues (Serine and Leucine) and IMP-1002 are shown as black dashes. (B) Analysis of the dose response to IMP-1002 via igFL and by western blotting with CDPK1 – a substrate identified in this study. (C) Plaque assay illustrating differential killing of parasites and the host cells. The assay was performed for 5 days in three biological replicates, each in technical triplicate, representative images are shown. (D) Label free quantification of the YnMyr label incorporation into proteins in the presence of NMTi (0.5 µM) plotted against the statistical significance for all parasite proteins detected in this study. Proteins with a significant response and N-terminal glycine (MG) are highlighted in green, those without MG highlighted in black. (E) Dose response to NMTi plotted for selected proteins with significant YnMyr enrichment. (F) Dose response to NMTi plotted for selected SAG proteins assigned previously as base sensitive. See also Figure 3—figure supplement 1 and Supplementary file 3.
Figure 3—figure supplement 1
Chemical inhibition of TgNMT.
Label free quantification of change in total protein abundance between YnMyr- and NMTi-treated samples. See also Supplementary file 3.
Figure 4 with 1 supplement
The myristoylated proteome of Toxoplasma gondii.
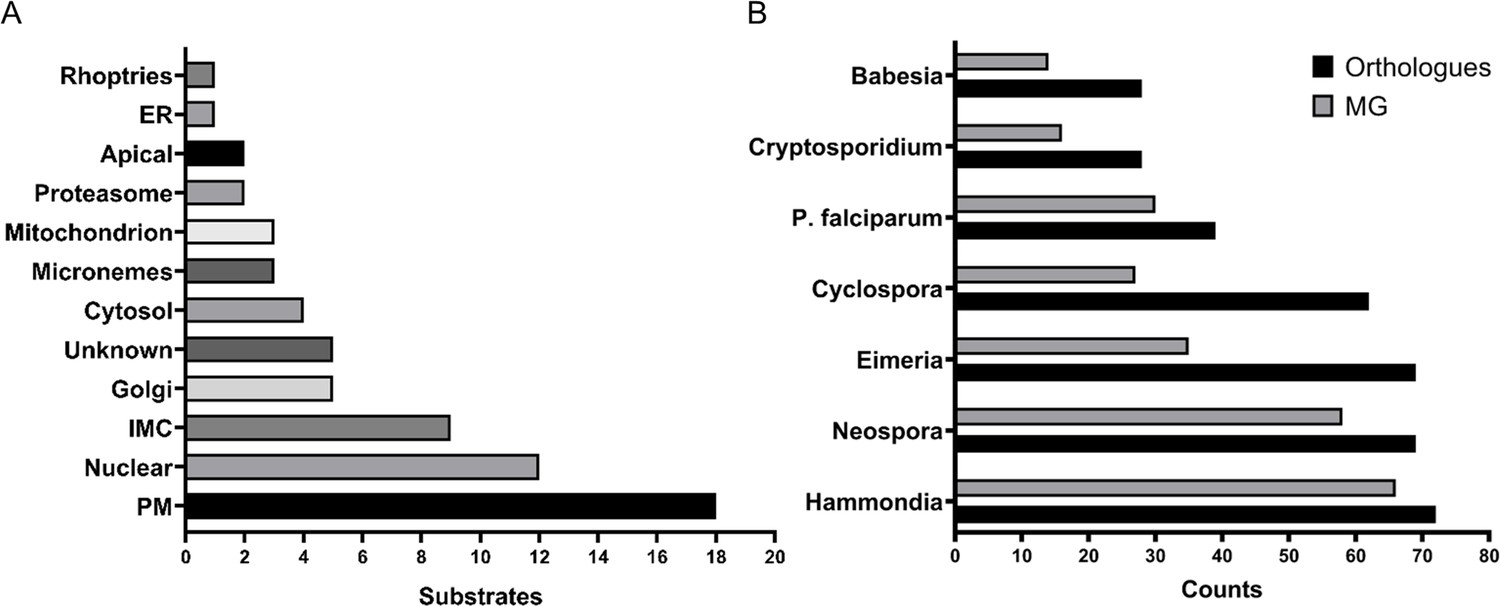
(A) Distribution of the subcellular localisation across our substrate list. Analysis performed using ToxoDB and the build in LOPIT predictor. (B) Substrate orthology within selected Apicomplexans. Analysis was performed using EuPathDB. See also Figure 4—figure supplement 1 and Supplementary file 4.
Figure 4—figure supplement 1
The myristoylated proteome of Toxoplasma gondii.
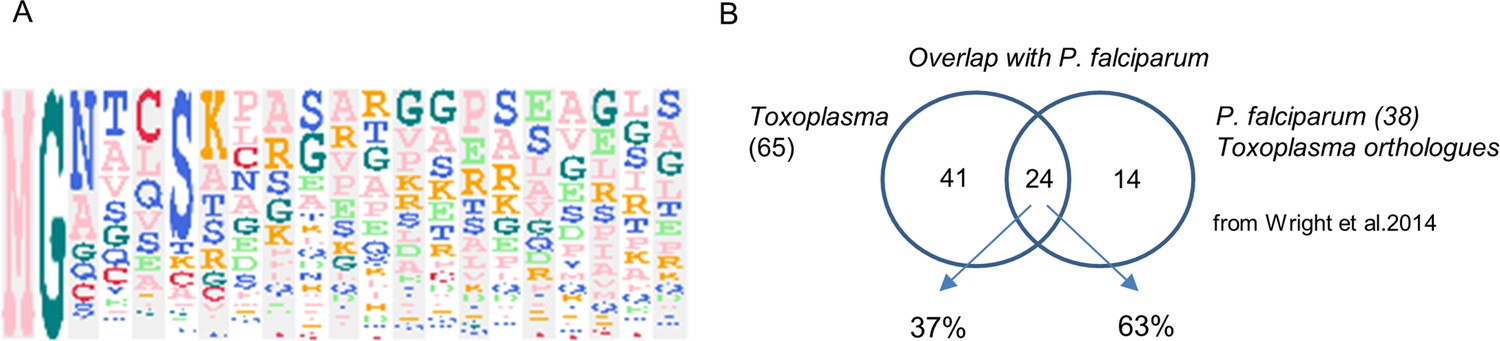
(A) Sequence logo illustrating the amino acid distribution within the 20 N-terminal residues of all targets. Amino acids at each position (1-20) are ordered by the frequency of occurrence. Sequence logo was created using the build-in tool within the Perseus software. (B) Venn diagram illustrating the overlap of the myristoylated proteome identified in this study with that of P. falciparum. See also Supplementary file 4.
Figure 5 with 1 supplement
MIC7 is myristoylated and is important for T. gondii lytic cycle.
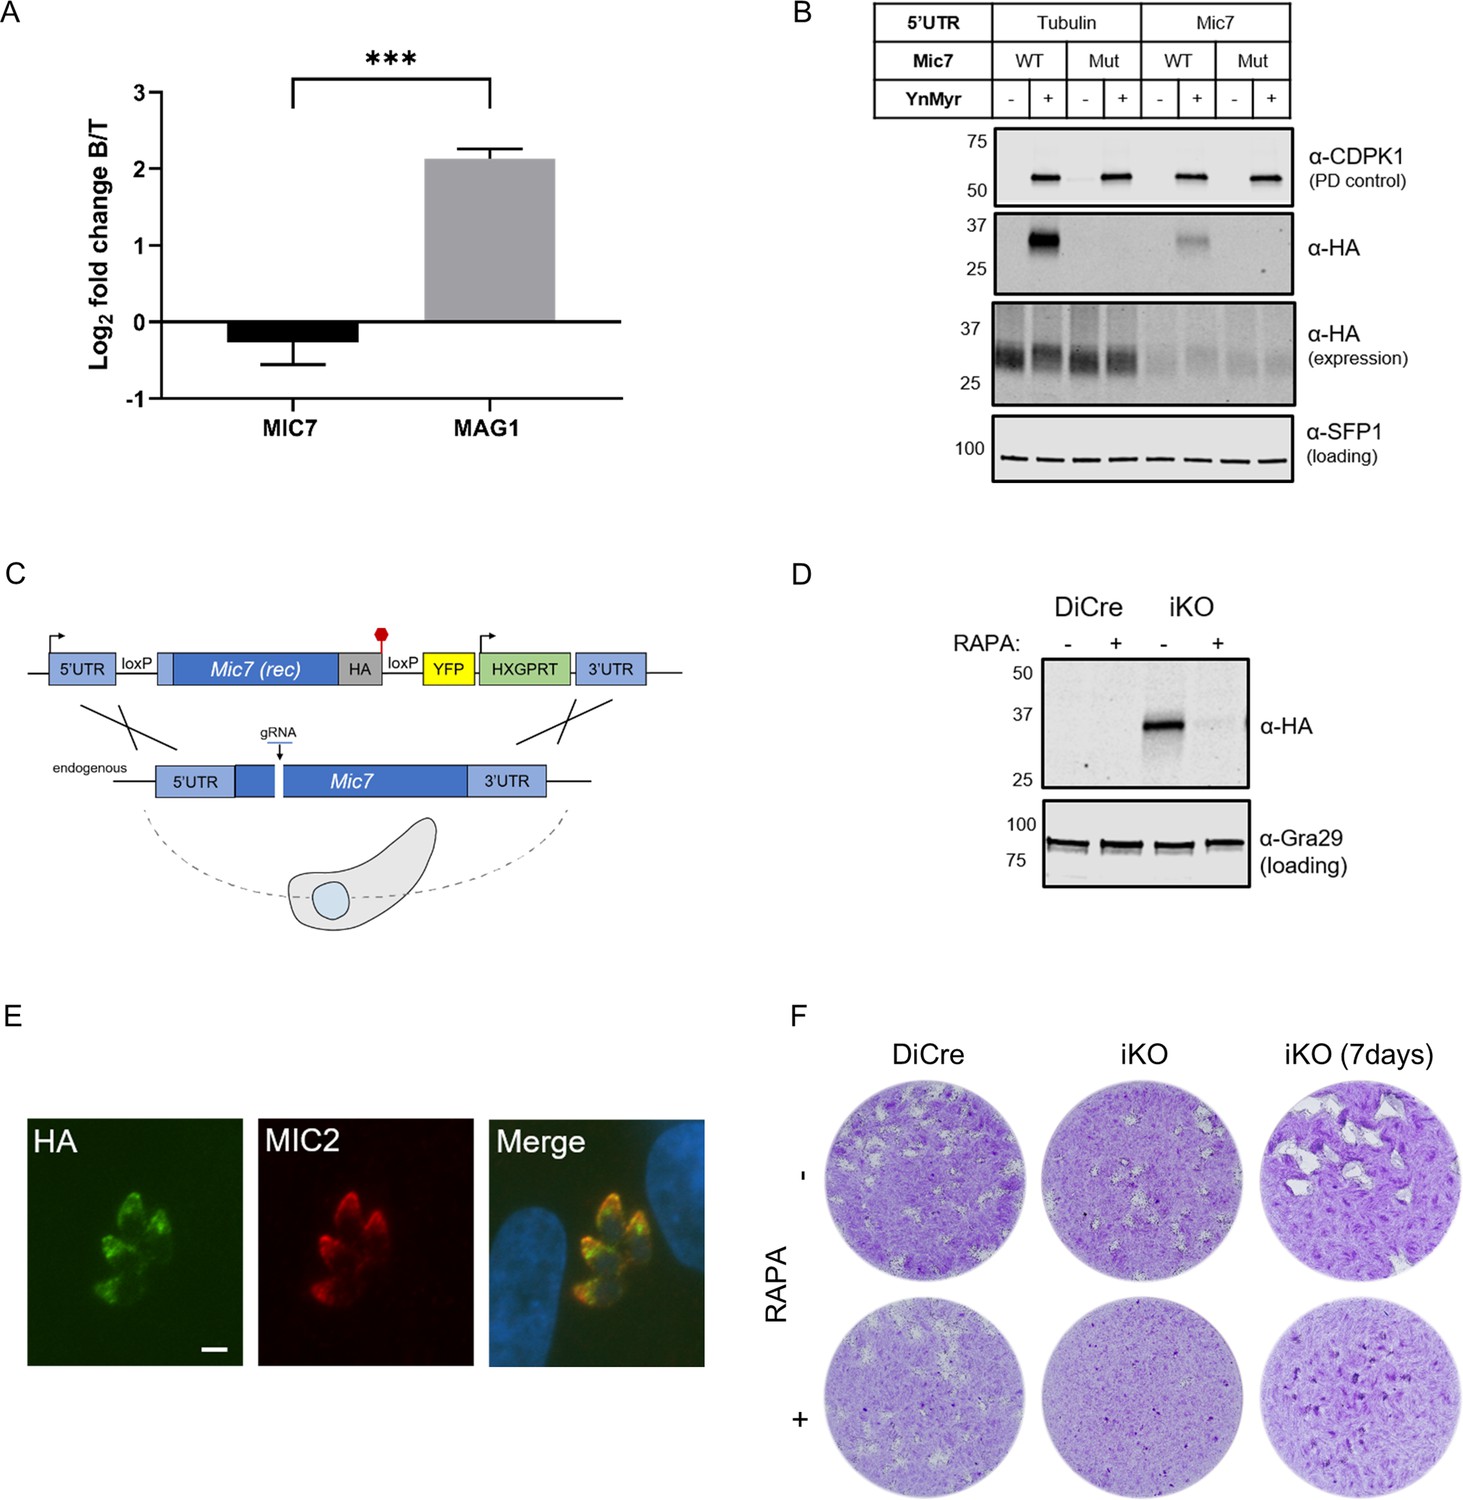
(A) MS-based quantification of MIC7 and MAG1 abundance in tachyzoites [T] and bradyzoites [B] of T. gondii. Significance calculated using two-tailed Student’s t-test, ***p=0.0002, N = 3, error bars represent standard deviation. (B) MIC7 is myristoylated as shown by YnMyr-dependent pull down and western blotting with α-HA antibody. CDPK1 and SFP1 (TGGT1_289540) are used as enrichment and loading controls, respectively. (C) Schematic representation of the DiCre/loxP-based iKO strategy used for the conditional depletion of Mic7. Red hexagon represents STOP codon, rec - recodonized. (D) Validation of RAPA-dependent depletion of MIC7HA in the iKO line illustrated by western blotting with α-HA antibody. Gra29 was used as loading control. (E) Co-localisation of MIC7HA (green) with the micronemal marker MIC2 (red) in the iKO line by immunofluorescence analysis. Scale bar: 3 µm. (F) Plaque assays illustrating that MIC7 is important, but not essential for the intracellular growth of Toxoplasma. Assay was performed for 5 days (where not indicated) in three biological replicates, each in technical triplicate, representative images are shown. See also Figure 5—figure supplement 1.
-
Figure 5—source data 1
Numerical data of the graph presented in Figure 5A.
- https://cdn.elifesciences.org/articles/57861/elife-57861-fig5-data1-v2.zip
Figure 5—figure supplement 1

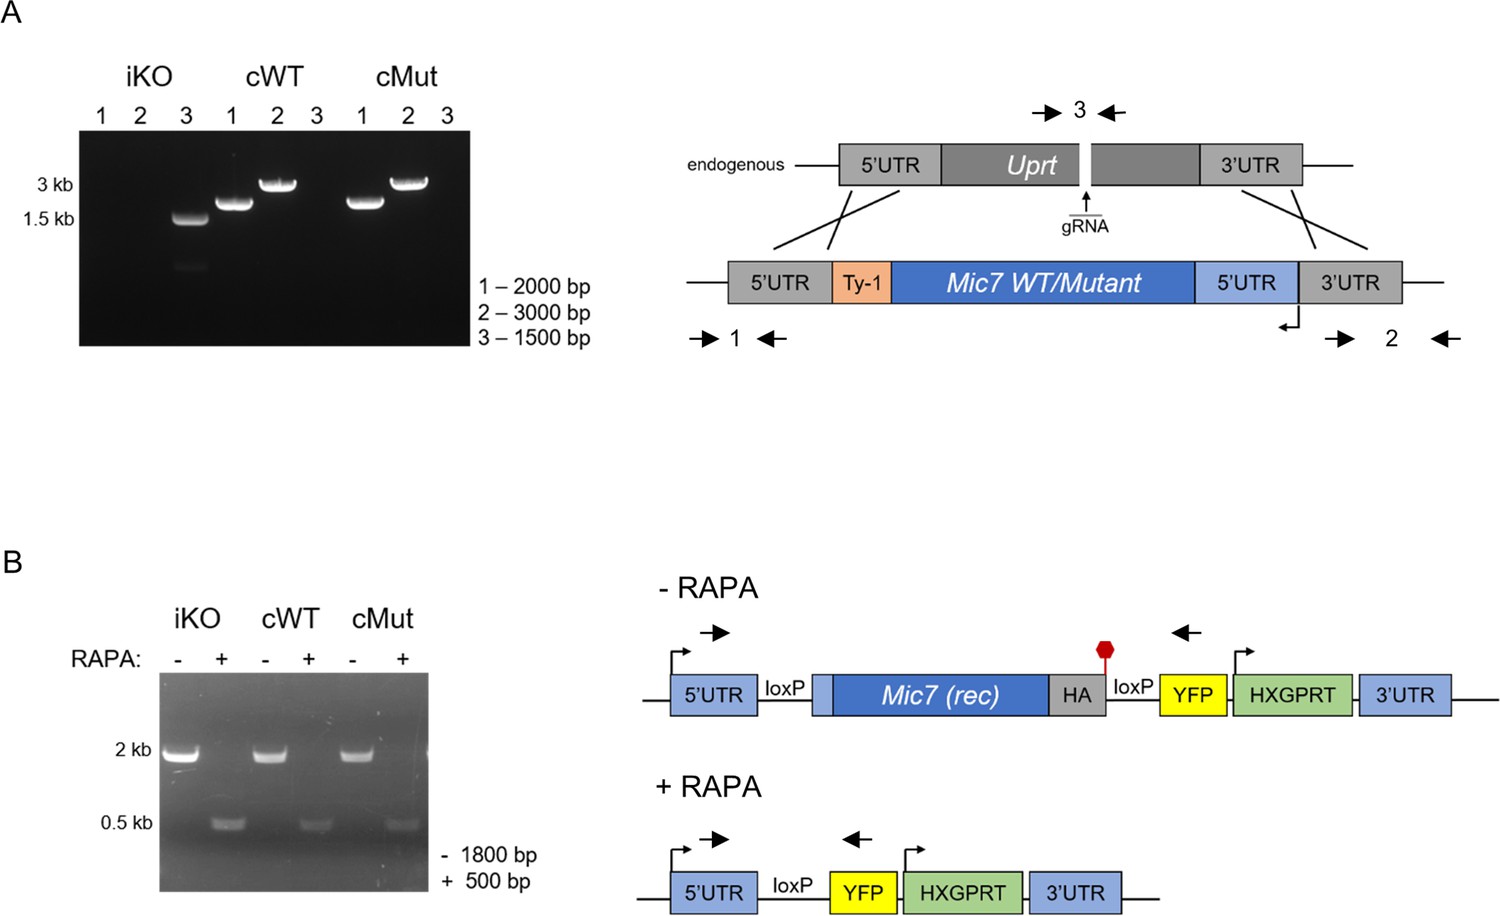
Inducible knock-out of MIC7.
(A) PCR analysis confirming correct integration of the floxed and recodonized version of Mic7 in the iKO line. Primers are indicated by arrows. Red hexagon represents STOP codon. bp – base pairs. (B) PCR analysis demonstrating that addition of rapamycin (RAPA) leads to correct excision of the floxed Mic7. Primers are indicated by arrows. Red hexagon represents STOP codon. bp – base pairs.
Figure 6 with 1 supplement
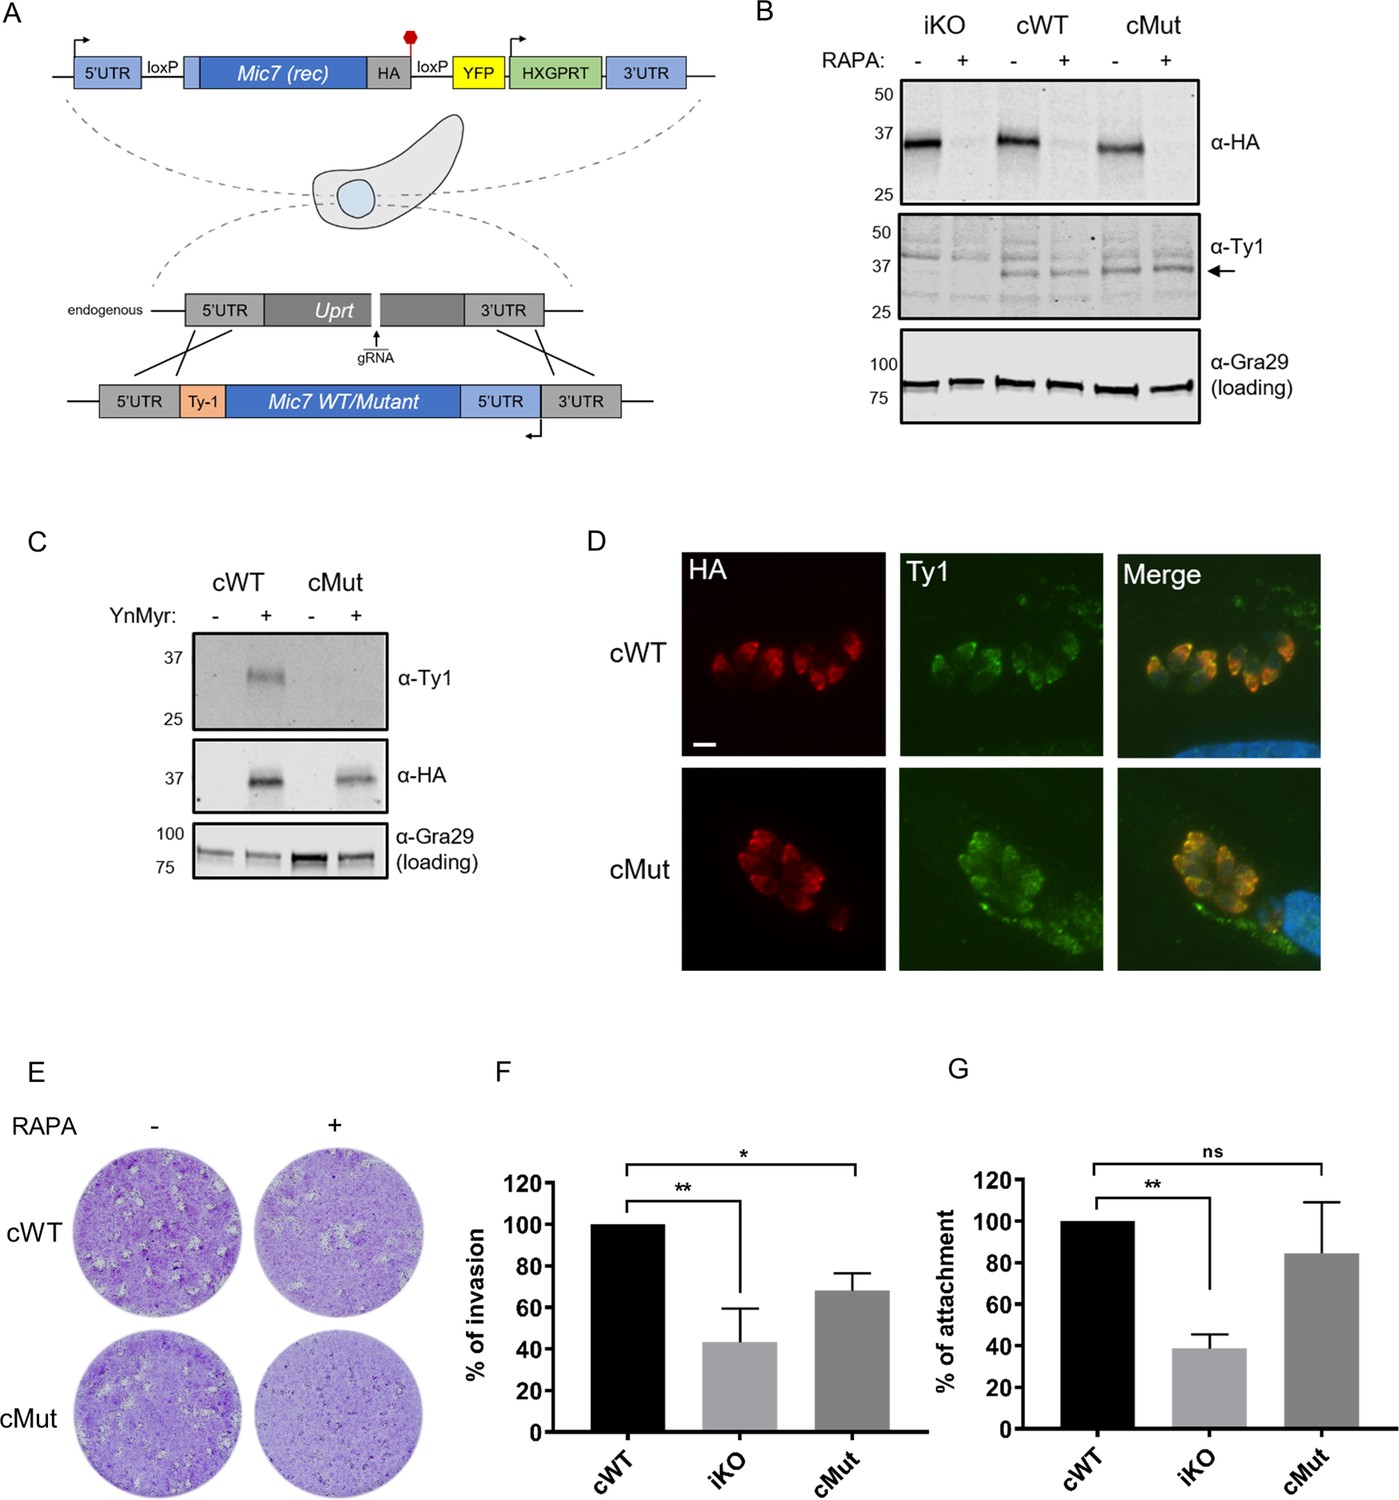
Myristoylation of MIC7 plays a role in the invasion of host cells.
(A) Complementation strategy used to evaluate the functional importance of MIC7 myristoylation. The orientation of cWT and cMut is reversed in the Uprt locus with the Ty1 tag at the C-terminus. Red hexagon represents STOP codon, rec – recodonized. (B) Western blot analysis demonstrating the RAPA-dependent depletion of MIC7HA in the iKO, cWT and cMut lines (α-HA) as well as equivalent and RAPA-independent expression of the complements (α-Ty1). Gra29 was used as loading control. (C) Biochemical validation of complemented lines by YnMyr-dependent pull down. Enrichment of WT and Mut copy of MIC7 was evaluated by western blotting with α-Ty1 antibody. MIC7HA (α-HA) and Gra29 were used as enrichment and loading controls, respectively. (D) Co-localisation of MIC7HA (red) with the cWT and cMut (green) by immunofluorescence analysis. Scale bar: 5 µm. (E) Plaque assay demonstrating that myristoylation of MIC7 is important in the intracellular growth of Toxoplasma. Assay performed for 5 days in three biological replicates, each in technical triplicate, representative images are shown. (F) Quantification of invasion efficiency in the RAPA-treated cWT, iKO and cMut lines. Figure shows the average of three biological replicates, each in technical duplicate, error bars represent standard deviation. Significance calculated using 1-way ANOVA with Dunnett’s multiple comparison test, **p=0.001, *p=0.018. (G) Quantification of attachment efficiency in the RAPA-treated cWT, iKO and cMut lines. Figure shows the average of three biological replicates, each in technical duplicate, error bars represent standard deviation. Significance calculated using 1-way ANOVA with Dunnett’s multiple comparison test, **p=0.004, ns = not significant. See also Figure 6—figure supplement 1.
-
Figure 6—source data 1
Numerical data of the graphs presented in Figure 6F and G.
- https://cdn.elifesciences.org/articles/57861/elife-57861-fig6-data1-v2.zip
Figure 6—figure supplement 1
Complementation of the MIC7 iKO line.
(A) PCR analysis confirming correct integration of the complementation constructs encoding the WT and myristoylation mutant (Mut) copies of Mic7 at the Uprt locus of the iKO line. Primers are indicated by arrows. bp – base pairs. (B) PCR analysis demonstrating that correct excision of the floxed Mic7 upon addition of rapamycin (RAPA) is retained in the cWT and cMut lines. Primers are indicated by arrows. Red hexagon represents STOP codon. bp – base pairs.
Figure 7 with 6 supplements
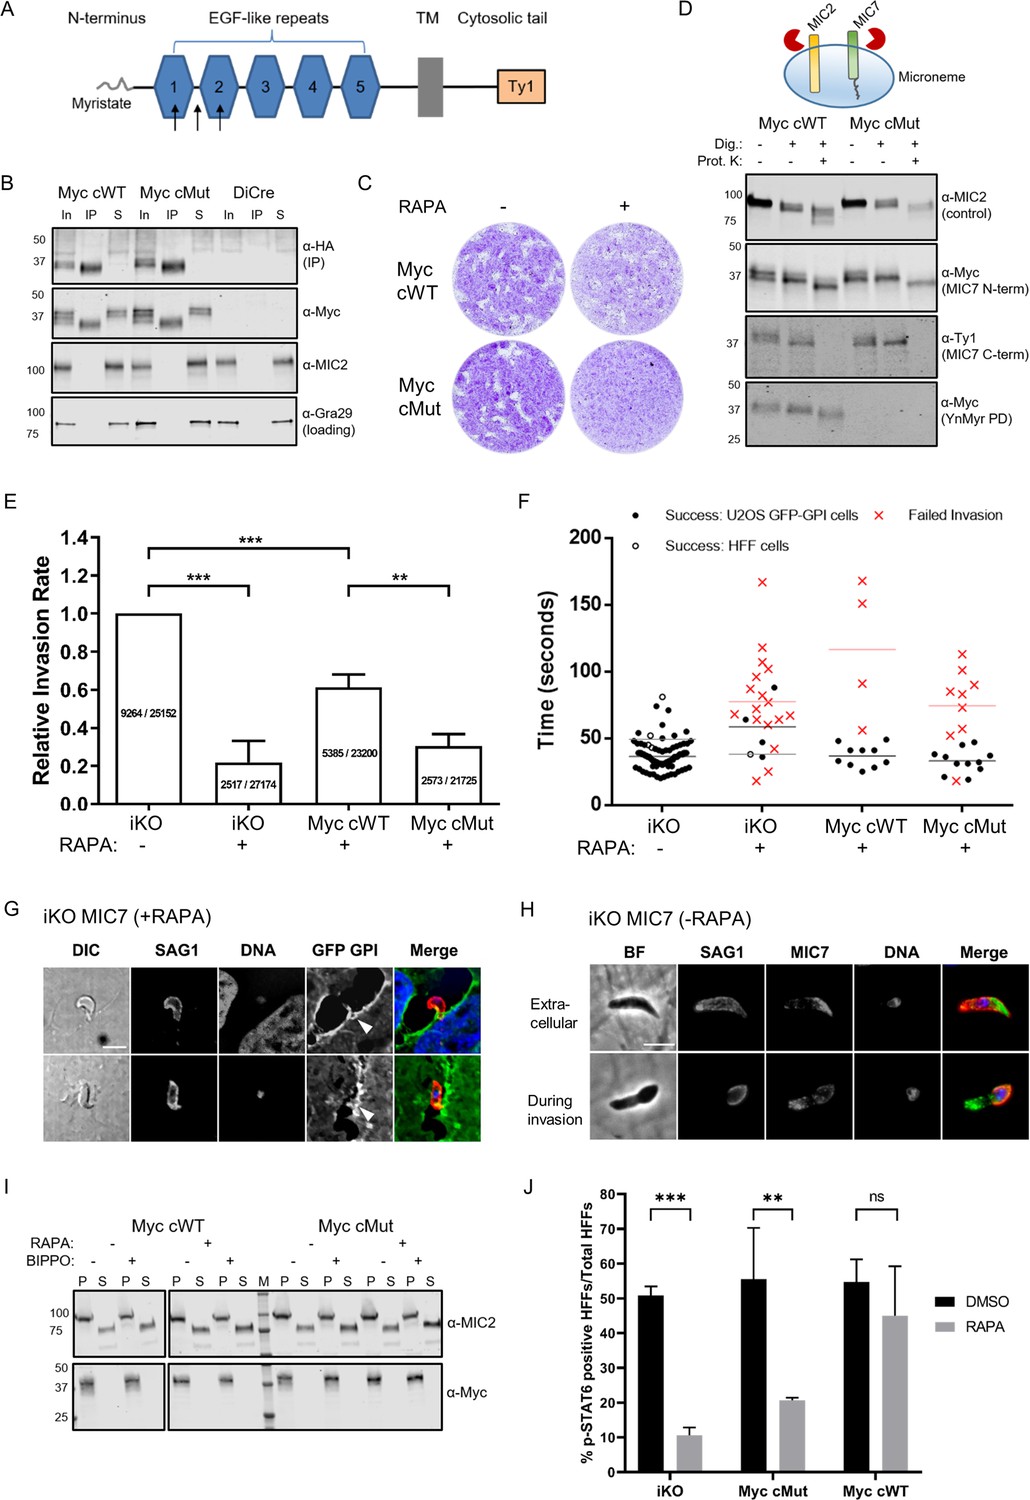
Functional analysis of MIC7 and its myristoylation in double tagged MIC7 lines.
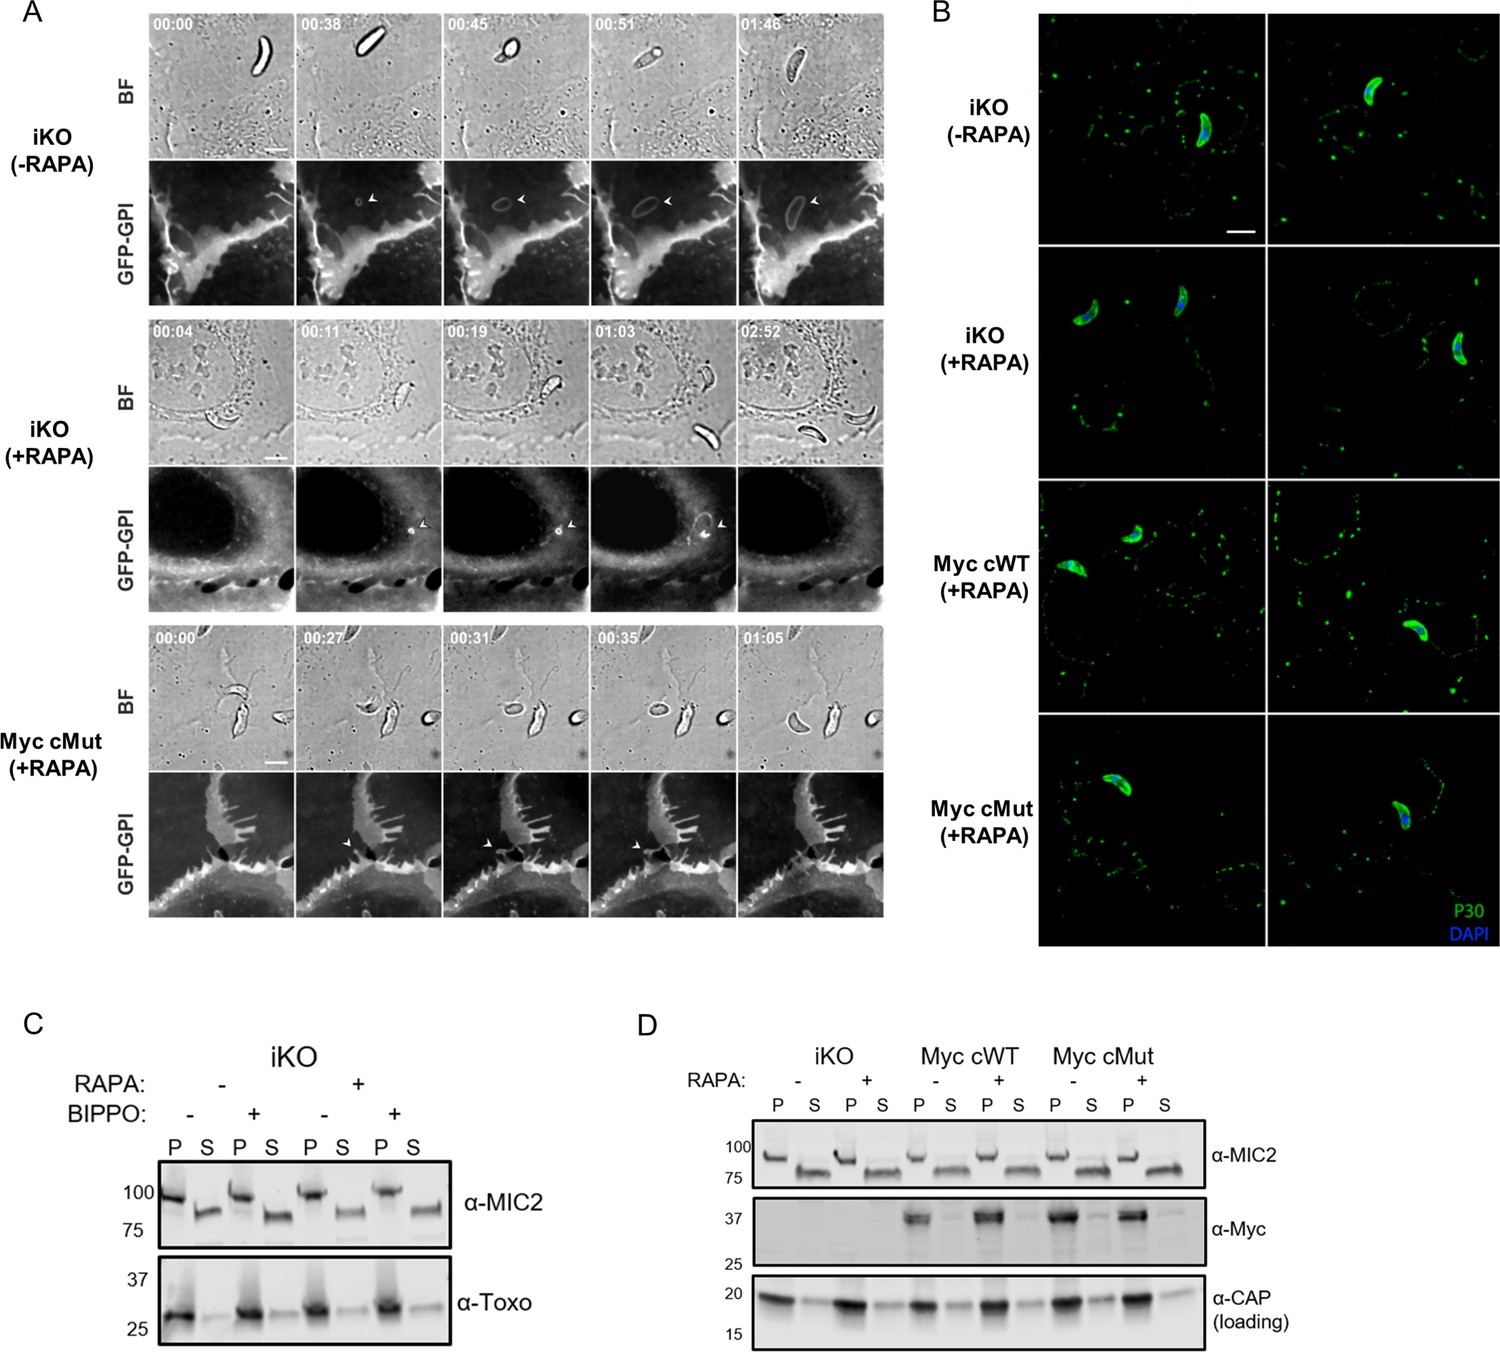
(A) Schematic representation of MIC7 domain structure with evaluated Myc tag positions indicated by arrows. (B) Western blot analysis showing co-immunoprecipitation of MyccWT and MyccMut (α-Myc) with MIC7HA (α-HA). MIC2 and Gra29 were used as controls for microneme solubilisation and equal loading, respectively; In = input, IP = immunoprecipitate, S = supernatant after IP. (C) Plaque assay confirming that myristoylation of MIC7 is important in the intracellular growth of Toxoplasma in the newly generated lines. Assay performed for 5 days in three biological replicates, each in technical triplicate, representative images are shown. (D) Proteinase K protection assay demonstrating that the N-terminus of MIC7 is myristoylated and protected (α-Myc) while the C-terminus is digested (α-Ty1) upon permeabilisation and protease treatment. MIC2 was used as a known control where the ectodomain is protected under similar conditions. Dig. = digitonin, Prot.K = proteinase K. (E) Quantitative large scale invasion assay. Results show the relative invasion rate as mean ± standard deviation calculated from three independent assays, each performed with five replicates. The total number of intracellular tachyzoites and human cells are indicated in each column. Two-tailed Student’s t-test was performed for two-group comparisons, ***p<0.0006, **p=0.0044. (F) Distribution of the successful/failed invasion times for each of the four genetic backgrounds. Mean invasion time is displayed for both HFF and U2OS host cells. (G) Representative immunofluorescence images (n = 45/68) demonstrating the characteristic bending of the conoid in extracellular RAPA-treated iKO parasites stained against the surface protein SAG1 (marking extracellular parasites and the extracellular part of invading tachyzoites only). It is also possible to observe the U2OS GFP-GPI membrane invagination at the vicinity of the extracellular parasites (white arrowheads). Scale bar: 5 μm. (H) Representative immunofluorescence images of untreated (-RAPA) iKO parasites while extracellular (n = 63) and during invasion (n = 22). Parasites were stained against SAG1 (marking extracellular parasites and the extracellular part of invading tachyzoites only) and α-HA to stain MIC7. Scale bar: 5 μm. (I) Analysis of MIC7 secretion upon stimulation with BIPPO. No shedding of MIC7 was observed (α-Myc) in contrast to MIC2 which was used as a control. P - pellet, S - supernatant containing the excreted secreted antigens, M – molecular weight marker. White space was used to indicate where gel lanes were not contiguous. (J) Immunofluorescence based quantification of pSTAT6 as a reporter for ROP16 secretion in all tested lines with and w/o RAPA treatment. Figure shows the average of three biological replicates, error bars represent standard deviation. Significance calculated using 2-way ANOVA with Sidak’s multiple comparison test, ***p=0.0004, **p=0.0013, ns = not significant. See also Figure 7—figure supplements 1 and 2.
-
Figure 7—source data 1
Numerical data of the graph presented in Figure 7E.
- https://cdn.elifesciences.org/articles/57861/elife-57861-fig7-data1-v2.zip
-
Figure 7—source data 2
Numerical data of the graph presented in Figure 7F.
- https://cdn.elifesciences.org/articles/57861/elife-57861-fig7-data2-v2.zip
-
Figure 7—source data 3
Numerical data of the graph presented in Figure 7J.
- https://cdn.elifesciences.org/articles/57861/elife-57861-fig7-data3-v2.zip
Figure 7—figure supplement 1
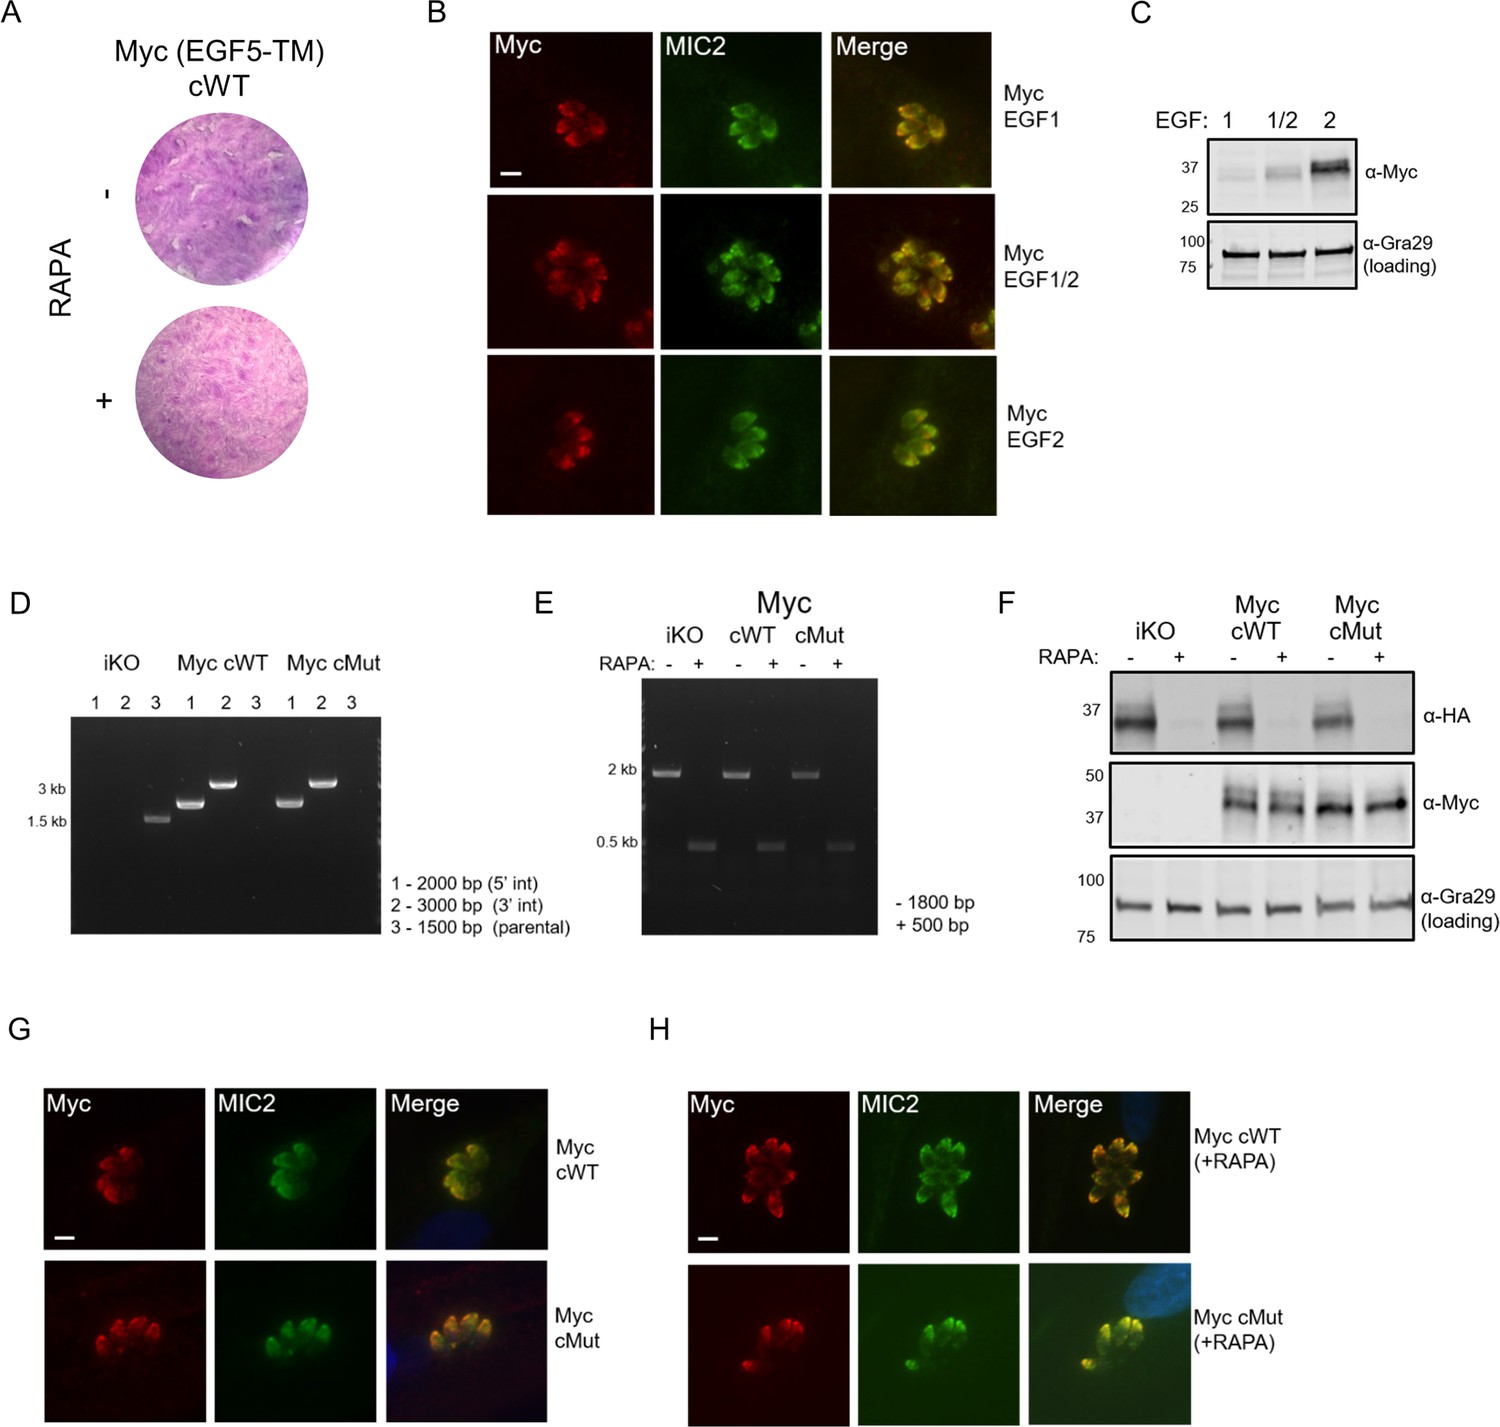
Generation of doubly-tagged MIC7 lines.
(A) Plaque assay confirming that introduction of Myc tag between EGF5 and TM domains of MIC7 yields non-functional protein. (B) Co-localisation of ectopically expressed Myc tagged MIC7 versions (red) with the MIC2 micronemal marker (green) by immunofluorescence analysis. Scale bar: 5 µm. (C) Western blot analysis of Myc tag expression within the three tested positions. Gra29 was used as a loading control. (D) PCR analysis confirming correct integration of the MyccWT and MyccMut copies of Mic7 at the Uprt locus of the iKO line, bp – base pairs. (E) PCR analysis demonstrating that correct excision of the floxed Mic7 upon addition of rapamycin (RAPA) is retained in the MyccWT and MyccMut lines. (F) Western blot analysis demonstrating the RAPA-dependent depletion of MIC7HA in the iKO, MyccWT and MyccMut lines (α-HA) as well as equivalent and RAPA-independent expression of the complements (α-Myc). Gra29 was used as a loading control. (G) Co-localisation of MyccWT and MyccMut (red) with the MIC2 micronemal marker (green) by immunofluorescence analysis. Scale bar: 5 µm. (H) Co-localisation of MyccWT and MyccMut (red) with the MIC2 micronemal marker (green) by immunofluorescence analysis in RAPA-treated lines. Scale bar: 5 µm.
Figure 7—figure supplement 2
Functional analysis of MIC7 and its myristoylation.
(A) Time lapses of bright-field (BF) and green fluorescent channel (GFP-GPI) showing successful/failed invasions of tachyzoites in U2OS cells that express a GFP-GPI marker. The marker allows tracking the plasma membrane (PM) when it locally remodels (white arrowheads). PM stretching and then shrinking while the parasite successfully invades (iKO (-RAPA)). PM invagination which is indicative of the zoite-cell junction for failed invasions (iKO (+RAPA) and MyccMut (+RAPA)). Scale bar: 5 μm, time is indicated in minutes:seconds format. (B) Gliding analysis by trail deposition assay. Two representative frames of the coverslips are shown for each genetic background. Scale bar: 5 μm. (C) Analysis of BIPPO-induced microneme secretion in the iKO line (-/+ RAPA) showing no defect in MIC2 secretion upon MIC7 KO. α-Toxoplasma - loading control, P - pellet, S - supernatant containing the excreted secreted antigens. (D) Analysis of MIC7 secretion upon invasion of host cells. No shedding of MIC7 was observed (α-Myc) in contrast to MIC2 which was used as a control. α-CAP was used as a loading control. P - pellet, S - supernatant containing the excreted secreted antigens.
Figure 7—video 1
Related to Figure 7F.
MIC7HA tachyzoite enters a GFP-GPI U2OS cell. Invasion proceeds with the typical invagination of the host cell plasma membrane that initiates the folding of the nascent parasitophorous vacuole while the tachyzoite smoothly enters through the parasite-host cell junction, and this with a usual kinetics. Scale: 5 μm.
Figure 7—video 2
Related to Figure 7F.
Early abortive invasion of a GFP-GPI U2OS cell by a MIC7HA-treated tachyzoite (+RAPA). The tachyzoite apex starts to engage into the host cell membrane promoting a narrow and limited invagination of the latter but the tachyzoite does not position properly and rapidly withdraws from the invagination while host cell membrane projections can be seen extending along the tachyzoite body. Eventually, the tachyzoite escapes from the cell membrane and exhibits typical circular and twirling gliding behaviour. Scale: 5 μm.
Figure 7—video 3
Related to Figure 7F.
MyccWT-treated tachyzoite (+RAPA) enters a GFP-GPI U2OS cell. Invasion proceeds with the same features and kinetics as for the MIC7HA tachyzoite. The parasite passes though the constricted parasite-zoite junction and enters into the budding nascent parasitophorous vacuole. Scale: 5 μm.
Figure 7—video 4
Related to Figure 7F.
Early abortive invasion of a GFP-GPI U2OS cell by a MyccMut-treated tachyzoite (+RAPA). The tachyzoite engages the conoid into the cell membrane, which locally invaginates, but does not proceed further and instead markedly deforms prior to eventually disengaging from the cell. Scale: 5 μm.
Tables
Key resources table
| Reagent type (species) or resource | Designation | Source or reference | Identifiers | Additional information |
|---|---|---|---|---|
| Synthetic Gene (Toxoplasma gondii) | Microneme protein 7 (MIC7) | GeneArt, Life Technologies | TGGT1_261780 (http://toxodb.org) | Floxed and HA tagged sequence |
| Cell line (Homo sapiens) | Human foreskin fibroblasts (HFFs) | ATCC | Cat# SCRC-1041, RRID:CVCL_3285 | The cell line is available from the American Type Culture Collection (ATCC) |
| Cell line (Toxoplasma gondii) | RH ∆ku80 ∆hxgprt | Huynh and Carruthers, 2009 | Used in all mass spectrometry experiments | |
| Cell line (Toxoplasma gondii) | RH DiCre ∆ku80 ∆hxgprt | Hunt et al., 2019 | The second-generation DiCre-expressing cell line in Toxoplasma gondii | |
| Cell line (Toxoplasma gondii) | iKO MIC7; RH DiCre ∆ku80 ∆hxgprt_LoxMic7_HA | This paper | The endogenous Mic7 gene was replaced with a floxed and HA-tagged Mic7 gene | |
| Cell line (Toxoplasma gondii) | cWT MIC7 | This paper | As described for the iKO MIC7 line, however a Mic7-Ty1 expressing construct was integrated into the UPRT locus. | |
| Cell line (Toxoplasma gondii) | cMut MIC7 | This paper | As described for the iKO MIC7 line, however a Mic7(G2K/G3A)-Ty1 expressing construct was integrated into the UPRT locus. | |
| Cell line (Toxoplasma gondii) | Myc cWT MIC7 | This paper | As described for the cWT MIC7 line, however a Myc-Mic7-Ty1 expressing construct was integrated into the UPRT locus. | |
| Cell line (Toxoplasma gondii) | Myc cMut MIC7 | This paper | As described for the cMut MIC7 line, however a Myc-Mic7(G2K/G3A)-Ty1 expressing construct was integrated into the UPRT locus. | |
| Antibody | Rat anti-HA monoclonal clone 3F10 | Roche | Cat# 11867423001 RRID:AB_390919 | WB (1:1000) IFA (1:1000) |
| Antibody | Mouse anti-Myc monoclonal clone 4A6 | Millipore | Cat# 05–724 RRID:AB_11211891 | WB (1:1000) IFA (1:1000) |
| Antibody | Mouse anti-Ty1 monoclonal clone BB2 | Thermo Fisher | Cat# MA5-23513 RRID:AB_2610644 | WB (1:2000) IFA (1:500) |
| Antibody | Mouse anti-Toxoplasma monoclonal clone TP3 | Abcam | Cat# ab8313 RRID:AB_306466 | WB (1:1000) |
| Antibody | Mouse anti-MIC2 monoclonal clone 6D10 | other | Provided by Vernon Carruthers Lab WB (1:1000) | |
| Antibody | Rabbit anti-MIC2 polyclonal | other | Provided by Vernon Carruthers Lab WB (1:500) IFA (1:5000) | |
| Antibody | Rabbit anti-TgCAP polyclonal | Hunt et al., 2019 | WB (1:2000) | |
| Antibody | Rabbit anti-Gra29 polyclonal | Young et al., 2020 | WB (1:1000) | |
| Antibody | Rabbit anti-SFP1 polyclonal | Young et al., 2020 | WB (1:1000) | |
| Antibody | Mouse anti-CDPK1 polyclonal | other | Provided by Matthew Child and Matt Bogyo WB (1:3000) | |
| Antibody | Rabbit anti-SAG1 monoclonal | other | Provided by John Boothroyd Lab WB (1:10,000) | |
| Antibody | Rabbit anti-GAP45 polyclonal | other | Provided by Peter Bradley Lab WB (1:1000) | |
| Antibody | Rabbit anti-phospho-Stat6 polyclonal | Cell Signaling | Cat# 9361 RRID:AB_331595 | IFA (1:600) |
| Chemical compound | Myristic acid (Myr) | Tokyo Chemical Industry | Cat# M0476 | |
| Chemical compound | Alkyne-myristic acid (YnMyr) | Iris Biotech | Cat# RL-2055 | |
| Chemical compound | Azide-PEG3-biotin (N3-biotin) | Sigma-Aldrich | Cat# 762024 | Capture reagent 1 |
| Chemical compound | Trypsin cleavable reagent | Broncel et al., 2015 | The reagent used here was synthesised in-house by the Peptide Chemistry science technology platform, The Francis Crick Institute | |
| Chemical compound | TEV cleavable reagent | Speers and Cravatt, 2005 | The reagent used here was synthesised in-house by the Peptide Chemistry science technology platform, The Francis Crick Institute | |
| Chemical compound | IMP-1002 | Schlott et al., 2019 | The reagent used here was synthesised by the Tate Laboratory, Imperial College London | |
| Chemical compound | Rapamycin | Sigma-Aldrich | Cat# R8781 | |
| Chemical compound | 5-Benzyl-3-isopropyl-1H-pyrazolo[4,3-d]pyrimidin-7(6H)-one (BIPPO) | Howard et al., 2015 | The reagent used here was synthesised in-house by the Peptide Chemistry science technology platform, The Francis Crick Institute | |
| Software, algorithm | MaxQuant (version 1.5.0.25 and 1.5.2.8) | Cox and Mann, 2008 | RRID:SCR_014485 | Free software for searching of mass spectrometry acquisition files |
| Software, algorithm | Perseus (version 1.5.0.9) | Tyanova et al., 2016 | RRID:SCR_015753 | Free software for processing of MaxQuant output files |
| Software, algorithm | PyMOL (version 1.3r1) | Schrodinger LLC | RRID:SCR_000305 | Commercial software for molecular visualisation |
| Software, algorithm | Prism 8 (version 8.1.1) | GraphPad Software, Inc | RRID:SCR_002798 | Commercial software for statistical analysis |
Additional files
-
Supplementary file 1
related to Figure 2.
Identification of base-dependent YnMyr enrichment in T. gondii. Sheet 1: Toxoplasma proteins with YnMyr intensities quantified irrespective of base treatment. Sheet 2: Proteins with base-sensitive enrichment. Sheet 3: MG proteins insensitive to base treatment and robustly enriched in a YnMyr-dependent manner with N3-biotin reagent (1). Sheet 4: Analysis of proteomes (supernatants post enrichment).
- https://cdn.elifesciences.org/articles/57861/elife-57861-supp1-v2.xlsx
-
Supplementary file 2
related to Figure 2.
Identification of myristoylated proteins and myristoylated peptides in T. gondii. Sheet 1: Toxoplasma proteins bearing the MG motif. Sheet 2: Substrates significantly enriched with Trypsin reagent (2). Sheet 3: Substrates selected based on fold change in YnMyr/Myr enrichment with TEV reagent (3). Sheet 4: Myristoylated peptides found with Trypsin reagent (2). Sheet 5: Myristoylated peptides found with TEV reagent (3). Sheet 6: Human proteins bearing the MG motif. Sheet 7: Human substrates significantly enriched with Trypsin and TEV reagents.
- https://cdn.elifesciences.org/articles/57861/elife-57861-supp2-v2.xlsx
-
Supplementary file 3
related to Figure 3.
Chemical inhibition of TgNMT. Sheet 1: Response of YnMyr enriched Toxoplasma proteins to NMTi. Sheet 2: NMTi does not significantly affect Toxoplasma proteome. Sheet 3: Response of base-sensitive Toxoplasma proteins to NMTi. Sheet 4: Response of YnMyr enriched Human proteins to NMTi. Sheet 5: NMTi does not significantly affect Human proteome.
- https://cdn.elifesciences.org/articles/57861/elife-57861-supp3-v2.xlsx
-
Supplementary file 4
related to Figure 4.
Myristoylated proteome of T. gondii. Sheet 1: Substrate list and annotation. Sheet 2: Myristoylated proteins in P. falciparum and their orthologues in Toxoplasma. Sheets 3–9: Substrate orthologues in selected Apicomplexans.
- https://cdn.elifesciences.org/articles/57861/elife-57861-supp4-v2.xlsx
-
Supplementary file 5
related to Figure 5.
MIC7 expression in tachyzoites and bradyzoites.
- https://cdn.elifesciences.org/articles/57861/elife-57861-supp5-v2.xlsx
-
Supplementary file 6
Primers used for plasmid and parasite lines generation.
- https://cdn.elifesciences.org/articles/57861/elife-57861-supp6-v2.xlsx
-
Transparent reporting form
- https://cdn.elifesciences.org/articles/57861/elife-57861-transrepform-v2.docx
Download links
A two-part list of links to download the article, or parts of the article, in various formats.
Downloads (link to download the article as PDF)
Open citations (links to open the citations from this article in various online reference manager services)
Cite this article (links to download the citations from this article in formats compatible with various reference manager tools)
Profiling of myristoylation in Toxoplasma gondii reveals an N-myristoylated protein important for host cell penetration
eLife 9:e57861.
https://doi.org/10.7554/eLife.57861


