Complement opsonization of HIV affects primary infection of human colorectal mucosa and subsequent activation of T cells
- Division of Molecular Medicine and Virology, Department of Clinical and Experimental Medicine, Linköping University, Sweden
- Division of Surgery, Orthopedics and Oncology, Linköping University, Sweden
- Center of Excellence for Research in AIDS (CERiA), University of Malaya, Lembah Pantai, Malaysia
- Division of Infection Biology and Medical Microbiology, Department of Life Sciences, Central University of Tamil Nadu, India
- Department of Clinical Immunology and Transfusion Medicine and Department of Clinical and Experimental Medicine, Linköping University, Sweden
Figures
Figure 1 with 3 supplements
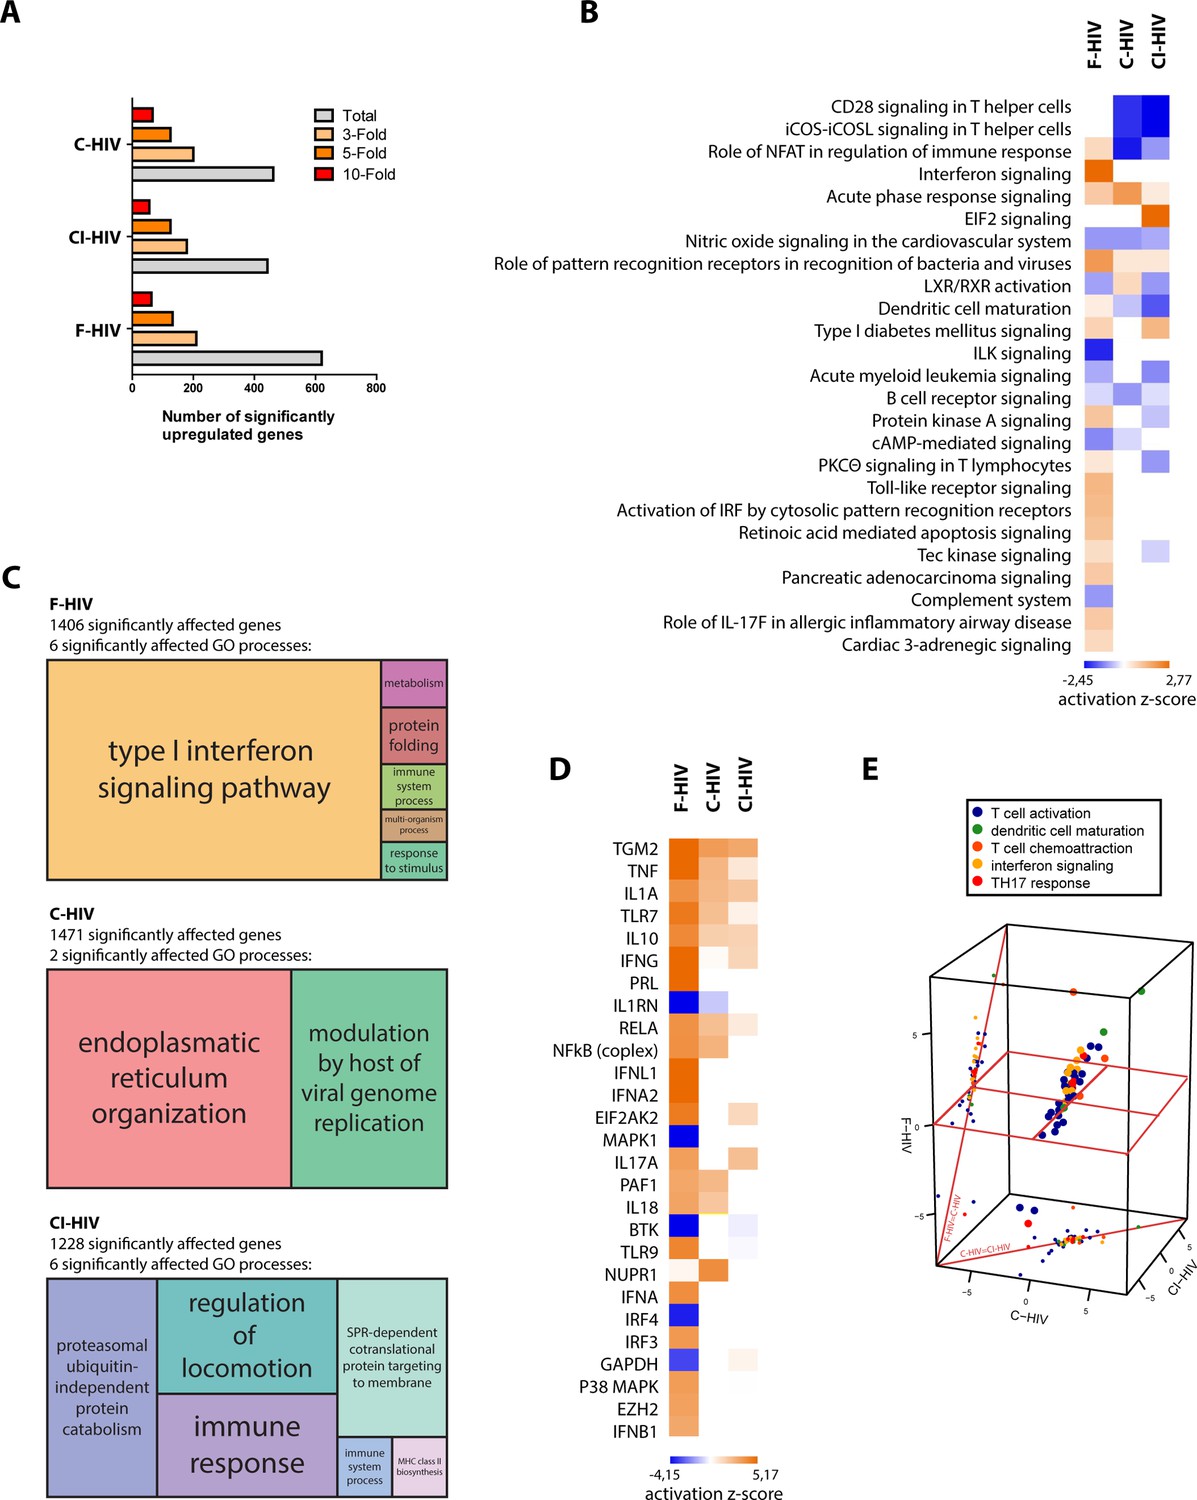
HIV-induced activation of innate and inflammatory pathways in colorectal mucosa with high level of antiviral factors in F-HIV.
The colorectal tissue biopsies were exposed to HIV-1BaL (250 ng/mL), either free (F-HIV), complement-opsonized (C-HIV), or virions opsonized by a cocktail of complement and antibodies (CI-HIV) or mock-treated, by spinning the cultures for 2 hr at 37°C. The tissues were washed and transferred to six-well plates and cultured for 24 hr. The tissues and emigrated cells were harvested and whole transcriptome sequencing was performed. (A) Analyses of amount of significantly upregulated or down regulated genes assessing total, 3-fold, 5-fold, and 10-fold of upregulated changes as compared to mock. (B) Canonical pathways affected by the HIV exposure were assessed by IPA and presented as a heat map with the threshold for p-values set to log 1.3 and presented as activation Z-score and with a Z-score cutoff of 3. (C) Gene enrichment analysis was done in R with an algorithm from REVIGO where all fold changes were ranked of genes affected with p<0.05. (D) Analysis of upstream regulators affected by the HIV exposure was assessed by IPA and presented as a heat map with an activation Z score of 3 or higher. (E) The top upstream regulators were divided into functional groups and a 3D scatterplot was used to visualize clustering. The division of genes after function was down in IPA including only genes with p<0.05 and the 3D scatterplot is made in plat3D in R (N = 6). *p<0.05, **p<0.001, ***p<0.0001. Data is shown as mean ± SEM.
Figure 1—figure supplement 1
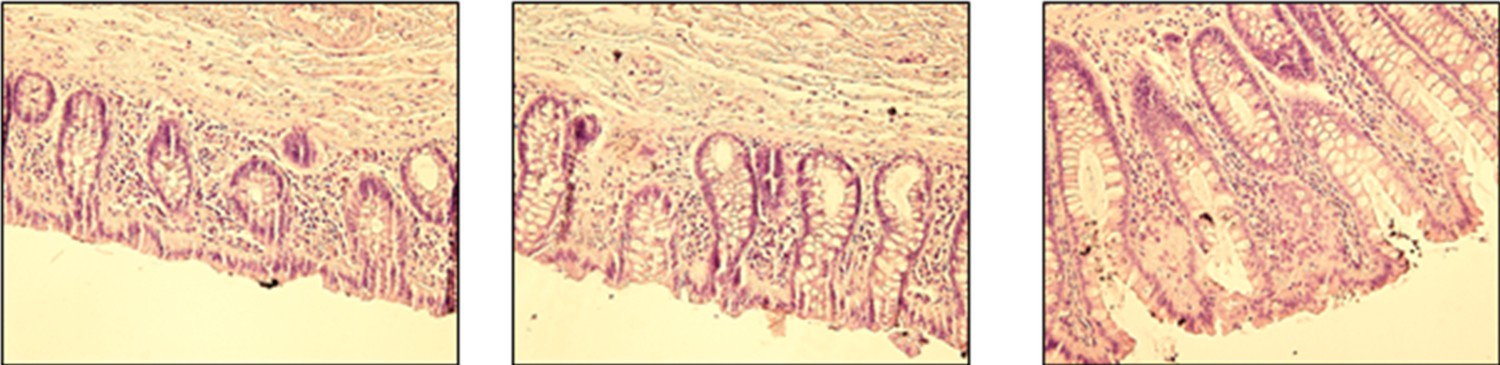
Histological images of colonic mucosa.
Representative histological images from three different donors of hematoxylin-eosin staining of sections from colonic mucosa used in the study. Original magnification 50x.
Figure 1—figure supplement 2
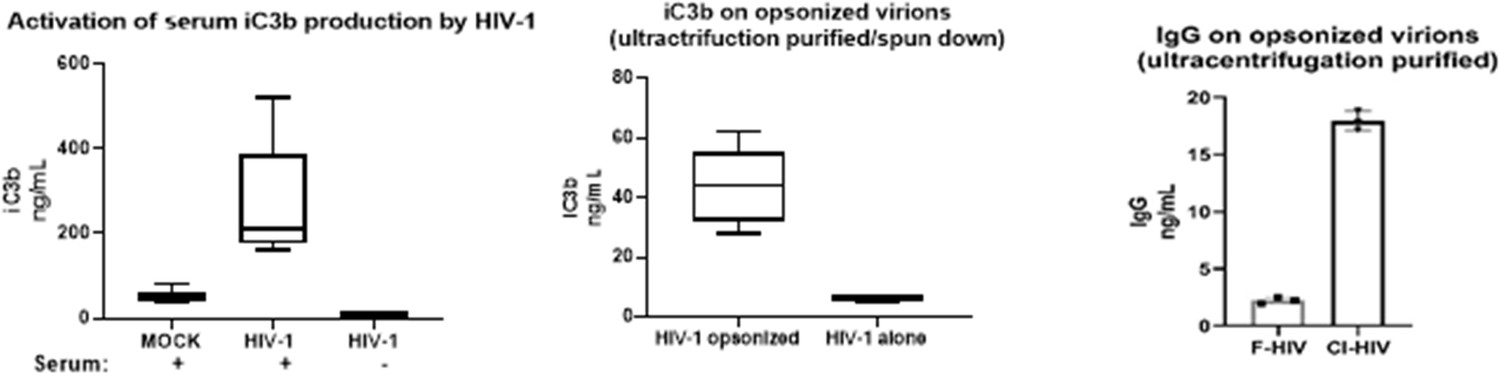
Complement and IgG opsonization of HIV-1.
(A) The generation of iC3b was assessed in serum incubated without HIV-1 (MOCK) or in serum incubated with HIV-1 for 1 hr at 37°C. HIV-1 alone without serum was used as a control. The levels of iC3b generated in the serum during the opsonization of HIV-1 were measured by iC3b ELISA. (B–C) The amount of iC3b or IgG bound to HIV-1 virions opsonized in serum or in serum and immunoglobulins for 1 hr at 37°C was assessed by purification of the virions by ultracentrifugation, which removed serum and free iC3b and antibodies after the opsonization. The viral pellets were resuspended and lysed and levels of iC3b (B) or IgG (C) measured by ELISA Single donor serums from three different donors were used.
Figure 1—figure supplement 3
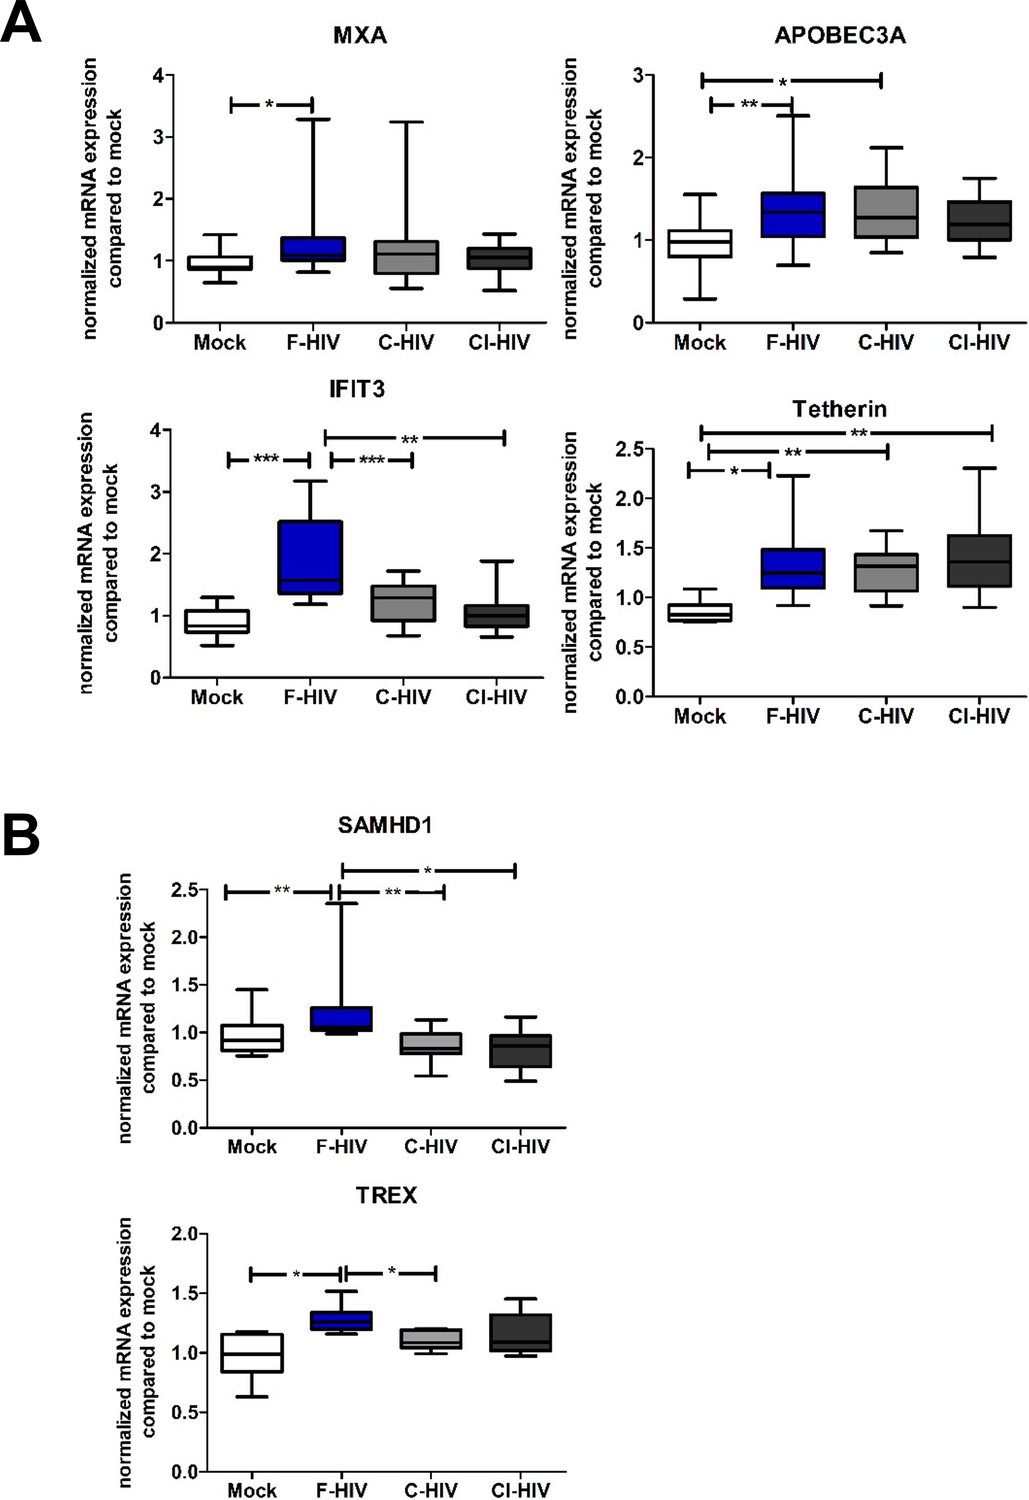
Complement opsonization elevated the antiviral and HIV regulatory factors in colorectal tissue.
Mucosal immune cells isolated from the colorectal tissue biopsies by enzymatic digestion were exposed to HIV-1BaL, either free (F-HIV), complement opsonized (C-HIV), or virions opsonized by a cocktail of complement and antibodies (CI-HIV) or mock-treated, by spinning the cultures. After 24 hr mRNA expression levels of (A) MXA, IFIT3, APOBEC3A, Tetherin (B) SAMHD1 and TREX were assessed by qPCR. To compensate for variation between plates, the values were normalized as described by Rieu and Powers, 2009. Data were normalized to mock set as 1 (N = 10–12). Statistical significance was tested using a two-sided paired t-test.*p<0.05, **p<0.01, ***p<0.001. Data are shown as mean ± SEM.
Figure 2 with 1 supplement
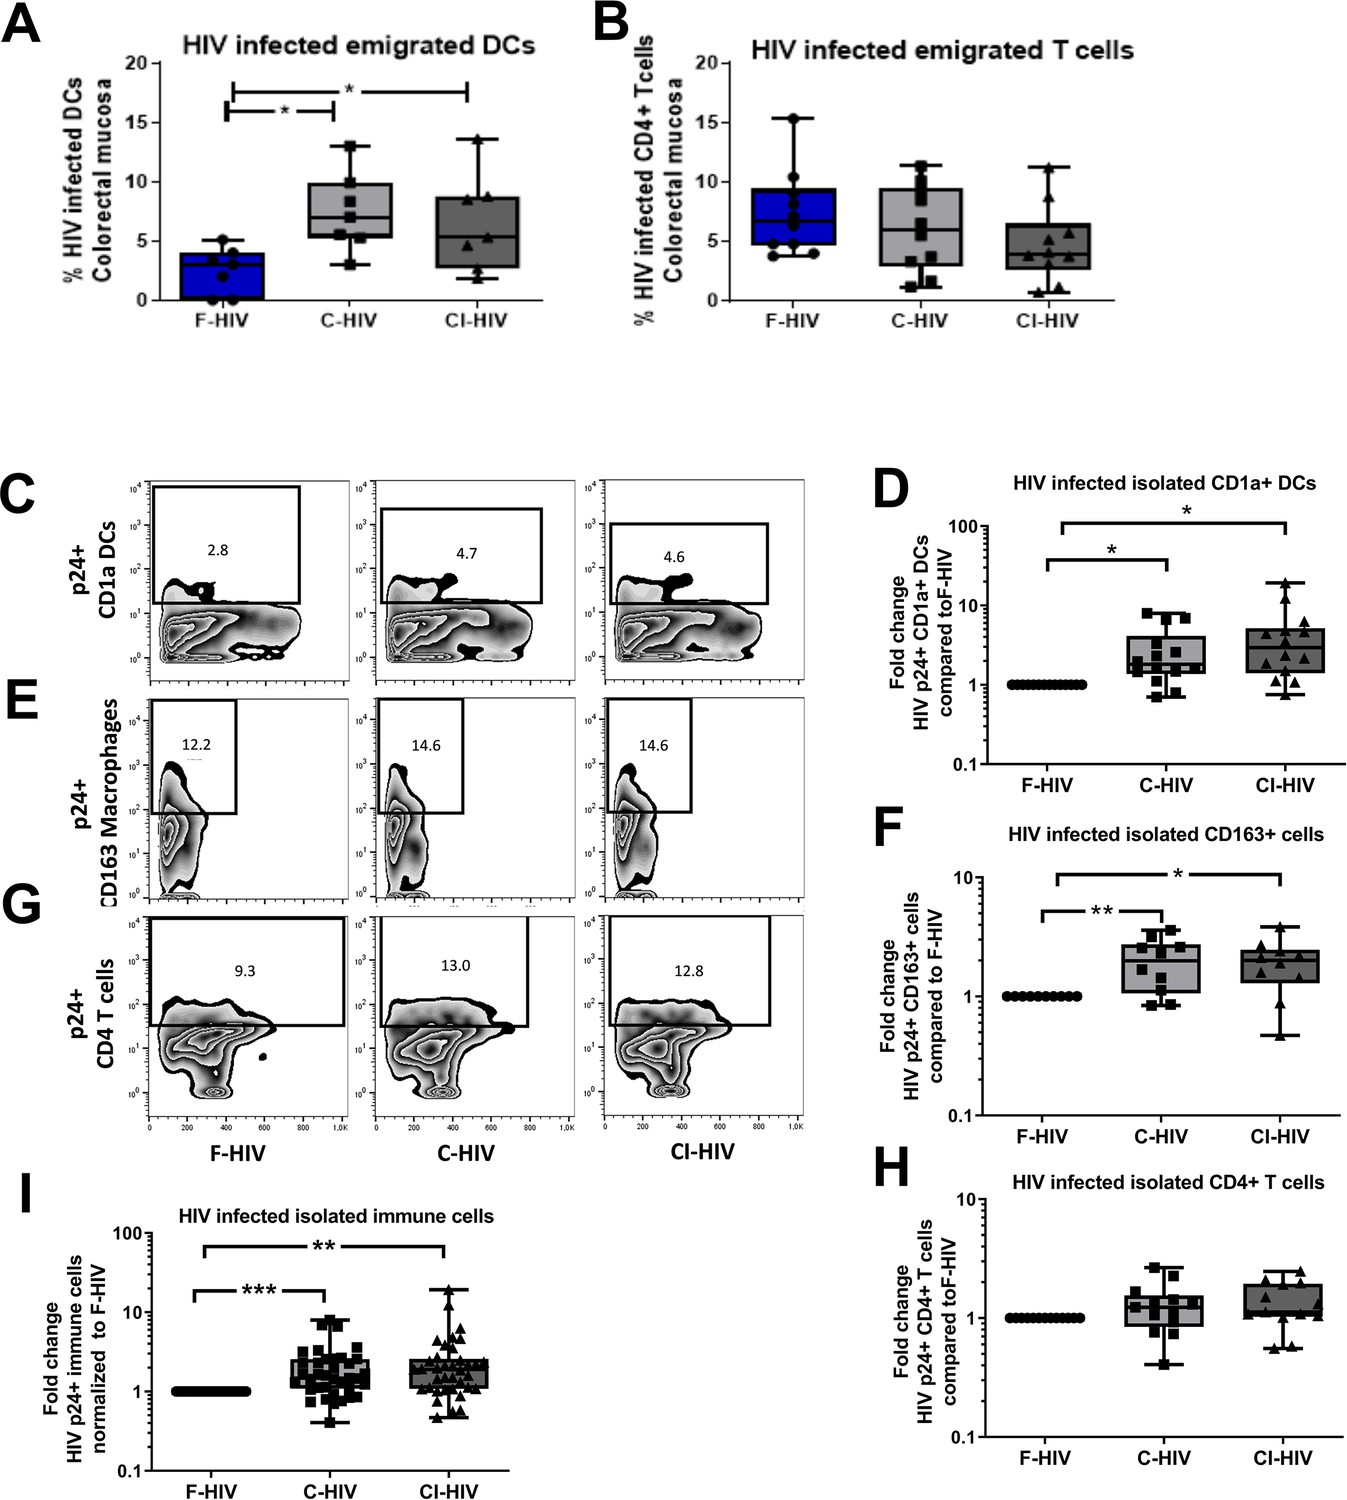
Complement opsonization elevated the levels of HIV-infected colorectal mucosal immune cells.
The colorectal tissue biopsies were exposed to HIV-1BaL (250 ng/mL), either free (F-HIV), complement-opsonized (C-HIV), or virions opsonized by a cocktail of complement and antibodies (CI-HIV) or mock-treated, by spinning the cultures for 2 hr at 37°C. The tissues were washed and transferred to six-well plates and cultured for 4–5 days. (A, B) The emigrating cells were harvested and stained with (A) anti-CD1a and anti-HIV-1 mAbs for DCs, and (B) anti-CD3, anti-CD4, and anti-HIV-1 mAbs for CD4+ T cells and the level of infection was assessed by flow cytometry (N = 7–8). (C–G) Mucosal immune cells isolated from the colorectal tissue biopsies by enzymatic digestion were exposed to d HIV-1BaL, either free (F-HIV), complement-opsonized (C-HIV), or virions opsonized by a cocktail of complement and antibodies (CI-HIV) or mock-treated, by spinning the cultures. The level of HIV infection (C, E, and G) and fold change of HIV infected cells compared to F-HIV infection levels (D, F, and H) were assessed after 4 days. The immune cells were stained with (C–D) anti-CD1a and anti-HIV-1 mAbs for DCs, (E–F) anti-CD163 and anti-HIV-1 mAbs for macrophages (G–H), and anti-CD3, anti-CD4, and anti-HIV-1 mAbs for CD4+ T cells and the level of infection was assessed by flow cytometry (N = 11–15). The fold change of all HIV infected immune cells combined compared to F-HIV infection levels was assessed after 4 days (I). Statistical significance was tested using repeated measures of ANOVA followed by Tukey's posttest (A–B) and One-tailed Paired T-test (D, F, H, and I). *p<0.05, **p<0.01, ***p<0.001. Data are shown as mean ± SEM. Zebra plots of (C) CD1a-DC, (E) CD163-Macrophages and (G) CD4-T cells are representative of one individual. DCs, Macrophages and T cells infected with HIV were identified based on percentage populations of CD1a+p24+, CD163+p24+ and CD4+p24+ cells, respectively.
Figure 2—figure supplement 1
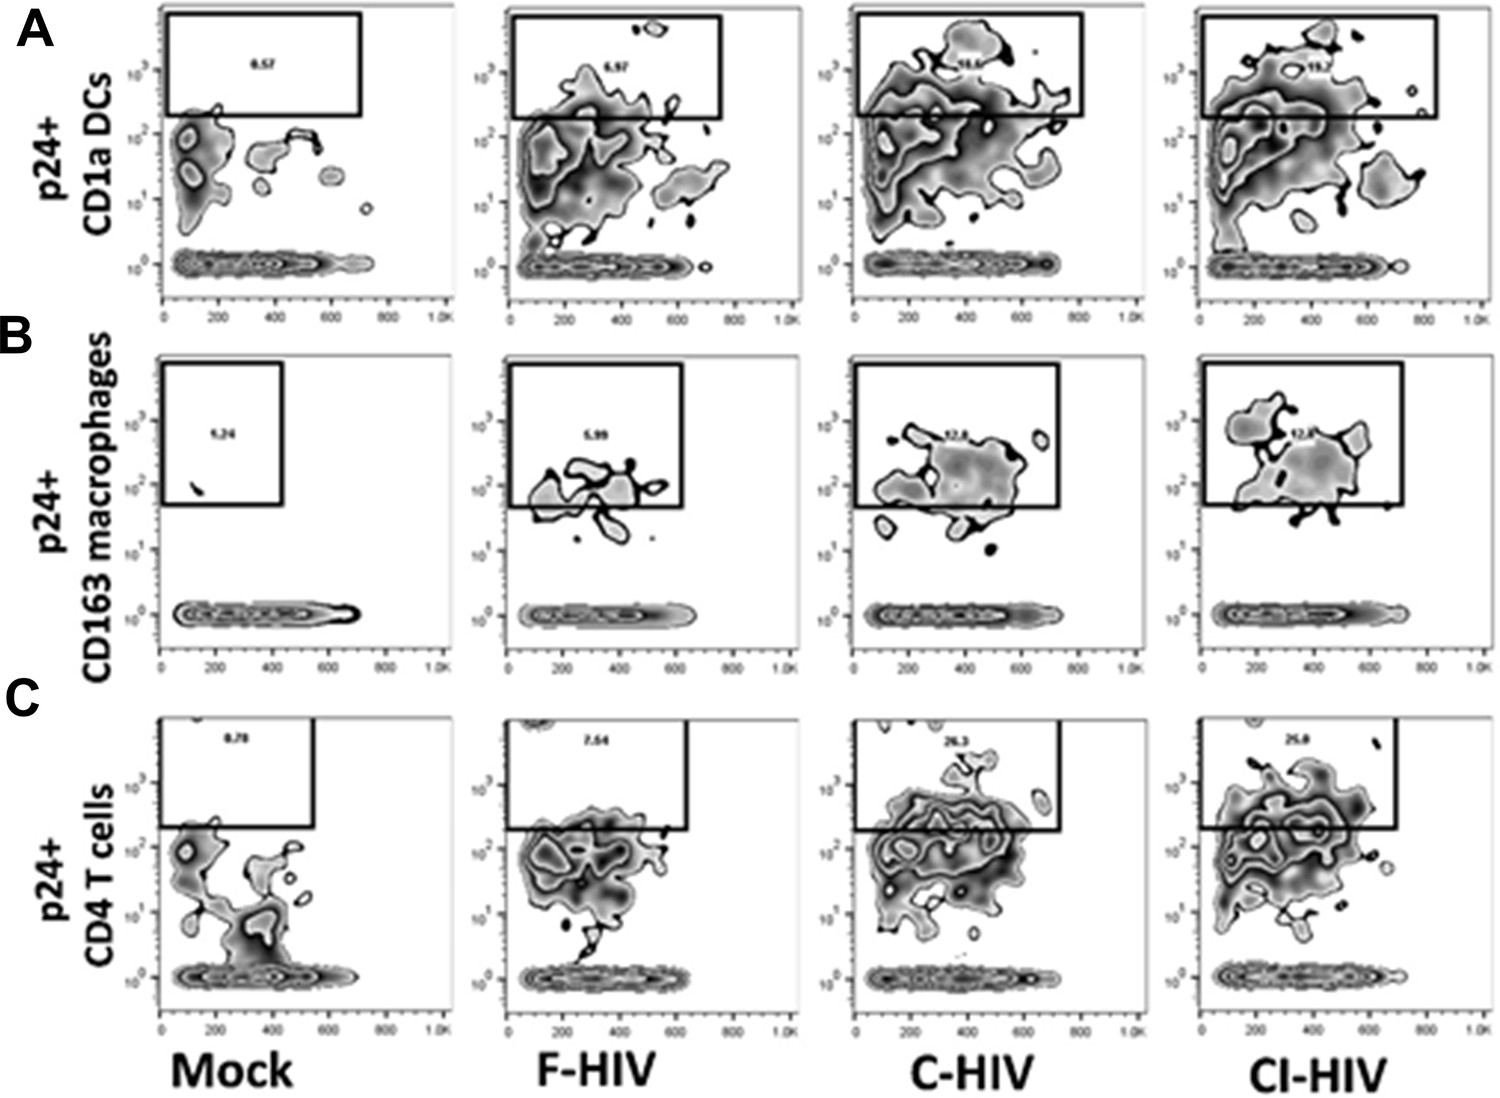
Representative Zebra plots with gating for HIV-1 p24+ Immune cells.
Mucosal immune cells isolated from the colorectal tissue biopsies by enzymatic digestion were exposed to HIV-1BaL, either free (F-HIV), complement-opsonized (C-HIV), or virions opsonized by a cocktail of complement and antibodies (CI-HIV) or mock-treated for 96 hr. The immune cells were stained with anti-CD1a and anti-HIV-1 mAbs for DCs (A), anti-CD163 and anti-HIV-1 mAbs for macrophages (B), and anti-CD3, anti-CD4, and anti-HIV-1 mAbs for CD4+ T cells (C), respectively. Cell acquisition was performed using FACS Diva (BD Biosciences) software on a FACSCanto II flow cytometer (BD Biosciences) and data were analyzed by FlowJo (Treestar, OR, USA). Zebra plots shown are representative of one individual.
Figure 3 with 1 supplement
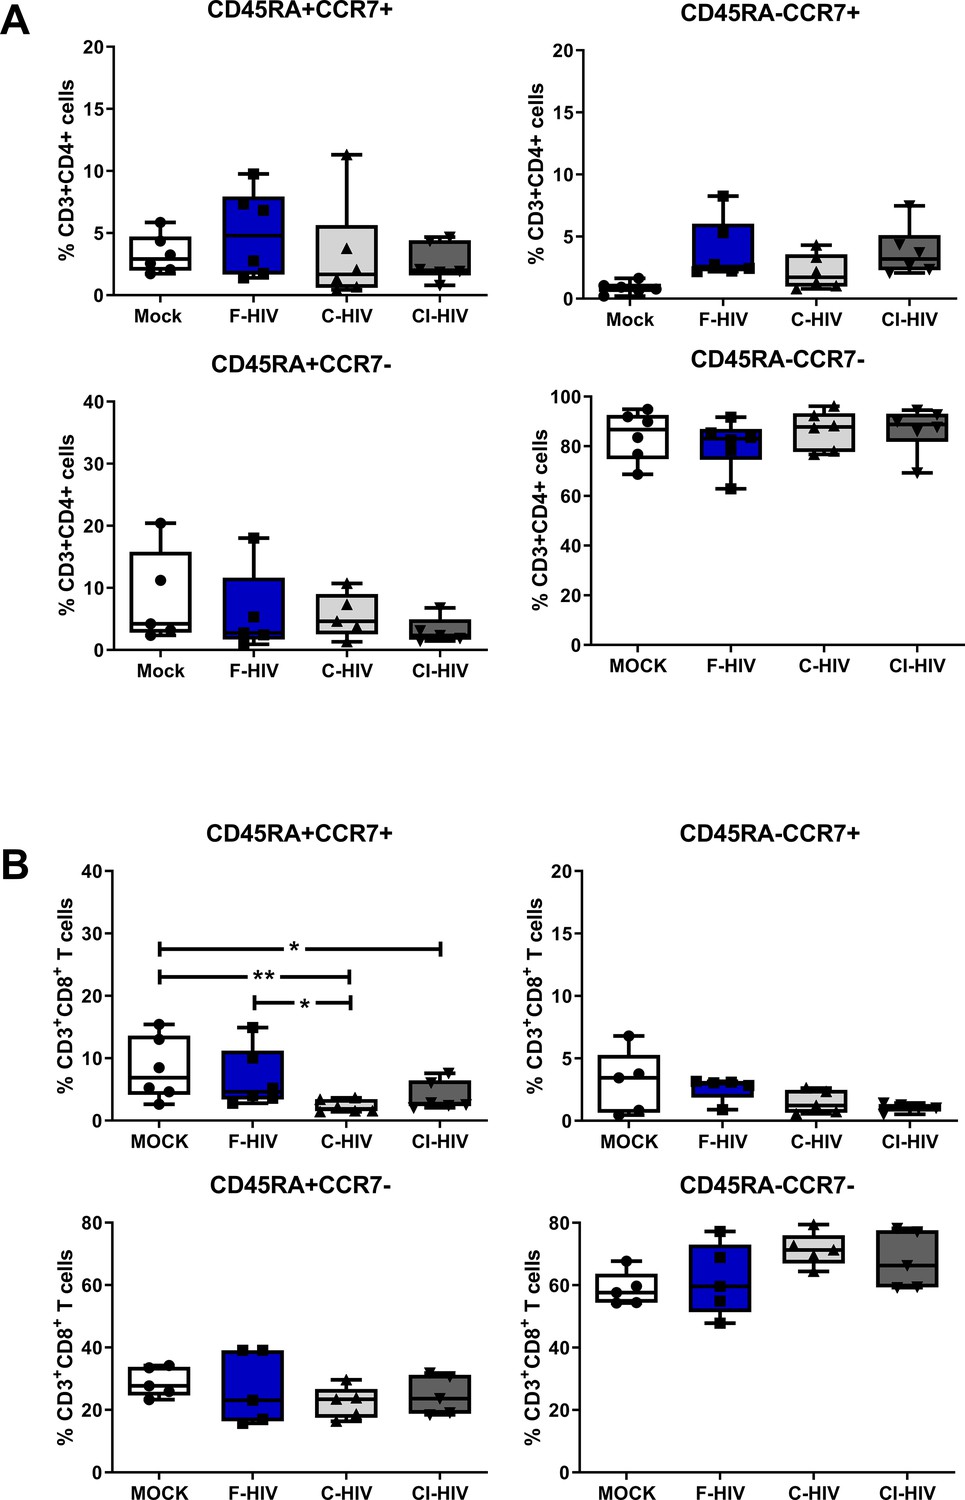
Alteration in mucosal CD4+ and CD8+ T cell memory cell after HIV-1 exposure.
Mucosal immune cells isolated from the colorectal tissue biopsies by enzymatic digestion were exposed to HIV-1BaL (250 ng/mL), either free (F-HIV), complement-opsonized (C-HIV), or virions opsonized by a cocktail of complement and antibodies (CI-HIV) or mock-treated, by spinning the cultures. The effect HIV exposure had on mucosal T cells phenotype was assessed after 4 days. (A–B) The immune cells were stained with CD3, CD4, CD8, CD45RA, and CCR7 mAbs. Percentage of CD45RA+CCR7+, CD45RA+CCR7-, CD45RA-CCR7+, and CD45RA-CCR7- expressing CD4+CD3+ T cells (A) or CD8+CD3+T cells (B) unexposed or exposed to F-HIV, C-HIV and CI-HIV was assessed by flow cytometry (N = 5–6). Statistical significance was tested using repeated measures of ANOVA followed by Tukey's posttest. *p<0.05, **p<0.01, ***p<0.001. Data are shown as mean ± SEM.
Figure 3—figure supplement 1
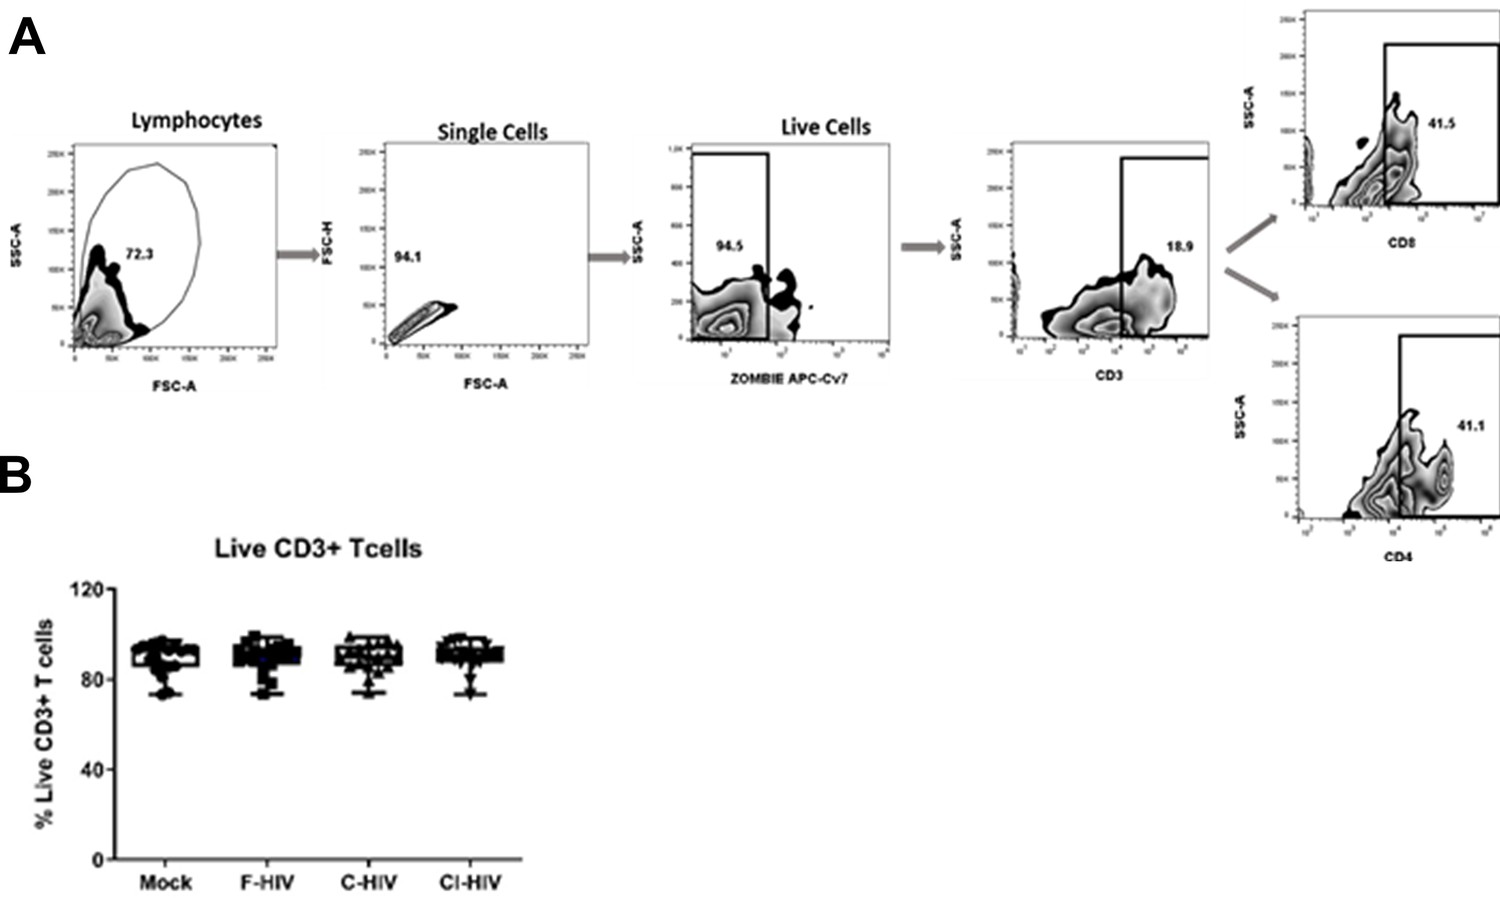
The gating strategy for the CD4+ and CD8+ T cell subsets and the viability of the CD3+ T cells.
(A-B) Strategy for gating of T cell subsets and T cell viability. Mucosal immune cells isolated from the colorectal tissue biopsies by enzymatic digestion were exposed to HIV-1BaL, either free (F-HIV), complement-opsonized (C-HIV), or virions opsonized by a cocktail of complement and antibodies (CI-HIV) or mock-treated, by spinning the cultures. Cell acquisition was performed using FACS Diva (BD Biosciences) software on a FACSCanto II flow cytometer (BD Biosciences) and data were analyzed by FlowJo (Treestar, OR, USA). Cell viability was assessed by Zombie NIR Fixable Viability Kit (BioLegend), and to further exclude any dead cells/debris doublet discrimination through forward scatter-area/forward scatter-width gating was performed along with normal forward scatter-area/side scatter-area gating. T cells were identified based on CD3 staining and side scatter-area parameter. Percentages of CD3 T cells along with CD4 and CD8 cells were determined using thresholds based on unstimulated samples. Flow cytometry data obtained for isolated cells under different conditions of virus were analyzed following the same gating strategy. Zebra plots shown are representative of one individual (A). To determine the percentages of viable CD3 T cells, single cells (as identified in A) positive for CD3 were first gated, live cell gating was then employed among those population (B).
Figure 4 with 1 supplement
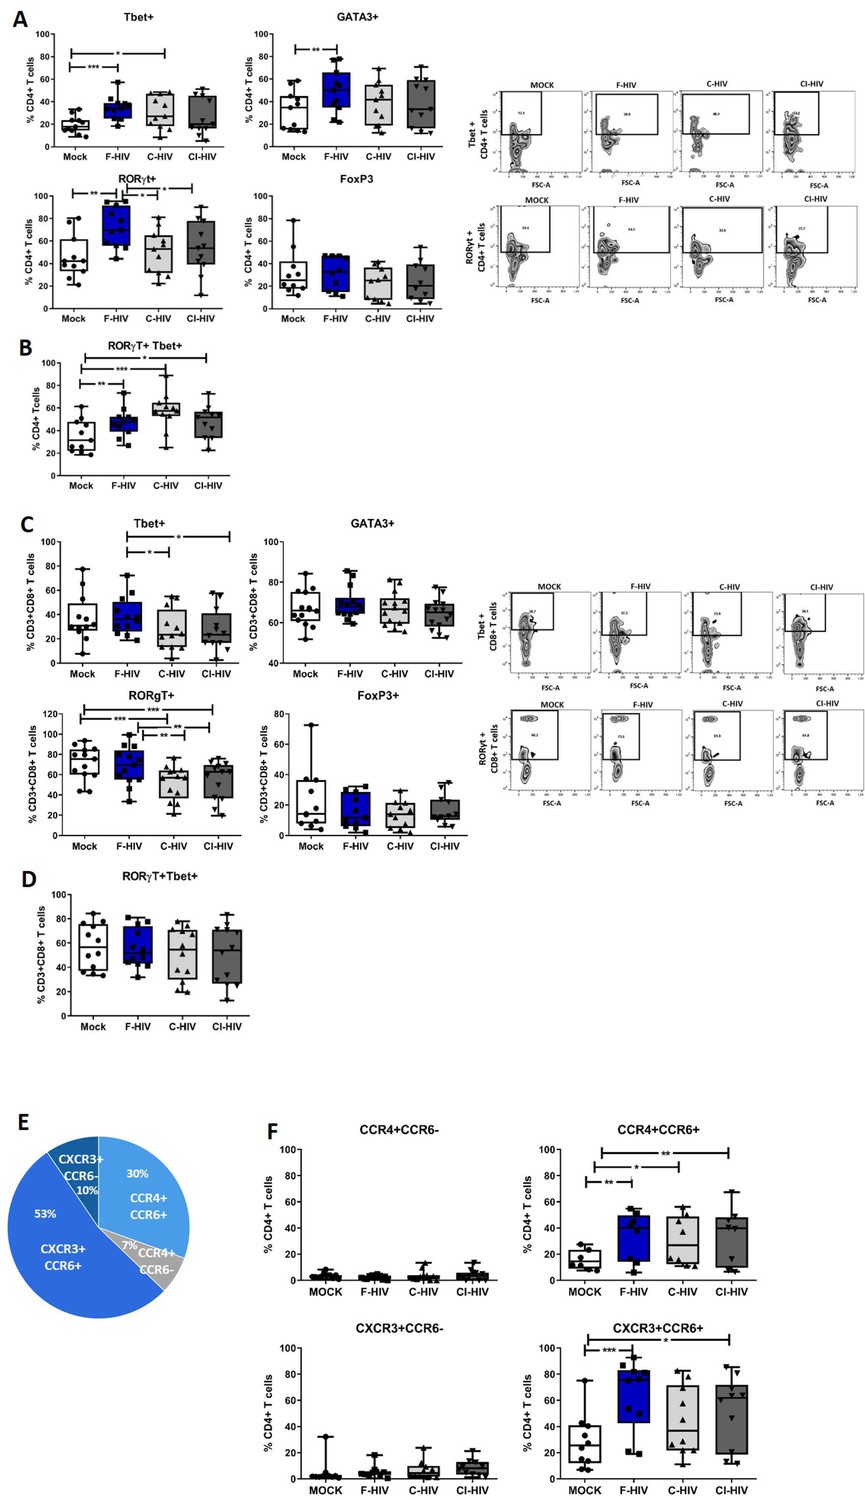
HIV-1 exposure alters the T cell expression of transcriptional factors and chemokine receptors.
Mucosal immune cells isolated from the colorectal tissue biopsies by enzymatic digestion were exposed to HIV-1BaL (250 ng/mL), either free (F-HIV), complement-opsonized (C-HIV), or virions opsonized by a cocktail of complement and antibodies (CI-HIV) or mock-treated, by spinning the cultures. The effect HIV exposure had on mucosal T cells phenotype was assessed after 4 days. (A–D) The immune cells were stained with CD3, CD4, CD8, Tbet, GATA3, RORγt, and FoxP3 mAbs. (A–B) Percentage of unexposed, F-HIV, C-HIV, or CI-HIV exposed CD4+ T cells expressing GATA3, Tbet, RORγt, or FoxP3, or RORγt and Tbet were assessed by flow cytometry. (C–D) Percentage of unexposed, F-HIV, C-HIV, or CI-HIV exposed CD8+ T cells expressing GATA3, Tbet, RORγt, or FoxP3, or RORγt and Tbet were assessed by flow cytometry. (E–F) The immune cells were stained with CD3, CD4, CD8, CCR4, CCR6, and CXCR3 mAbs. (E) The proportion of each of the four T helper populations: CCR4+CCR6-, CCR4+CCR6+, CXCR3+CCR6- or CXCR3+CCR6+ among unexposed CD4+ T cells were assessed by flow cytometry. (F) Percentage of unexposed, F-HIV, C-HIV, or CI-HIV exposed CD4+ T cells expressing CCR4+CCR6-, CCR4+CCR6+, CXCR3+CCR6- or CXCR3+CCR6+ were assessed by flow cytometry (N = 12–15). Statistical significance was tested using repeated measures of ANOVA followed by Tukey's posttest. *p<0.05, **p<0.01, ***p<0.001. Data are shown as mean ± SEM.
Figure 4—figure supplement 1
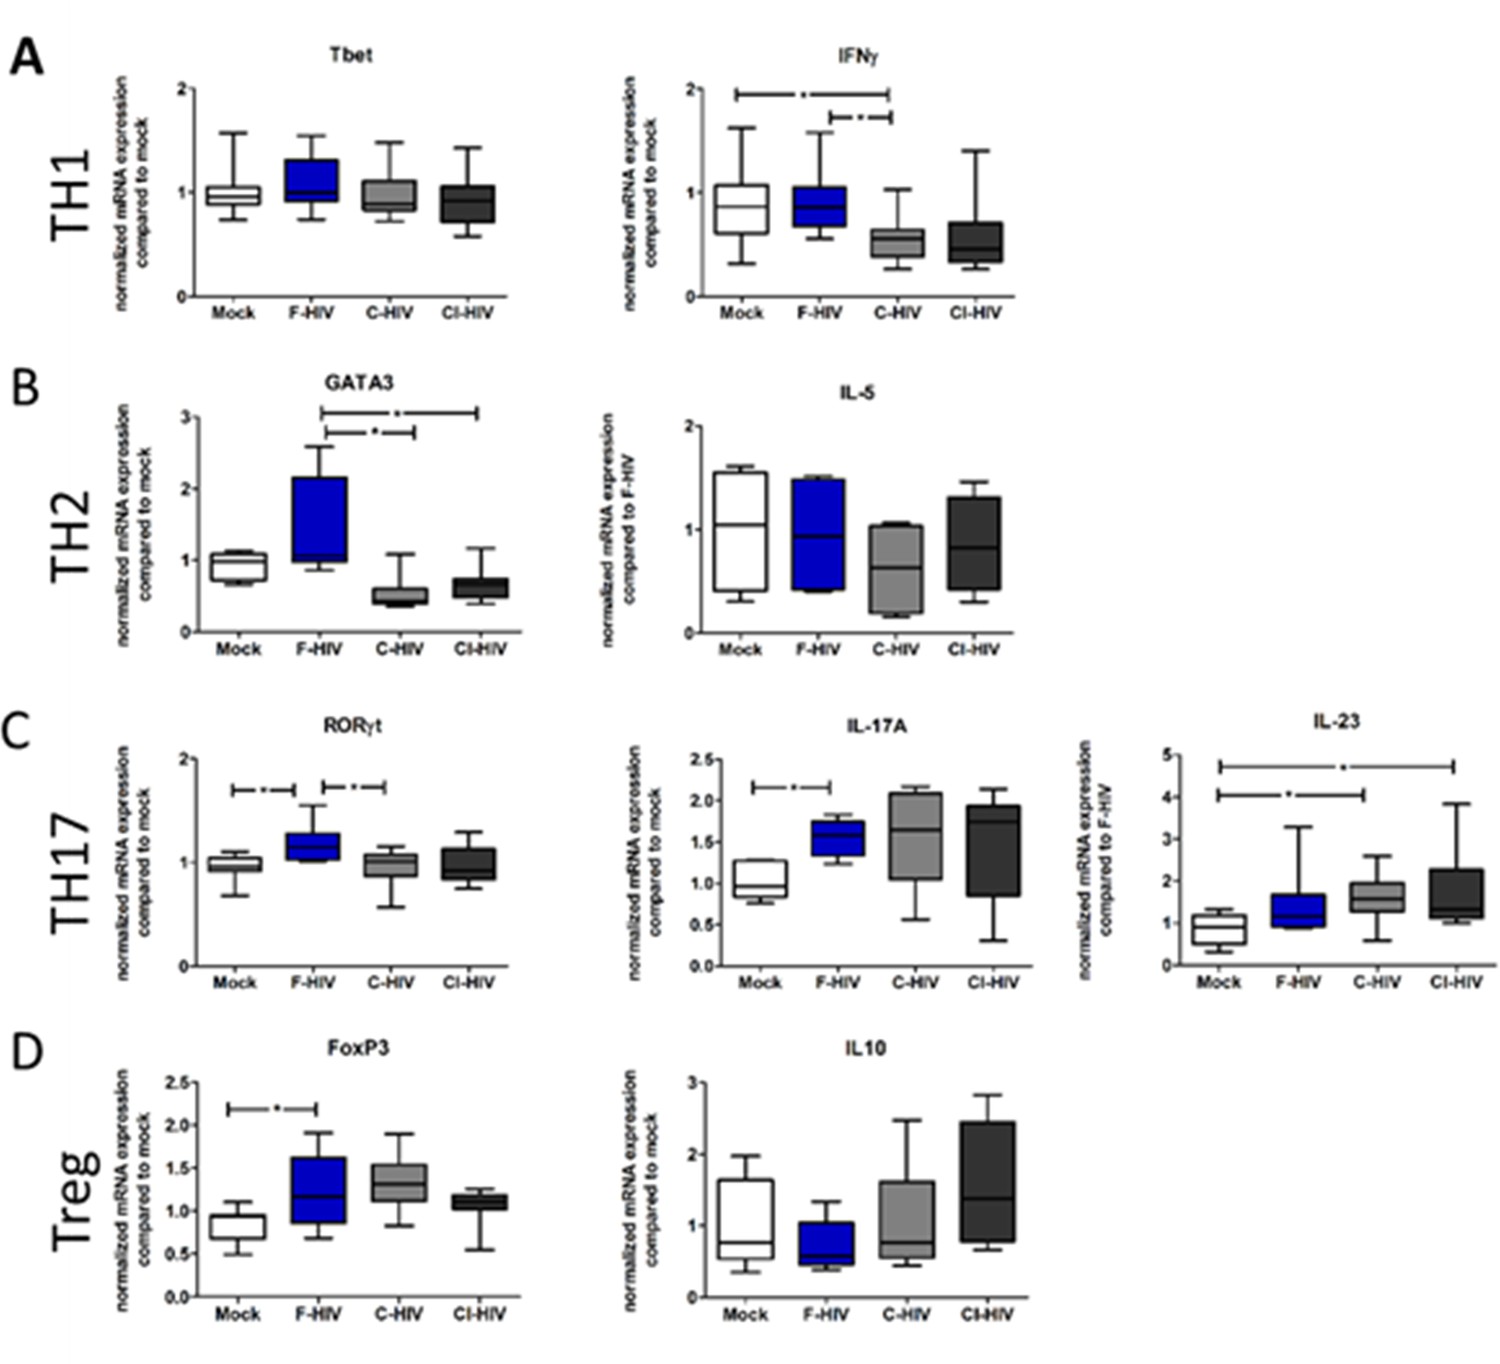
Exposure to HIV modulated the transcription factor and cytokines associated with different T-cell subsets in the isolated mucosal immune cells.
Mucosal immune cells isolated from the colorectal tissue biopsies by enzymatic digestion were exposed to HIV-1BaL, either free (F-HIV), complement-opsonized (C-HIV), or virions opsonized by a cocktail of complement and antibodies (CI-HIV) or mock-treated, by spinning the cultures. After 24 hr, mRNA expression levels of (A) Tbet and IFN-γ, (B) GATA3 and IL-5, (C) RORγt and IL-17A and IL-23, and (D) FoxP3 and IL-10 were accessed by qPCR. Data were normalized to mock set as 1 (N = 10–12). Statistical significance was tested using a two-sided paired t-test. *p<0.05, **p<0.01, ***p<0.001. Data are shown as mean ± SEM.
Figure 5 with 1 supplement
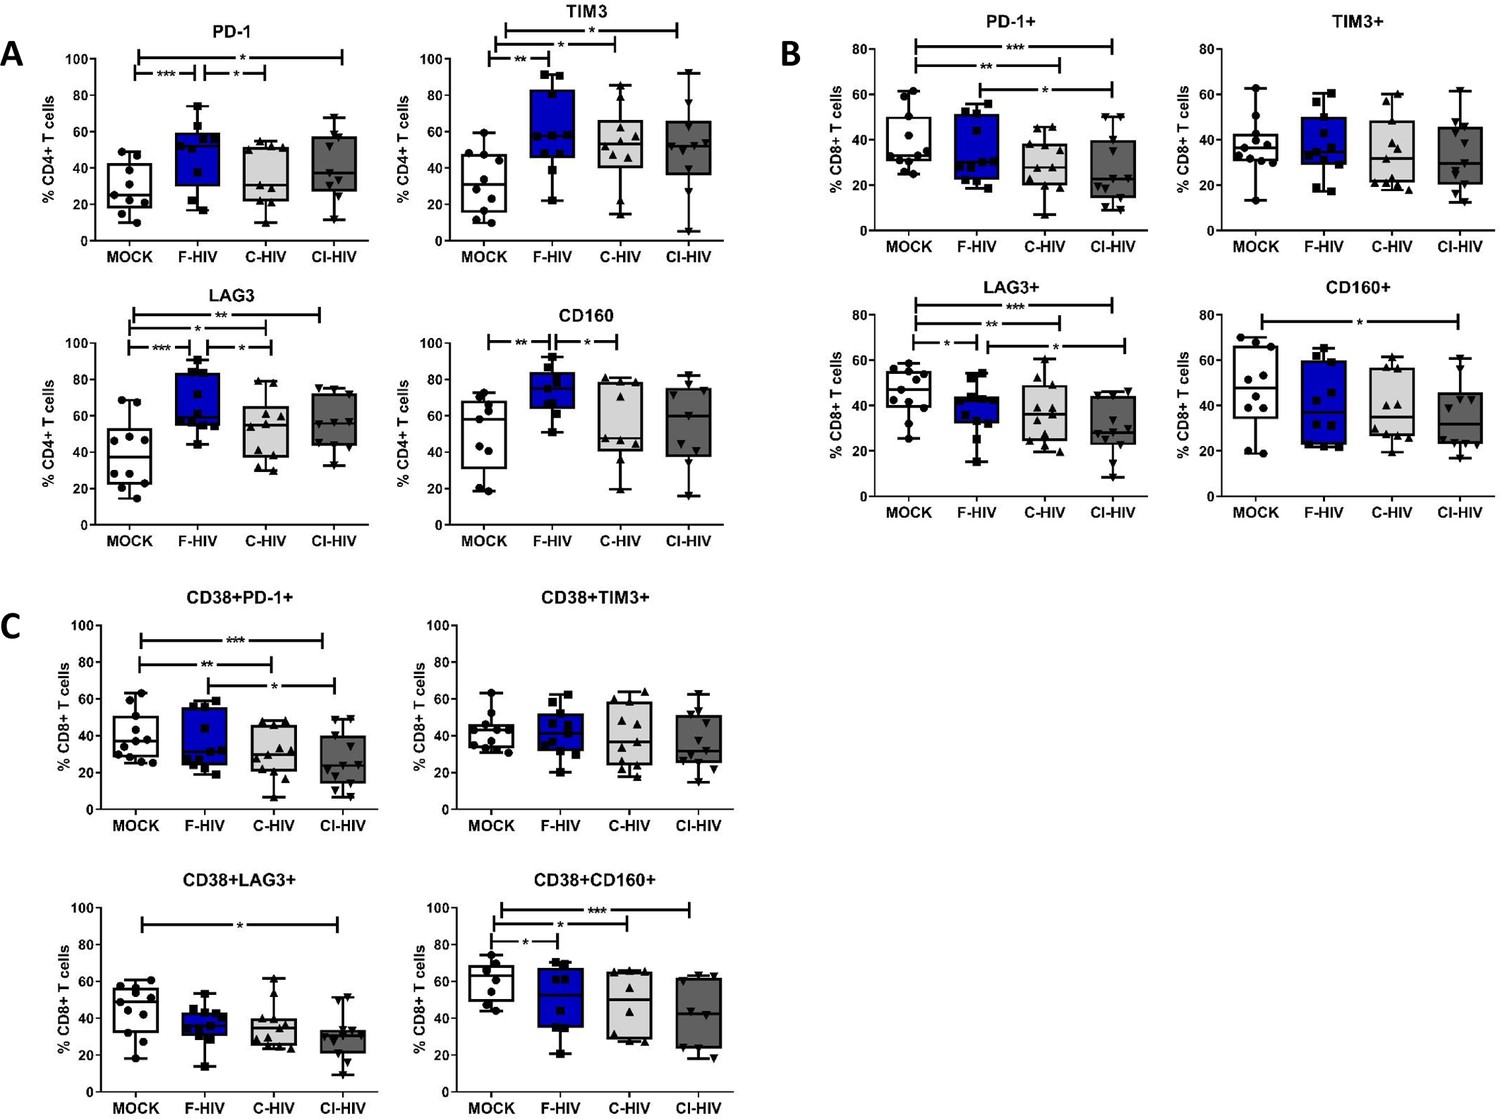
HIV-1 exposure alters the levels of negative immune checkpoint factors on the mucosal T cells.
Mucosal immune cells isolated from the colorectal tissue biopsies by enzymatic digestion were exposed to HIV-1BaL (250 ng/mL), either free (F-HIV), complement-opsonized (C-HIV), or virions opsonized by a cocktail of complement and antibodies (CI-HIV) or mock-treated, by spinning the cultures. The effect HIV exposure had on mucosal T cells phenotype was assessed after 4 days. (A–C) The immune cells were stained with CD3, CD4, CD8, CD38, PD-1, LAG3, TIM3, and CD160 mAbs. (A) Percentage of unexposed, F-HIV, C-HIV, or CI-HIV exposed CD4+ T cells expressing PD-1, TIM3, LAG3 or CD160+ CD4+ T cells, (B) Percentage of unexposed, F-HIV, C-HIV, or CI-HIV exposed CD8+ T cells expressing PD-1, TIM3, LAG3 or CD160, and (C) Percentage of unexposed, F-HIV, C-HIV, or CI-HIV exposed CD38+CD8+ T cells expressing PD-1, TIM3, LAG3 or CD160 were assessed by flow cytometry (N = 12–15). Statistical significance was tested using repeated measures of ANOVA followed by Tukey's posttest. *p<0.05, **p<0.01, ***p<0.001. Data are shown as mean ± SEM.
Figure 5—figure supplement 1
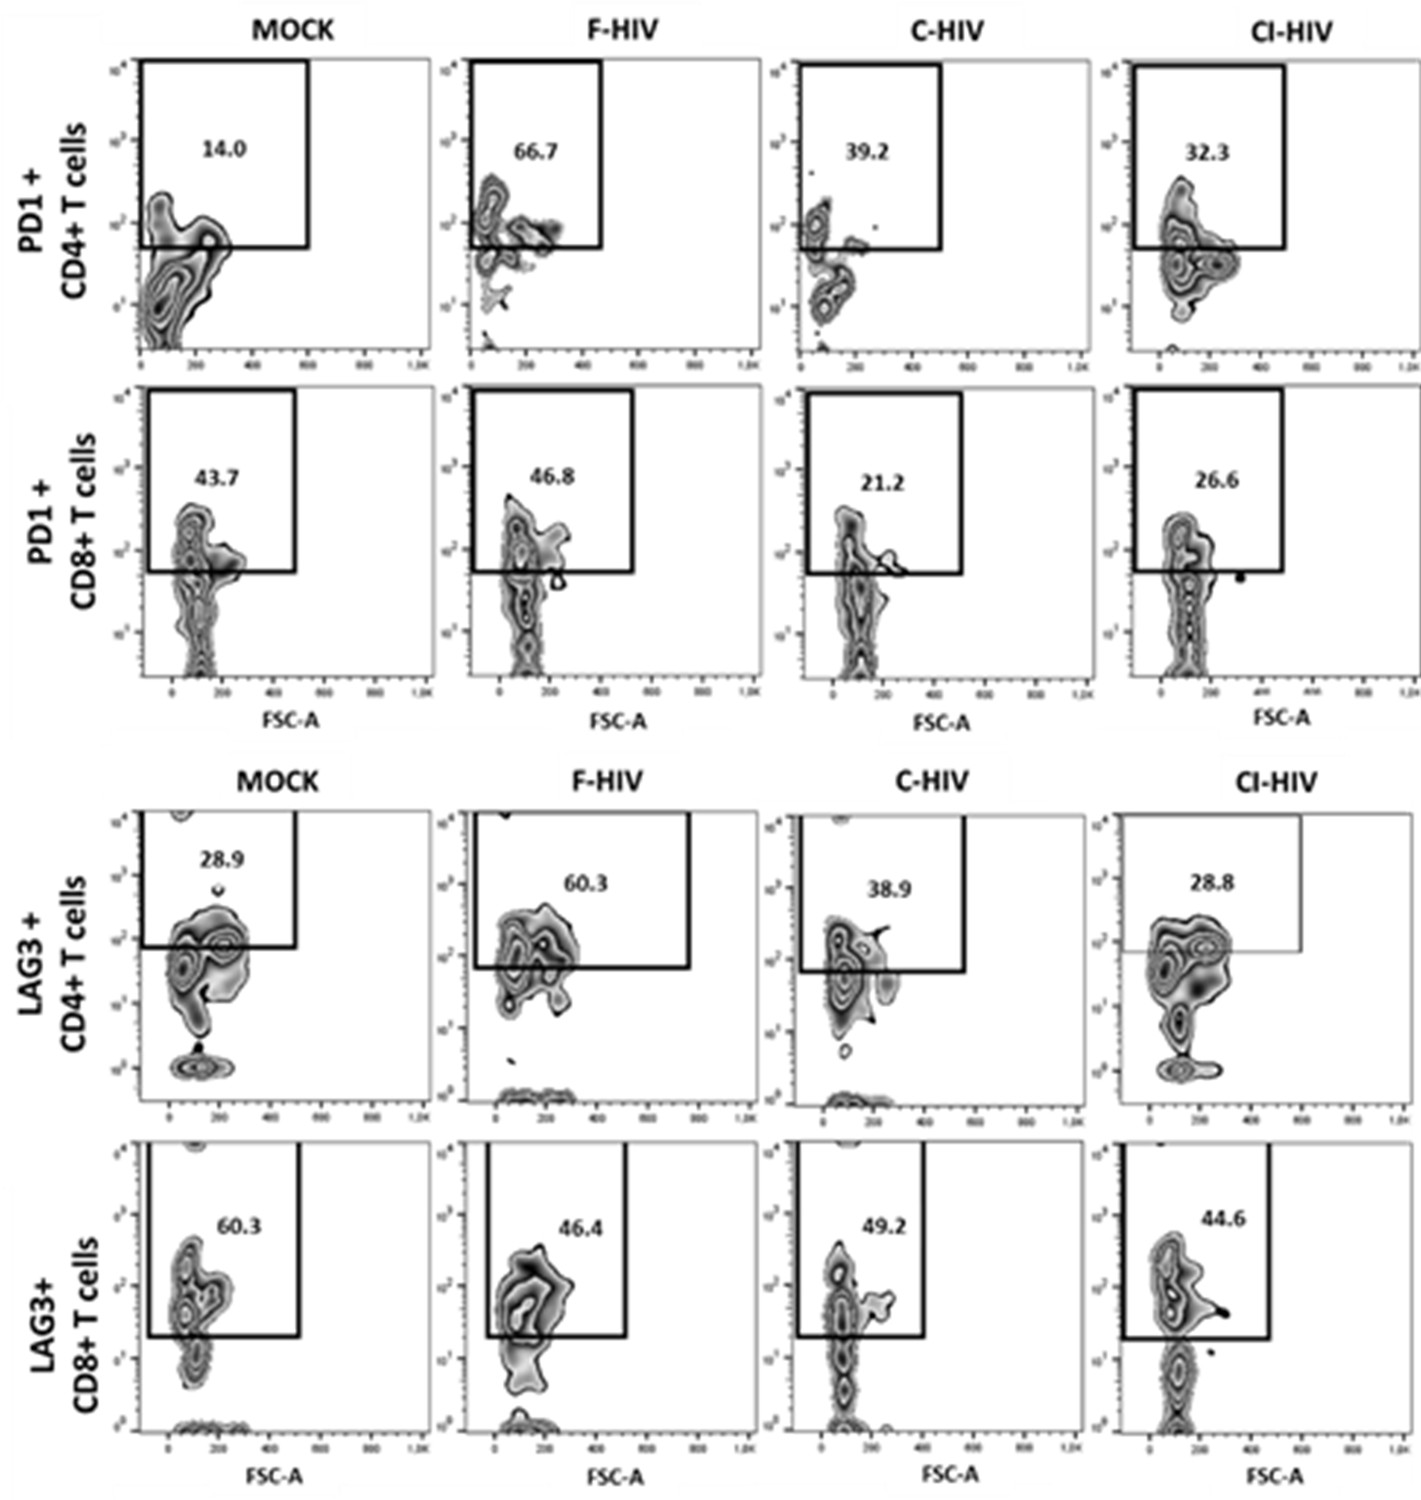
Representative Zebra plots for immune checkpoint factors PD1 and LAG3 on mucosal T cells.
Mucosal immune cells isolated from the colorectal tissue biopsies by enzymatic digestion were exposed to HIV-1BaL for 96 hr, either free (F-HIV), complement-opsonized (C-HIV), or virions opsonized by a cocktail of complement and antibodies (CI-HIV) or mock-treated, by spinning the cultures. Zebra plots shown are representative of one individual. CD4 and CD8 T cells co-expressing negative immune checkpoint factors PD-1 and LAG3 were identified based on percentage populations of CD4+PD-1+, CD8+PD-1+, CD4+LAG3+ and CD8+LAG3+ cells respectively.
Figure 6
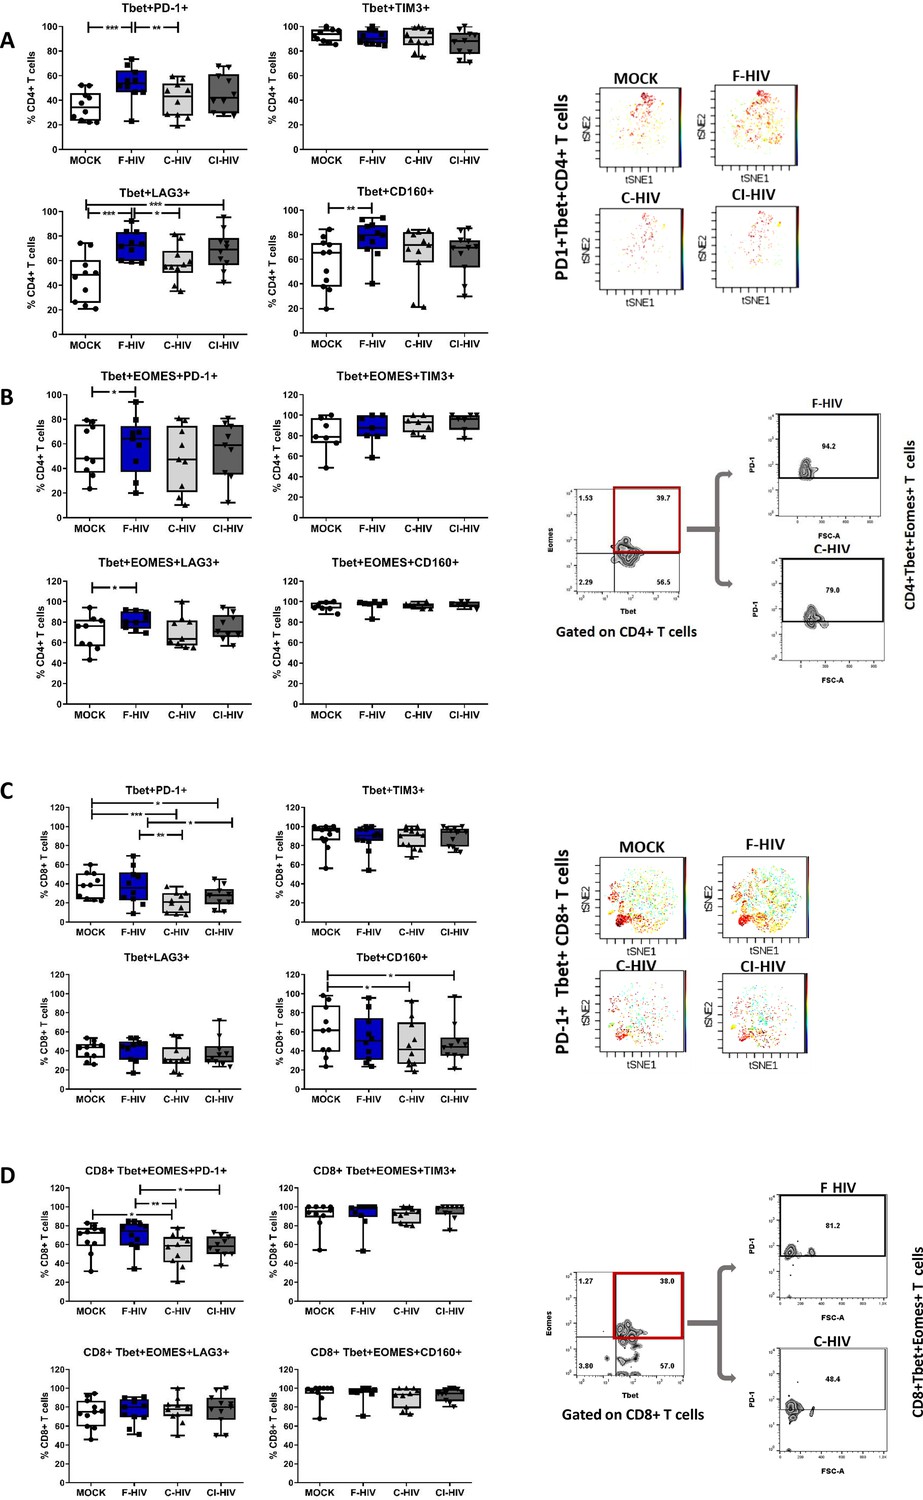
HIV exposure modulated transcriptional regulation of mucosal T cells.
Mucosal immune cells isolated from the colorectal tissue biopsies by enzymatic digestion were exposed to HIV-1BaL (250 ng/mL), either free (F-HIV), complement-opsonized (C-HIV), or virions opsonized by a cocktail of complement and antibodies (CI-HIV) or mock-treated, by spinning the cultures. The effect HIV exposure had on mucosal T cells phenotype was assessed after 4 days. (A–D) The immune cells were stained with CD3, CD4, CD8, Tbet, EOMES, PD-1, LAG3, TIM3, and CD160 mAbs. (A) Percentage of unexposed, F-HIV, C-HIV, or CI-HIV exposed Tbet+CD4+ T cells expressing PD-1, TIM3, LAG3 or CD160. viSNE plot of PD-1+Tbet+CD4+ was constructed on CD4 T cells, data presented as dot plots with colored channels. Data from a donor shows CD4 T cells, subjected to tSNE algorithm, which provides cells with a unique coordinate according to its expression of PD-1+T-bet+ parameters, displayed on a two-dimensional plot (tSNE1 versus tSNE2). The heat gradient (blue to red) indicates expression level of Tbet+PD-1+ on CD4 following exposure to different conditions of viruses. (B) Percentage of unexposed, F-HIV, C-HIV, or CI-HIV exposed Tbet+EOMES+ CD4+ T cells expressing PD-1, TIM3, LAG3 or CD160 were assessed by flow cytometry. Flow cytometry Zebra plots for Tbet+EOMES+ CD4+ T cells expressing PD-1. (C) Percentage of Tbet+CD8+ T cells expressing PD-1, TIM3, LAG3 or CD160. viSNE plot of PD-1+Tbet+CD8+ was constructed on CD8 T cells, and data are presented as dot plots with colored channels. Data from a donor shows CD8 T cells, subjected to tSNE algorithm, which provides cells with a unique coordinate according to its expression of PD-1+T-bet+ parameters, displayed on a two-dimensional plot (tSNE1 versus tSNE2). The heat gradient (blue to red) indicates expression level of Tbet+PD-1+ on CD8 following exposure to different conditions of viruses. (D) Percentage of unexposed, F-HIV, C-HIV, or CI-HIV exposed Tbet+EOMES+ CD4+ T cells and percentage of Tbet+EOMES+ CD4+ T cells expressing PD-1, TIM3, LAG3 or CD160 were assessed by flow cytometry. Flow cytometry Zebra plots for Tbet+EOMES+ CD8+ T cells expressing PD-1 (N = 12–15). Statistical significance was tested using repeated measures of ANOVA followed by Tukey's posttest. *p<0.05, **p<0.01, ***p<0.001. Data are shown as mean ± SEM.
Figure 7
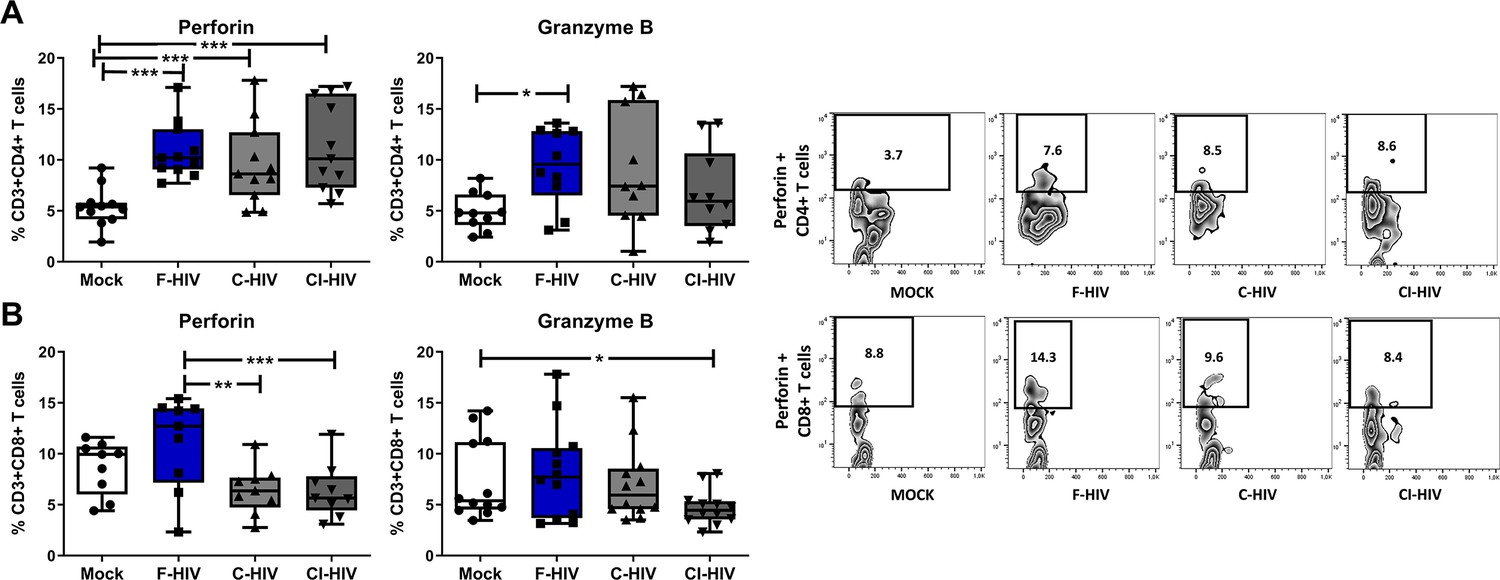
HIV exposure alters the expression of perforin and granzyme in mucosal cells.
Mucosal immune cells isolated from the colorectal tissue biopsies by enzymatic digestion were exposed to HIV-1BaL (250 ng/mL), either free (F-HIV), complement-opsonized (C-HIV), or virions opsonized by a cocktail of complement and antibodies (CI-HIV) or mock-treated, by spinning the cultures. The effect HIV exposure had on mucosal T cells phenotype was assessed after 4 days. (A and B) The immune cells were stained with CD3, CD4, CD8, perforin and granzyme B mAbs. Of unexposed, F-HIV, C-HIV, or CI-HIV exposed CD4+ T cells (A) or CD8 T cells (B) expressing perforin or granzyme B were assessed by flow cytometry and shown as Zebra blots representing one individual and graphs for a summary of donors assessed. (A) Percentage of unexposed, F-HIV, C-HIV, or CI-HIV exposed CD4+ T cells expressing perforin or granzyme B were assessed by flow cytometry. (B) Percentage of unexposed, F-HIV, C-HIV, or CI-HIV exposed CD8+ T cells expressing perforin or granzyme B were assessed by flow cytometry (N = 12–15). Statistical significance was tested using repeated measures of ANOVA followed by Tukey's posttest. *p<0.05, **p<0.01, ***p<0.001. Data are shown as mean ± SEM.
Figure 8
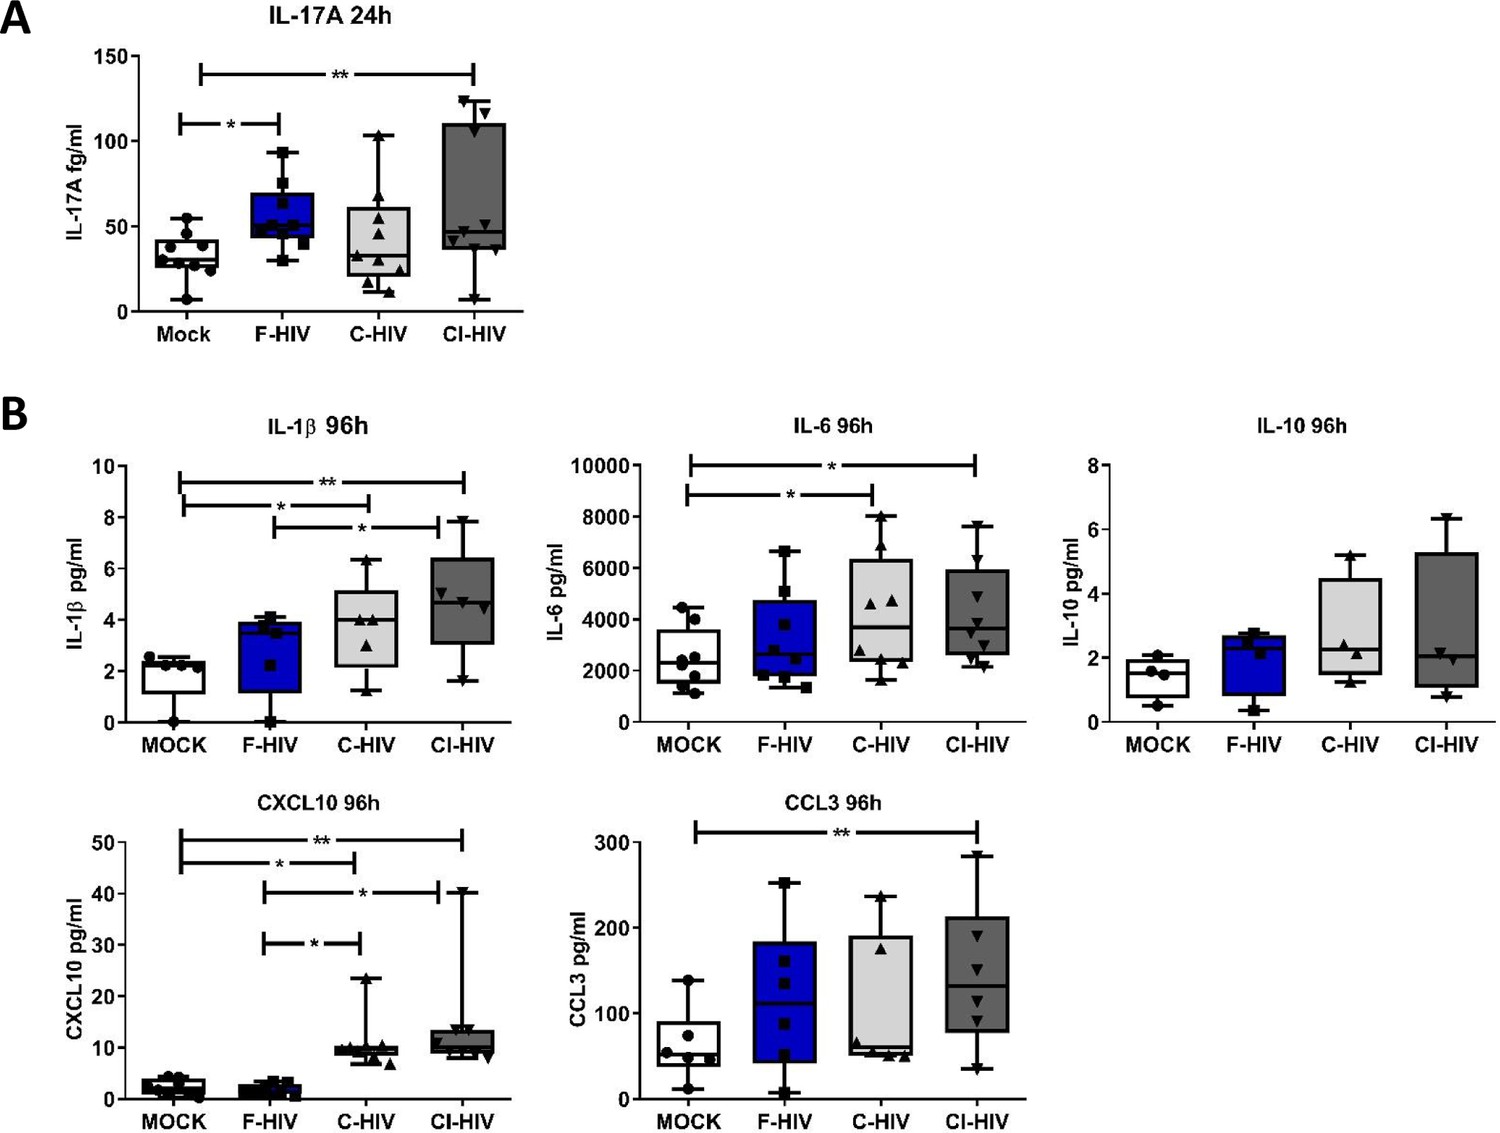
Complement-opsonized HIV gave rise to a delayed inflammation in the mucosal immune cells.
Mucosal immune cells isolated from the colorectal tissue biopsies by enzymatic digestion were exposed to HIV-1BaL (250 ng/mL), either free (F-HIV), complement-opsonized (C-HIV), or virions opsonized by a cocktail of complement and antibodies (CI-HIV) or mock-treated, by spinning the cultures. The effect HIV exposure had on mucosal T cells phenotype was assessed after 24 h-4 days. (A) The supernatants from unexposed and F-HIV, C-HIV, or CI-HIV-exposed mucosal immune cells were assessed at 24 hr for IL-17A by bead array. (B) The supernatants from unexposed and F-HIV, C-HIV, or CI-HIV-exposed mucosal immune cells were assessed at 4 days for IL-6, IL-1β, IL-6, IL-10, CXCL10 and CCL3 by CBA (N = 12–15). Statistical significance was tested using repeated measures of ANOVA followed by Tukey's posttest. *p<0.05, **p<0.01, ***p<0.001. Data a shown as mean ± SEM.
Tables
Key resources table
| Reagent type (species) or resource | Designation | Source or reference | Identifiers | Additional information |
|---|---|---|---|---|
| Biological sample (human) | Colorectal Tissue Biopsies | Surgical Department of Linköping University Hospital | The tissue pieces were either cut into small explants or punched into biopsies | |
| Antibody | anti-human CD3-PerCP/AmCyan(Mouse monoclonal) | BD Biosciences | Cat#: 552851/339186 | FACS (1 ul per test) |
| anti-human CD4-PE/BV421(Mouse monoclonal) | BD Biosciences | Cat#: 555347/562424 | FACS (1 ul per test) | |
| anti-human CD8-PerCPCy5.5(Mouse monoclonal) | BD Biosciences | Cat#: 560662 | FACS (1 ul per test) | |
| anti-human CD1a-APC(Mouse monoclonal) | BD Biosciences | Cat#: 559775 | FACS (1 ul per test) | |
| anti-human CD163-APCCy7(Mouse monoclonal) | BioLegend | Cat#: 50-850-648 | FACS (1 ul per test) | |
| anti-human CD45RA-FITC(Mouse monoclonal) | BD Biosciences | Cat#: 555488 | FACS (1 ul per test) | |
| anti-human CD45RO-FITC(Mouse monoclonal) | BD Biosciences | Cat#: 555492 | FACS (1 ul per test) | |
| anti-human CD38-PerCP-Cy5.5(Mouse monoclonal) | BD Biosciences | Cat#: 551400 | FACS (1 ul per test) | |
| anti-human CD160-PE(Mouse monoclonal) | BD Biosciences | Cat#: 562118 | FACS (1 ul per test) | |
| anti-human PD-1-BV421(Mouse monoclonal) | BioLegend | Cat#: 329920 | FACS (1 ul per test) | |
| anti-human TIM3-PE(Mouse monoclonal) | BioLegend | Cat#: 345006 | FACS (1 ul per test) | |
| anti-human LAG3-FITC(Mouse monoclonal) | BioLegend | Cat#: 369308 | FACS (1 ul per test) | |
| anti-human CXCR3-PE(Mouse monoclonal) | BioLegend | Cat#: 353706 | FACS (1 ul per test) | |
| anti-human CCR4-AF647(Mouse monoclonal) | BioLegend | Cat#: 359404 | FACS (1 ul per test) | |
| anti-human CCR6-PECy7(Mouse monoclonal) | BD Biosciences | Cat#: 560620 | FACS (1 ul per test) | |
| anti-human CCR7-PerCPCy5.5(Mouse monoclonal) | BioLegend | Cat#: 353220 | FACS (1 ul per test) | |
| anti-Tbet-FITC/PECy7(Mouse monoclonal) | BioLegend | Cat#: 644812/644824 | FACS (1 ul per test) | |
| anti-human EOMES-eFluor660(Mouse monoclonal) | eBioscience | Cat#: 50-4877-41 | FACS (1 ul per test) | |
| anti-human RORγt-PE(Mouse monoclonal) | BD Biosciences | Cat#: 563081 | FACS (1 ul per test) | |
| anti-GATA3-PECy7(Mouse monoclonal) | BD Biosciences | Cat#: 560405 | FACS (1 ul per test) | |
| anti-human FoxP3-AF647(Mouse monoclonal) | BD Biosciences | Cat#: 560045 | FACS (1 ul per test) | |
| anti-human Perforin-Pacific Blue(Mouse monoclonal) | BioLegend | Cat#: 308118 | FACS (1 ul per test) | |
| anti-human Granzyme B-AF647(Mouse monoclonal) | BD Biosciences | Cat#: 560212 | FACS (1 ul per test) | |
| Anti-human HIV-1 Core Antigen-FITC, KC57 (Mouse monoclonal) | Beckman Coulter | Cat#: 6604665 | FACS (1 ul per test) | |
| Anti-human IgG1 Mouse-FITC Isotype Control | Beckman Coulter | Cat#: IM0639U | FACS (1 ul per test) | |
| Zombie NIR Fixable Viability Kit | BioLegend | Cat#: 423106 | FACS (diluted as manufacturer’s protocol) | |
| Sequence-based reagent | β-Actin_F | Eurofins Genomics/CyberGene AB | PCR primers | |
| β-Actin_R | Eurofins Genomics/CyberGene AB | PCR primers | ||
| GADPH_F | Eurofins Genomics/CyberGene AB | PCR primers | ||
| GADPH_R | Eurofins Genomics/CyberGene AB | PCR primers | ||
| Commercial assay or kit | Human Inflammatory Cytokine CBA Kit | BD Biosciences | 551811 | |
| Human IFNγ CBA Flex Set | BD Biosciences | 558269 | ||
| Human IP-10 CBA Flex Set | BD Biosciences | 558280 | ||
| Human MIP-1α CBA Flex Set | BD Biosciences | 558325 | ||
| Human IL-17A Enhanced Sensitivity CBA Flex Set | BD Biosciences | 562143 | ||
| Software, algorithm | CFX Manager 3.1 | Bio-Rad | ||
| Ingenuity Pathway Analysis (IPA) | Qiagen | |||
| FlowJo | Treestar | |||
| FCAP Array | BD Biosciences | |||
| GraphPad Prism 5 | GraphPad Software |
Additional files
Download links
A two-part list of links to download the article, or parts of the article, in various formats.
Downloads (link to download the article as PDF)
Open citations (links to open the citations from this article in various online reference manager services)
Cite this article (links to download the citations from this article in formats compatible with various reference manager tools)
Complement opsonization of HIV affects primary infection of human colorectal mucosa and subsequent activation of T cells
eLife 9:e57869.
https://doi.org/10.7554/eLife.57869


