High-resolution structures of multiple 5-HT3AR-setron complexes reveal a novel mechanism of competitive inhibition
- Department of Physiology and Biophysics, Case Western Reserve University, United States
- Cleveland Center for Membrane and Structural Biology, Case Western Reserve University, United States
- Department of Pharmacological Sciences, Icahn School of Medicine at Mount Sinai, United States
- Department of Neuroscience, School of Medicine, Case Western Reserve University, United States
Figures
Figure 1 with 2 supplements
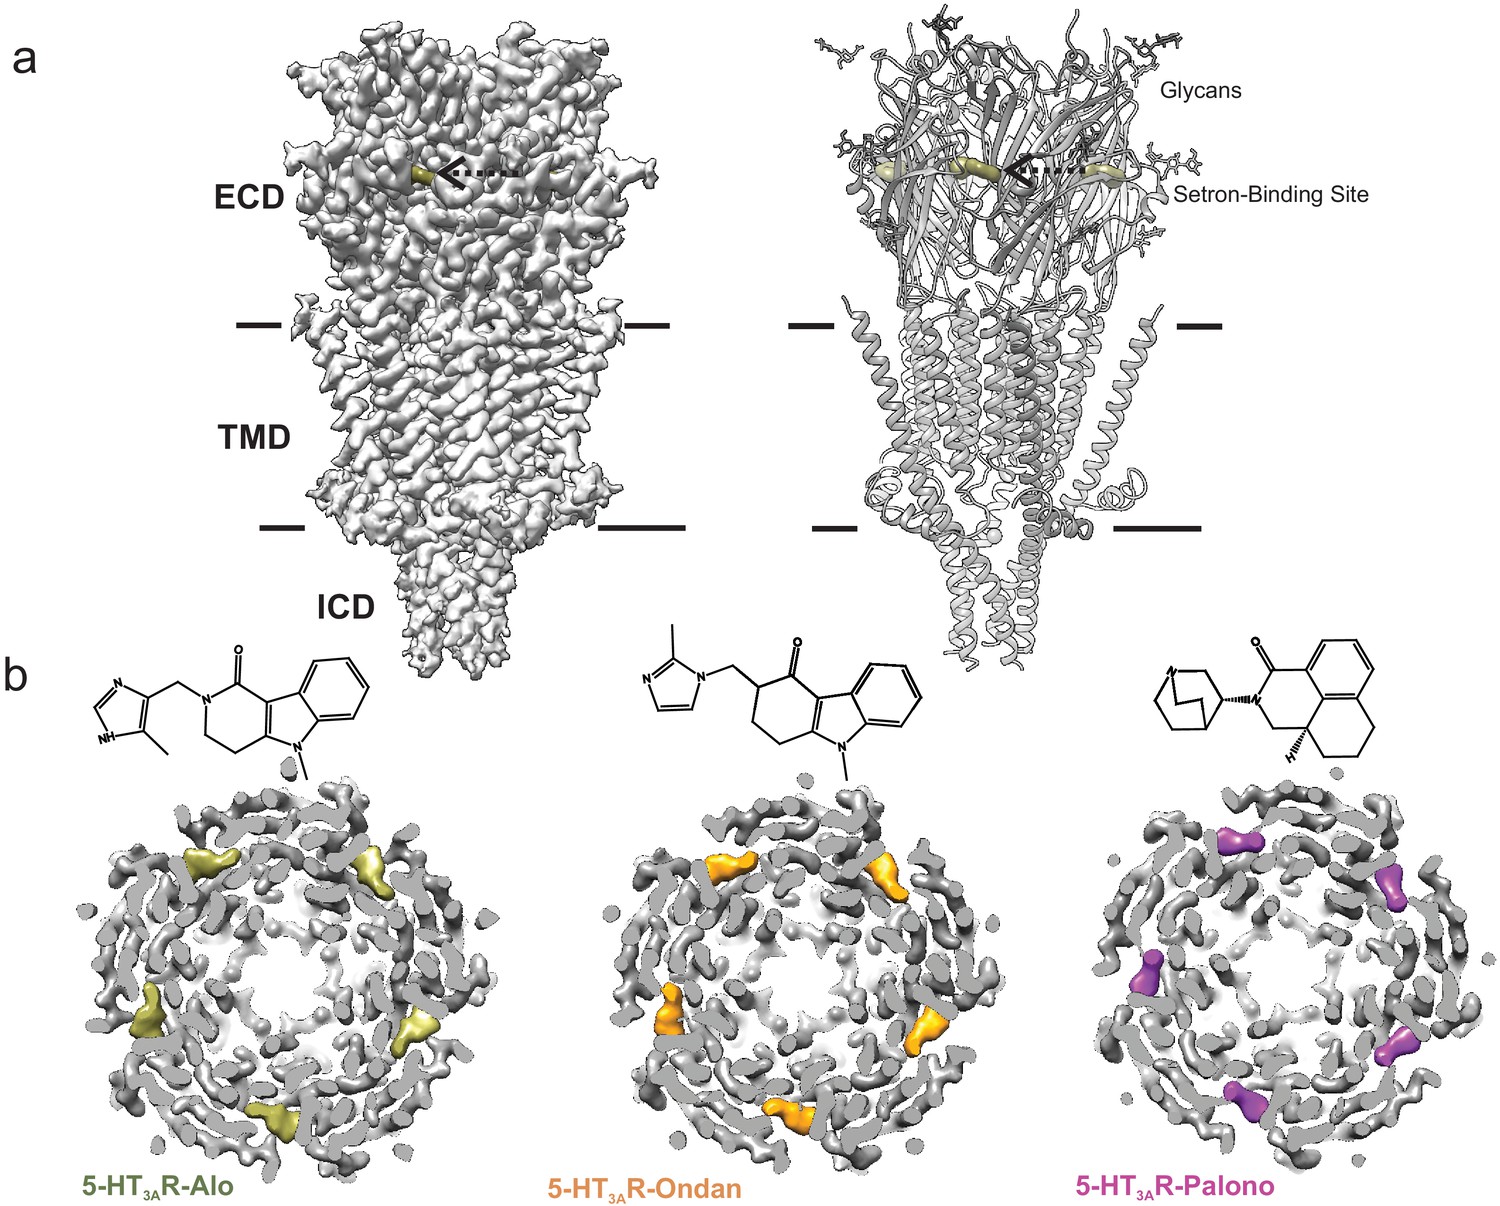
Cryo-EM structure of 5-HT3AR-setron complexes.
(a) Three-dimensional reconstruction of 5-HT3AR-Alo at 2.92 Å resolution (left) and the corresponding structural model (right) that shows the overall architecture consisting of the extracellular domain (ECD), transmembrane domain (TMD), and structural regions of the intracellular domain (ICD). The alosetron density is shown in deep olive color and the three sets of glycans are shown as stick representation. Arrow points toward the setron density. Solid line denotes putative membrane limits. (b) Extracellular view of 5-HT3AR-Alo (left), 5-HT3AR-Ondan (middle), and 5-HT3AR-Palono (right) maps sliced at the neurotransmitter-binding site. In each case, the five molecules of respective setrons are highlighted in colors. Chemical structures of setrons are shown above.
Figure 1—figure supplement 1
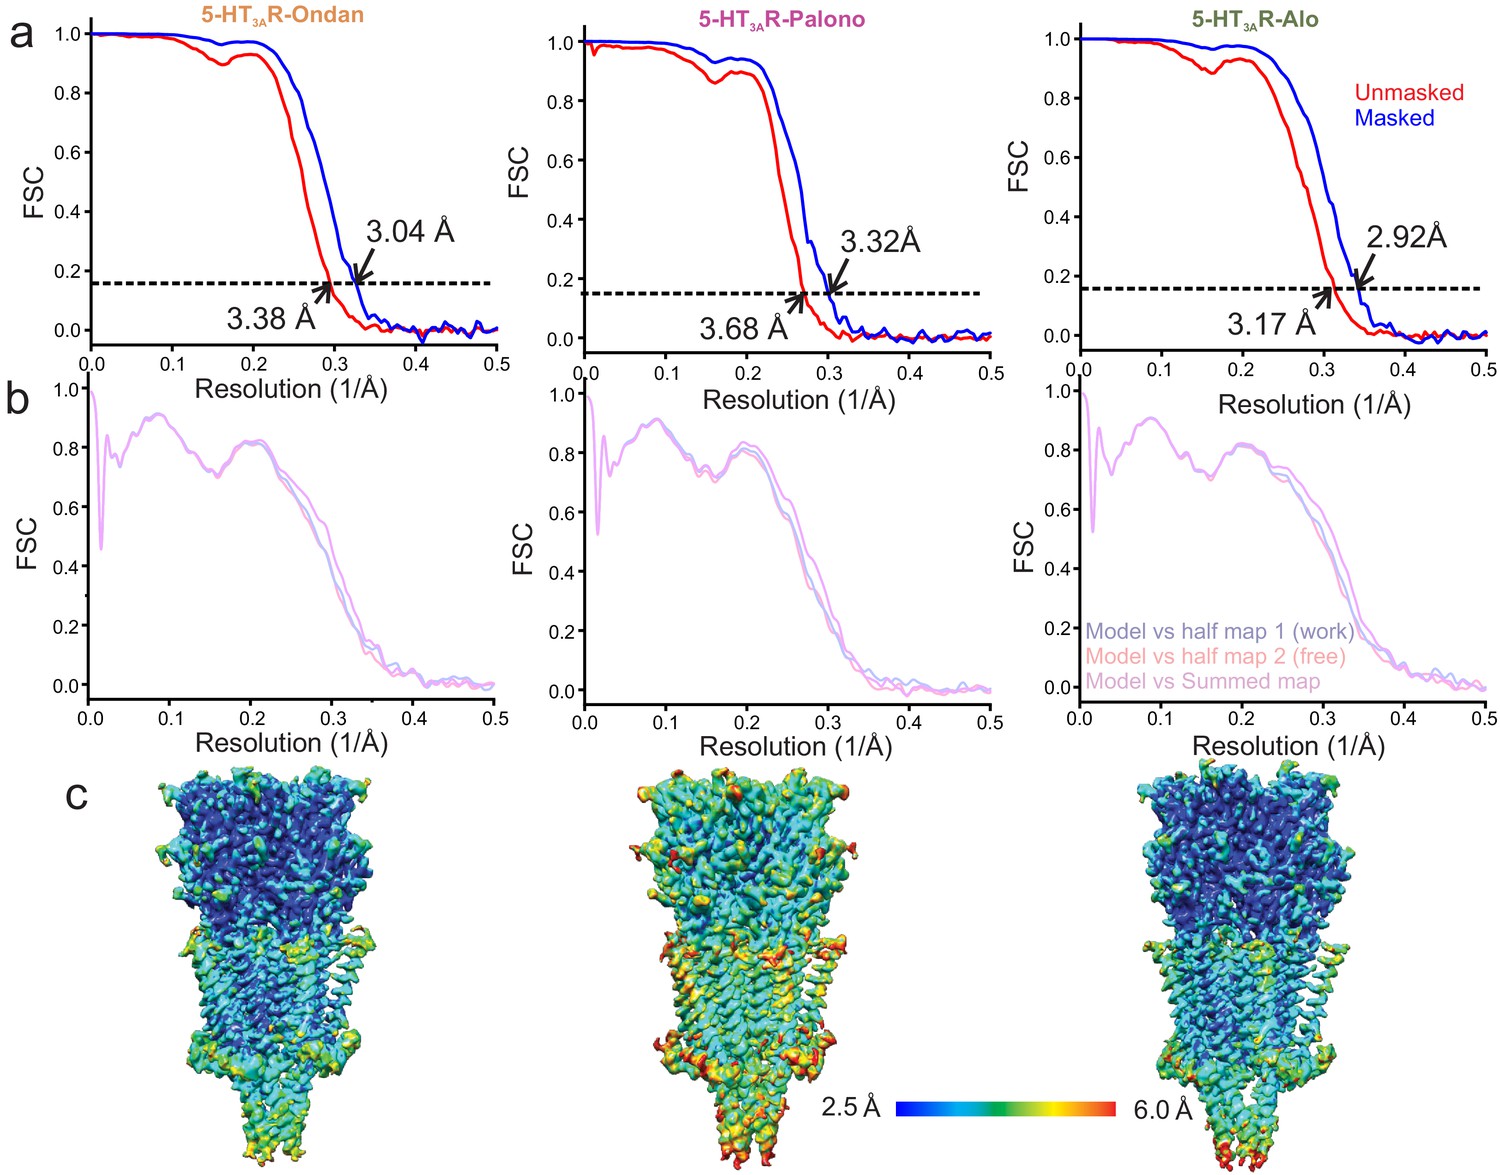
Resolution estimation and validation of Cryo-EM models.
(a) For 5-HT3AR-Ondan (left), 5-HT3AR-Palono (middle), and 5-HT3AR-Alo (right) structures, gold standard Fourier Shell Correlation (FSC) curves generated by comparing two independent half maps produced during refinement in RELION. Horizontal dotted line represents the FSC threshold at 0.143. Nominal resolution of setron-bound 5-HT3AR at FSC0.143 of unmasked (red FSC curve) and masked (blue FSC curve) maps are indicated by arrow. (b) Model and Cryo-EM map correlation indicates no model bias in 5-HT3AR. (c) Side-view of setron-5-HT3AR maps colored based on the local resolution.
Figure 1—figure supplement 2
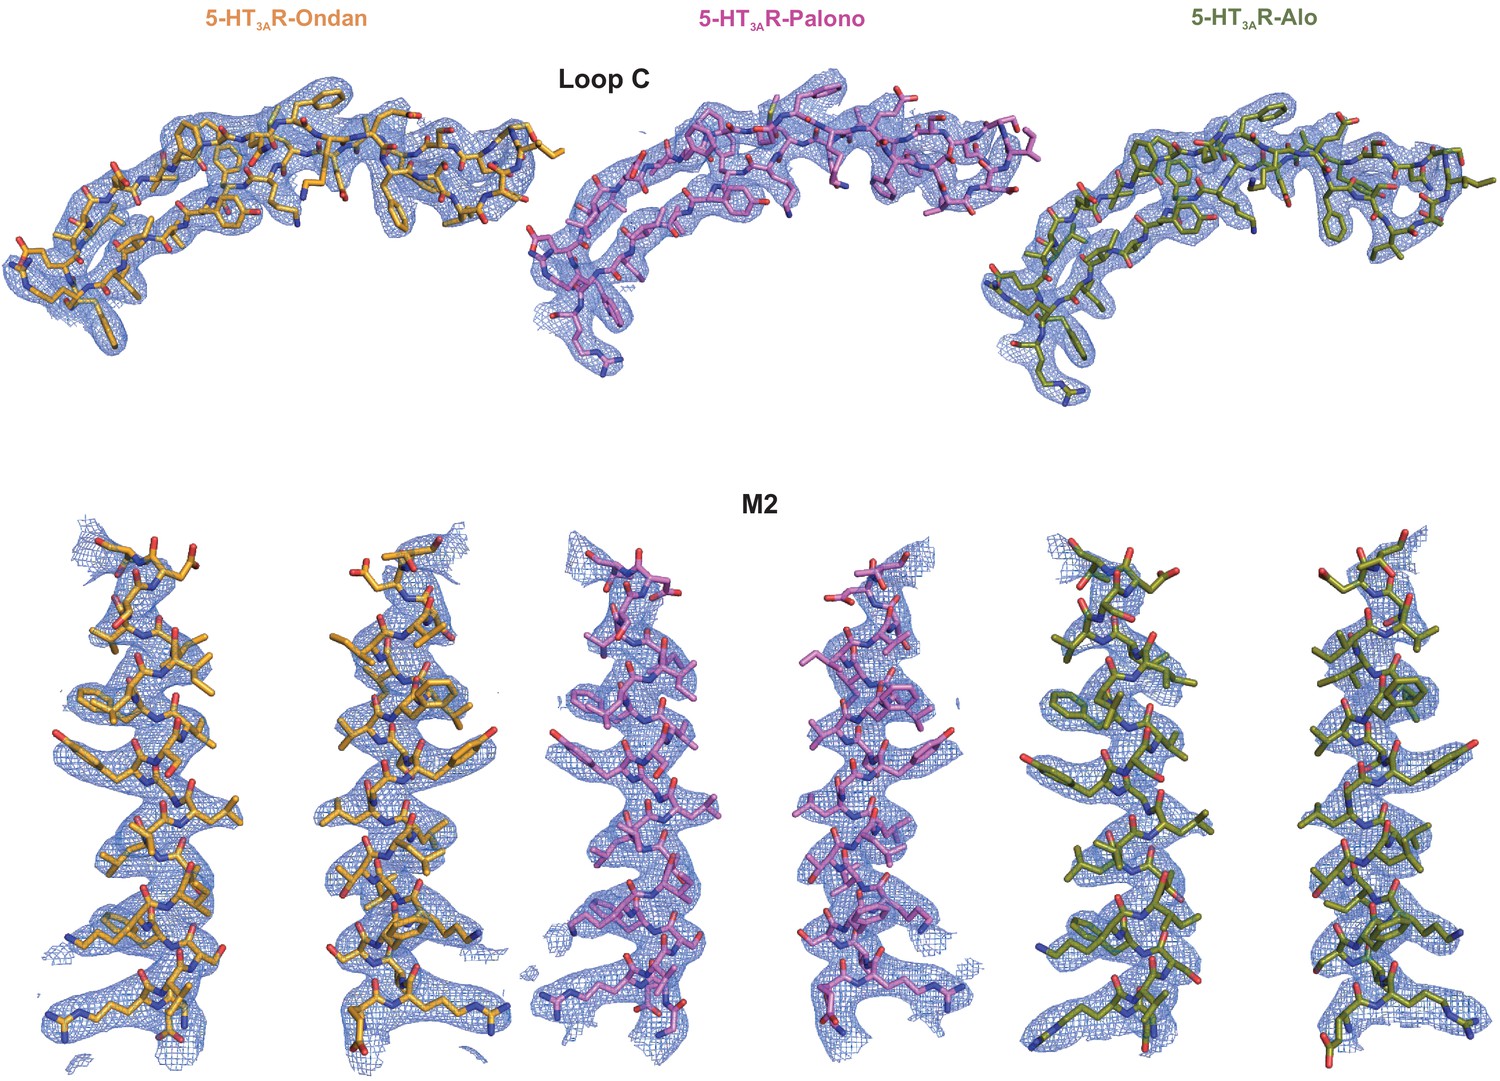
Assessment of Cryo-EM map quality and model fitting in the map.
Validation of Loop C modelling in the setron-5-HT3AR maps (top). Residues are represented in stick and densities are shown in blue mesh. Loop C meshes are contoured as follows: 5-HT3AR-Ondan (left) at 6 σ, 5-HT3AR-Palono (middle) at 7 σ, and 5-HT3AR-Alo (right) at 6 σ. Cryo-EM densities are shown for the M2 helices (bottom; two subunits are shown for clarity). Contour level of the mesh for 5-HT3AR-Ondan (left), 5-HT3AR-Palono (middle), and 5-HT3AR-Alo are each at 5σ.
Figure 2 with 2 supplements

Setron-binding poses.
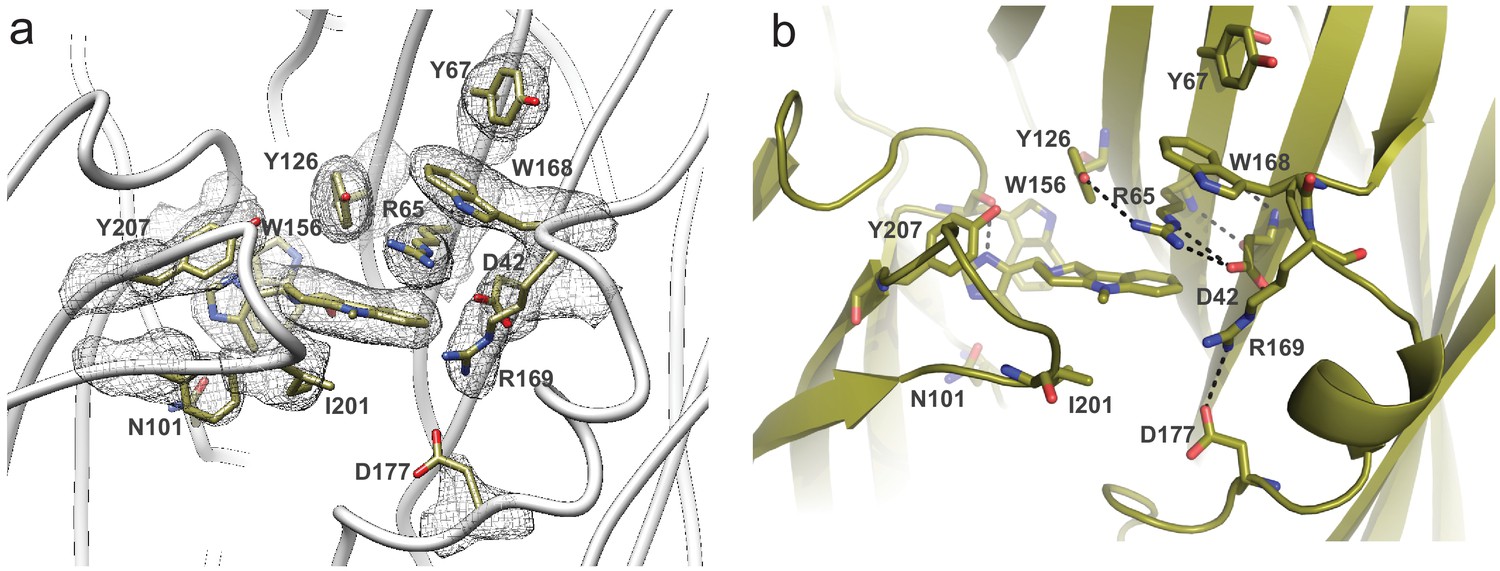
(a) Cryo-EM density for the setrons, located at the canonical neurotransmitter-binding site. The map is contoured at 9σ (5-HT3AR-Grani) (Basak et al., 2019); 8.5σ (5-HT3AR-Palono); 7σ (5-HT3AR-Ondan); 6σ (5-HT3AR-Alo). The binding site lies at the interface of the principal (colored) and the complementary (gray) subunits. The binding-site residues are shown in stick representation with residues from the principal subunit labeled in black and those from the complementary subunit in magenta. From top to bottom: 5-HT3AR-Grani, 5-HT3AR-Palono, 5-HT3AR-Ondan, and 5-HT3AR-Alo. (b) LigPlot analysis of setron-5-HT3AR interactions. Most interactions with the setron are hydrophobic in nature (shown by red arch with spikes). Putative hydrogen bond between Trp156 and alosetron is shown as a green dotted line.
Figure 2—figure supplement 1
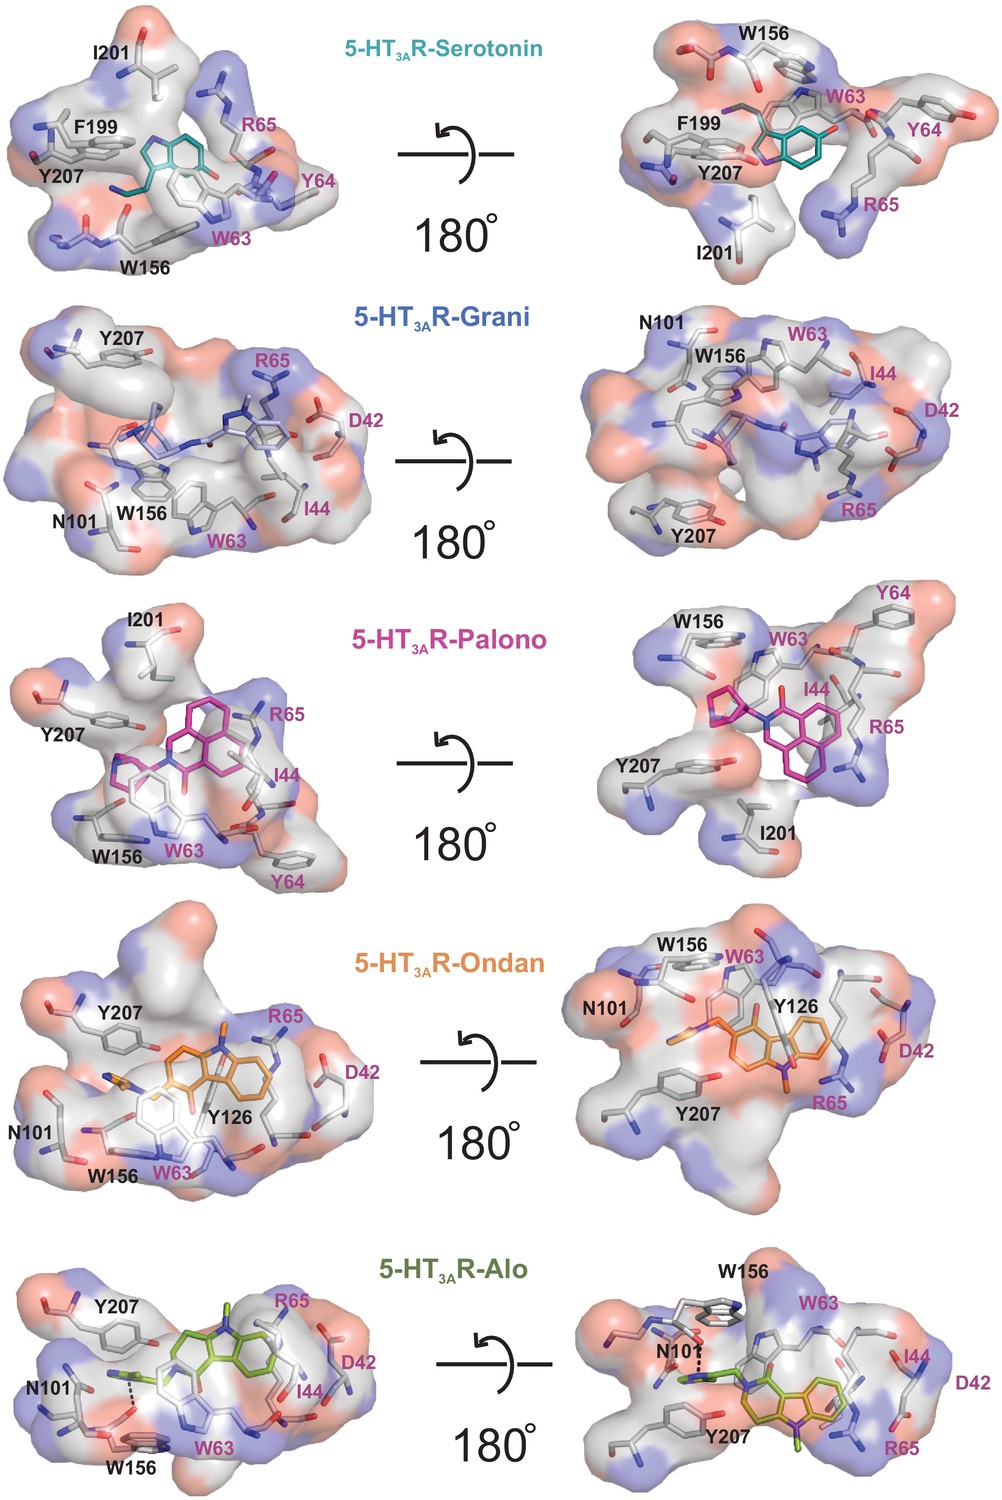
Interaction of setrons with neighboring residues.
The binding-site interactions are calculated by LigPlot. Surface and stick representation of residues which are interacting with setron. Residues from the principal subunit are labeled in black and those from the complementary subunit in magenta. Surface shown in gray represents hydrophobic interactions. The polar surface around nitrogen and oxygen are colored in blue and red, respectively. The hydrogen bond between Trp156 and alosetron is shown as a dotted line.
Figure 2—figure supplement 2
Arrangement of residues lining the binding site as seen in 5-HT3AR-Alo.
(a) The density map around the binding-site residues contoured at 9σ. (b) A close-up, side-view of the subunit-interface reveals extensive interactions between residues on the complementary subunit. Side chains which are within 4 Å distance are marked by dotted line.
Figure 3 with 2 supplements
Assessment of conformation stability of ligand-binding poses by molecular dynamic simulations.
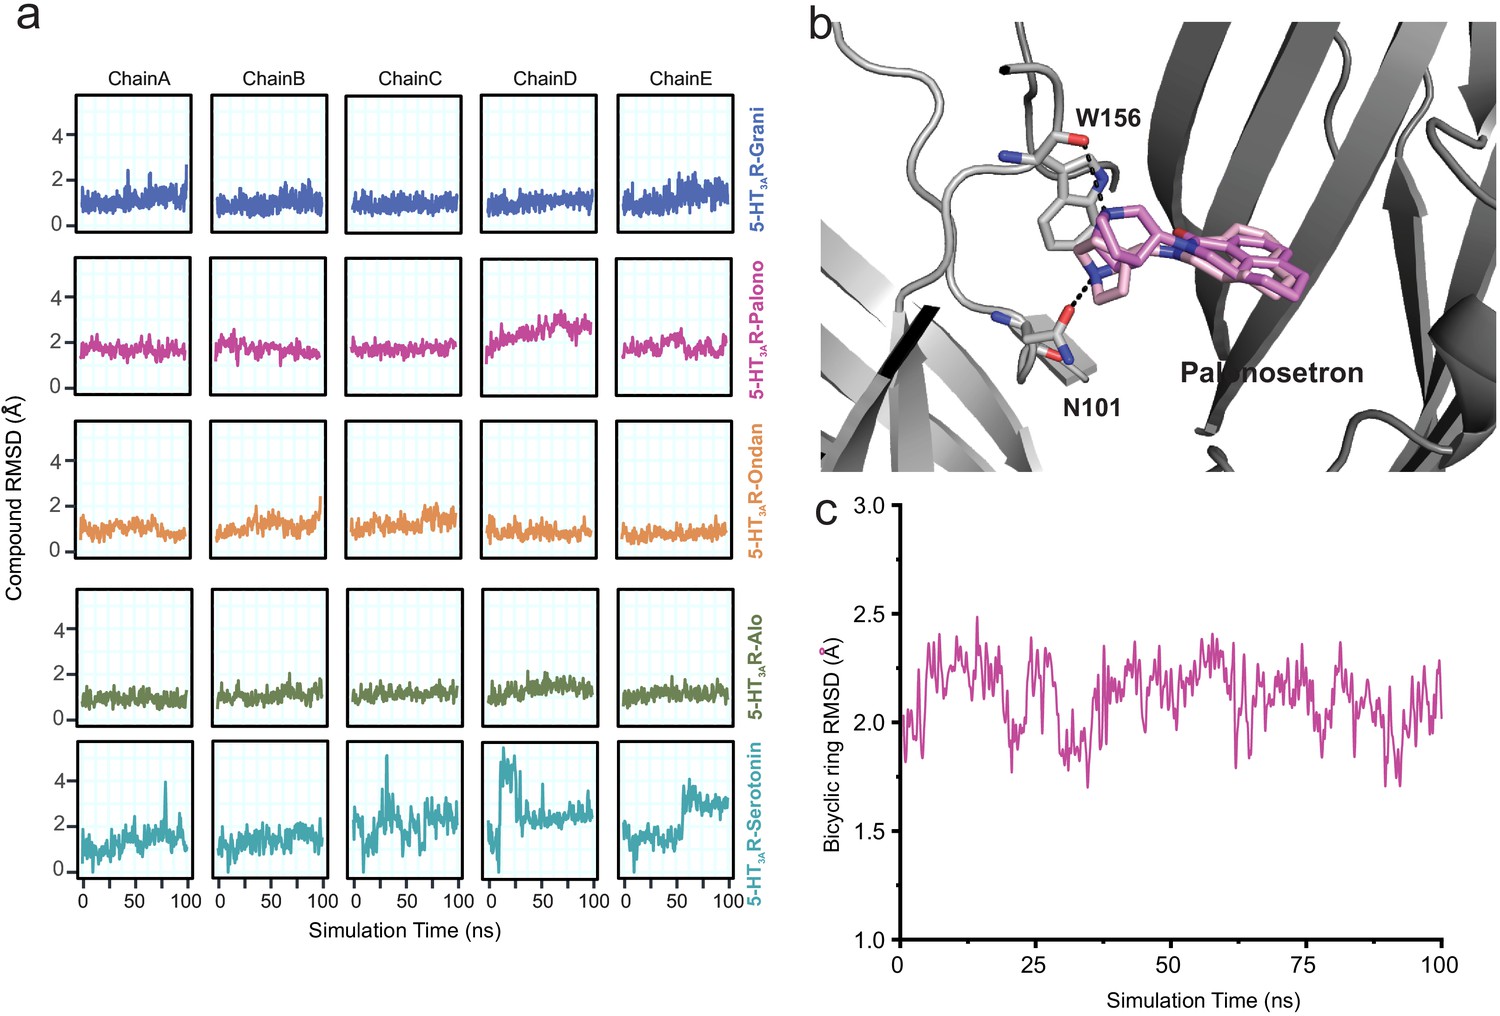
(a) Time evolution of root mean square deviation (RMSD) of setrons’ and serotonin’s heavy atoms relative to their initial cryo-EM conformations of 5-HT3AR for each protomer subunit. (b) Representative views of various palonosetron orientations during the 100 ns simulation. When the tertiary amine nitrogen in the bicyclic ring is pointing up, it interacts with the carbonyl oxygen of Trp156 and when it points down, it interacts with carbonyl oxygen of Asn101 side chain. (c) Time evolution of Root Mean Square Deviation (RMSD) of the bicyclic ring to its initial cryo-EM position.
Figure 3—figure supplement 1
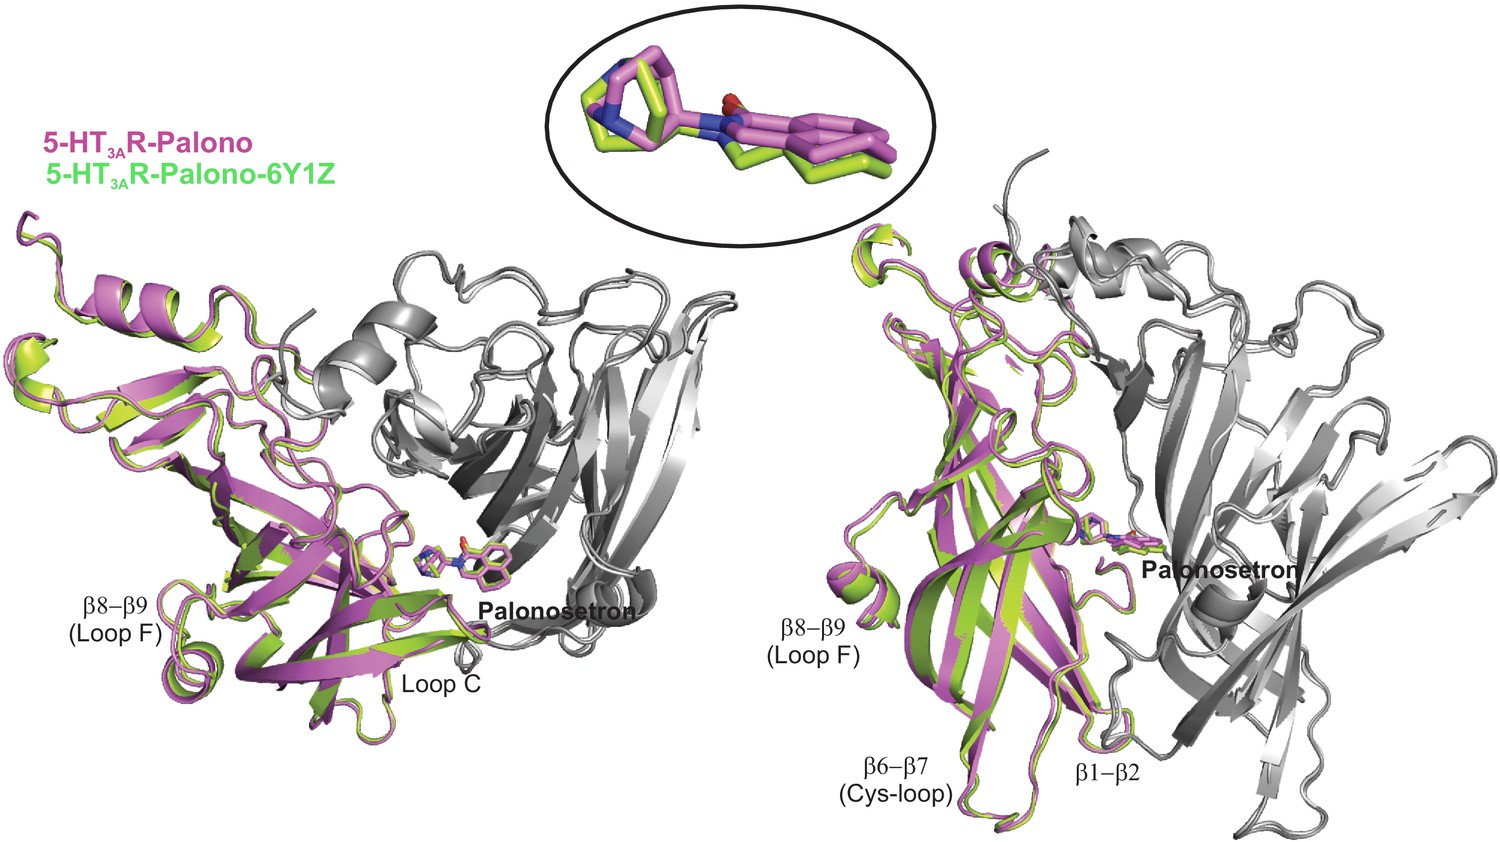
Alignment of 5-HT3AR-Palono with PDBID: 6Y1Z.
Top and side-views of aligned 5-HT3AR-Palono and 6Y1Z (Zarkadas et al., 2020) structures. The ECD from two adjacent subunits are shown with the principal subunit in color. The palonosetron molecule in the structures is shown in stick representation. A zoomed-in view of palonosetron in the two structures is shown in the inset.
Figure 3—figure supplement 2
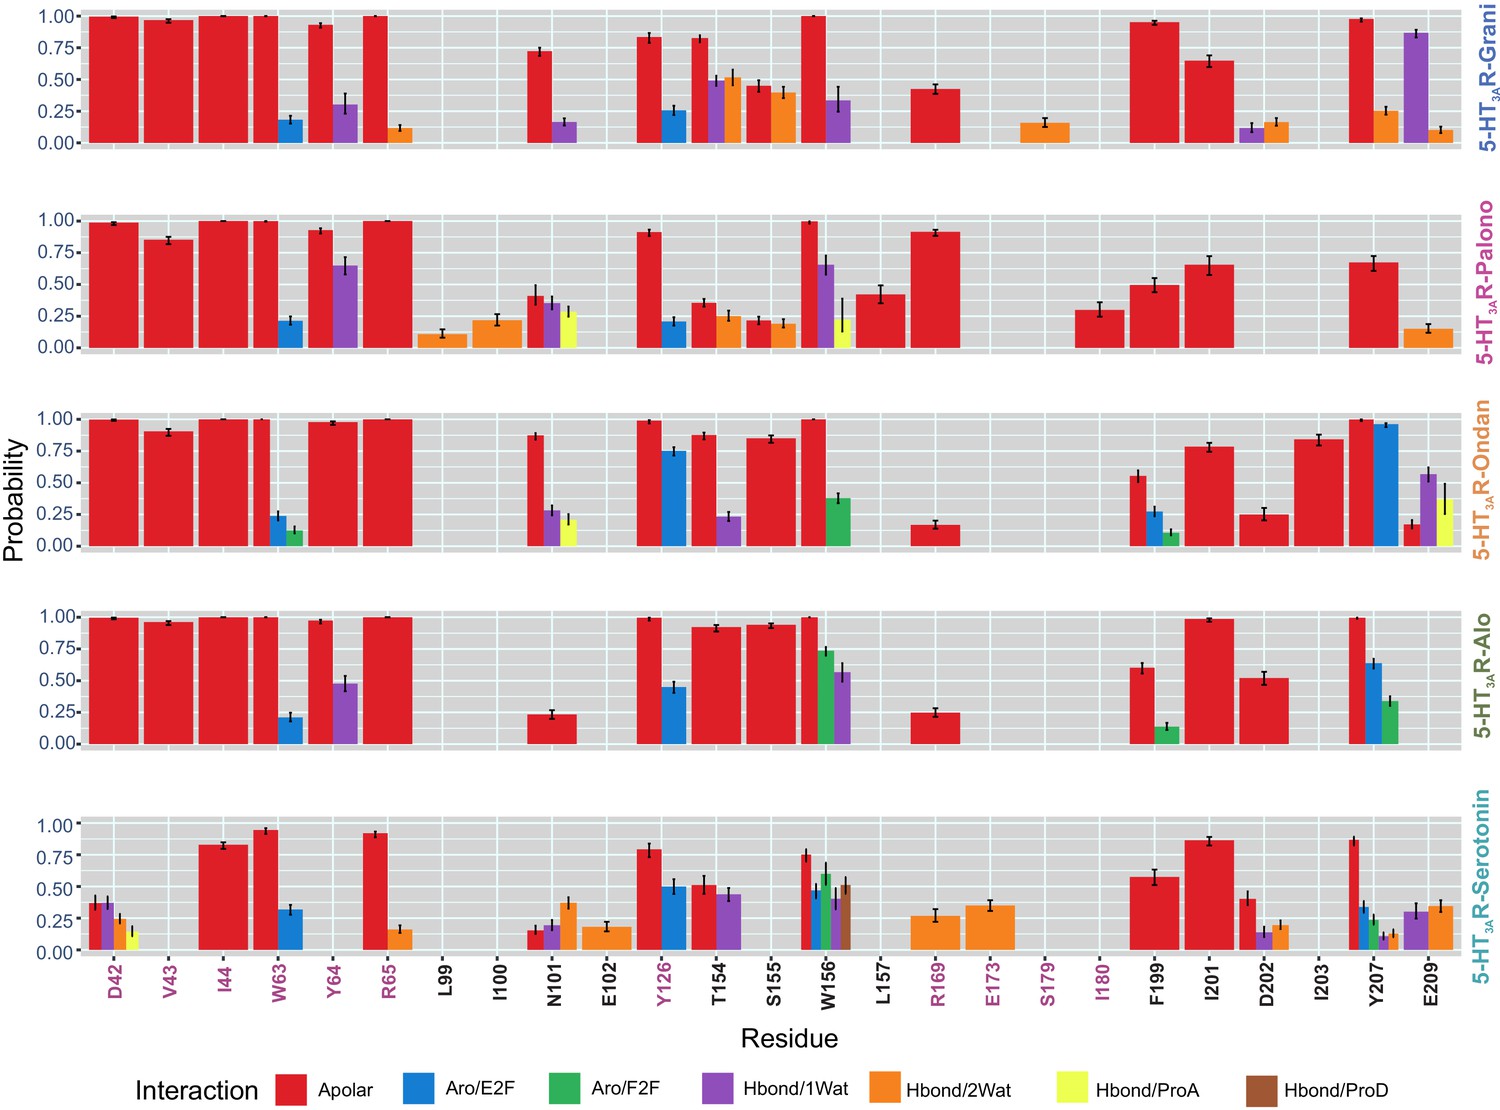
Interaction Fingerprints in 5-HT3AR-setrons and 5-HT3AR-serotonin structures.
Molecular interactions between setron and 5-HT3AR in 5-HT3AR-Grani, 5-HT3AR-Palono, 5-HT3AR-Ondan, 5-HT3AR-Alo and between serotonin and 5-HT3AR in 5-HT3AR-Serotonin structures during MD simulation. 5-HT3AR-setron interaction fingerprints were derived for each ligand-protein complex by averaging across each protomer chain from 100 ns MD simulations. Interactions were assessed between ligand and protein and reported for those that had an average probability above 10%. Nine interaction types were calculated: apolar (hydrophobic), face-to-face aromatic (Aro_F2F), edge-to-face aromatic (Aro_E2F), hydrogen bond with the protein as hydrogen-bond donor (Hbond_ProD), hydrogen bond with the protein as hydrogen- bond acceptor (Hbond_ProA), electrostatic with the protein positively charged (Elec_ProP), electrostatic with the protein negatively charged (Elec_ProN), one-water-mediated and two-water-mediated hydrogen-bond interactions (Hbond_1Wat and Hbond_2Wat). Electrostatic interactions with positively charged protein residues (Elec_ProP) were not found in any of our studied setron-bound 5-HT3AR simulations.
Figure 4 with 1 supplement
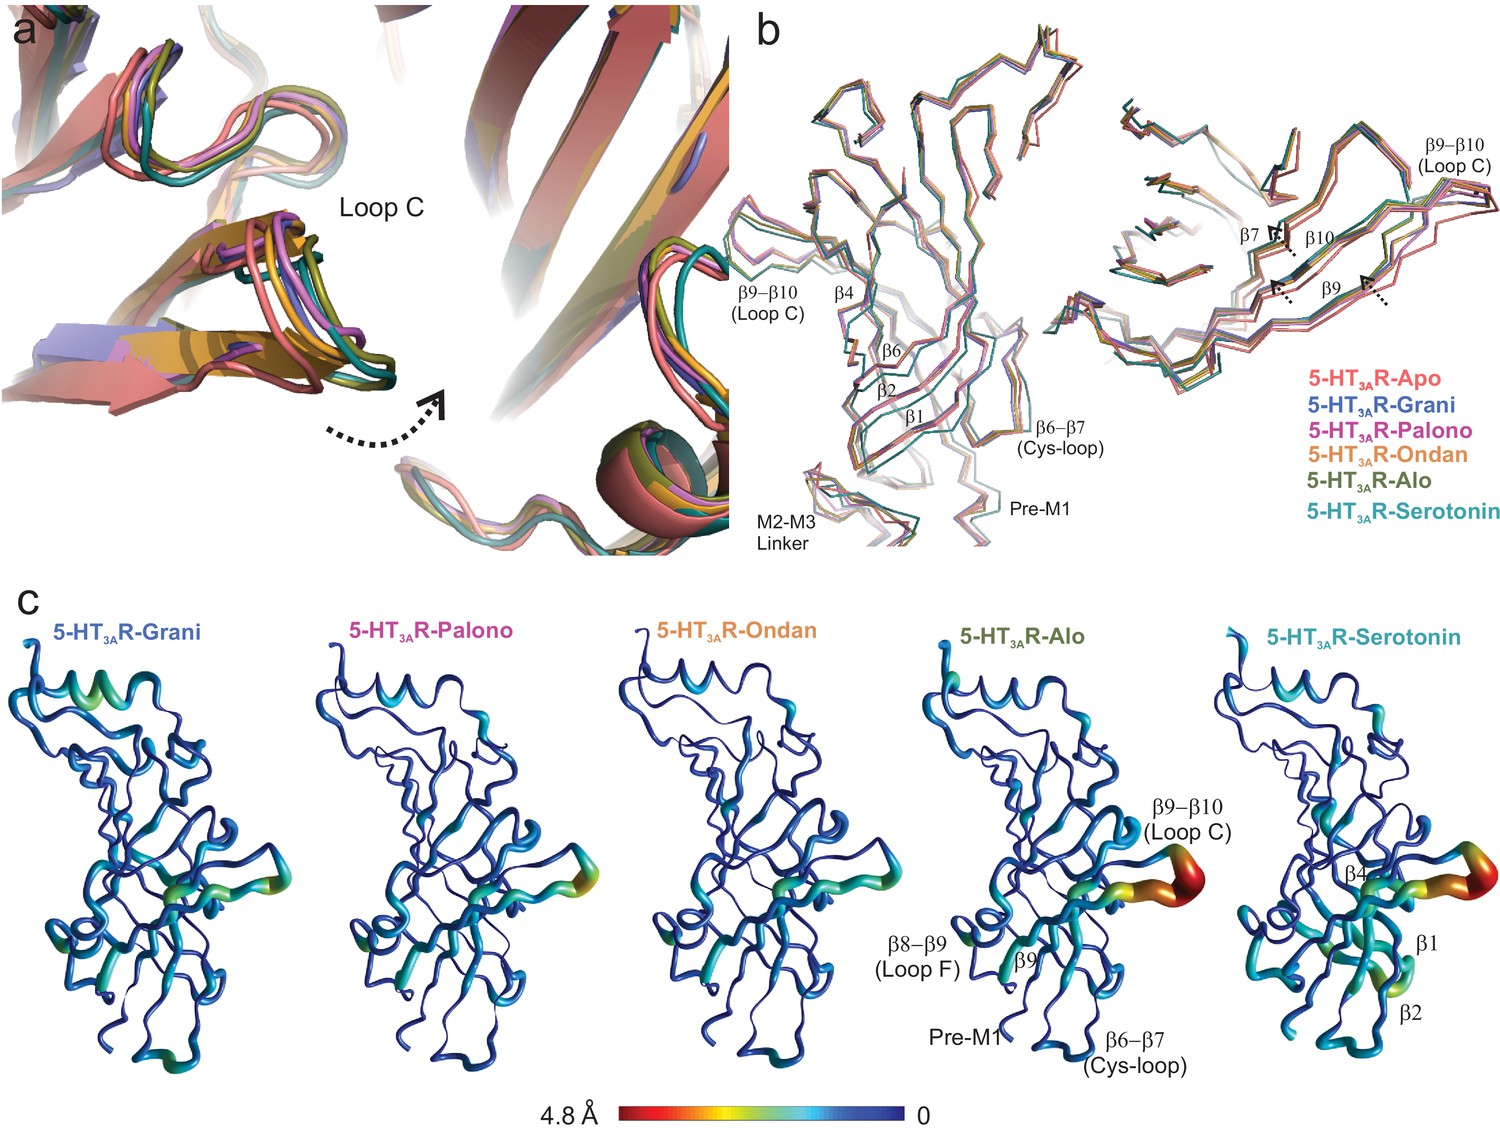
Setron-binding pocket and conformational changes in Loop C.
(a) Global alignment of 5-HT3AR-Apo, 5-HT3AR-State1 (serotonin-bound), 5-HT3AR-Grani, 5-HT3AR-Palono, 5-HT3AR-Ondan, and 5-HT3AR-Alo structures. With respect to 5-HT3AR-Apo, the serotonin- and setron- bound conformations reveal an inward positioning of Loop C (shown by arrow). (b) Relative displacement of the inner β-strands seen from a side-view (left panel) and the outer β-strands seen from the top (right panel). Arrows indicate the direction of movement. (c) Pentameric assembly of setron- and serotonin-bound structures were aligned to Apo-5-HT3AR. A cubic spline interpolation was then done to smoothly connect cα displacement for each structure and mapped by short cylinders, whose diameters are equivalent to the displacement at that position compared to Apo-5-HT3AR. The color was also scaled to the same value using the color map shown. The analysis was done in Matlab v2019a (Mathworks, Natick MA).
Figure 4—figure supplement 1
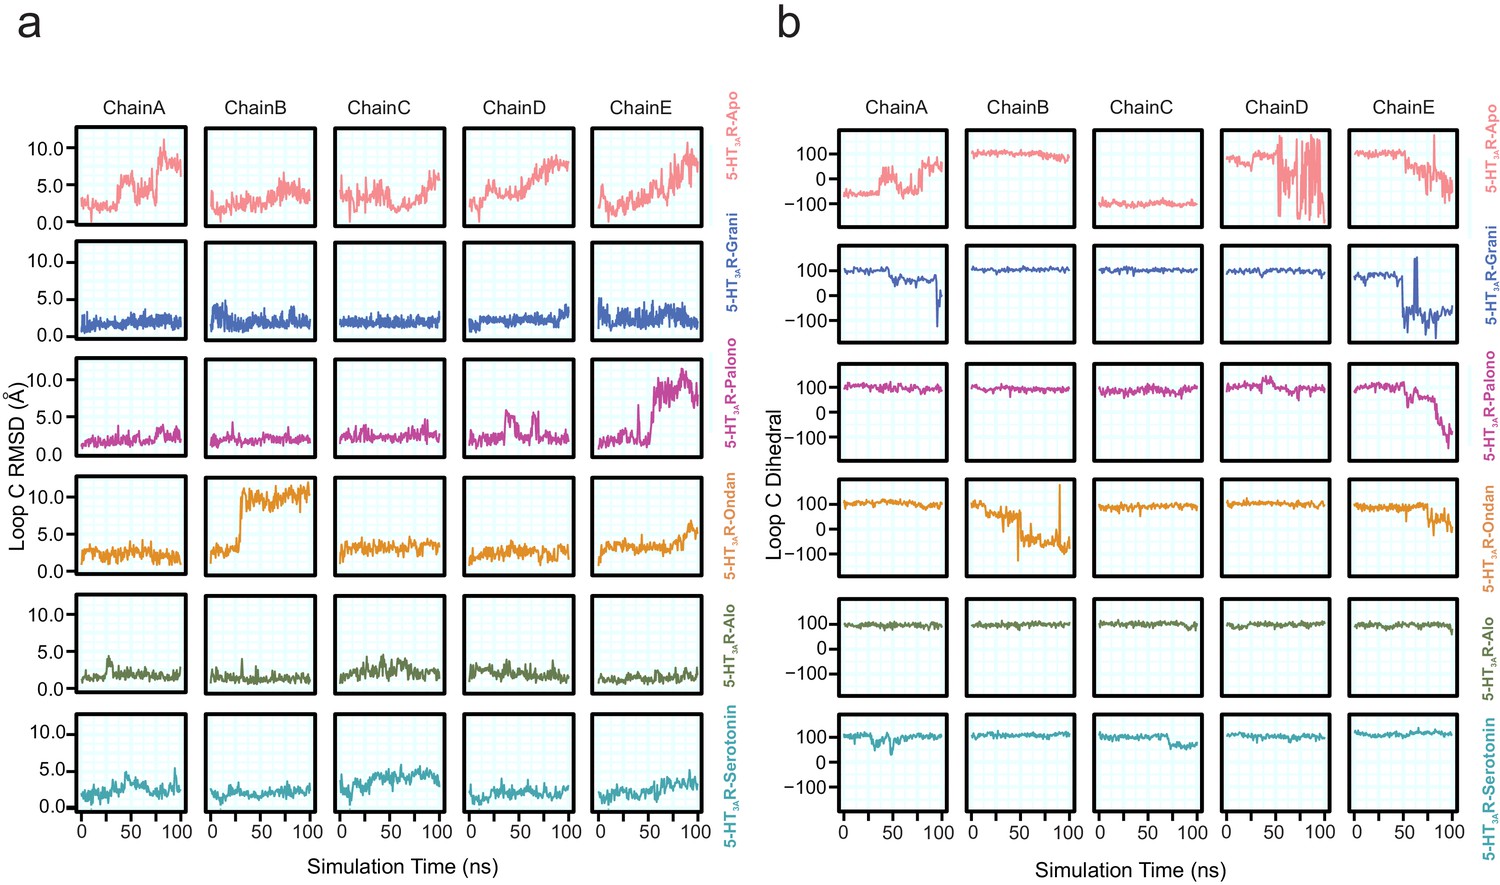
Conformational differences in Loop C.
(a) Time evolution of loop C RMSD evaluated by quantifying the distance of Cα, carbonyl carbon, and backbone nitrogen atoms of residues Ser200 to Asn205 relative to their initial cryo-EM conformations separated by protomer chain. (b) Time evolution of loop C custom dihedral (defined as a dihedral drawn from Cα atoms of residues Ala208, Phe199, Glu198, and Ile203). Loop C is oriented away from the binding site when this dihedral is measured to be large and is oriented toward the binding site when this dihedral is low or negative.
Figure 5
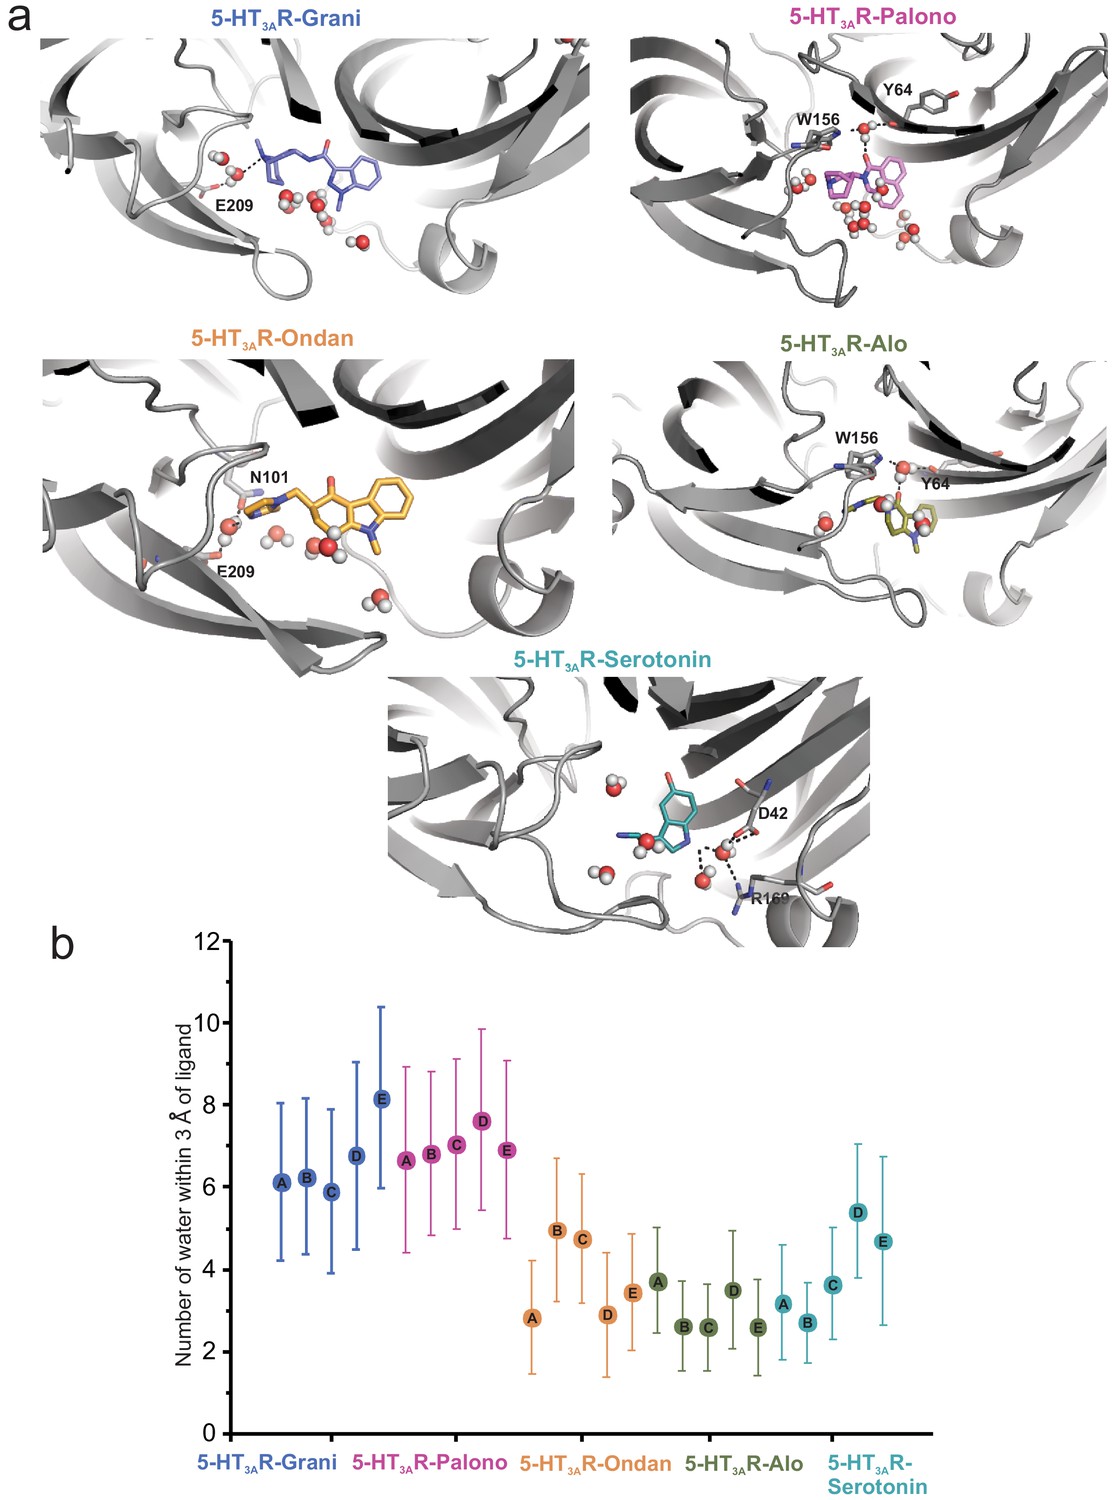
Assessment of the number of water molecules present within each ligand-binding site during MD simulation.
(a) Snapshots during the simulation showing water molecules in the pocket. (b) Average number of water molecules (defined as a count of water oxygen atoms within 3 Å of any setron atoms) for each setron- and serotonin-bound simulation subdivided by protomer and the corresponding standard deviation.
Figure 6
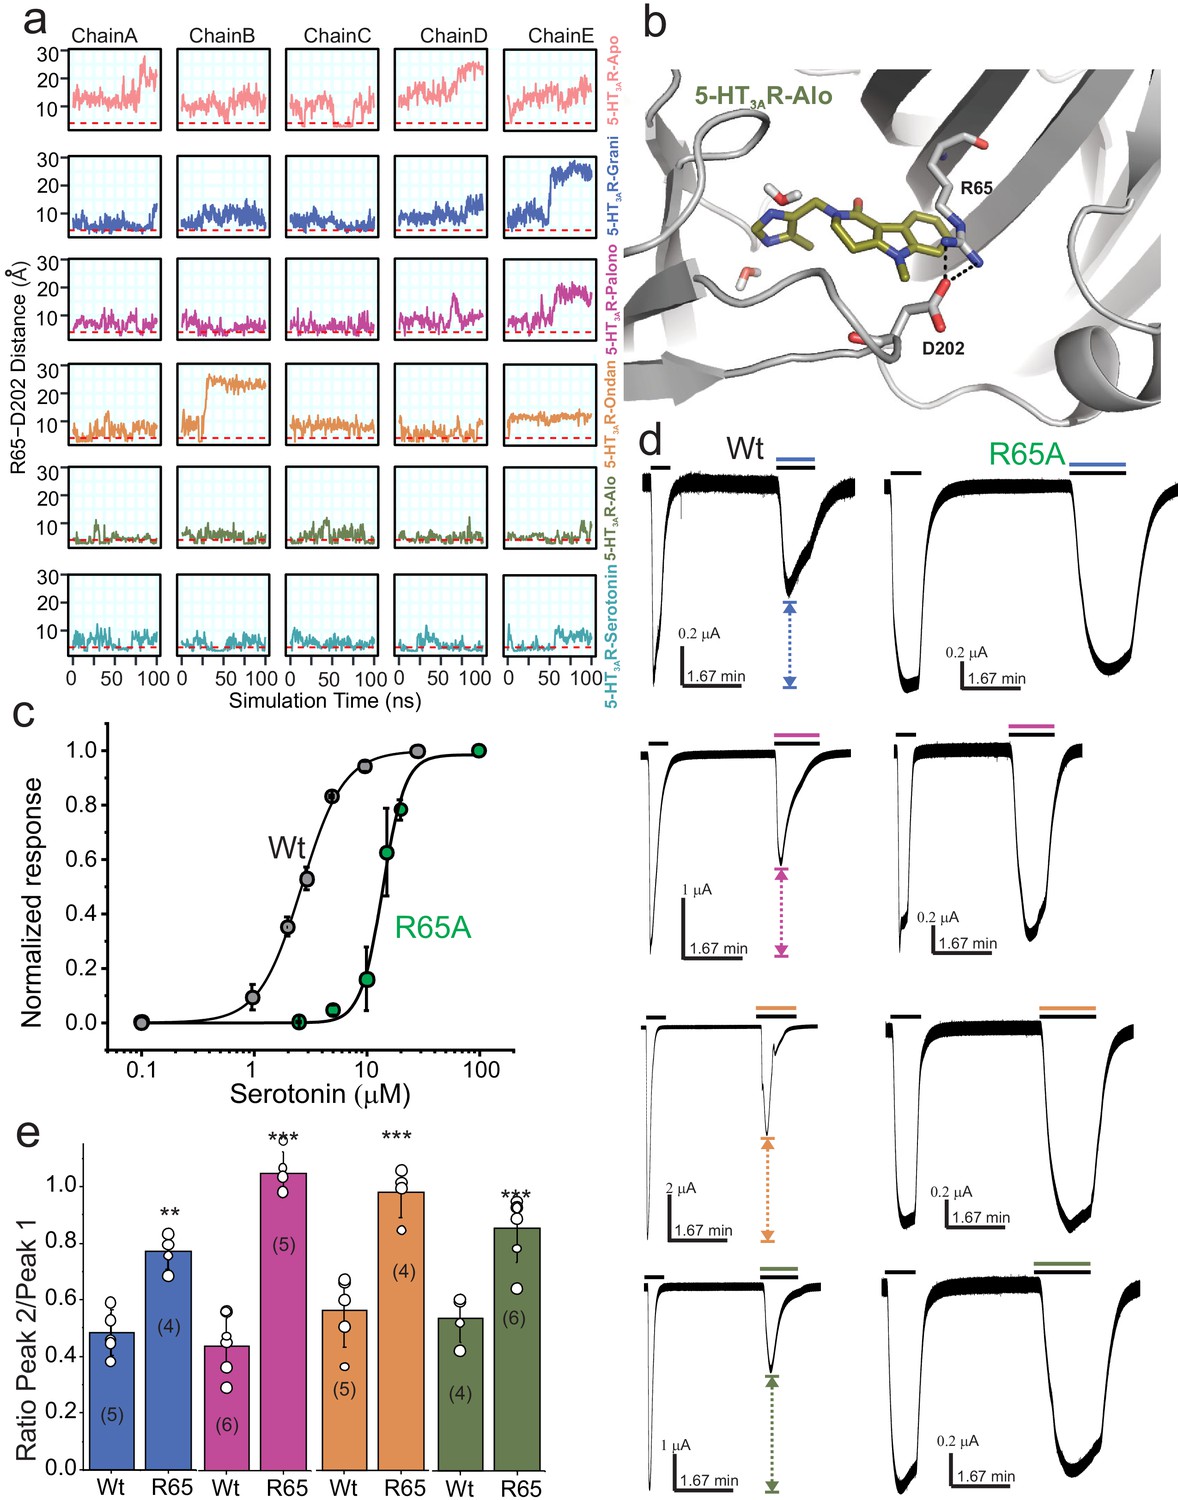
Dynamic interaction between Arg65 and Asp202.
(a) Time evolution of the minimum distance between side-chain polar atoms of Arg65 and Asp202 throughout 100 ns simulations. A 4 Å distance threshold is shown as a red dashed line to denote a generous cutoff for H-bond interactions between these residues. (b) MD snapshot that show the Arg65-Asp202 interaction. (c) Dose-response curve for serotonin activation measured by TEVC recordings (at −60 mV) for WT 5-HT3AR and R65A expressed in oocytes. The EC50, the Hill coefficient (nH), and the number of independent oocyte experiments are: WT (EC50: 2.70 ± 0.09 μM; nH: 2.3 ± 0.17; n: 3) and R65A (EC50: 13.79 ± 0.50 μM; nH: 4.4 ± 0.59; n: 4) (Basak et al., 2019) (d) Functional analysis of Arg65. Currents were elicited in response to serotonin (concentrations used near EC50 values WT- 2 μM, and R65A- 10 μM) with and without co-application of setrons. Dotted arrows show the extent of setron inhibition in each case. (e) A plot of the ratio of peak current in the presence of setron to peak current in the absence of setron is shown for WT and R65A. Data are shown as mean ± s.d (n is indicated in parenthesis). Significance at p=0.01 (***) and p=0.05 (**) calculated by two sample t-test for wild type and R65A.
-
Figure 6—source data 1
Source Data for Figure 6c and e.
- https://cdn.elifesciences.org/articles/57870/elife-57870-fig6-data1-v2.xlsx
Figure 7 with 2 supplements
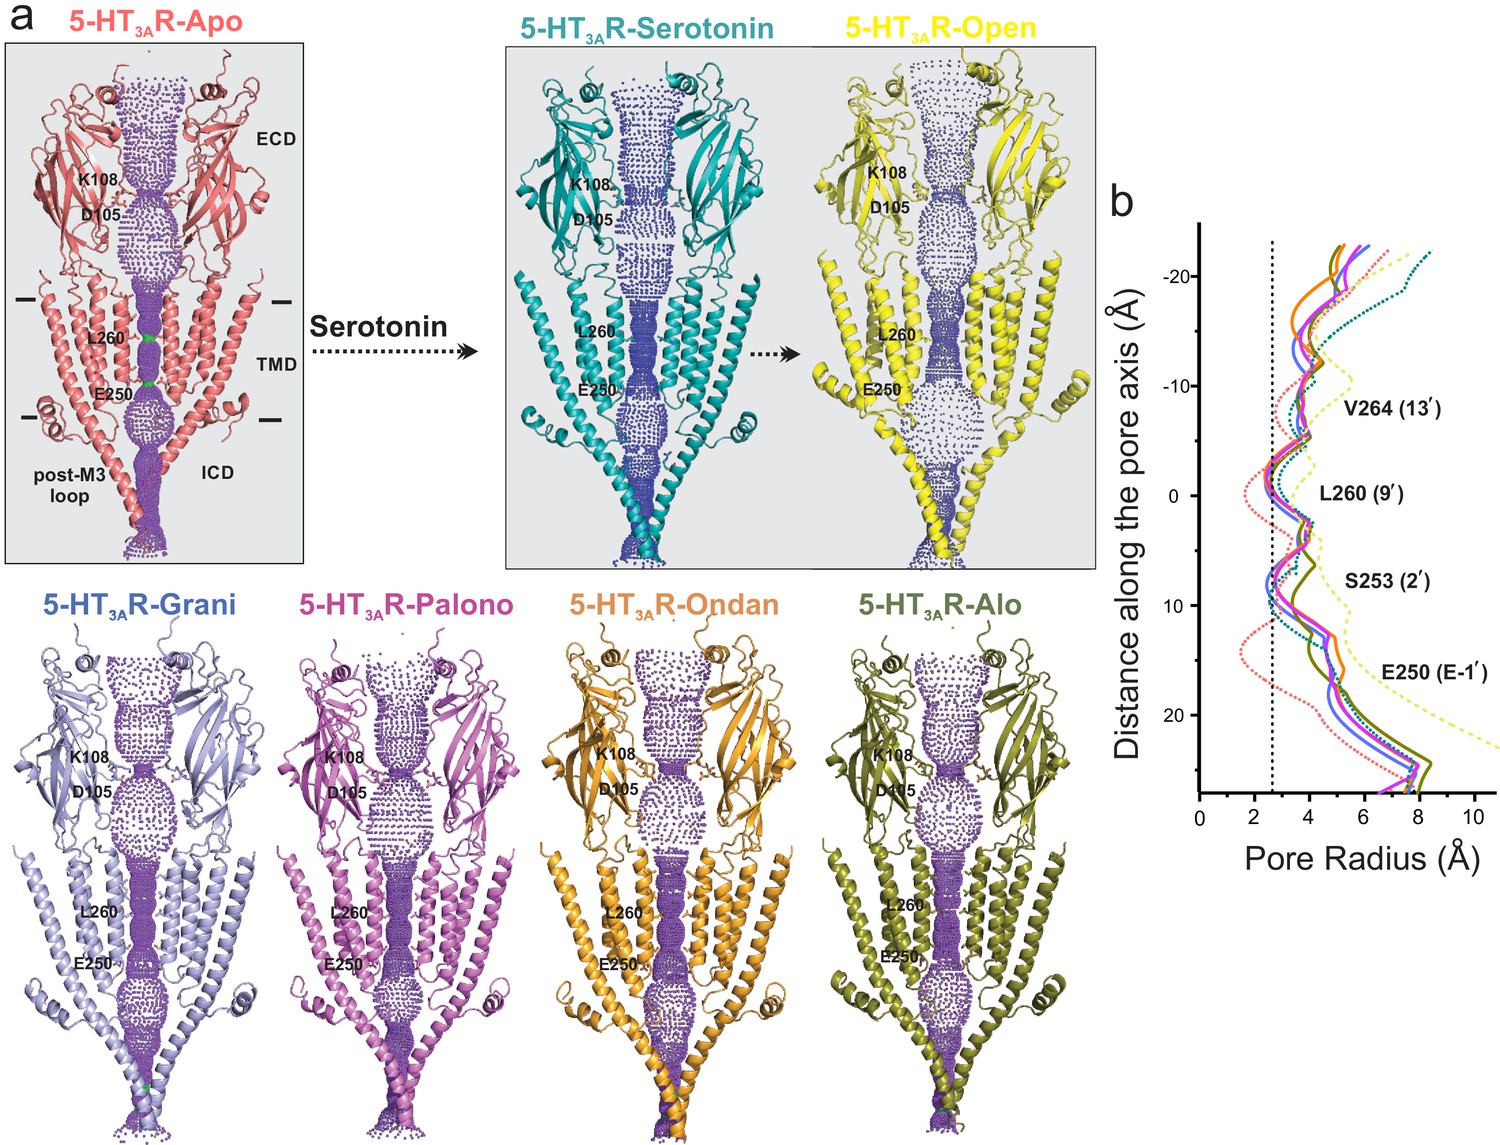
Pore profiles of 5-HT3AR in Apo, serotonin-, and setron- bound states.
(a) Ion conduction pathway predicted by HOLE (Smart et al., 1996). Models are shown in cartoon representation. Only two subunits are shown for clarity. The locations of pore constrictions are shown as sticks. (b) The pore radius is plotted as a function of distance along the pore axis. The dotted line indicates the approximate radius of a hydrated Na+ ion which is estimated at 2.76 Å (right) (Marcus, 1988).
Figure 7—figure supplement 1
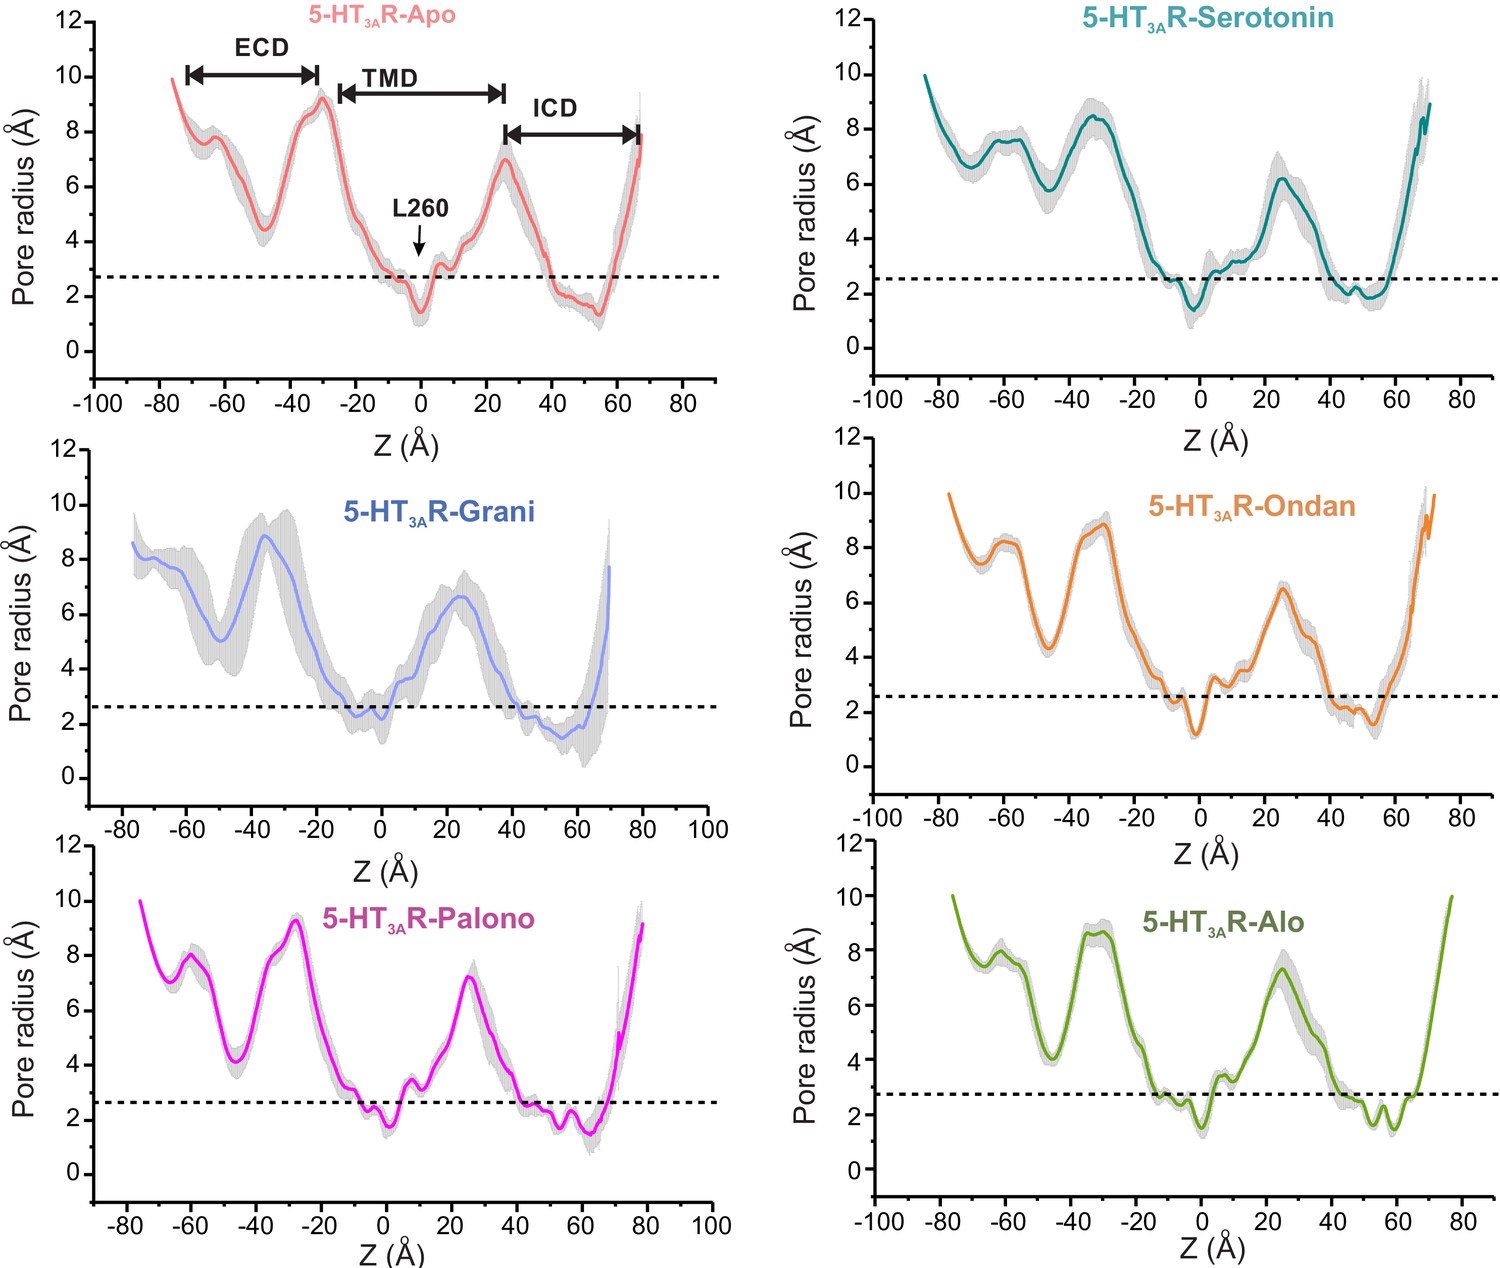
Assessment of pore radii of 5-HT3AR structures in the Apo, setron-, and serotonin-bound states by MD simulations.
Unrestrained simulation for each structure is performed in POPC bilayer for 100 ns. The mean radius of ion permeation pathway is calculated for each of the equidistant simulation frame by HOLE program (Smart et al., 1996). The gray plot represents the standard deviations of all the frames.
Figure 7—figure supplement 2
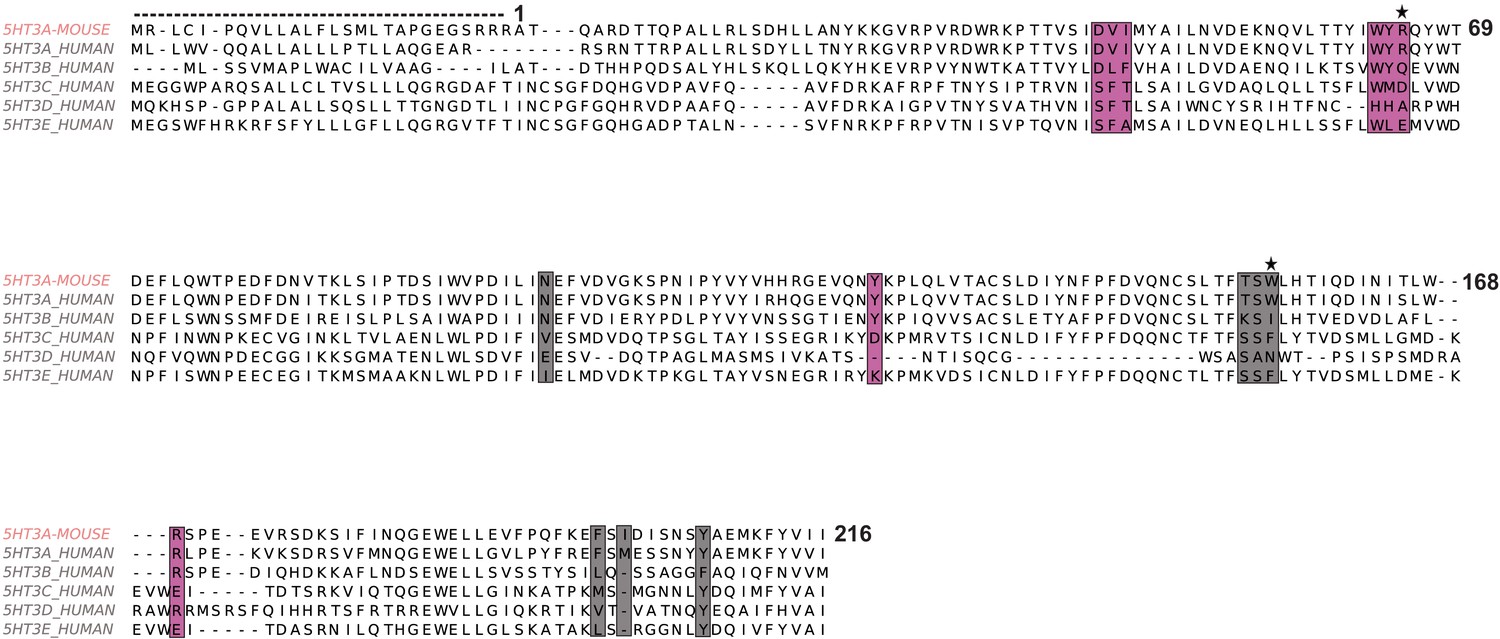
Multiple sequence alignment of 5-HT3R.
Clustal ω sequence alignment of mouse 5HT3AR subunit and human 5HT3A-E subunits. Key binding-site residues at the neurotransmitter-binding site which interact with setrons and serotonin are highlighted in gray (principal) and magenta (complementary). Dotted line above the 5HT3A-mouse subunit indicates the signal sequence. Position of Trp156 and Arg65 are indicated by asterisk. Residue numbering for the sequence is based on mouse 5-HT3AR PDBID: 6BE1 (Basak et al., 2018a).
Tables
Table 1
Cryo-EM data collection/processing.
| 5-HT3A-Alosetron (EMDB-21511; PDB-6W1J) | 5-HT3A-Ondansetron (EMDB-21512; PDB-6W1M) | 5-HT3A-Palonosetron (EMDB-21518; PDB-6W1Y) | |
|---|---|---|---|
| Data collection and processing | |||
| Magnification | 105,000x | ||
| Voltage (kV) | 300 | ||
| Data collection mode | Super-resolution | ||
| Electron exposure (e–/Å2) | 50 | ||
| Defocus range (μm) | −1.2 to −2.5 | ||
| Physical Pixel size (Å/pixel) | 0.848 | ||
| Symmetry-imposed | C5 | ||
| Initial particle images (no.) | 568,452 | 449,628 | 1,114,542 |
| Final particle images (no.) | 42,065 | 67,333 | 91,163 |
| Map resolution (unmasked, Å) at FSC143 | 3.2 | 3.4 | 3.7 |
| Map resolution (masked, Å) at FSC143 | 2.92 | 3.06 | 3.32 |
| Map resolution range (Local resolution) | 2.5–4.5 | 2.5–4.5 | 2.5–4.5 |
| Refinement | |||
| Initial model used (PDB code) | 6BE1 | 6BE1 | 6BE1 |
| Map sharpening B-factor (Å2) | −30 | −30 | −70 |
| Model composition Non-hydrogen atoms Protein residue numbers Ligand atoms | 16,861 393 586 | 16,885 394 585 | 16,885 394 585 |
| B-factors (Å2) Protein Ligand | 101.61 103.61 | 115.04 100.96 | 132.89 116.04 |
| R.m.s. deviations Bond lengths (Å) Bond angles (°) | 0.008 0.910 | 0.008 0.991 | 0.009 1.069 |
| Validation MolProbity score Clashscore Poor rotamers (%) | 1.38 (97th Percentile) 2.22 (99th Percentile) 0.82 | 1.48 (96th Percentile) 3.19 (97th Percentile) 0.27 | 1.41 (97th Percentile) 2.53 (98th Percentile) 0.82 |
| Ramachandran plot Favored (%) Allowed (%) Disallowed (%) | 94.40 5.60 0.00 | 94.62 5.38 0.00 | 94.62 5.38 0.00 |
Additional files
Download links
A two-part list of links to download the article, or parts of the article, in various formats.
Downloads (link to download the article as PDF)
Open citations (links to open the citations from this article in various online reference manager services)
Cite this article (links to download the citations from this article in formats compatible with various reference manager tools)
High-resolution structures of multiple 5-HT3AR-setron complexes reveal a novel mechanism of competitive inhibition
eLife 9:e57870.
https://doi.org/10.7554/eLife.57870


