Nanobody-directed targeting of optogenetic tools to study signaling in the primary cilium
- Institute of Innate Immunity, Biophysical Imaging, Medical Faculty, University of Bonn, Germany
- Department of Molecular Sensory Systems, Center of Advanced European Studies and Research (caesar), Germany
- Center for Molecular Signaling (PZMS), Center of Human and Molecular Biology (ZHMB), Saarland University, School of Medicine, Germany
- Lehrstuhl für Biochemie, Universität Bayreuth, Germany
- Research Center for Bio-Macromolecules, Universität Bayreuth, Germany
- Bayreuth Center for Biochemistry & Molecular Biology, Universität Bayreuth, Germany
- Kavli Institute for Systems Neuroscience and Centre for Neural Computation, The Faculty of Medicine, Norwegian University of Science and Technology, Norway
- Department of Neurology and Clinical Neurophysiology, St. Olavs University Hospital, Norway
- Institute of Innate Immunity, Emmy Noether research group, Medical Faculty, University of Bonn, Germany
- Core Facility Nanobodies, University of Bonn, Germany
- Research Group Molecular Physiology, Center of Advanced European Studies and Research (caesar), Germany
Figures
Figure 1

Direct ciliary targeting of optogenetic tools impairs protein function.
(A) Localization of mNphp3(201)-bPAC-mCherry to primary cilia. mIMCD-3 cells expressing mNphp3(201)-bPAC-mCherry were labeled with an anti-acetylated tubulin antibody (cyan, ciliary marker) and with DAPI (blue) to label the DNA. The box indicates the position of the magnified view shown at the bottom right. Red arrow indicates the direction and the length of the shift of the respective fluorescence channel. Scale bar: 10 μm. (B) Localization of mNphp3(201)-LAPD-mCherry to primary cilia. mIMCD-3 cells expressing mNphp3(201)- LAPD-mCherry were labeled with an anti-acetylated tubulin antibody (cyan, ciliary marker) and DAPI (blue) to label the DNA. The box indicates the position of the magnified view shown at the bottom right. Red arrow indicates the direction and the length of the shift of the respective red channel. Scale bar: 10 μm. (C) Assays to measure bPAC or LAPD activity using Ca2+ imaging. HEK293 cells express the CNGA2-TM ion channel, which opens upon cAMP binding and conducts Ca2+ (HEK-TM) (Wachten et al., 2006). Light-dependent activation of bPAC increases intracellular cAMP levels, leading to a Ca2+ influx, which was quantified using a fluorescent Ca2+ dye (GFP-certified FluoForte). To measure LAPD activity, HEK-TM cells were pre-stimulated with 100 μM NKH477 to activate transmembrane adenylyl cyclases (AC), thus increasing cAMP levels. Ca2+ influx was detected by a Ca2+ dye (Fluo4-AM). (D) Quantification of bPAC activity. GFP-certified-FluoForte-loaded HEK-TM cells expressing mCherry only (grey), bPAC-mCherry (blue), or mNphp3(201)-bPAC-mCherry (cyan) were stimulated with 465 nm light pulses (1 mW/cm²) of different length and the increase in the intracellular Ca2+ concentration was measured. To evoke a maximal Ca2+ response, cells were stimulated with 2 μM ionomycin. Data are shown as mean ± SD (dotted lines) for the normalized fluorescence (F-F(baseline))/(F(ionomycin)-F(baseline))/fraction of mCherry-positive cells, n = 3 independent experiments (each data point represents the average of a duplicate or triplicate measurement). (E) Mean peak amplitudes of the Ca2+ signal at 3–6 min after the first light pulse. Data are shown as individual data points and mean ± SD, n = 3. (F) Quantification of LAPD activity. Fluo4-AM-loaded HEK-TM cells expressing LAPD-mCherry (red) or mNphp3(201)-LAPD-mCherry (cyan) were incubated with 100 μM NKH477 during continuous 850 nm light stimulation (0.5 µW/cm²). At steady-state, light stimulation was switched to 690 nm (0.5 µW/cm²). NT: non-transfected cells (grey). Data are shown as mean ± SD (dotted lines) for the normalized fluorescence (F-F(baseline))/(F(ionomycin)-F(baseline)). (G) Mean decrease of the Ca2+ signal after 690 nm light stimulation (fraction of maximum value after NKH477 increase), determined over 45 s at 3 min after switching to 690 nm. Data are shown as individual data points and mean ± SD, n = 4 independent experiments (each data point represents the average of a duplicate or triplicate measurement); p-values calculated using a paired, two-tailed t-test are indicated. NT: non-transfected cells.
Figure 2 with 3 supplements
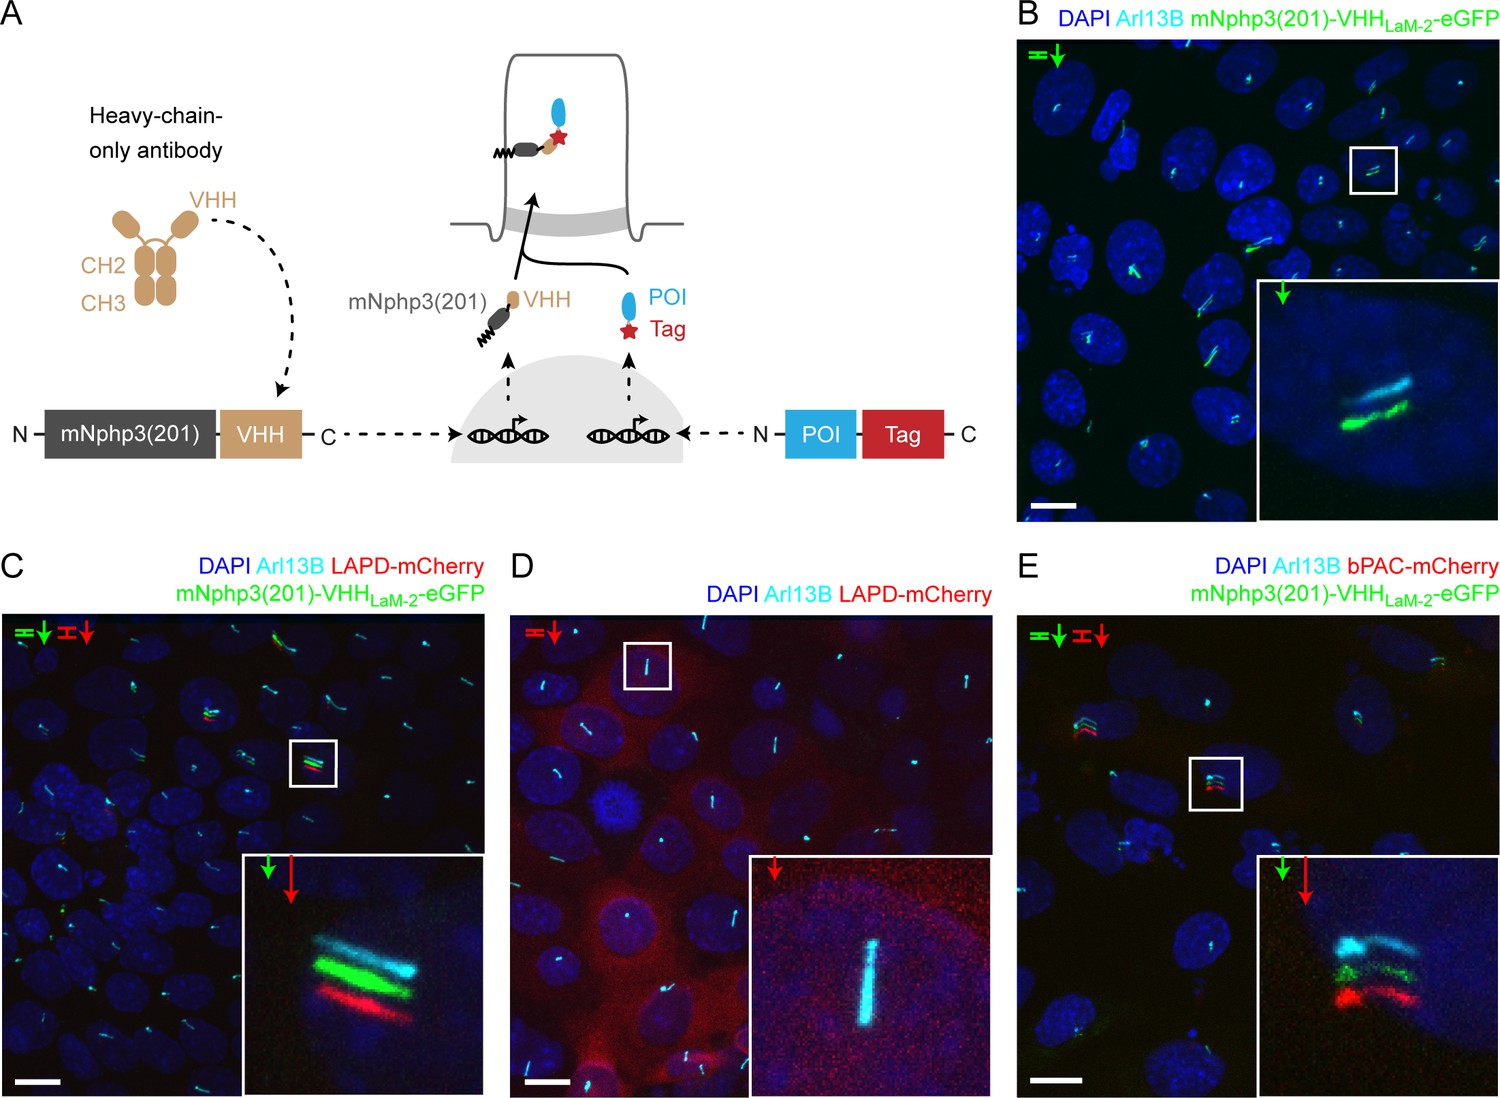
Targeting optogenetic tools to the primary cilium using nanobodies.
(A) Schematic overview of the targeting approach. Nanobodies were fused to the C terminus of mNphp3(201) for ciliary localization. The protein of interest (POI) is co-expressed with a C-terminal tag or fusion partner that is recognized by the nanobody. Binding of the nanobody to the tag is expected to result in ciliary localization of the POI. (B) Localization of the anti-mCherry nanobody (VHHLaM-2) to primary cilia. mIMCD-3 cells were transfected with mNphp3(201)-VHHLaM-2-eGFP (green). (C) Localization of the anti-mCherry nanobody and LAPD-mCherry to primary cilia. mIMCD-3 cells were co-transfected with mNphp3(201)-VHHLaM-2-eGFP (green) and LAPD-mCherry (red). (D) Cytoplasmic localization of LAPD-mCherry. mIMCD-3 cells were transfected with LAPD-mCherry (red). (E) Localization of the anti-mCherry nanobody and bPAC-mCherry to primary cilia. mIMCD-3 cells were co-transfected with mNphp3(201)-VHHLaM-2-eGFP (green) and bPAC-mCherry (red). All cells shown in B-E were labeled with an Arl13B antibody (cyan, ciliary marker) and DAPI (blue). All scale bars: 10 μm. Boxes indicate the position of the magnified view shown at the bottom right. Arrows in different colors indicate the direction and the length of the shift of the respective fluorescence channel.
Figure 2—figure supplement 1

Nanobody-based ciliary targeting.
(A) Localization of the anti-mCherry nanobody to primary cilia. mIMCD-3 cells were transfected with mNphp3(201)-VHHLaM-4-eGFP (green) and stained with an acetylated tubulin antibody (cyan, ciliary marker) and DAPI (blue). (B) Localization of the anti-mCherry nanobody and LAPD-mCherry to primary cilia. mIMCD-3 cells were co-transfected with mNphp3(201)-VHHLaM-4-eGFP (green) and LAPD-mCherry (red) and labeled with DAPI (blue). (C) Localization of the anti-GFP nanobody mNphp3(201)-VHHenhancer-HA to primary cilia, while LAPD-mCherry resides in the soma. mIMCD-3 cells were co-transfected with mNphp3(201)-VHHenhancer-HA (green) and LAPD-mCherry (red) and stained with an anti-HA antibody (green) and DAPI (blue). Boxes indicate the position of the magnified view shown at the bottom right. Arrows in different colors indicate the direction and the length of the shift of the respective fluorescence channel. Scale bars: 10 µm.
Figure 2—figure supplement 2
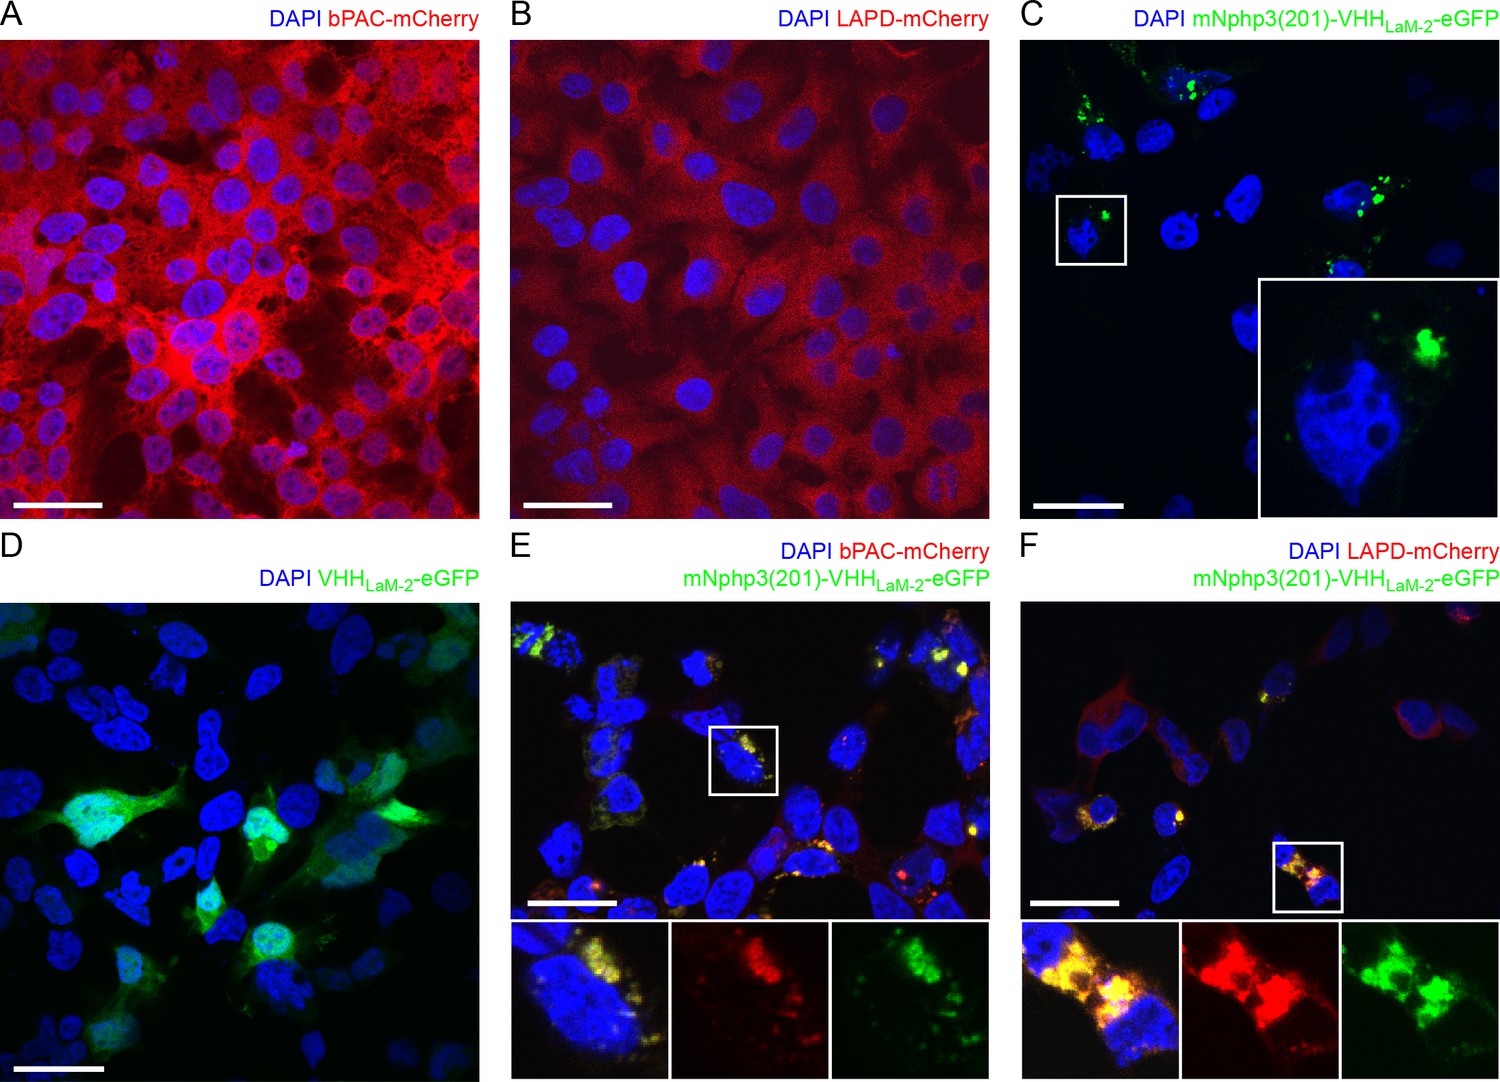
Subcelluar localization of nanobody-targeted optogenetic tools.
(A) HEK-TM cells expressing bPAC. HEK-TM cells stably expressing bPAC-mCherry (red) were fixed and labeled with DAPI (blue). Scale bar: 20 μm. (B) See A. for LAPD-mCherry. (C) HEK-TM cells expressing the cilia-targeted anti-mCherry mNphp3(201)-VHHLaM-2-eGFP (green) nanobody. The box indicates the position of the magnified view shown at the bottom right. (D) HEK-TM cells expressing the anti-mCherry VHHLaM-2-eGFP (green) nanobody. (E) Co-expression of the cilia-targeted anti-mCherry nanobody (LaM-2) (green) and bPAC-mCherry (red) in HEK-TM cells. The box indicates the position of the magnified view shown at the bottom: left: all channels as overlay; center: mCherry channel only; right: eGFP channel only. (F) Co-expression of the cilia-targeted anti-mCherry nanobody (LaM-2) (green) and LAPD-mCherry (red) in HEK-TM cells. The box indicates the position of the magnified view shown at the bottom: left: all channels as overlay; center: mCherry channel only; right: eGFP channel only.
Figure 2—figure supplement 3
Activity measurements in HEK-TM cells.
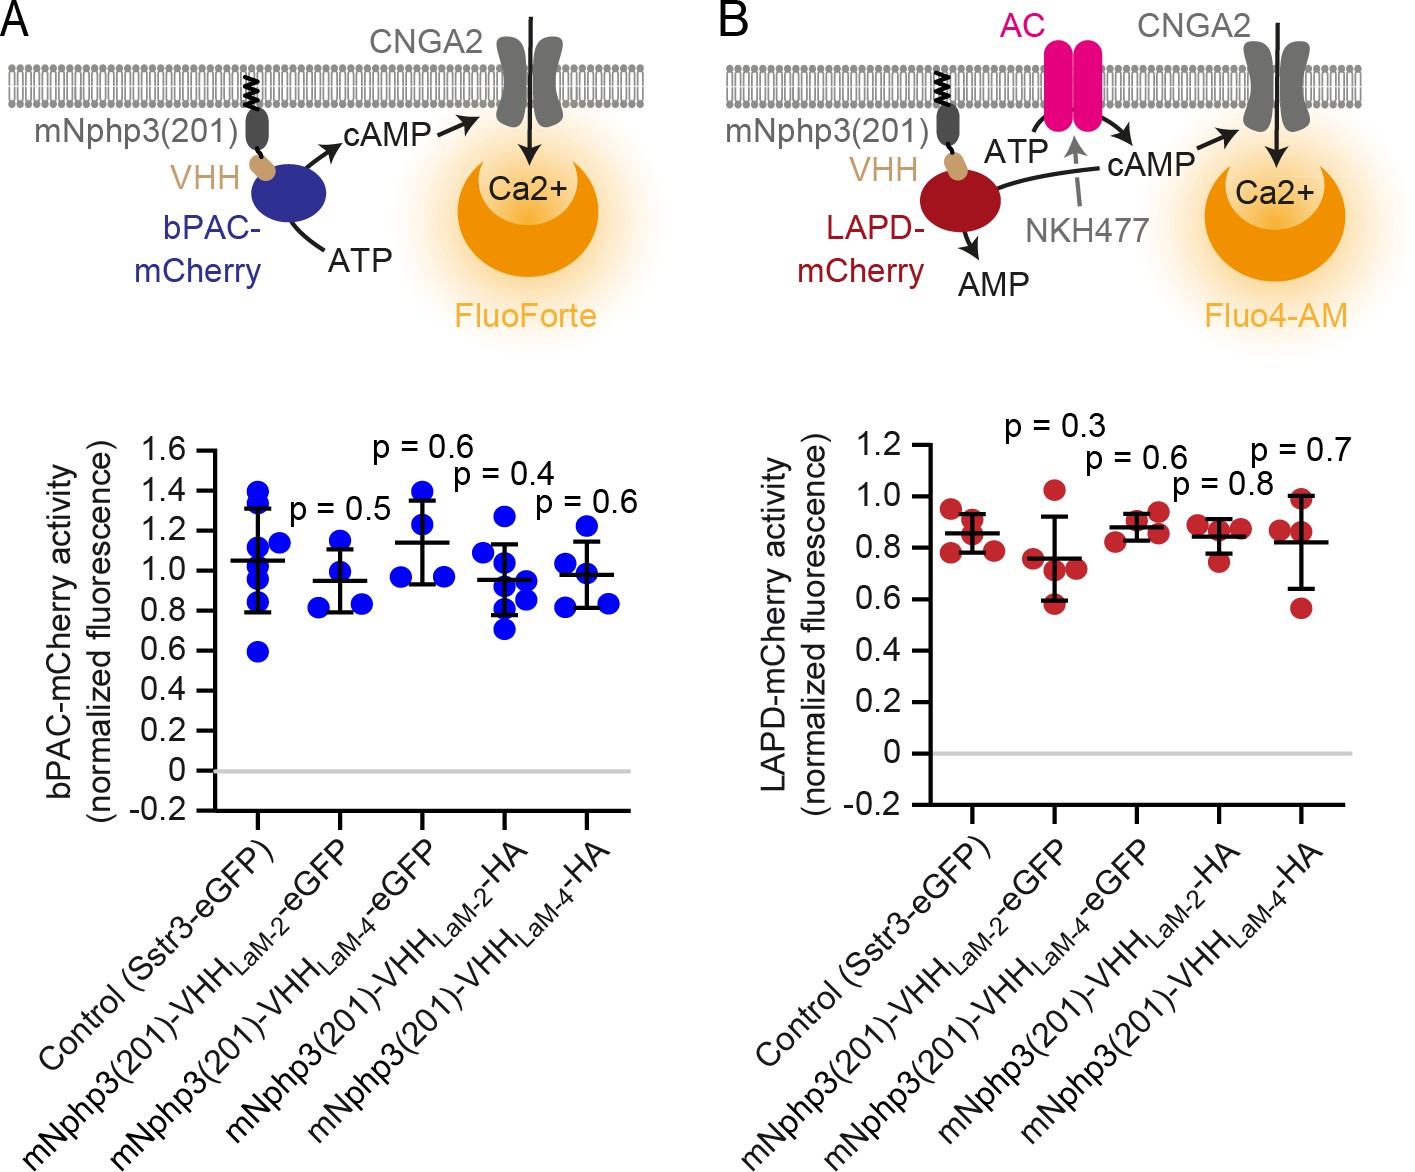
(A) bPAC activity measurements in HEK-TM cells. HEK293 cells express the CNGA2-TM ion channel, which opens upon cAMP binding and conducts Ca2+ (HEK-TM). bPAC-mCherry was co-expressed with the mNphp3(201)-tagged mCherry nanobody. Light-dependent activation of bPAC increases intracellular cAMP levels, leading to a Ca2+ influx, which was quantified using a fluorescent Ca2+ dye (GFP-certified FluoForte). bPAC activity was determined in the presence of mNphp3(201)-VHHLaM-2 or mNphp3(201)-VHHLaM-4 (fused to HA or eGFP). Co-expression with the ciliary protein Sstr3-eGFP was used as a negative control (ciliary localized protein, but not binding to bPAC or LAPD). bPAC activity was determined according to the maximum amplitude of the Ca2+ signal after light stimulation (465 nm light pulse, 1 s, 162 µW/cm²) compared to the ionomycin-evoked Ca2+ signal. 5 min before light stimulation, cells were treated with 25 µM of IBMX to inhibit phosphodiesterases and sustain a long-lasting increase in cAMP. NT: non-transfected cells. (B) LAPD activity measurements in HEK-TM cells. To measure LAPD activity, HEK-TM cells were pre-stimulated with 100 μM NKH477 to activate transmembrane adenylate cyclases (AC), thus increasing cAMP levels. Ca2+ influx was detected by a Ca2+ dye (Fluo4-AM). LAPD activity was determined in the presence of mNphp3(201)-VHHLaM-2 or mNphp3(201)-VHHLaM-4 (fused to HA or eGFP). Co-expression of the ciliary protein Sstr3-eGFP was used as a negative control (ciliary localized protein, but not binding to bPAC or LAPD). Fluo4-AM-loaded HEK-TM cells were incubated with 100 μM NKH477 during continuous 850 nm light illumination (0.5 µW/cm²). When reaching a steady-state, light was switched to 690 nm (0.5 µW/cm²) to stimulate LAPD activity. LAPD activity was determined as the maximal decrease compared to the maximal Ca2+ signal amplitude after NKH477 addition. Data are shown as individual data points (each data point represents and independent experiment and corresponds to the average of a duplicate or triplicate measurement) and mean ± S.D., p-values calculated using unpaired, two-sided Student's t-test compared to Sstr3-eGFP are indicated. All HEK-293 cells were non-ciliated.
Figure 3
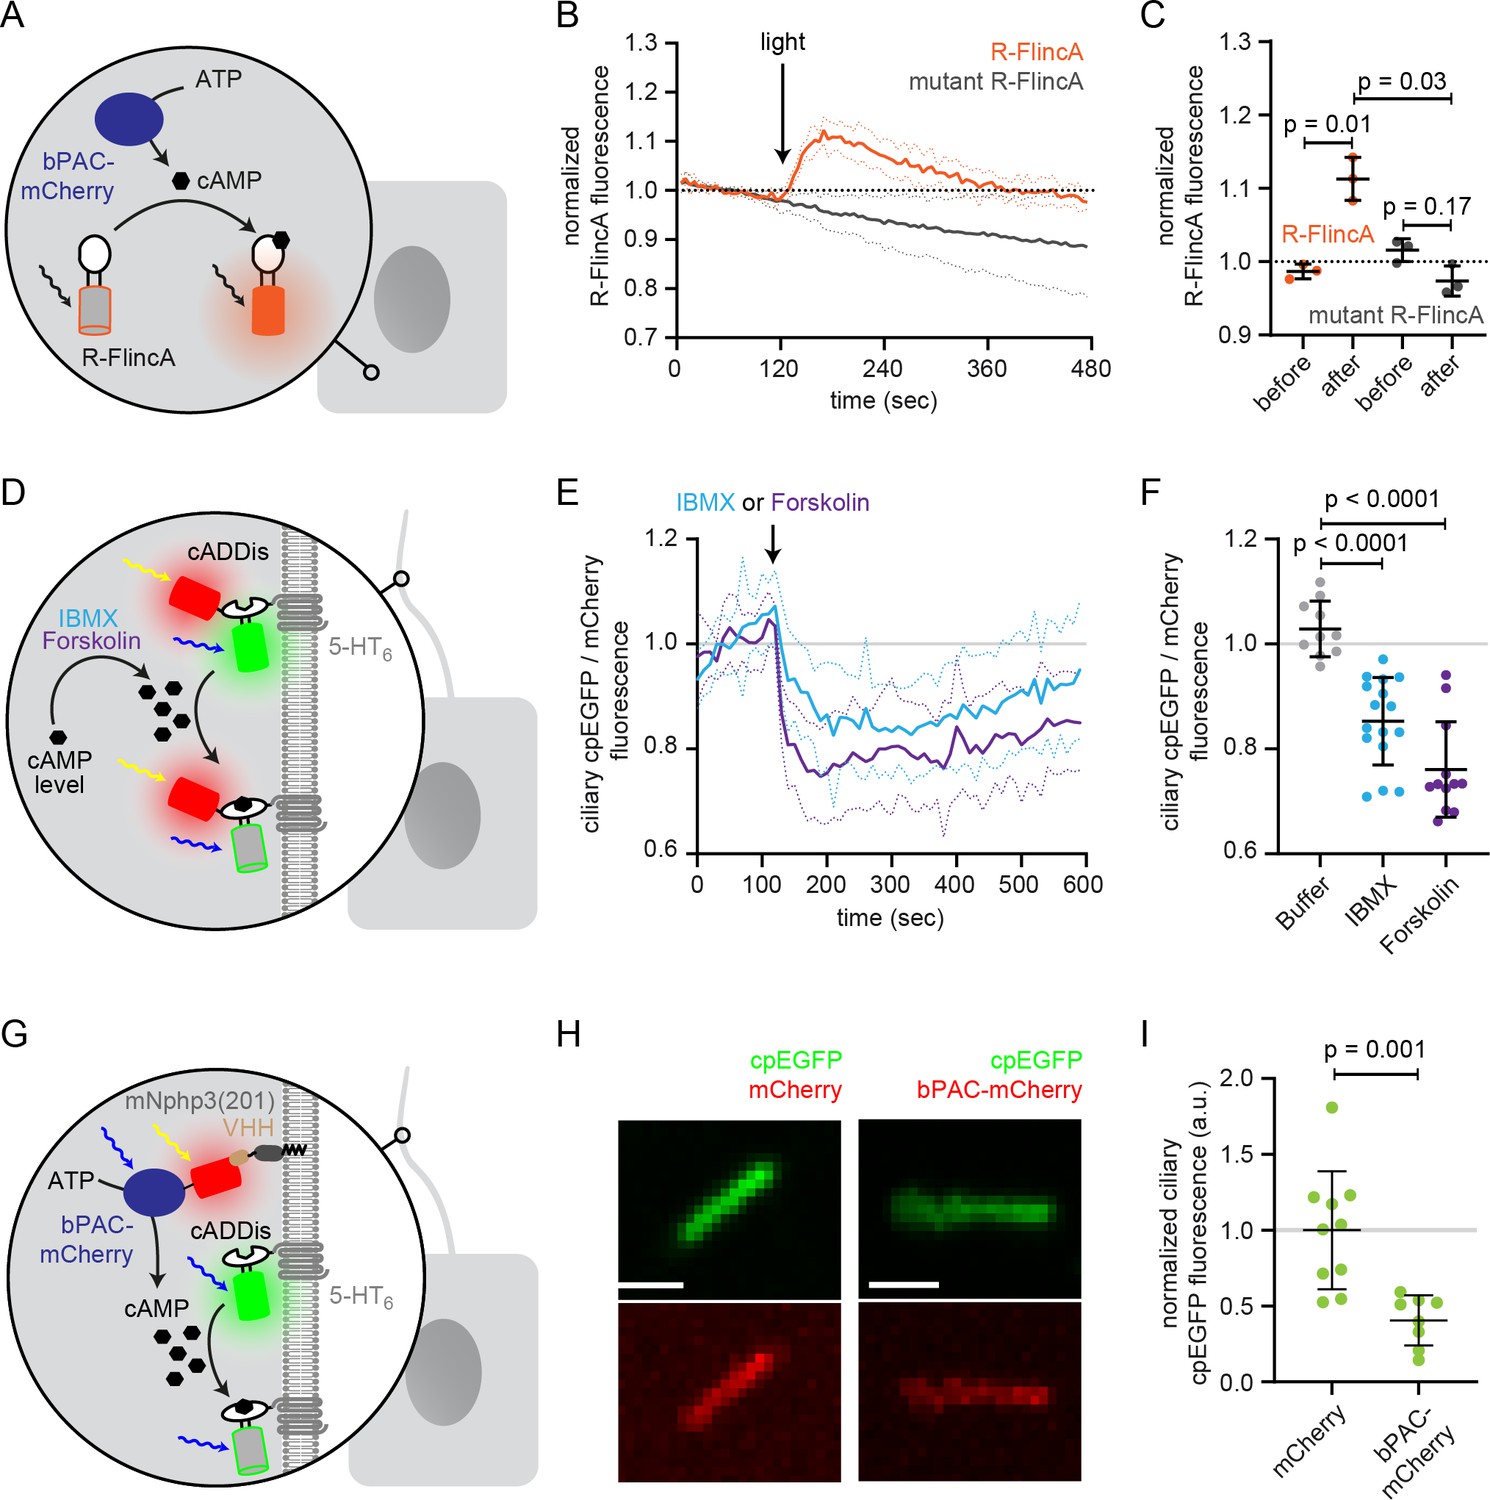
Functional characterization of bPAC in the cell body and cilium.
(A) Schematic overview of the bPAC activity assay in non-ciliated HEK293 cells using R-FlincA (see B-C). (B) HEK293 cells were transfected with bPAC-eGFP and R-FlincA or the non-binding R-FlincA mutant (Ohta et al., 2018). The change in R-FlincA fluorescence was measured over time before and after photoactivation of bPAC (5 s, white light, 2.1 mW/cm2 at 480 nm). Data are shown as mean (solid lines)± S.D. (dotted lines), n = 3 with 4 cells per experiment. (C) Normalized R-FlincA or R-FlincA mutant fluorescence directly before and for the maximal amplitude after photoactivation. Data extracted from C; p-values have been calculated using a paired, two-sided Student’s t-test. (D) Schematic overview of the assay to measure ciliary cAMP dynamics using 5-HT6-mCherry-cADDis after pharmacologically increasing cAMP levels (see E-F). (E) Ciliary cAMP dynamics measured using 5-HT6-mCherry-cADDis. Cells were stimulated with 250 μM IBMX (light blue) or 40 μM Forskolin (purple). The normalized ratio of ciliary mCherry/cpEGFP fluorescence is shown as mean (solid lines)± S.D. (dotted lines); p-values have been calculated by paired, two-sided Student’s t-test. (F) Mean change in the normalized ratio of ciliary mCherry/cpEGFP fluorescence 60–120 s after stimulation with buffer, IBMX, or Forskolin. Data are shown as individual data points, the mean ± S.D. is indicated; p-values have been calculated by a two-sided Mann-Whitney test. (G) Schematic overview of the assay to measure light-evoked ciliary cAMP dynamics after bPAC stimulation using 5-HT6-cADDis (see H-I). (H) 5-HT6-cADDis fluorescence in cilia with mNphp3(201)-VHHLaM-2-HA targeted mCherry or bPAC-mCherry in the first frame of imaging. Scale bar: 2 μm. (I) Mean normalized ciliary cpEGFP fluorescence in the first frame. All data have been normalized to the mean cpEGFP fluorescence in the mCherry control. Data are shown as individual data points, the mean ± S.D. is indicated; p-values have been calculated by unpaired, two-sided Student’s t-test.
Figure 4 with 1 supplement
Functional characterization of nanobody-targeted cAMP biosensor.
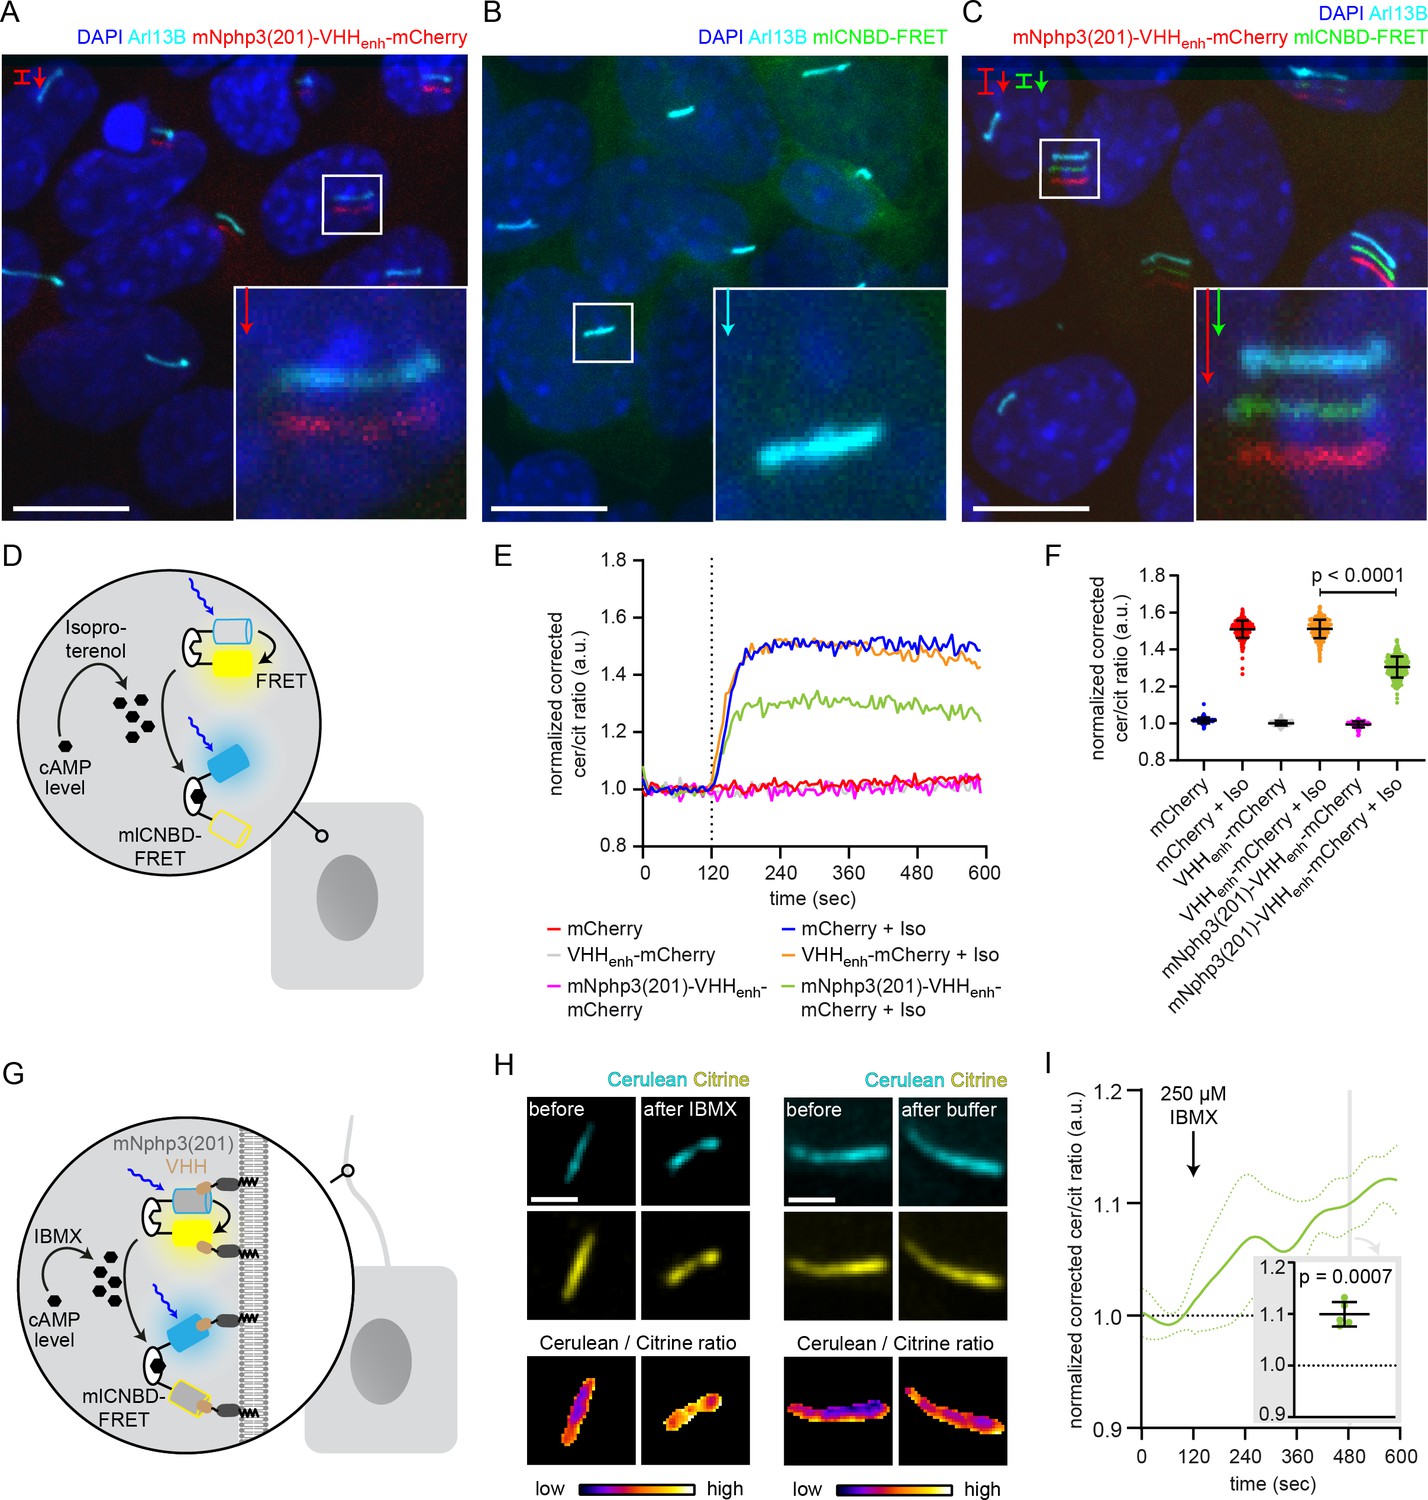
(A) Localization of the mNphp3(201)-VHHenhancer-mCherry anti-eGFP nanobody to primary cilia. (B./C) Localization of mlCNBD-FRET in mIMCD-3 cells in the (B) absence or (C) presence of mNPHP3(201)-VHHenhancer-mCherry. (D) Schematic overview of mlCNBD-FRET imaging in non-ciliated HEK293 cells (see E-F). (E) FRET imaging in HEK293 mlCNBD-FRET cells transiently co-expressing mCherry, VHHenhancer-mCherry, or mNphp3(201)-VHHenhancer-mCherry under control conditions or after stimulation with 20 μM isoproterenol (Iso, addition depicted with dotted line). Data are shown as mean (n = 3 independent experiments, 30–90 cells per experiment). (F) Comparison of maximal change for data shown in E. Data are presented as individual data points and mean ± S.D.; p-value calculated using an unpaired, two-tailed Mann-Whitney test is indicated. (G) Schematic overview of mlCNBD-FRET imaging in the primary cilium of mIMCD-3 cells (see H-I). (H) FRET imaging in primary cilia of mIMCD-3 cells expressing mlCNBD-FRET and mNphp3(201)-VHHenhancer-mCherry. Cells have been stimulated with 250 μm IBMX (left) or buffer only (right). Cerulean and citrine are shown before and after stimulation with IMBX. The change in cerulean/citrine ratio is shown below (color-scheme indicated at the bottom). Scale bar: 2 μm. (I) Time course of mean change in FRET (dark green line)± S.D. (dotted green line) for data set, exemplary shown in H; n = 5. Inset: each data point shows the time-average per cilium at the position indicated by grey box; one-sample Student’s t-test compared to 1.0 indicated.
Figure 4—figure supplement 1
Characterization of the ciliary-targeted cAMP mlCNBD-FRET biosensor.
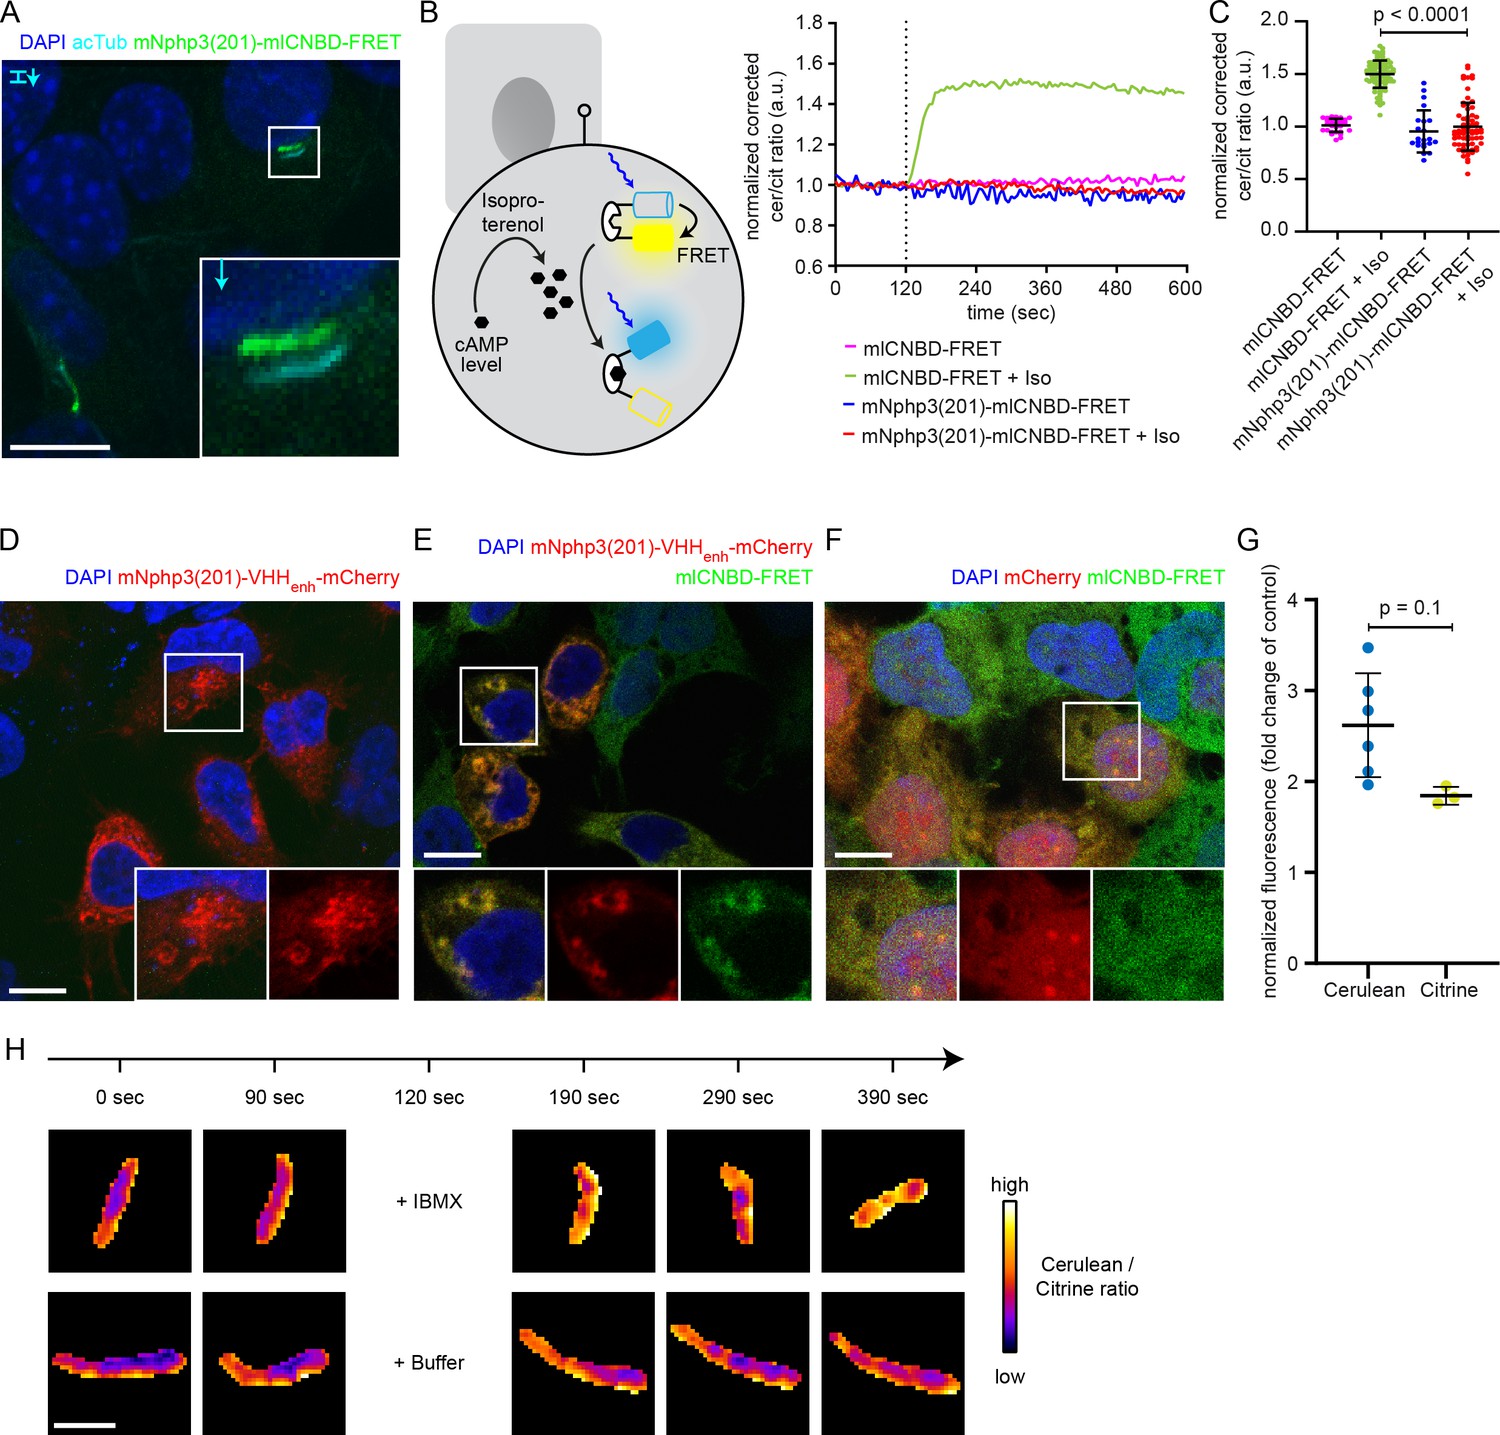
(A) Localization of mNphp3(201)-mlCNBD-FRET to primary cilia in mIMCD-3 cells. (B) FRET imaging in non-ciliated HEK293 cells expressing mlCNBD-FRET or mNphp3(201)-mlCNBD-FRET under control conditions or after stimulation with 20 μM isoproterenol (addition depicted with dotted line). Data are shown as mean (n = 3 independent experiments, 30–90 cells per experiment). Schematic overview of mlCNBD-FRET imaging is shown on the left. (C) Comparison of the maximal FRET change for data shown in B. Data are presented as individual data points and mean ± S.D.; p-value calculated using a two-tailed Mann-Whitney test is indicated. (D) Localization of mNphp3(201)-VHHenhancer-mCherry in HEK293 cells. The box indicates the position of the magnified view shown at the bottom for the individual channels. (E./F) Localization of mlCNBD-FRET in HEK293 cells in the presence (E) or absence (F) of mNphp3(201)-VHHenhancer-mCherry. In F, mCherry only was used as a control. Scale bar: 10 μm. The box in indicates the position of the magnified view shown at the bottom. left: overlay; middle and right: individual channels. (G) HEK293 cells were transfected with cerulean or citrine in the presence of mCherry (control) or the eGFP nanobody mNphp3(201)-VHHenhancer-mCherry. Fluorescence intensities of cerulean or citrine were normalized to the mCherry fluorescence of the nanobody or mCherry only in the same cell, and the relative change in fluorescence compared to the control condition (mCherry only) was plotted. Data are shown as mean ± S.D., n = 3–6 with 2–30 cells per experiment; p-values were determined using an unpaired, two-sided Student’s t-test. (H) FRET imaging in primary cilia of mIMCD-3 cells expressing mlCNBD-FRET and mNphp3(201)-VHHenhancer-mCherry. Cells have been stimulated with 250 μm IBMX (top) or buffer only (bottom). Images show the change in cerulean/citrine ratio (color-scheme indicated on the right) from different time points (top) of Video 1. Scale bar: 2 μm.
Figure 5 with 1 supplement
Nanobody-based ciliary protein targeting in vivo.
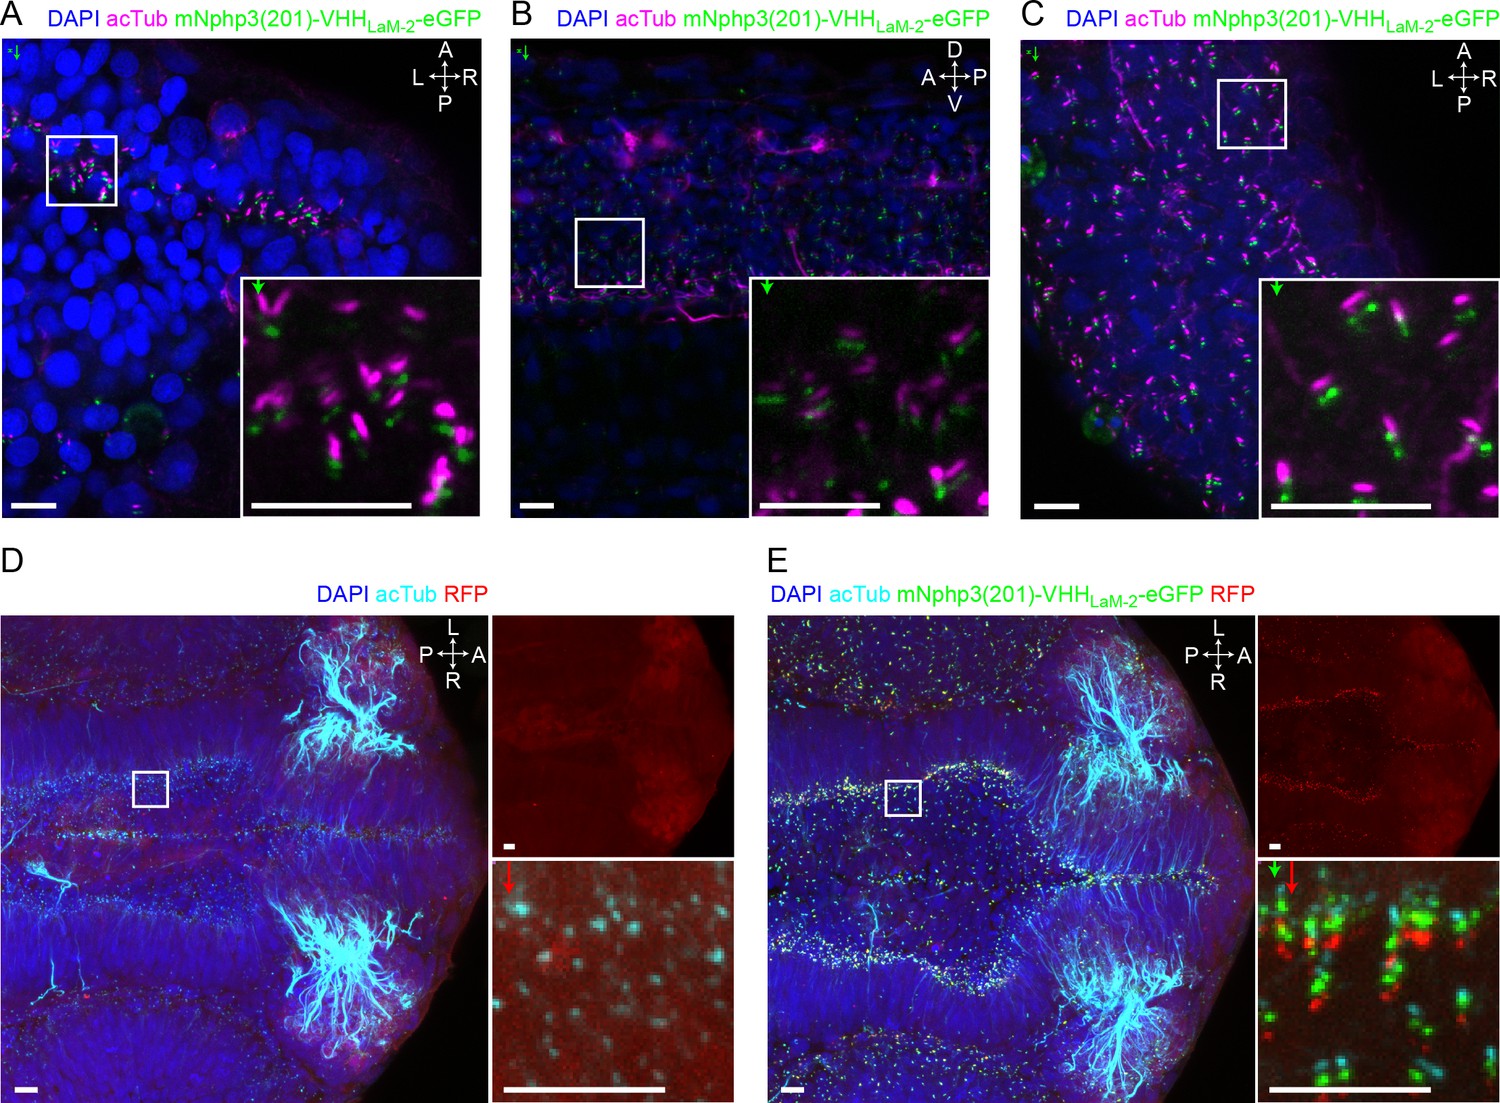
(A) Nanobody localization in the neural tube of a zebrafish embryo. The mRNA of the anti-mCherry mNphp3(201)-VHHLaM-2-eGFP nanobody was injected into nacre zebrafish embryos. Embryos were stained with an anti-acetylated tubulin antibody (magenta, ciliary marker), an anti-GFP antibody (green), and DAPI (blue). (B) See A. for spinal cord. (C) See A. for eye. (D) RFP (red) expression in the neural tube of Ubi:zebrabow (Pan et al., 2013) transgenic embryos. (E) RFP (red) expression in the neural tube of Ubi:zebrabow (Pan et al., 2013) transgenic embryos, injected with mRNA of the anti-mCherry mNphp3(201)-VHHLaM-2-eGFP nanobody. Scale bars: 20 μm, magnified view: 10 μm. Boxes indicate the position of the magnified views shown at the bottom right as inset (A-C) or as a separate panel next to the overview image (D, E). Arrows in different colors indicate the direction and the length of the shift of the respective fluorescence channel. The upper right panel in D and E shows the RFP channel only, the bottom right panel shows the magnified view. A: anterior, P: posterior, L: left, R: right, D: dorsal, V: ventral. All images were taken from fixed samples.
Figure 5—figure supplement 1

Nanobody-based ciliary protein targeting in vivo.
(A) Nanobody localization in the neural tube of a zebrafish embryo. The mRNA of the anti-mCherry mNphp3(201)-VHHLaM-2-eGFP (green) nanobody was injected into nacre zebrafish embryos. (B) Ciliary labeling (green) in the neural tube of b-actin:arl13b-gfp transgenic embryos (38). (C) RFP (red) expression in the neural tube of Ubi:zebrabow (40) transgenic embryos. (D) RFP (red) expression in the neural tube of Ubi:zebrabow (40) transgenic embryos, injected with mRNA of the anti-mCherry mNphp3(201)-VHHLaM-2-eGFP nanobody. Scale bar: 20 μm, magnified view: 10 μm. Boxes indicate the position of the magnified views (bottom right panels). Arrow indicates the direction and the length of the shift of the respective fluorescence channel. The upper right panels show the individual RFP fluorescence, the bottom magnified view the overlay. A: anterior, P: posterior, L: left, R: right, D: dorsal, V: ventral. All images have been acquired from live embryos.
Figure 6 with 1 supplement
Controlling cilia length using optogenetics.
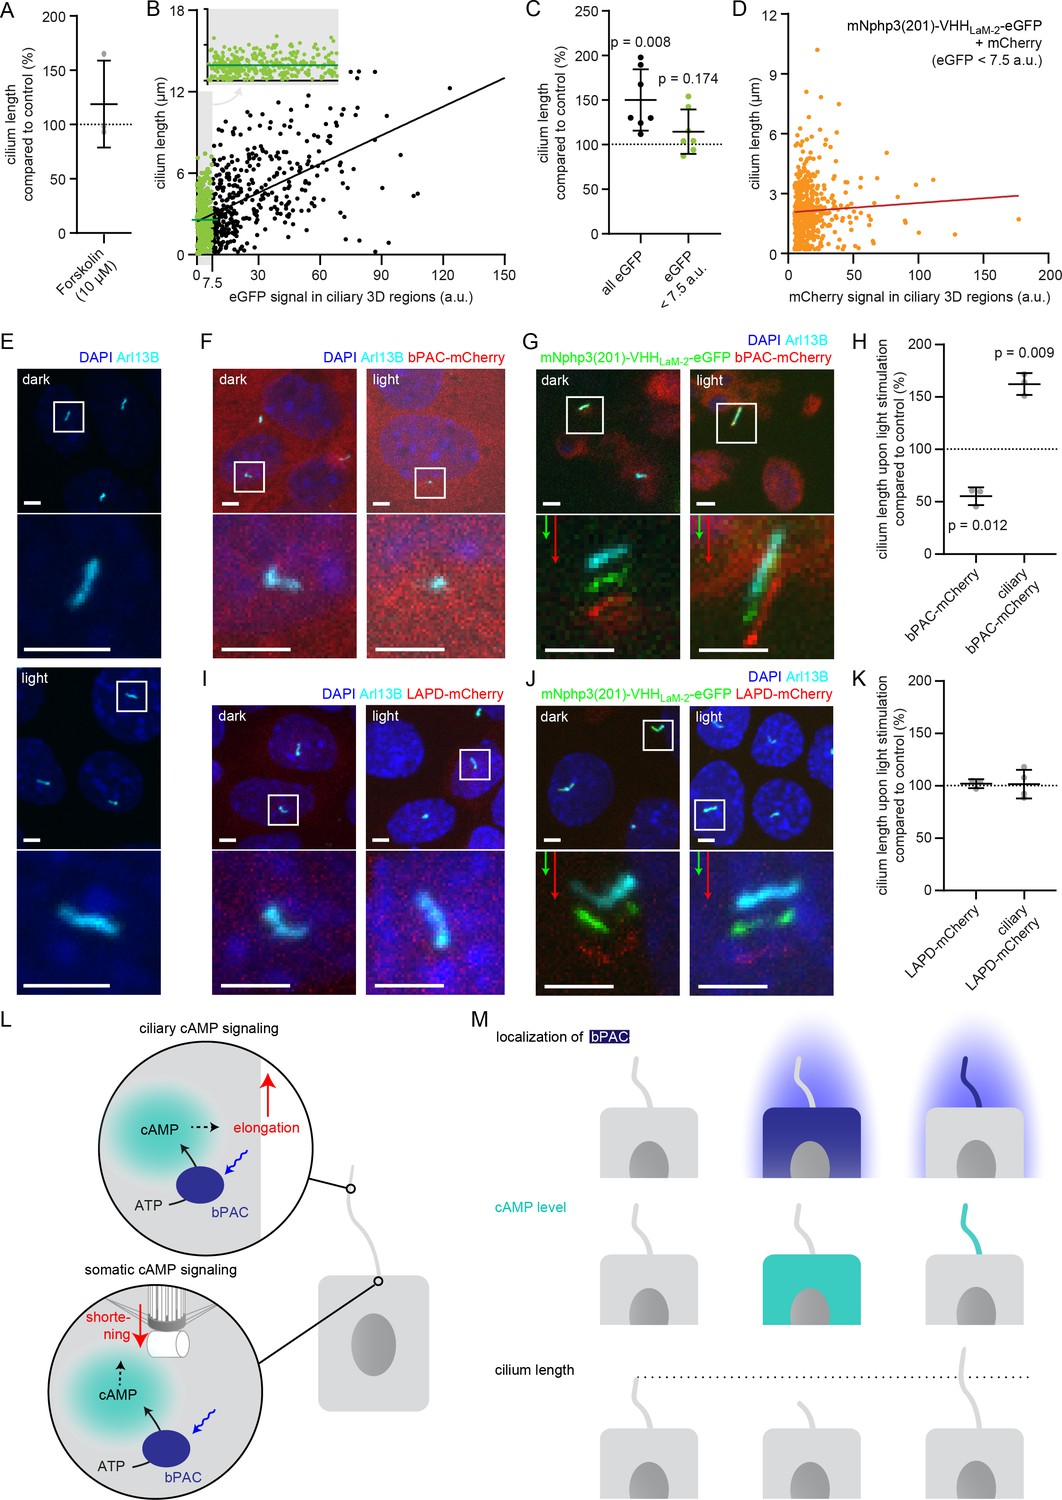
(A) Cilia length of mIMCD-3 cells stimulated for 1 hr with 10 μM Forskolin (solvent: DMSO), normalized to the DMSO control. Data are shown as mean ± S.D., n = 3 with at least 40 cells per experiment. (B) Correlation of cilia length and eGFP fluorescence (a.u., average ciliary fluorescence of non-transfected control cells was subtracted) in the cilium in mIMCD-3 cells transiently expressing mNphp3(201)-VHHLaM-2-eGFP. Below 7.5 a.u., the cilia length is independent of the eGFP fluorescence (see inset, values are highlighted in green, slope not different from zero, correlation: p=0.07), whereas including values > 7.5 a.u., there is a linear correlation between the cilia length and the eGFP fluorescence in the cilium (slope different from zero, correlation: p<0.0001). (C) Length of cilia that show mNphp3(201)-VHHLaM-2-eGFP localization and an eGFP fluorescence < 7.5 a.u., normalized to equally treated, non-transfected (NT) control cells. Data are shown as mean ± S.D., n = 7 with at least 18 cilia per experiment; p-values determined using unpaired, two-tailed Student’s t-test are indicated. (D) Correlation of cilia length and mCherry fluorescence in the cilium in mIMCD-3 cells transiently expressing mNphp3(201)-VHHLaM-2-eGFP and mCherry. Only cilia with an eGFP fluorescence below 7.5 a.u. were taken into account. There is no linear correlation between the mCherry fluorescence and cilia length (slope not different from zero, correlation: p=0.2). (E) mIMCD-3 cells (non-transfected, NT) kept in the dark (top) or stimulated with light (bottom, 1 hr, 465 nm, 38.8 µW/cm²) (F) mIMCD-3 bPAC-mCherry cells kept in the dark (left) or stimulated with light (right, 16 hr, 465 nm, 38.8 µW/cm²). (G) mIMCD-3 bPAC-mCherry transiently transfected with mNphp3(201)-VHHLaM-2-eGFP kept in the dark (left) or stimulated with light (right, 1 hr, 465 nm, 38.8 µW/cm²). (H) Normalized cilia length after light stimulation (left 1 hr, right 16 hr; 465 nm, 38.8 µW/cm²) for mIMCD-3 bPAC-mCherry cells with or without transiently expressing mNphp3(201)-VHHLaM-2-eGFP. Only cilia with an eGFP fluorescence < 7.5 a.u. were included and each data point was normalized to control cells. Data are shown as mean ± S.D., n = 3 with at least 25 cells per experiment; p-values determined using one-sample Student’s t-test compared to 100% are indicated. (I) mIMCD-3 LAPD-mCherry cells kept in the dark (left) or stimulated with light (right, 16 hr, 630 nm, 42.3 µW/cm²). (J) mIMCD-3 LAPD-mCherry transiently transfected with mNphp3(201)-VHHLaM-2-eGFP kept in the dark (left) or stimulated with light (right, 16 hr, 630 nm, 42.3 µW/cm²). (K) Normalized cilia length after light stimulation (16 hr, 630 nm, 42.3 µW/cm²) for mIMCD-3 LAPD-mCherry with or without transiently expressing mNphp3(201)-VHHLaM-2-eGFP. Only cilia with an eGFP fluorescence < 7.5 a.u. were included and each data point was normalized to control cells. Data are shown as mean ± S.D., n = 3–4 with at least 18 cells per experiment; p-values determined using one-sample Student’s t-test compared to 100% are indicated. Cells in E-G and I-J were stained with an Arl13B antibody (cyan) and DAPI (blue). All boxes indicate the magnified view below. Arrows indicate the direction and the length of the shift of the respective same-colored fluorescence channel. Scale bar for all images: 3 μm. (L) Spatial cAMP signaling controlling cilia length. Our data suggest a model, in which cAMP signaling in the cell body, stimulated by photoactivation of bPAC and an increase in cAMP levels, causes primary cilia shortening, whereas an increase of cAMP levels in the cilium results in primary cilia elongation. (M) Summary of the correlation between bPAC localization and photoactivation, cAMP levels, and cilia length.
Figure 6—figure supplement 1
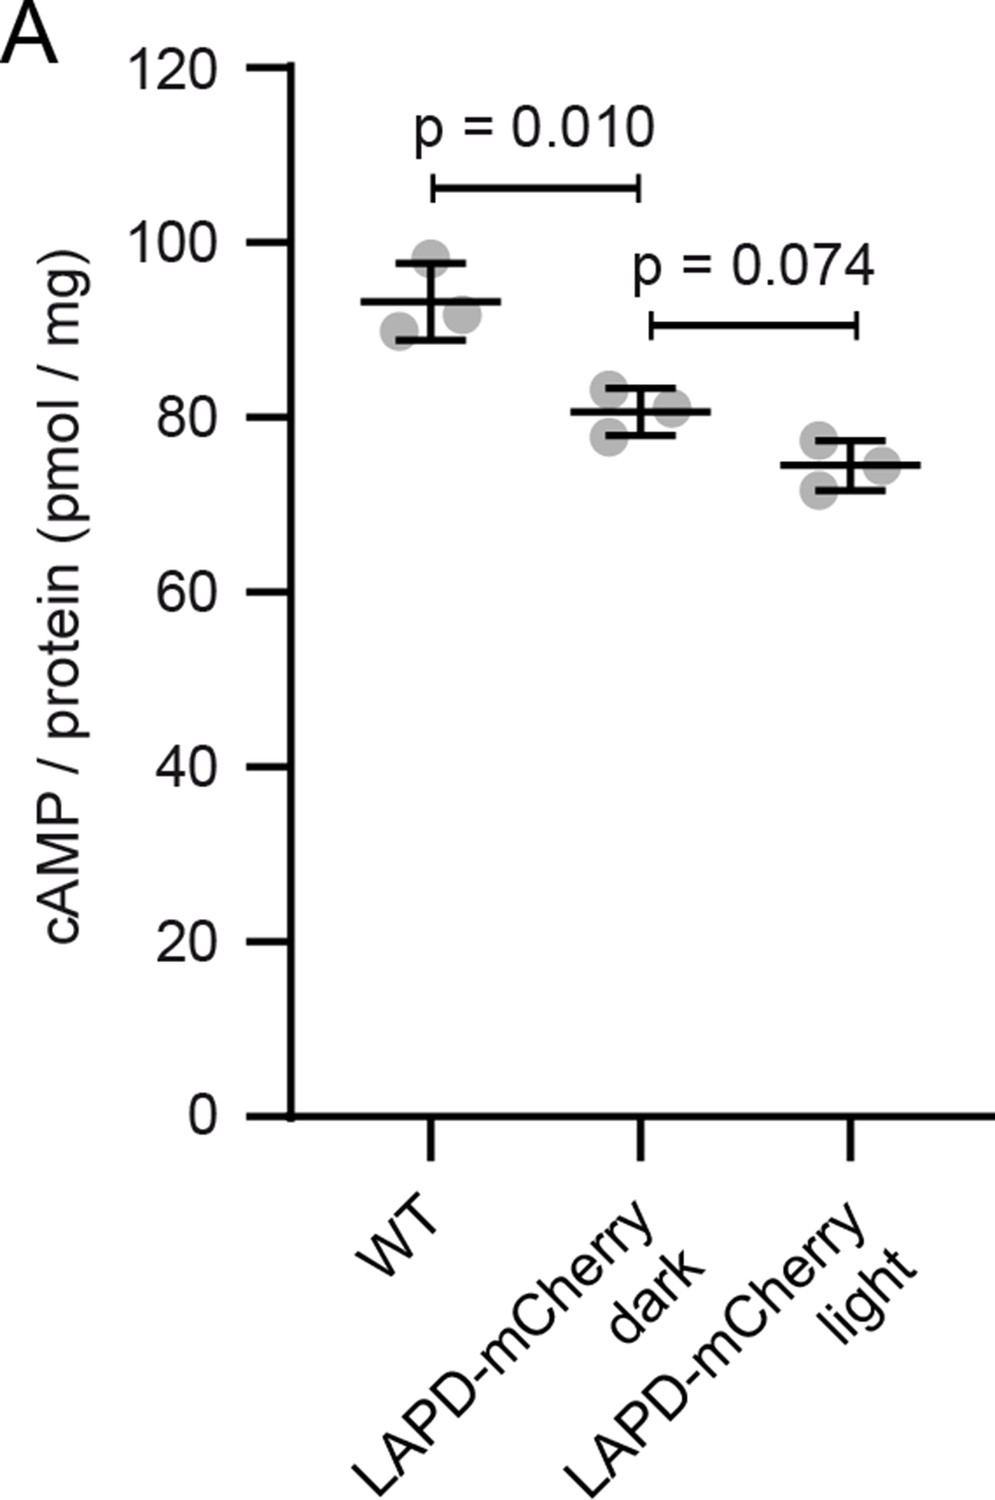
cAMP levels and ciliary length in mIMCD-3 cells expressing LAPD.
(A) Determination of total cAMP levels in WT mIMCD-3 cells or mIMCD-3 LAPD-mCherry cells in the dark or after light stimulation (2 min, 630 nm, 42.3 µW/cm2). cAMP levels have been determined using an ELISA and normalized to the protein concentration. Data are shown as mean ± S.D., n = 3, p-values were calculated using a paired two-sided Student’s t-test.
Videos
Video 1
FRET imaging in primary cilia.
mIMCD-3 cells expressing mlCNBD-FRET and mNphp3(201)-VHHenhancer-mCherry have been stimulated with 250 μm IBMX or buffer only.
Tables
Key resources table
| Reagent type (species) or resource | Designation | Source or reference | Identifiers | Additional information |
|---|---|---|---|---|
| Gene (mouse) | Nphp3 | NCBI | NM_028721 | |
| Cell line (human) | HEK293 | ATCC | CRL-1573 | |
| Cell line (human) | HEK-TM | Wachten et al., 2006 | ||
| Cell line (mouse) | mIMCD-3 | ATCC | CRL-2123 | |
| Transfected construct (mouse) | See Sup. Table 1 | See Sup. Table 1 | See Sup. Table 1 | |
| Biological sample (Danio rerio) | nacre | Lister et al., 1999 | ||
| Biological sample (Danio rerio) | b-actin:arl13b-gfp | Borovina et al., 2010 | ||
| Biological sample (Danio rerio) | Ubi:zebrabow | Pan et al., 2013 | ||
| Antibody (mouse) | anti-acetylated-Tubulin (mouse, monoclonal) | Sigma Aldrich | T6793 | 1:600 |
| Antibody (rabbit) | anti-GFP (rabbit, polyclonal) | Abcam | ab6556 | 1:500 |
| Antibody (rabbit) | anti-Arl13B (rabbit, polyclonal) | Proteintech | 17711–1-AP | 1:500 |
| Antibody (mouse) | anti-Arl13B (mouse, monoclonal) | Abcam | ab136648 | 1:500 |
| Antibody (donkey) | anti-mouse-Cy5 (donkey) | Dianova | 715-175-151 | 1:500 |
| Antibody (goat) | anti-rabbit-Alexa488 (goat) | Life Technologies | A11034 | 1:500 |
| Recombinant DNA reagent | cADDis cAMP assay kit | Montana Molecular | #D0201/11G | |
| Sequence-based reagent (IDT) | VHHLaM-2, VHHLaM-4 | Gene blocks (IDT) Fridy et al., 2014 | ||
| Sequence-based reagent (Ploegh lab) | VHHEnhancer | Hidde Ploegh, Boston, USA Kirchhofer et al., 2010 | ||
| Commercial assay or kit (Thermo) | Lipofectamine 2000 | Thermo Fisher Scientific | #11668030 | |
| Commercial assay or kit (Molecular Devices) | CatchPoint assay | Molecular Devices | ||
| Commercial assay or kit (Thermo) | Pierce BCA Protein Assay Kit | Thermo Fisher Scientific | 23227 | |
| Commercial assay or kit (Qiagen) | QIAquick PCR purification kit | Qiagen | #28104 | |
| Commercial assay or kit (Thermo) | mMessage mMachine T7 kit | Thermo Fisher Scientific | #AM1344 | |
| Chemical compound, drug (Sigma) | PEI | Sigma Aldrich | #64604–1G | |
| Chemical compound, drug (Merck) | ChemiBLOCKER | Merck Millipore | #2170 | |
| Chemical compound, drug (Polysciences) | Aqua-Poly/Mount | Polysciences | #18606–20 | |
| Chemical compound, drug (Thermo) | DAPI | Thermo Fisher Scientific | D1306 | 1:10.000 |
| Chemical compound, drug (Enzo) | FluoForte | Enzo Life Sciences | ENZ-52015 | |
| Chemical compound, drug (Sigma) | Fluo4-AM | Sigma Aldrich | 93596 | |
| Chemical compound, drug (Thermo) | probenecid | Thermo Fisher Scientific | P36400 | |
| Chemical compound, drug (Sigma) | NKH477 | Sigma Aldrich | N3290 | |
| Chemical compound, drug (Sigma) | Forskolin | Sigma Aldrich | F3917 | |
| Chemical compound, drug (Sigma) | IBMX | Sigma Aldrich | I5879 | |
| Software, algorithm (this paper) | CiliaQ | This publication | https://github.com/hansenjn/CiliaQ; Hansen, 2020; copy archived at https://github.com/elifesciences-publications/CiliaQ |
Additional files
-
Supplementary file 1
Plasmids and cloning information.
Plasmids are listed and the ID and sequence of the primers that have been used for cloning are indicated.
- https://cdn.elifesciences.org/articles/57907/elife-57907-supp1-v2.docx
-
Transparent reporting form
- https://cdn.elifesciences.org/articles/57907/elife-57907-transrepform-v2.pdf
Download links
A two-part list of links to download the article, or parts of the article, in various formats.
Downloads (link to download the article as PDF)
Open citations (links to open the citations from this article in various online reference manager services)
Cite this article (links to download the citations from this article in formats compatible with various reference manager tools)
Nanobody-directed targeting of optogenetic tools to study signaling in the primary cilium
eLife 9:e57907.
https://doi.org/10.7554/eLife.57907


