Atypical meiosis can be adaptive in outcrossed Schizosaccharomyces pombe due to wtf meiotic drivers
- Stowers Institute for Medical Research, United States
- University of Missouri-Kansas City, United States
- Department of Molecular Biosciences, University of Kansas, United States
- Department of Molecular and Integrative Physiology, University of Kansas Medical Center, United States
Figures
Figure 1 with 3 supplements
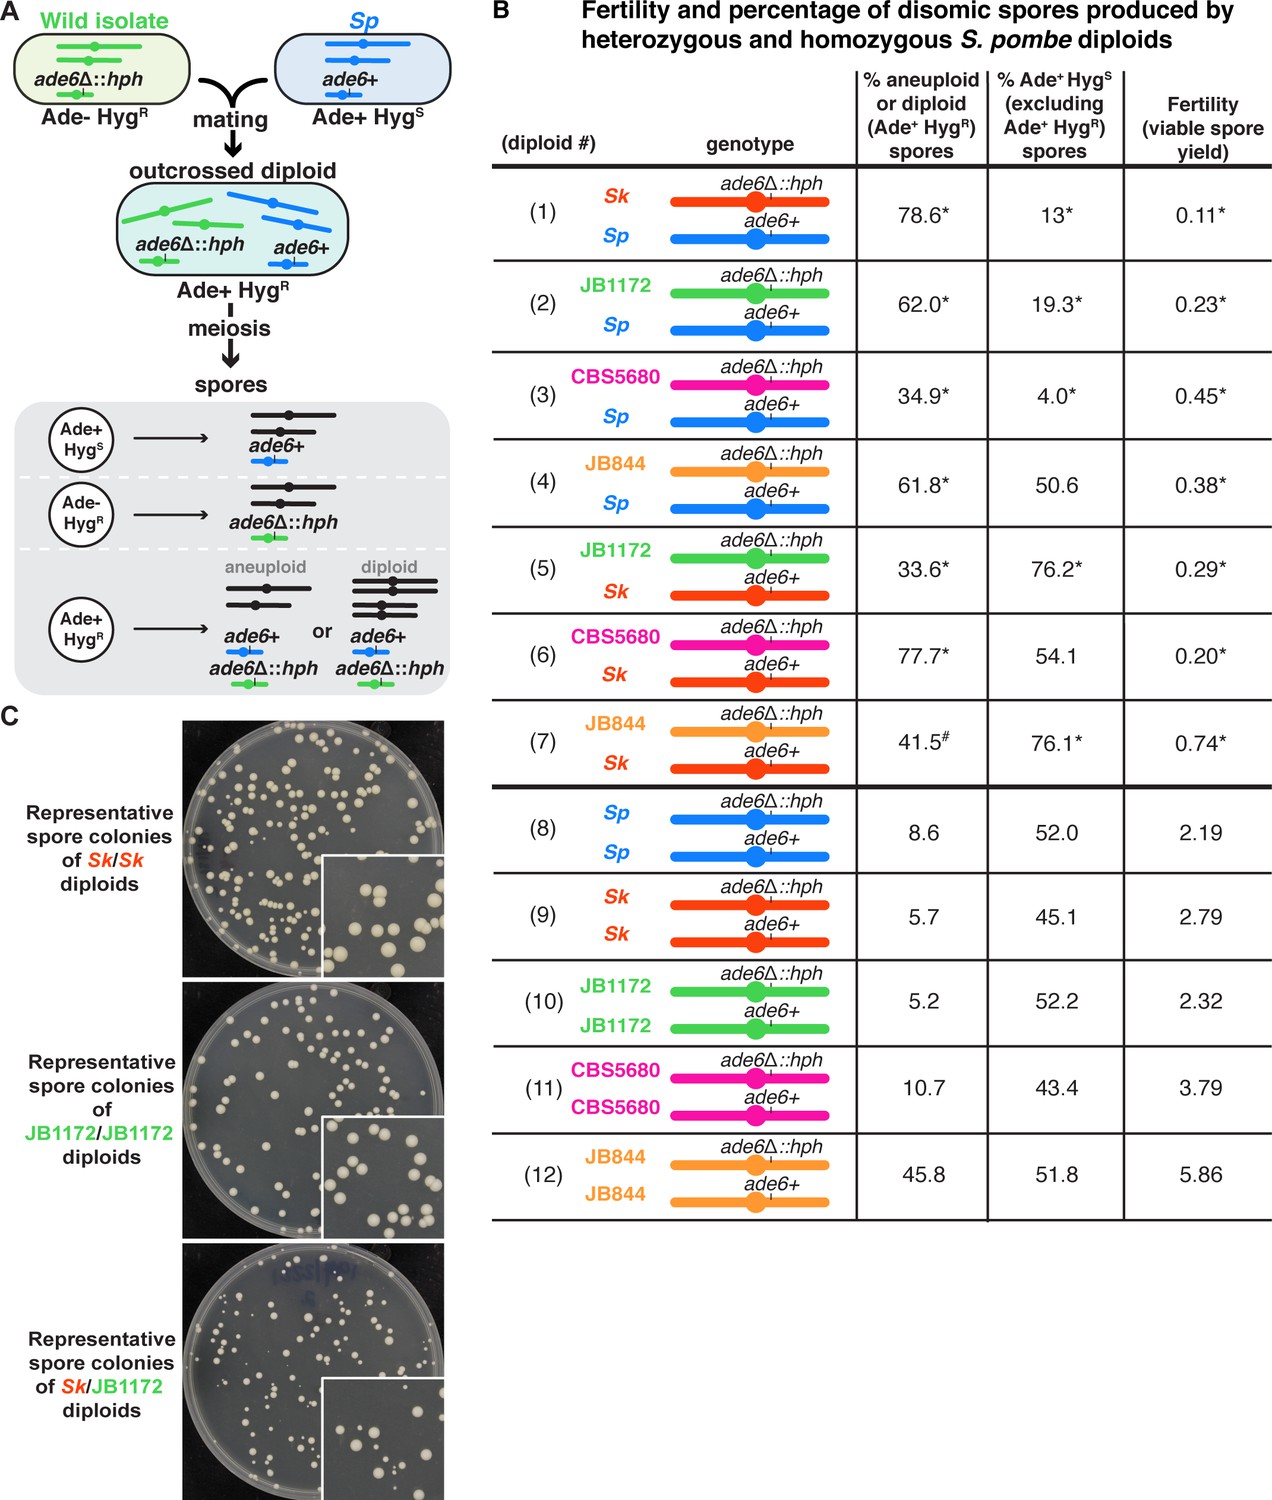
Outcrossed S. pombe diploids frequently produce disomic spores.
(A) Schematic of the experimental approach. The ade6 gene is linked to centromere 3. The karyotypes of JB1172, CBS5680, and JB844 are unknown, but outside of an inversion on Sp chromosome 1, Sp likely represents the ancestral karyotype (Avelar et al., 2013; Brown et al., 2011). (B) Phenotypes of heterozygous or homozygous S. pombe diploids. Allele transmission of chromosome 3 was assayed using co-dominant markers at ade6 (ade6+ and ade6Δ::hphMX6). The ade6+ allele confers an Ade+ phenotype, while the ade6Δ::hphMX6 provides resistance to Hygromycin B (HygR). Heterozygous aneuploid or diploid spores are Ade+ HygR. The fertility was measured using the viable spore yield assay to determine the number of viable spores per viable diploid. In the absence of drive, we expect 50% of the spores to be Ade+ HygS. A significant departure from 50% indicates drive favoring the overrepresented allele. The phenotypes of each heterozygote were compared to those of homozygous diploids from both parental strain backgrounds. * indicates p-value<0.025 (G-test [Ade+ HygR spores] and Wilcoxon test [fertility]) for the heterozygotes relative to the homozygous diploids from both parental backgrounds. Diploid 7 was only significantly different (p-value<0.025) in the frequency of Ade+ HygR spores when compared to diploid 9, but not when compared to diploid 12. This is indicated with #. To detect biased allele transmission (Ade+ HygS), diploids 2–4 were compared to diploid 8 and diploids 5–7 were compared to diploid 9. * indicates p-value<0.05 (G-test [allele transmission]). More than 200 viable spores were scored for each diploid. Raw data can be found in Figure 1—source data 1 and Figure 1—source data 2. (C) Representative images of the viable spore colonies generated by homozygous Sk and JB1172 diploids and heterozygous Sk/JB1172 diploids. Images of colonies generated by other diploids are shown in Figure 1—figure supplement 2.
-
Figure 1—source data 1
Raw data for the viable spore yield reported in Figure 1.
Each column represents the diploid assayed, which matches the diploid number in Figure 1. The second row shows the diploid number. The third row shows the SZY strain numbers of both haploid parent strains. We present all the viable spore yield values from independent assays. We calculated the p-value using the Wilcoxon test by comparing the heterozygous diploid to the homozygous parent 1 (p1) and parent 2 (p2) strains. Diploid one was compared to control diploids 8 (p1) and 9 (p2); diploid two was compared to control diploids 8 (p1) and 10 (p2); diploid three was compared to control diploids 8 (p1) and 11 (p2); diploid four was compared to control diploids 8 (p1) and 12 (p2); diploid five was compared to control diploids 9 (p1) and 10 (p2); diploid six was compared to control diploids 9 (p1) and 11 (p2); and diploid seven was compared to control diploids 9 (p1) and 12 (p2). The last two rows show the relative fertility (f) when compared to the homozygous parent 1 and parent 2.
- https://cdn.elifesciences.org/articles/57936/elife-57936-fig1-data1-v1.xlsx
-
Figure 1—source data 2
Raw data of allele transmission values reported in Figure 1.
Each of the rows represents the relevant genotype and allele transmission of the indicated diploid. The first column matches the diploid number from Figure 1. Columns 2–5 contain the SZY strain number and relevant genotypes used to determine the allele transmission for chromosome 3. Columns 6–8 indicate the number of spores that exhibited the indicated phenotype. The total number of spores assayed is shown in column 9. Column 10 indicates the percentage of disomic spores (Ade+ HygR). Column 11 indicates the p-values calculated when comparing the frequency of Ade+ HygR spores produced by heterozygous diploids to the frequency of Ade+ HygR spores produced by both homozygous diploid parent strains. Diploid one was compared to control diploids 8 and 9; diploid two was compared to control diploids 8 and 10; diploid three was compared to control diploids 8 and 11; diploid four was compared to control diploids 8 and 12; diploid five was compared to control diploids 9 and 10; diploid six was compared to control diploids 9 and 11; and diploid seven was compared to control diploids 9 and 12. Column 12 shows the percentage of the spores that were Ade+ HygS (excluding Ade+ HygR spores). Column 13 indicates the p-value calculated when comparing diploids 2–4 to diploid 8 and diploids 5–7 to diploid 9. The last column shows the total number of independent diploids assayed for each cross.
- https://cdn.elifesciences.org/articles/57936/elife-57936-fig1-data2-v1.xlsx
Figure 1—figure supplement 1
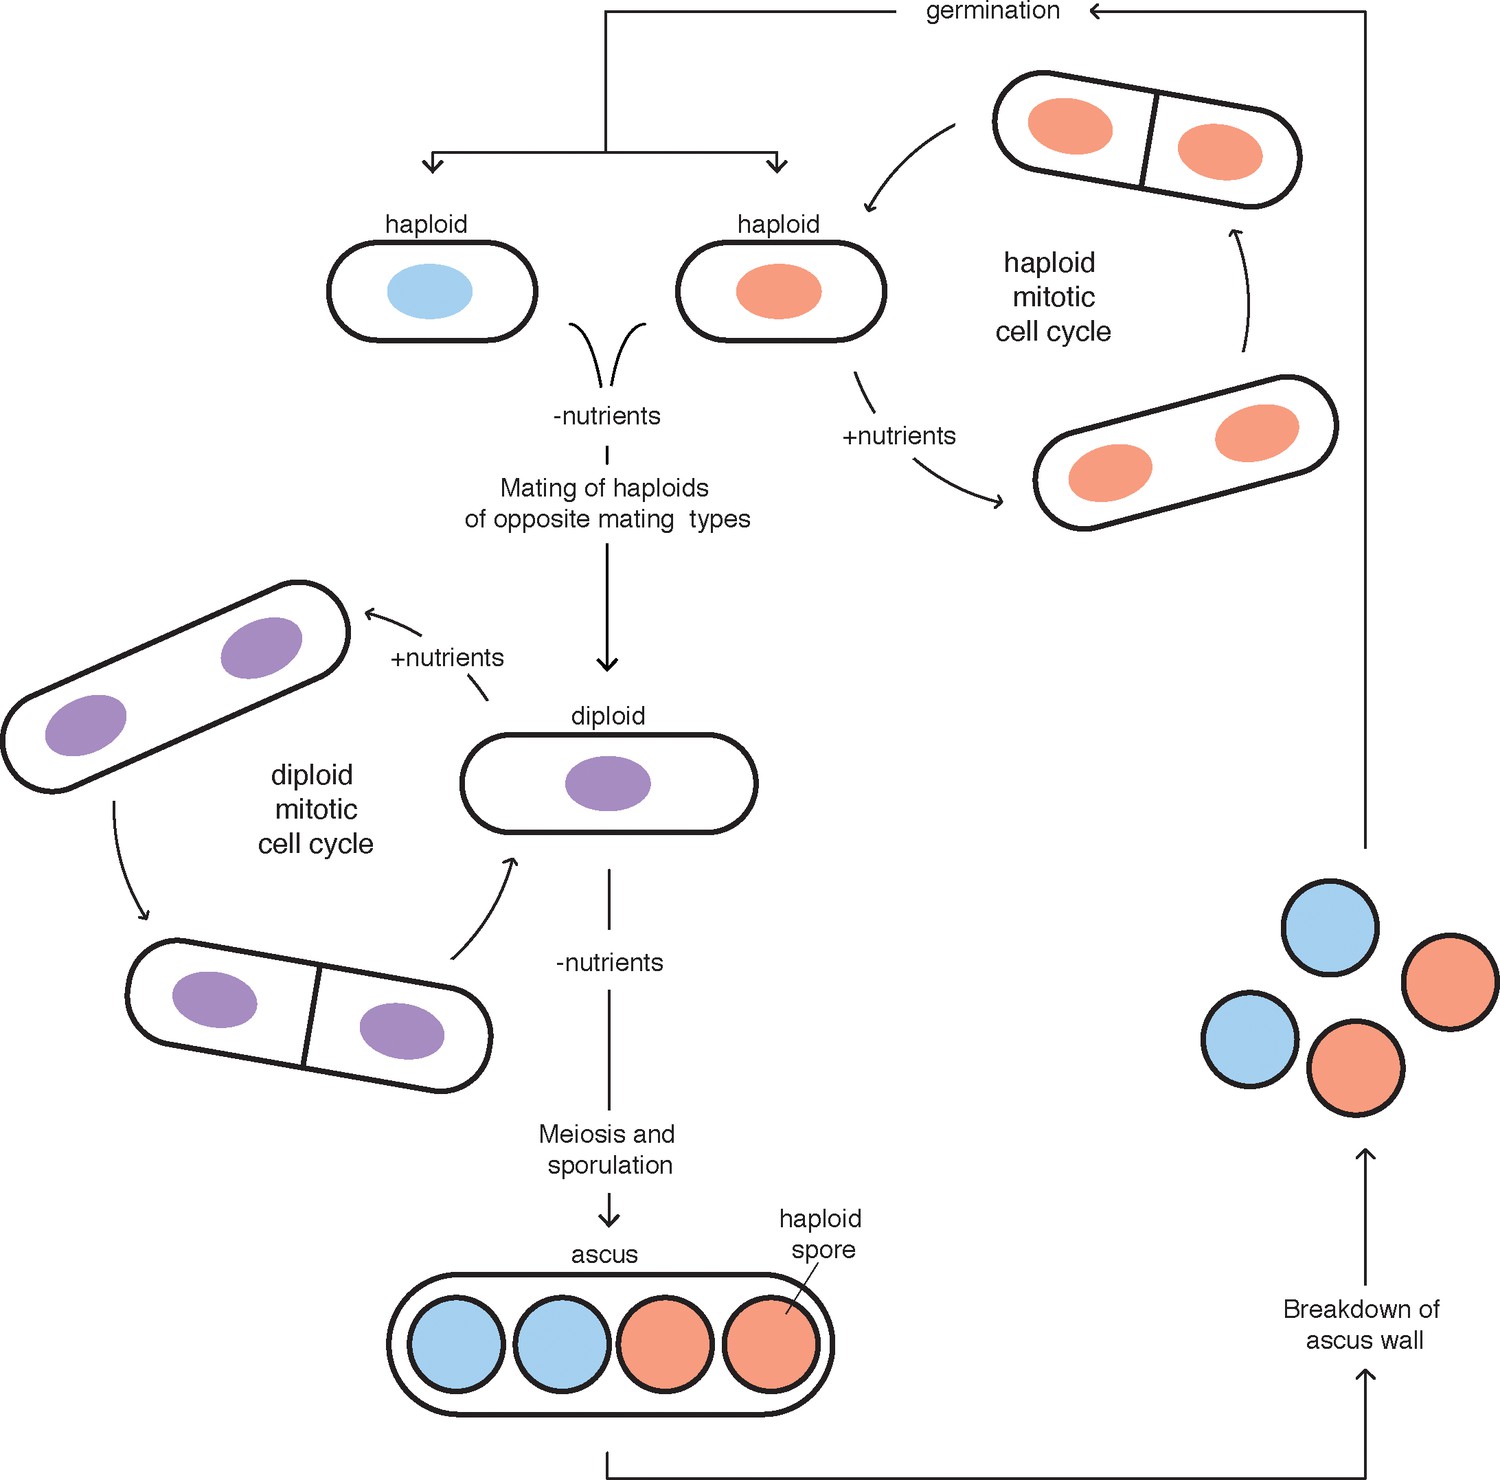
The Schizosaccharomyces pombe life cycle.
The red and blue colors represent nuclei of cells with different mating types (i.e. h+ and h-). Mating and meiosis are induced after nutrient depletion in S. pombe. This figure was adapted from Egel, 2004.
Figure 1—figure supplement 2
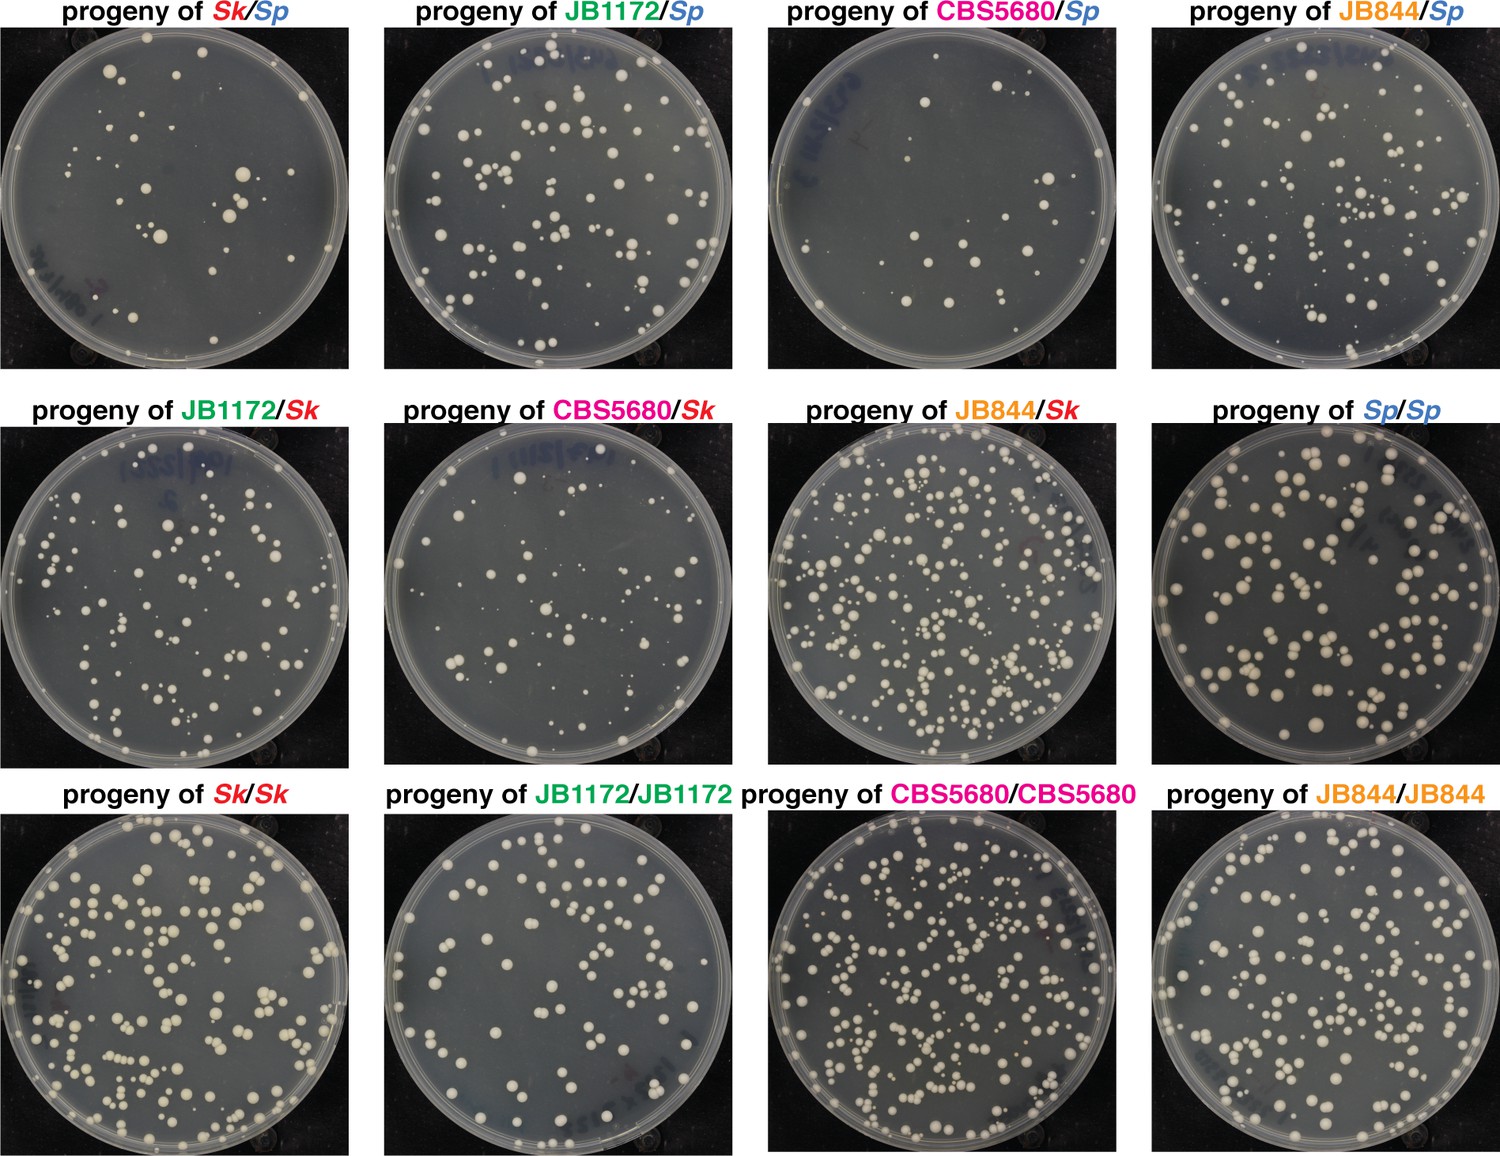
Colony phenotypes of spores produced by S. pombe heterozygous and homozygous diploids.
Representative images of the spore colonies generated by the indicated diploids. Sk/Sk, JB1172/JB1172, and Sk/JB1172 images are the same as those presented in Figure 1C.
Figure 1—figure supplement 3
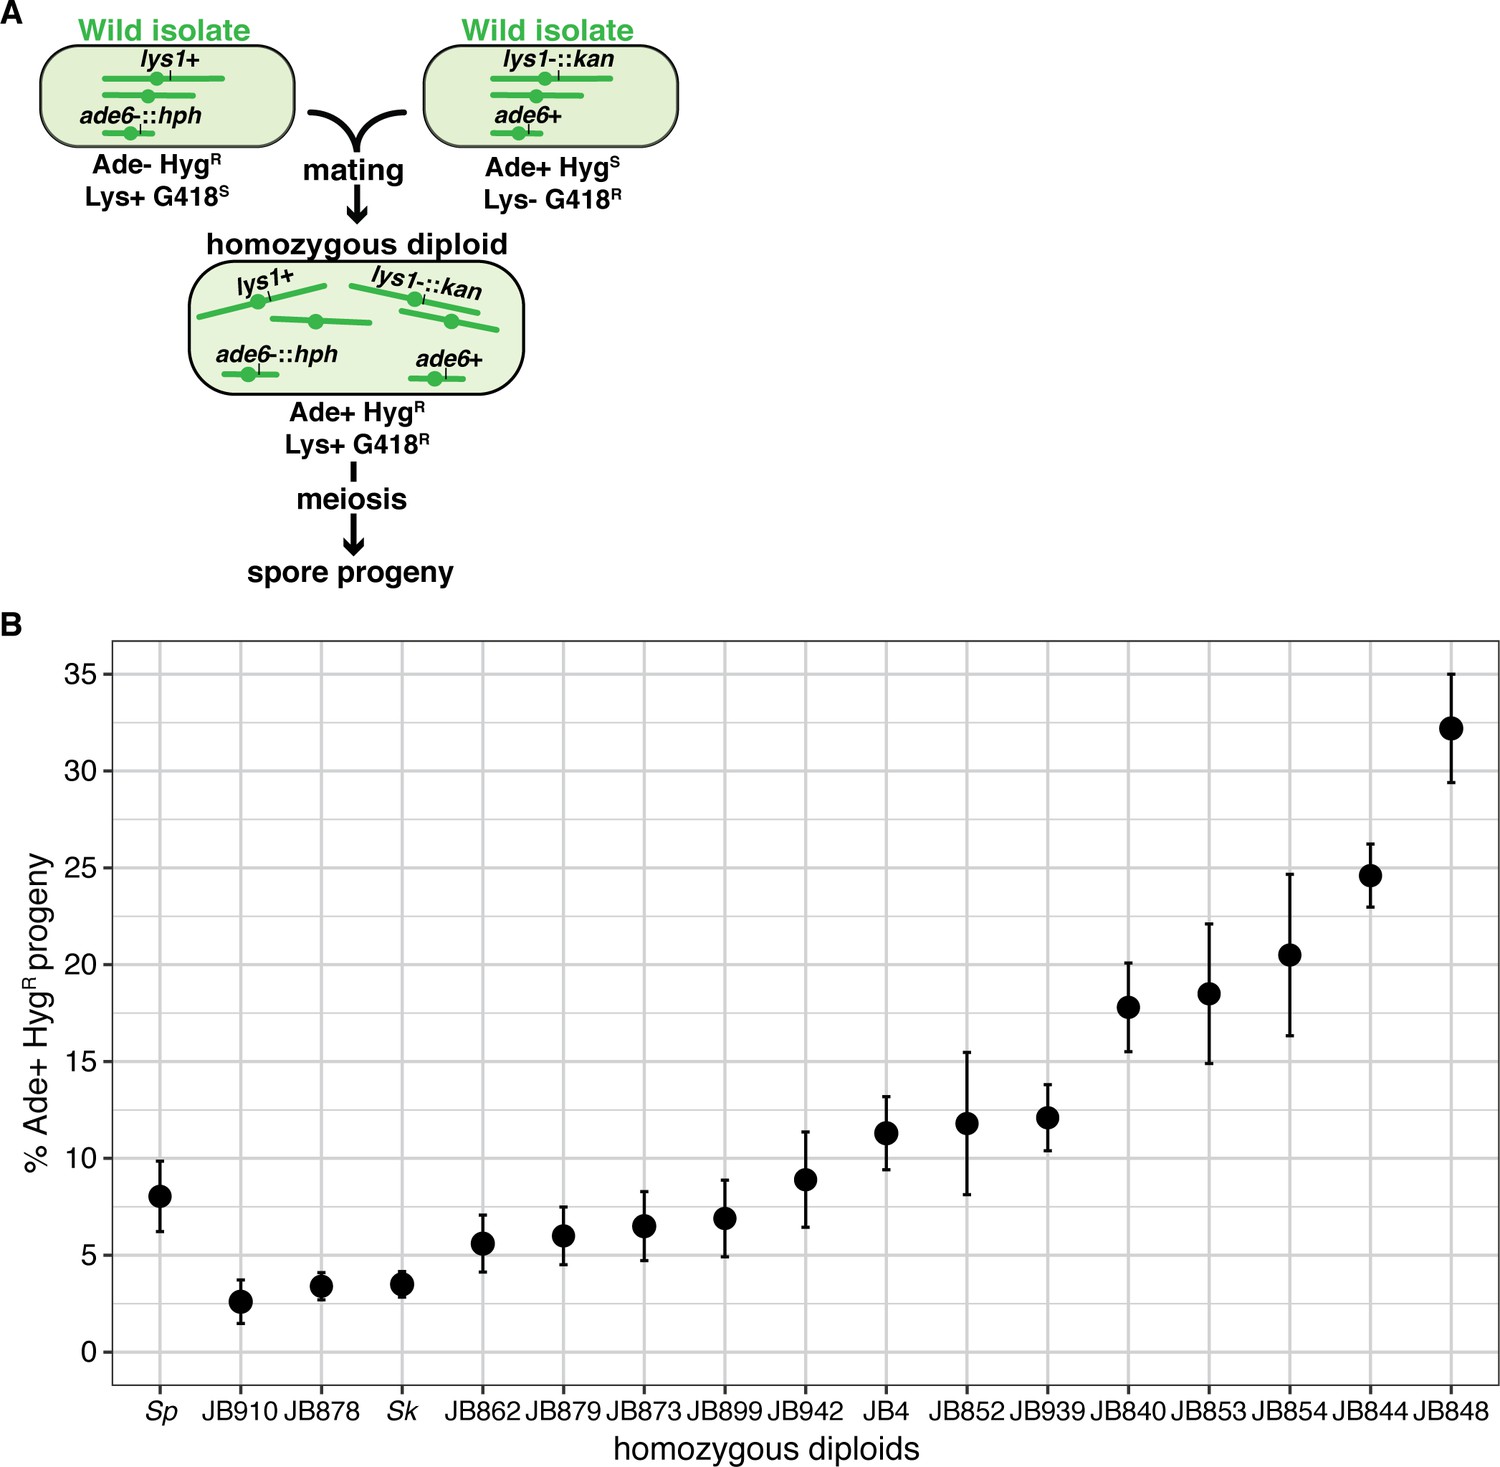
Homozygous S. pombe diploids generate variable frequencies of disomic spores.
(A) Schematic of the experimental approach used in (B). The ade6 marker is linked to centromere 3. (B) Phenotypes of homozygous S. pombe diploid strains. Allele transmission of chromosome three was assayed using co-dominant markers at ade6 (ade6+ and ade6-::hphMX6). The ade6+ allele confers an Ade+ phenotype, while the ade6-::hphMX6 cassette provides resistance to Hygromycin B (HygR). The error bars represent the standard error of the mean for each strain. Heterozygous aneuploid or diploid spores inherit both markers and are thus Ade+ HygR. More than 200 viable spores were scored for each diploid and at least three independent diploids were assayed. Raw data are shown in Figure 1—figure supplement 3—source data 1.
-
Figure 1—figure supplement 3—source data 1
Raw data of allele transmission values reported in Figure 1—figure supplement 3.
Each of the rows represents the relevant genotype and allele transmission of the indicated diploid. The first column shows the S. pombe diploid assayed. In columns 2–5 are the SZY strain number and relevant genotypes used to determine the allele transmission for chromosome 1 and chromosome 3. Columns 6–12 indicate the number of spores that exhibited the indicated phenotypes. The total number of spores assayed is shown in column 13. Column 14 indicates the percentage of the spores that were likely disomes (Ade+ and HygR). Column 15 indicates the percentage of the spores (shown in column 8) that were Ade+ HygS. Ade+ HygR spores were excluded to calculate these percentages. The last column shows the total number of independent diploids assayed for each cross.
- https://cdn.elifesciences.org/articles/57936/elife-57936-fig1-figsupp3-data1-v1.xlsx
Figure 2 with 5 supplements
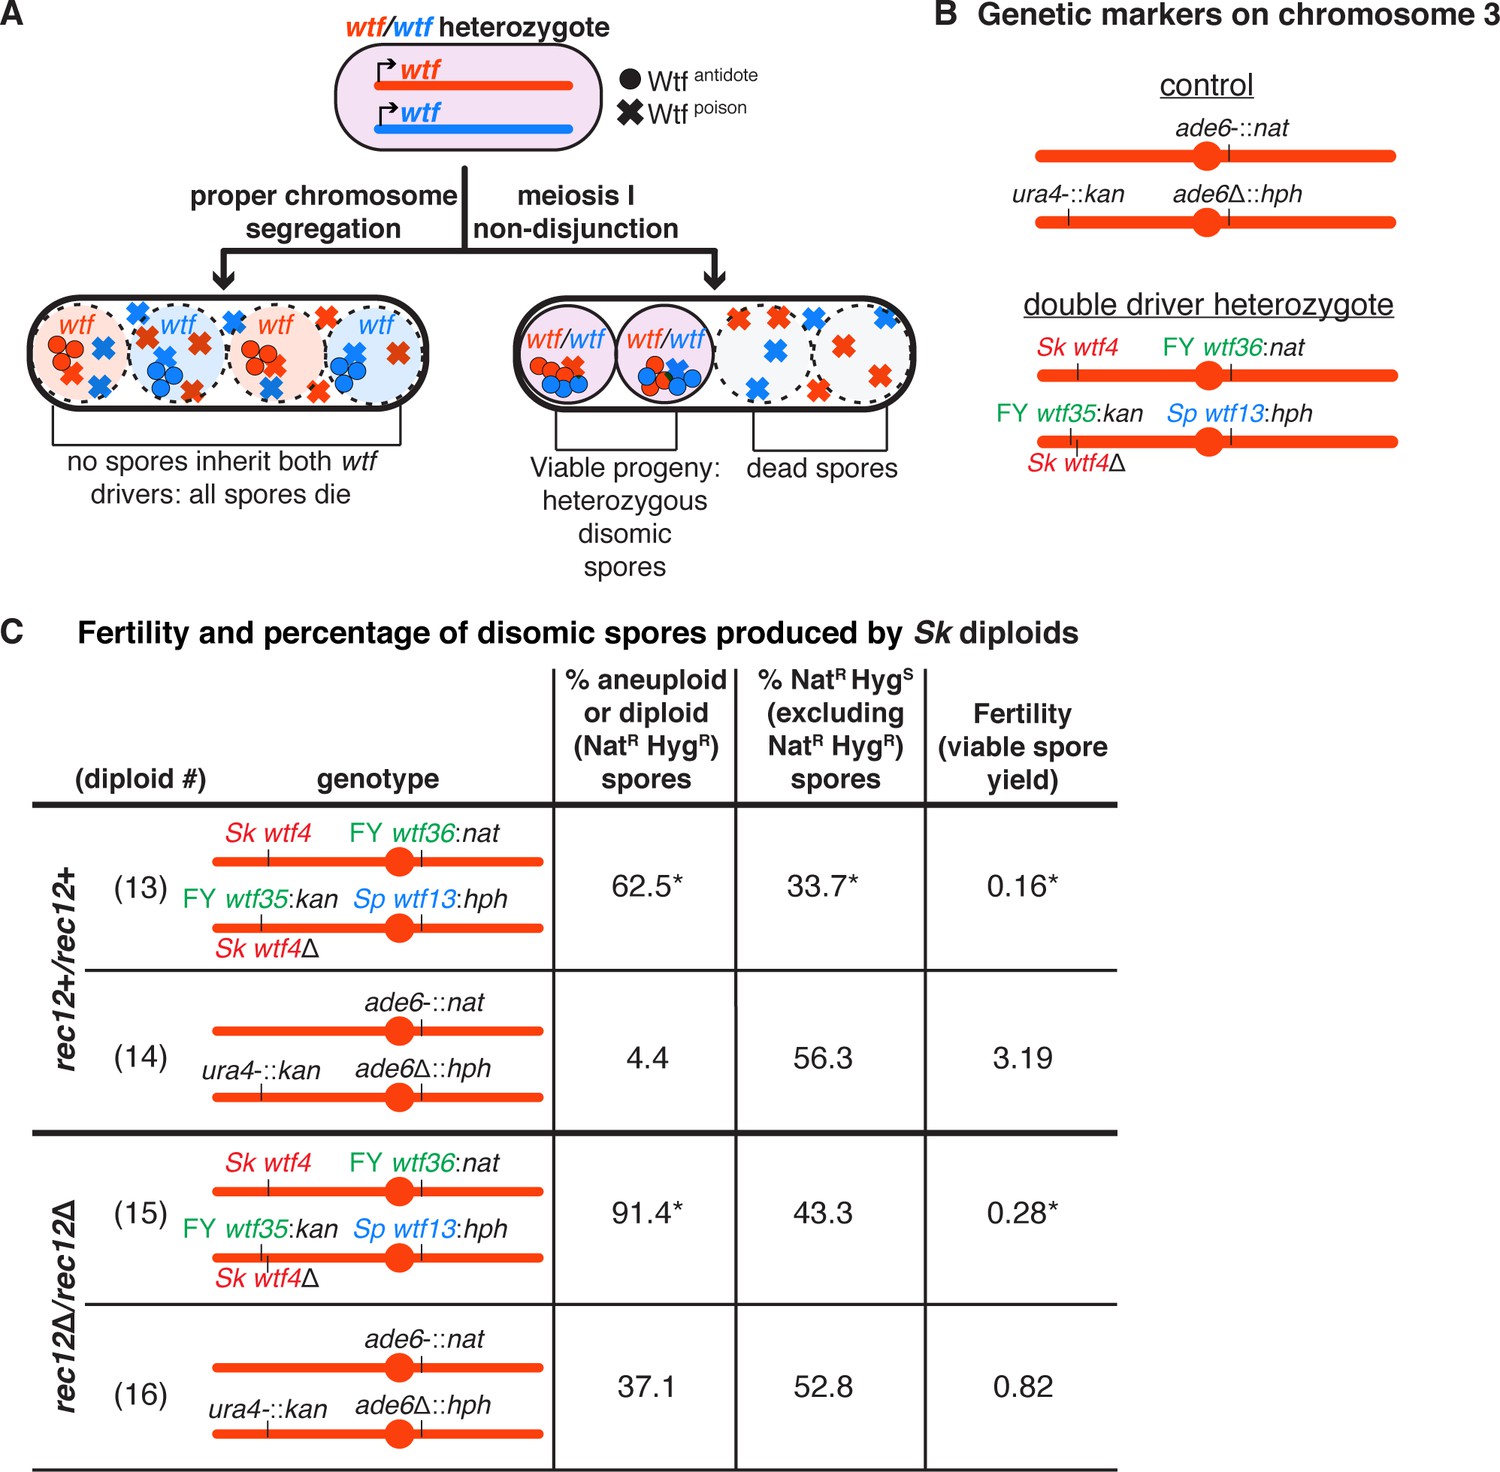
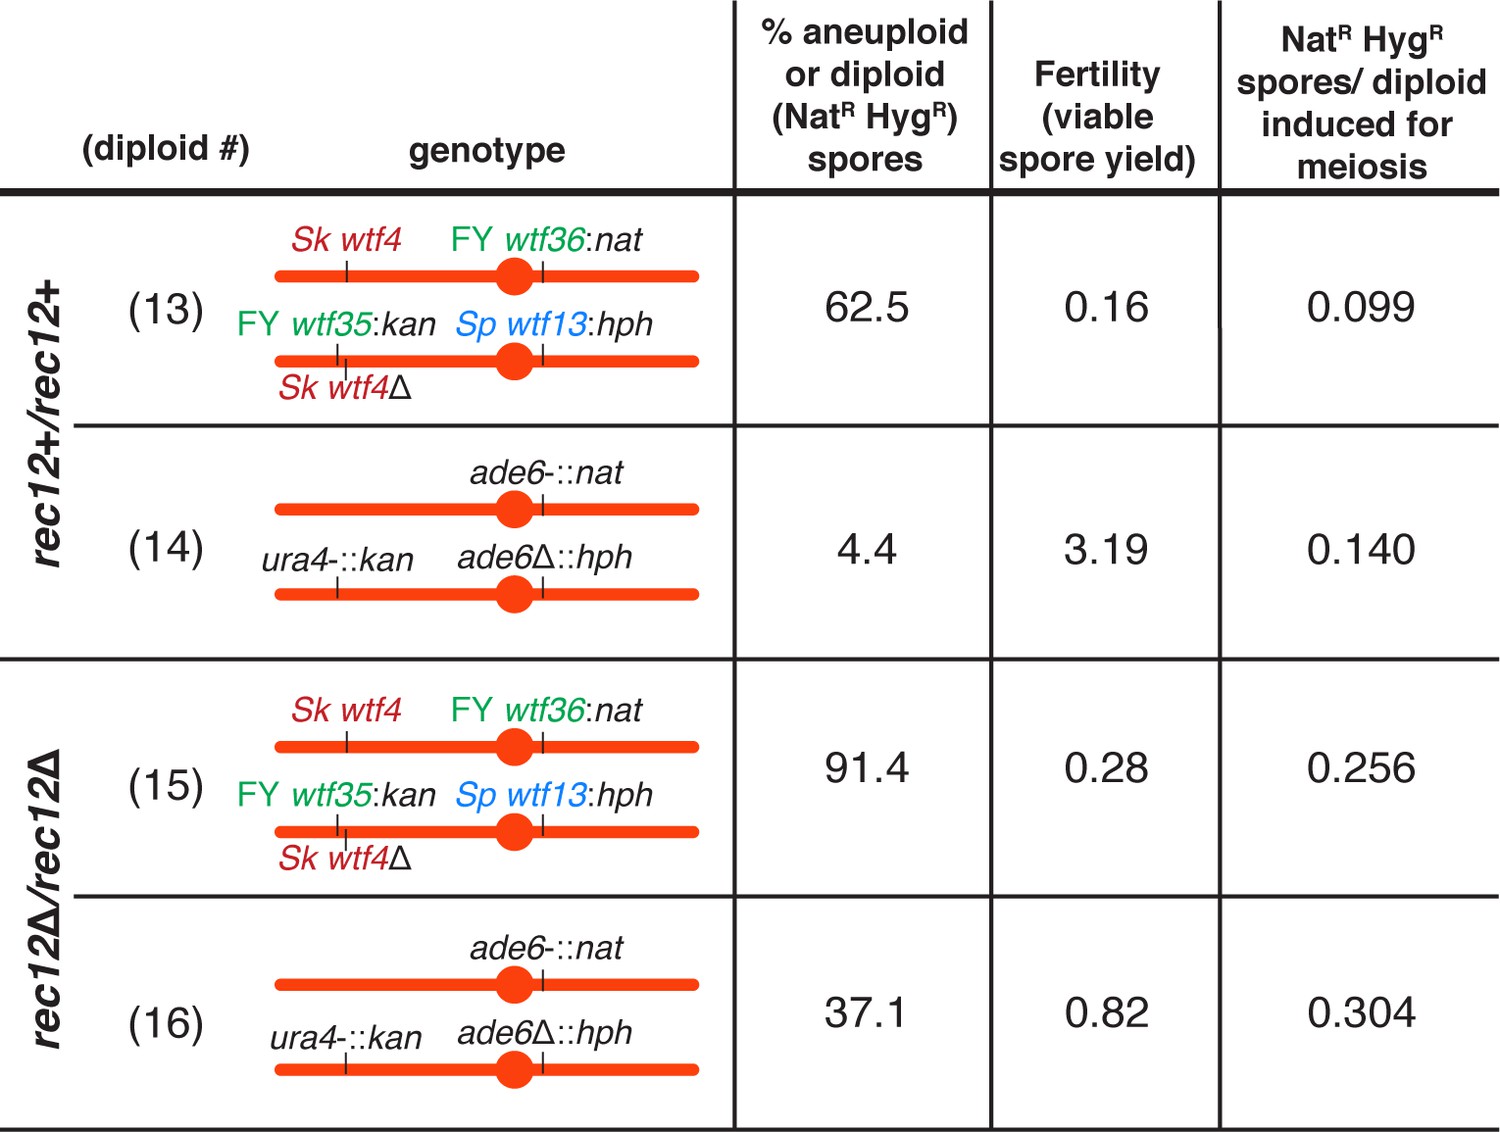
A high fraction of viable spores are disomic in Sk strains with wtf competition at two loci.
(A) Model for a diploid heterozygous for distinct wtf meiotic drivers. Spores are destroyed by any wtf driver that they do not inherit from the diploid progenitor cell. Meiosis I chromosome missegregation is one mechanism by which spores can inherit wtf alleles on competing haplotypes and survive. (B) Schematic of the genetic markers at ura4 and ade6 in the control diploid and the wtf transgenes inserted at ura4 and ade6 in Sk chromosome 3 in the double driver heterozygote. wtf genes from the Sp, Sk, and FY29033 strains are depicted in blue, red, and green, respectively. The wtf drivers shown here drive when heterozygous and do not counteract the effect of the other drivers (see Figure 2—figure supplement 1). (C) Phenotypes of the double driver heterozygote or control diploid in rec12+ (top) and rec12Δ (bottom) strain backgrounds. We expect NatR HygS spores to be present at 50% in the viable population. A significant departure from the expected 50% indicates drive favoring the overrepresented allele. For statistical analyses, the frequency of disomic spores, allele transmission, and fertility in the double driver heterozygotes was compared to the control diploids. Diploid 13 was compared to control diploid 14, and diploid 15 was compared to control diploid 16. * indicates p-value<0.05 (G-test [allele transmission and NatR HygR spores] and Wilcoxon test [fertility]). The data for diploid 14 were previously published in Bravo Núñez et al., 2020. Raw data can be found in Figure 2—source data 1 and Figure 2—source data 2.
-
Figure 2—source data 1
Raw data of allele transmission values reported in Figure 2, Figure 2—figure supplement 1, Figure 2—figure supplement 2, and Figure 2—figure supplement 3.
Each of the horizontal lines represents the relevant genotype and allele transmission of the indicated diploid. The first column matches the diploid number from Figure 2, Figure 2—figure supplement 1, Figure 2—figure supplement 2, and Figure 2—figure supplement 3. In columns 2–5 are the SZY strain number and relevant genotypes used to determine the allele transmission for chromosome 3. Columns 6 and 7 show the indicated the number of ura+ or ura- spores excluding disomes. Columns 9–11 indicate the number of haploid spores that exhibited the indicated phenotype. Column 15 indicates the total number of spores assayed excluding NatR HygR and G418R HygR spores. Column 16 indicates the total number of spores assayed. Column 17 shows the total number of independent diploids assayed for each cross. Columns 18 and 19 indicate the p-values calculated with a G-test when comparing diploids 13, 33–35, and 41–43 to control diploid 14; diploid 15 to control diploid 16; diploid 44 to control diploid 45; and diploids 24, 31, 32, 36–40, and 46 to control diploid 23. We found 44 additional colonies for diploid 46 that lacked both markers at ade6. The diploid numbers carry over between figures, meaning that the raw data for diploids 23 and 24 are also presented in Figure 4—source data 1 and Figure 6—source data 1. The data for diploids 14 and 23 were previously published in Bravo Núñez et al., 2020.
- https://cdn.elifesciences.org/articles/57936/elife-57936-fig2-data1-v1.xlsx
-
Figure 2—source data 2
Raw data of viable spore yield assays reported in Figure 2, Figure 2—figure supplement 1, Figure 2—figure supplement 2, and Figure 2—figure supplement 3.
Each column represents the diploid assayed, which matches the diploid number in Figure 2, Figure 2—figure supplement 1, Figure 2—figure supplement 2, and Figure 2—figure supplement 3. The first row of each table indicates in which figure these data are reported. The second row shows the diploid number. The third row shows the SZY strain numbers of both haploid parent strains. We present all of the viable spore yield values from independent assays. We calculated the p-value using the Wilcoxon test by comparing diploids 13, 33–35, and 41–43 to control diploid 14; diploid 15 to control diploid 16; diploid 44 to control diploid 45; and diploids 24, 31, 32, 36–40, and 46 to control diploid 23. The diploid numbers carry over between figures, meaning that the raw data for diploids 23 and 24 are also presented in Figure 4—source data 2 and Figure 6—source data 2. The data for diploids 14 and 23 were previously published in Bravo Núñez et al., 2020.
- https://cdn.elifesciences.org/articles/57936/elife-57936-fig2-data2-v1.xlsx
Figure 2—figure supplement 1
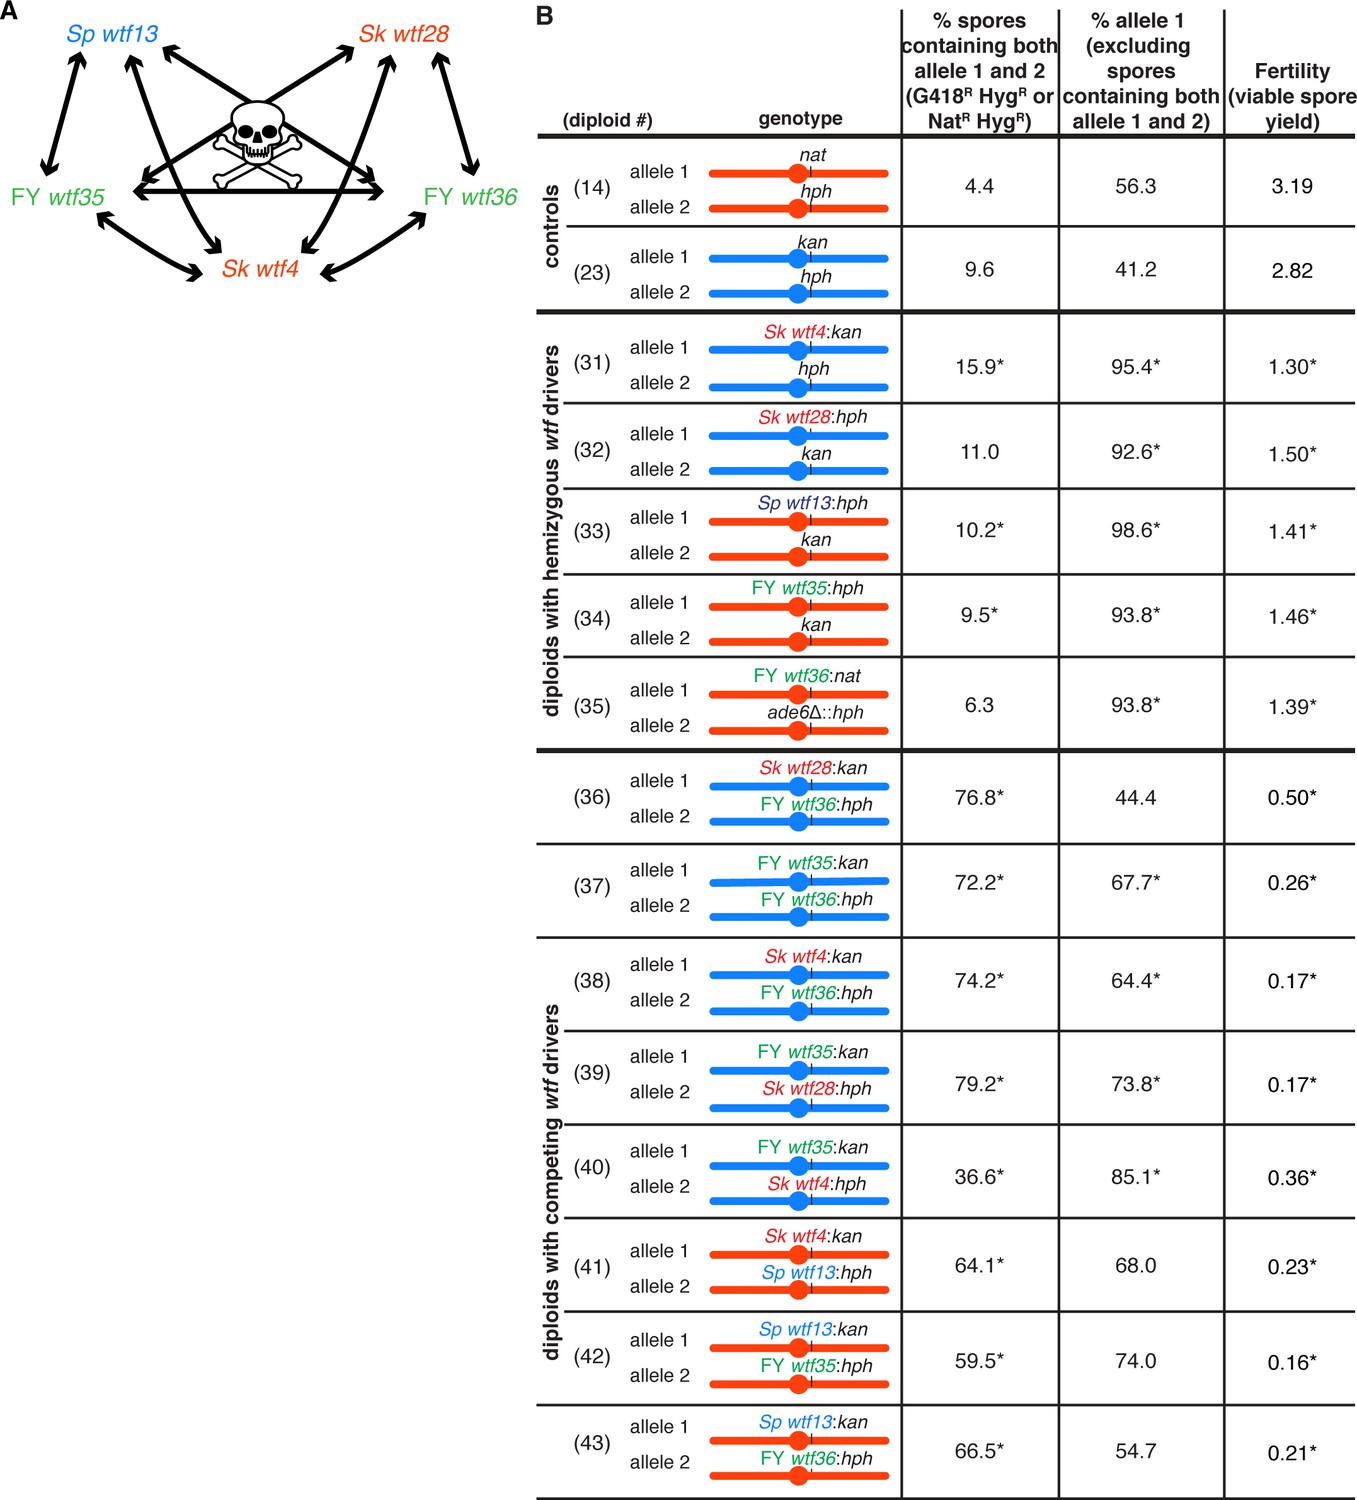
Wtfantidote proteins are generally specific for a Wtfpoison and do not provide cross-resistance to other Wtfpoison proteins.
(A) Summary of interactions between distinct wtf meiotic drivers. Due to the low fertility observed in the diploids with competing wtf meiotic drivers compared to the fertility of diploids with hemizygous wtf drivers, we concluded that the antidote of a given wtf driver does not provide resistance to a different poison. (B) Phenotypes of Sp and Sk diploids containing heterozygous wtf meiotic drivers or containing competing wtf meiotic drivers. For statistical analyses, the frequency of disomic spores, allele transmission, and fertility in the diploids with hemizygous or competing wtf drivers was compared to the control diploids. Diploids 31, 32, and 36–40 were compared to control diploid 23, and diploids 33–35 and 41–43 were compared to control diploid 14. * indicates p-value<0.05 (G-test [allele transmission and NatR HygR or G418R HygR spores] and Wilcoxon test [fertility]). The data for diploids 14 and 23 were previously published in Bravo Núñez et al., 2020. The diploid numbers carry over between figures, meaning that the data for diploids 14 and 23 are repeated from Figure 2 and Figure 4, respectively. Raw data can be found in Figure 2—source data 1 and Figure 2—source data 2.
Figure 2—figure supplement 2
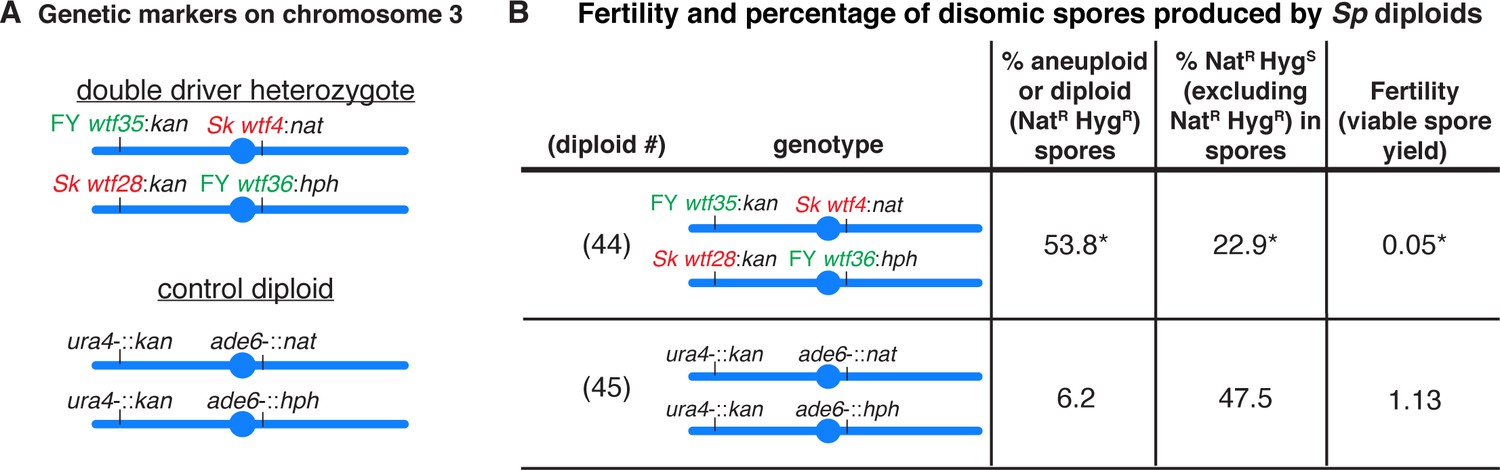
Sp diploids with wtf competition at two loci have a high fraction of viable spores that are disomic.
(A) Schematic of the genetic markers utilized in the control diploid and the double driver heterozygote in the Sp strain background. (B) Allele transmission and fertility of Sp diploids is shown. The allele transmission at ade6 was determined using co-dominant markers (natMX4 and hphMX6). We expect NatR HygS spores to be present at 50% in the population. A significant departure from the expected 50% indicates drive favoring the overrepresented allele. For statistical analysis, the frequency of disomic spores, allele transmission, and fertility from diploid 44 was compared to control diploid 45. * indicates p-value<0.05 (G-test [% NATR HygR spores and allele transmission] and Wilcoxon test [fertility]). Raw data can be found in Figure 2—source data 1 and Figure 2—source data 2. The low viable spore yield of diploid 45 relative to diploid 8 is likely due to double auxotrophy of this strain and the fact that all the experiments used unsupplemented SPA media (see Materials and methods).
Figure 2—figure supplement 3
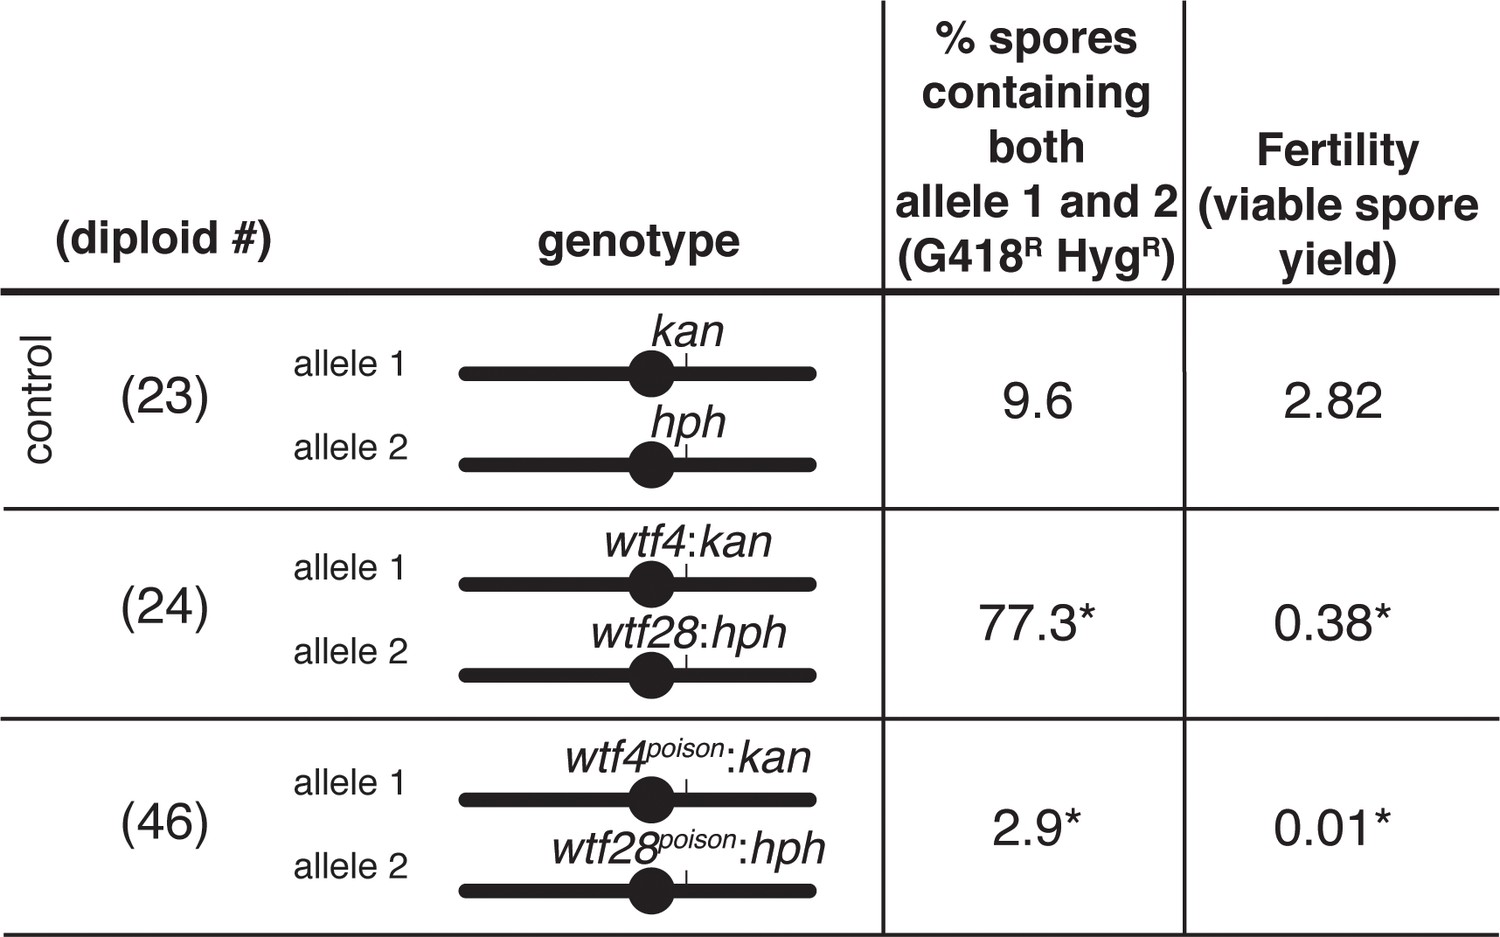
wtf poison-only alleles do not enrich for disomes in viable spores.
Disomy frequencies and fertility of Sp diploids are shown. The frequency of disomy was determined using co-dominant markers at ade6. For statistical analyses, we compared diploids 24 and 46 to control diploid 23. * indicates p-value<0.05 (G-test [% spores containing both allele 1 and allele 2] and Wilcoxon test [fertility]). The data for diploid 23 were previously published in Bravo Núñez et al., 2020. The diploid numbers carry over between figures, meaning that the data for diploids 23 and 24 are repeated from Figure 4. The raw data can be found in Figure 2—source data 1 and Figure 2—source data 2. For diploid 46, 44 additional colonies were recovered that lack both markers.
Figure 2—figure supplement 4
Competing wtf meiotic drivers do not affect the frequency of disomes generated per meiosis.
To calculate the number of aneuploid and diploid spores per meiosis from the diploids presented in Figure 2C, we multiplied the fraction of NatR HygR spores (disomes) by the viable spore yield (viable spores/viable diploid cells induced to undergo meiosis). This gave the number of NatR HygR spores produced per diploid cell induced to undergo meiosis.
Figure 2—figure supplement 5
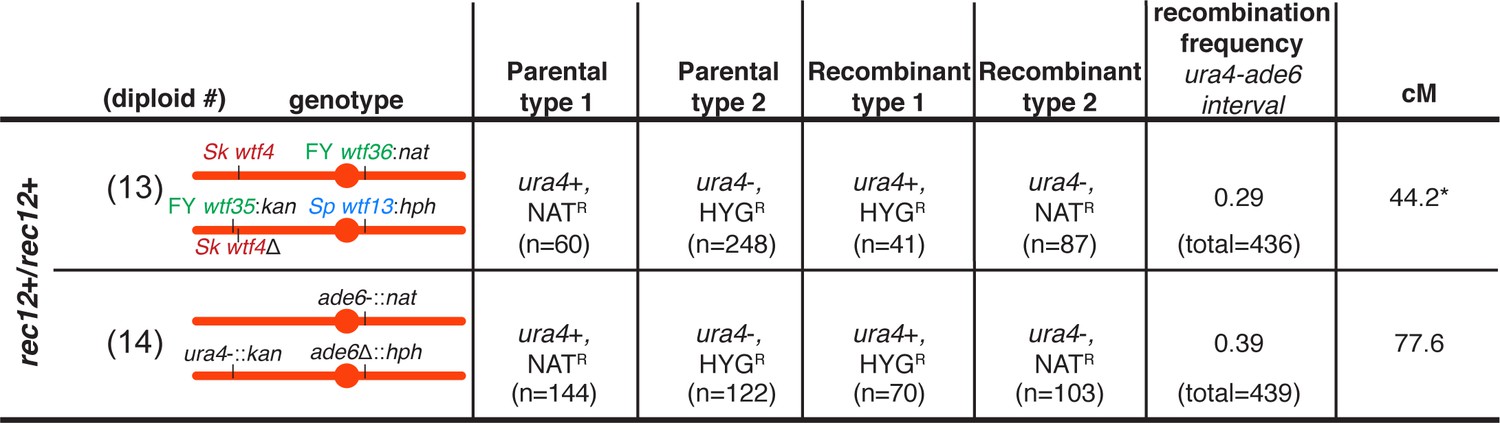
The recombination frequency is altered in Sk diploids with competing wtf meiotic drivers.
To determine the recombination frequency (R) within the ade6 and ura4 interval in diploids 13 and 14 presented in Figure 2, we calculated the number of recombinants/(number of parental and recombinant spores). To calculate the genetic distance (cM), we used Haldane’s formula x = −50 ln(1–2R) (Haldane, 1919; Smith, 2009). * indicates p-value=0.03 (G-test). The recombination frequency of diploid 13 was compared to the recombination frequency of diploid 14.
Figure 3 with 2 supplements
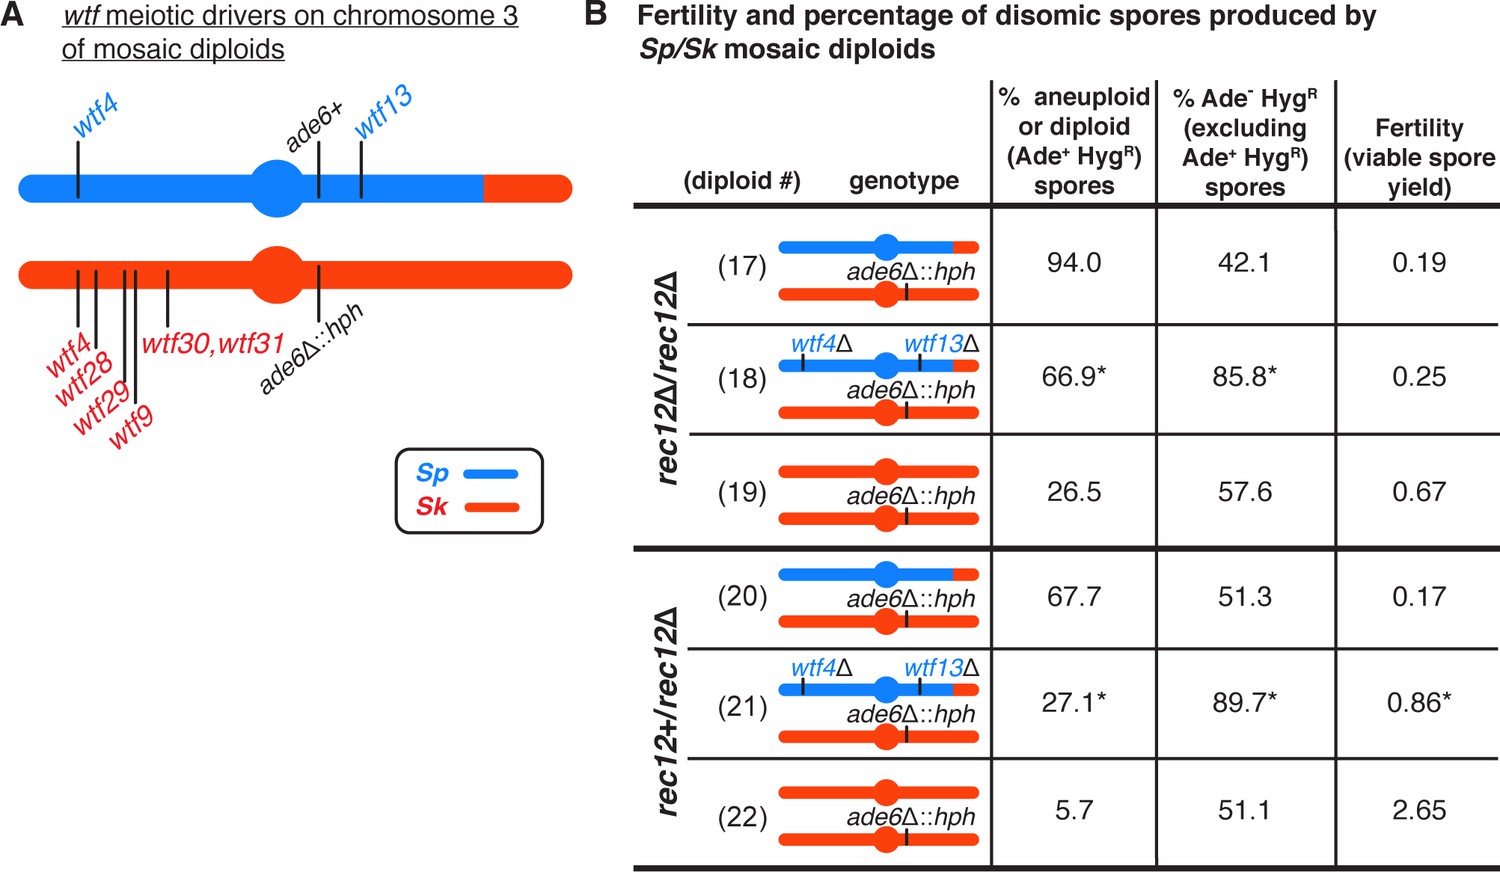
wtf meiotic driver competition contributes to the high disomy in spores produced by Sp/Sk mosaic diploids.
(A) Schematic of the predicted wtf meiotic drivers found on chromosome 3 of the Sp/Sk mosaic diploid. Sp-derived DNA is depicted in blue and Sk-derived DNA in red. (B) Phenotypes of mosaic and control diploids in rec12∆/rec12∆ and rec12+/rec12∆ backgrounds. Allele transmission of chromosome 3 was assayed using markers at ade6 (linked to centromere 3). In the absence of drive, we expect 50% of the spores to be Ade- HygR. Any significant deviation from the expected 50% indicates drive favoring the overrepresented allele. To determine the contribution of wtf meiotic drivers to the frequency of disomic spores and fertility, diploid 18 was compared to diploid 17, and diploid 21 was compared to diploid 20. To determine if there was biased allele transmission, diploids 17 and 18 were compared to control diploid 19, and diploids 20 and 21 were compared to control diploid 22. More than 300 viable spores were scored for each diploid. * indicates p-value<0.05 (G-test [allele transmission and Ade+ HygR spores] and Wilcoxon test [fertility]). Raw data can be found in Figure 3—source data 1 and Figure 3—source data 2.
-
Figure 3—source data 1
Raw data of allele transmission values reported in Figure 3 and Figure 3—figure supplement 1.
Each of the rows represents the relevant genotype and allele transmission of the indicated diploid. The first column matches the diploid number from Figure 3 and Figure 3—figure supplement 1. In columns 2–5 are the SZY strain number and relevant genotypes used to determine the allele transmission for chromosome three in the Sp/Sk mosaic and control diploids. Column six shows the Rec12 phenotype for each diploid. Columns 7 and 8 indicate the number of spores that exhibited the indicated phenotype (Ade+ HygS or Ade- HygR, respectively). Column nine shows the number of spores that exhibited both phenotypes and are thus Ade+ and HygR. These spores are likely disomic. The total number of spores assayed is shown in column 10. Column 11 indicates the percentage of disomic spores (Ade+ and HygR). Column 12 indicates the p-values calculated when comparing diploids 18, 47, 48, and 49 to diploid 17, and diploids 21, 50, and 51 to diploid 20. Column 13 shows the percentage of the spores (excluding Ade+ HygR spores) that were Ade- HygR. Column 14 indicates the p-value calculated when comparing diploids 17, 18, and 47–49 to control diploid 19, and diploids 20, 21, 50, and 51 to control diploid 22. The last column shows the total number of independent diploids assayed for each cross.
- https://cdn.elifesciences.org/articles/57936/elife-57936-fig3-data1-v1.xlsx
-
Figure 3—source data 2
Raw data of viable spore yield reported in Figure 3 and Figure 3—figure supplement 1.
The top table shows the data for Figure 3. The bottom table shows the data for Figure 3—figure supplement 1. Each column represents the diploid assayed, which matches the diploid numbers in Figure 3 and Figure 3—figure supplement 1. The first row shows the figure where the data are reported. The second row shows the diploid number. The third row shows the SZY strain numbers of both haploid parent strains. We present all of the viable spore yield values from independent assays. We calculated the p-value using the Wilcoxon test by comparing diploids 18, 47, 48, and 49 to diploid 17, and diploids 21, 50, and 51 to diploid 20.
- https://cdn.elifesciences.org/articles/57936/elife-57936-fig3-data2-v1.xlsx
Figure 3—figure supplement 1
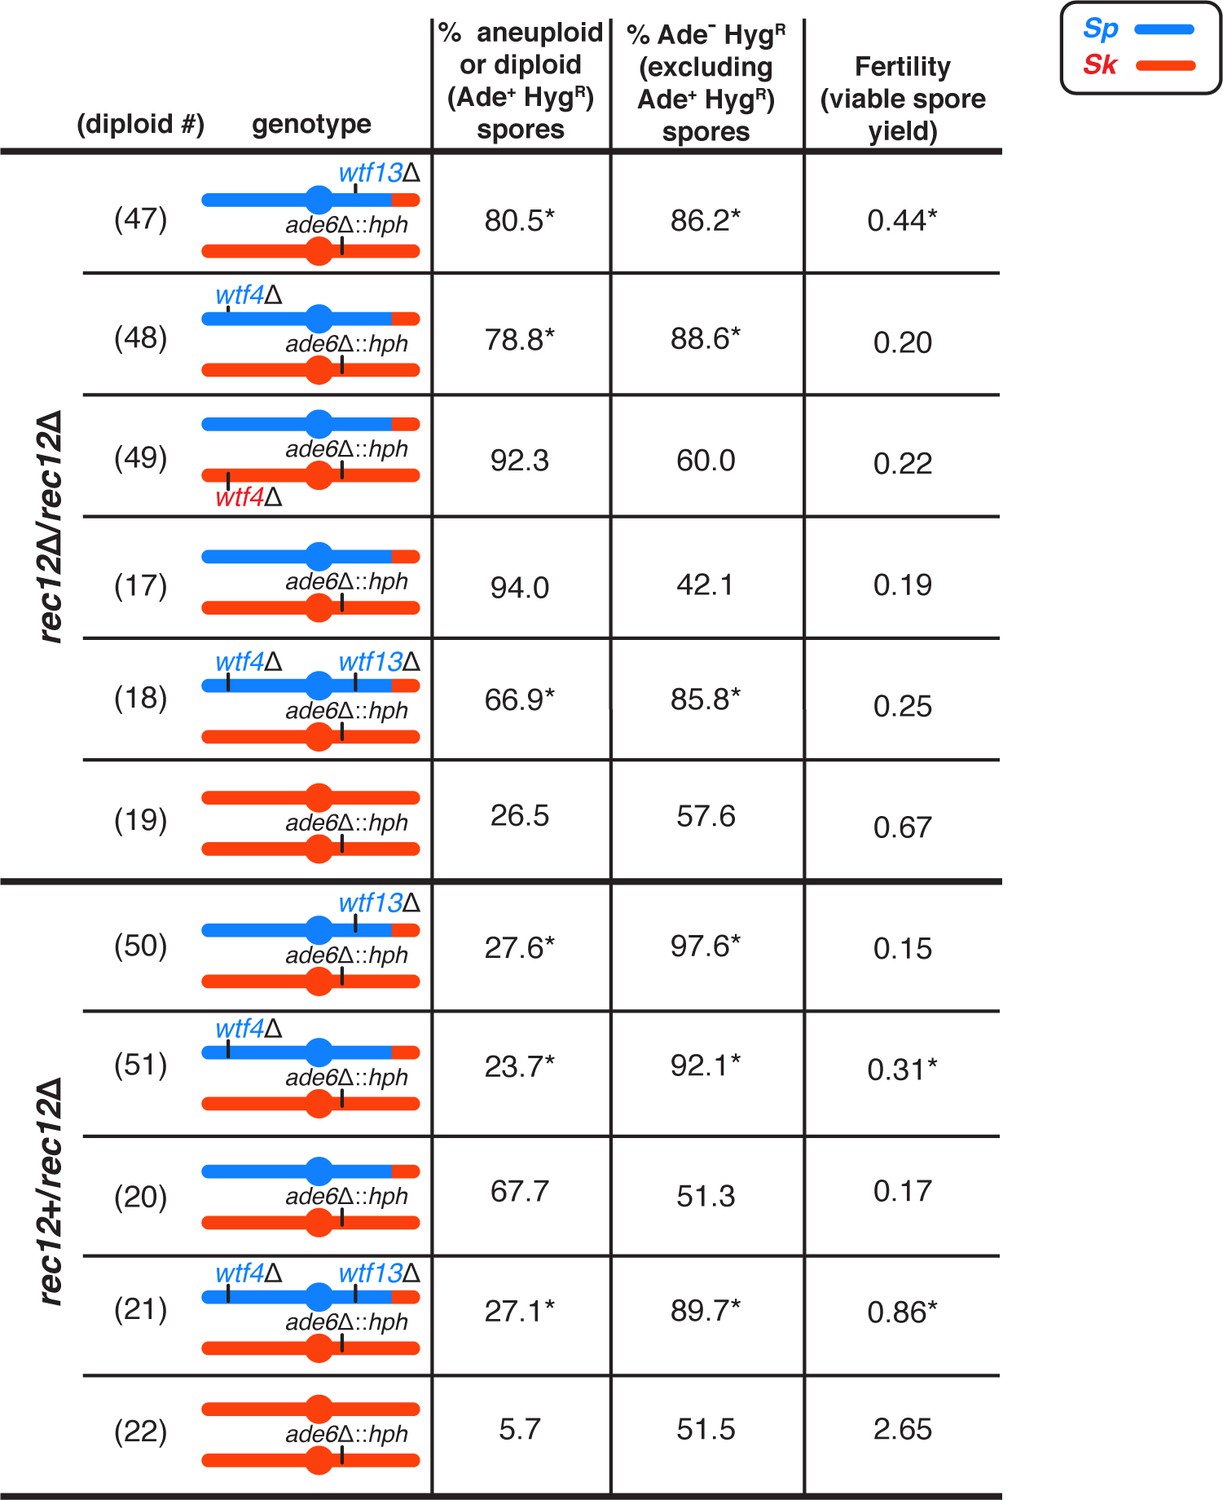
Single deletions of Sp wtf meiotic drivers partially decrease the frequency of disomic spores produced by Sp/Sk mosaic diploids.
Phenotypes of Sp/Sk mosaic and control diploids in rec12∆/rec12∆ and rec12+/rec12∆ backgrounds. Allele transmission of chromosome 3 was assayed using co-dominant markers at ade6 (ade6+ and ade6∆::hphMX6).). We expect that in the absence of drive, 50% of the spores will be Ade- HygR. Any significant deviation from the expected 50% indicates drive favoring the overrepresented allele. For statistical analyses of disomy and fertility, we compared diploids 18 and 47–49 to diploid 17, and diploids 21, 50, and 51 to diploid 20. For statistical analyses of allele transmission, we compared diploids 17, 18, and 47–49 to control diploid 19, and we compared diploids 20, 21, 50, and 51 to control diploid 22. * indicates p-value<0.05 (G-test [allele transmission, Ade+ HygR] and Wilcoxon test [fertility]). Raw data can be found in Figure 3—source data 1 and Figure 3—source data 2. Diploid numbers get carried over between figures, meaning that the data for diploids 17–22 are also presented in Figure 3.
Figure 3—figure supplement 2
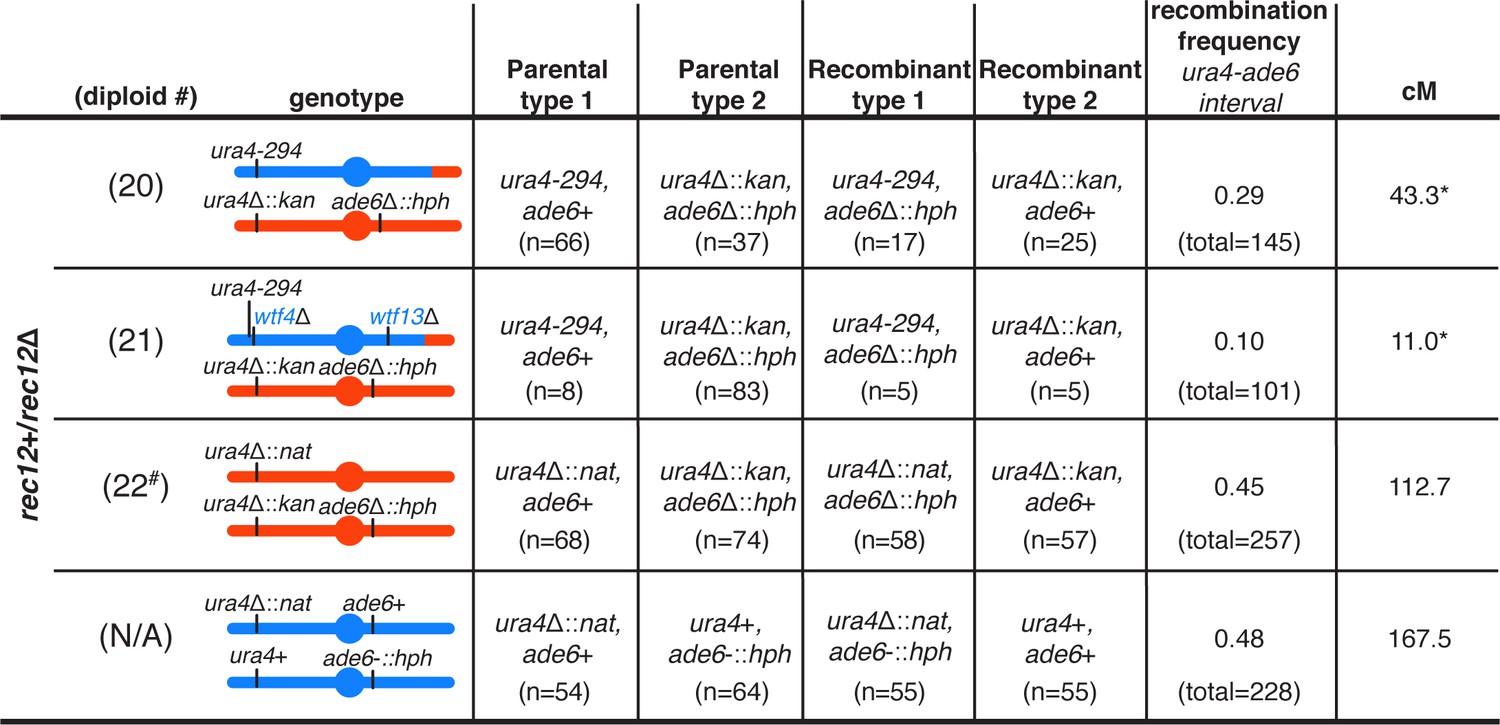
Observed recombination frequencies are altered by meiotic drive in Sp/Sk mosaic diploids.
To determine the recombination frequencies (R) between ade6 and ura4 in Rec12+ diploids presented in Figure 3 (diploids 20, 21, and 22), and in an Sp homozygous control, we calculated the number of recombinant spores/(number of parental and recombinant spores). To calculate the genetic distance (cM), we used Haldane’s formula x = −50 ln(1–2R) (Haldane, 1919; Smith, 2009). The data for the Sp homozygous control was generated by crossing strains SZY2397 and SZY1180. * indicates p-value<0.05 (G-test). Diploids 20 and 21 were compared to diploid 22 (p-values=0.03 and 5.6e-07, respectively) and the Sp homozygote (p-values=0.01 and 1.5e-07, respectively). # indicates that in diploid 22, only the data from the cross between SZY320 and SZY293 were used to calculate the genetic distance between ade6 and ura4.
Figure 4 with 5 supplements

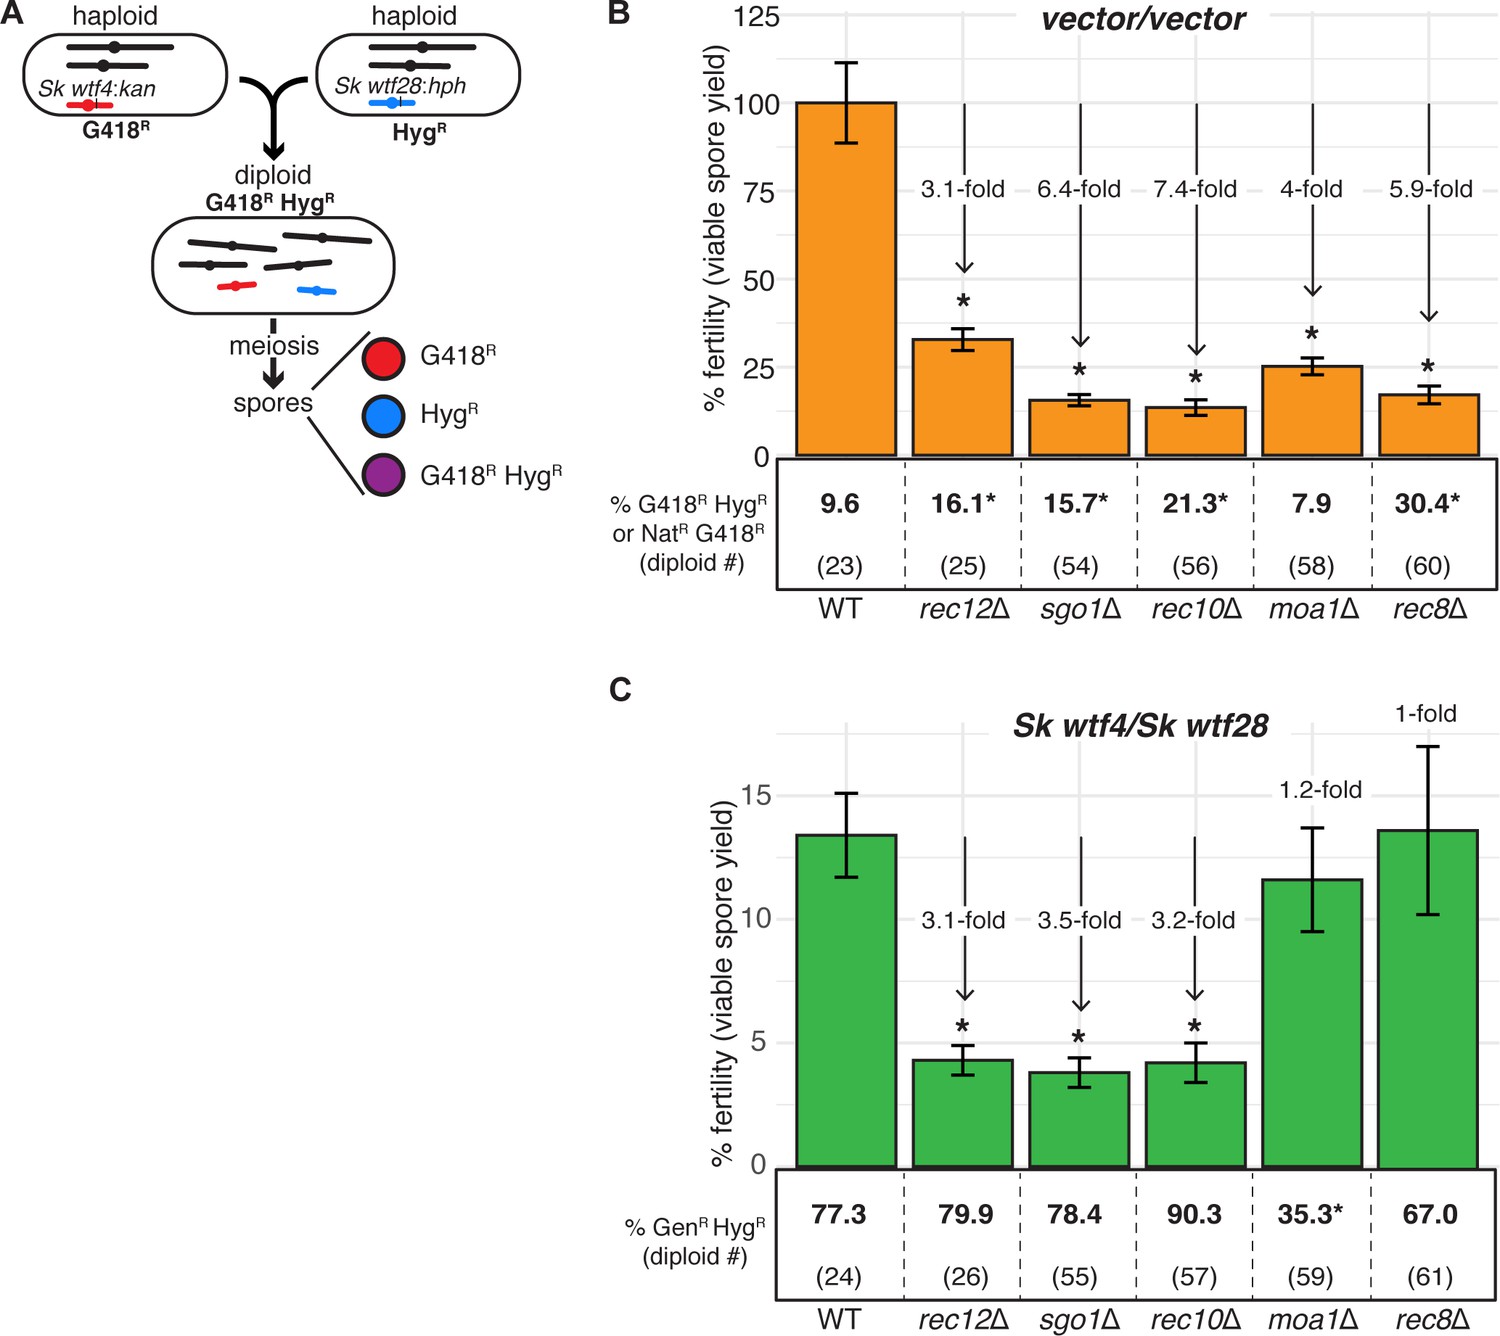
wtf competition at a single locus in meiosis selects for spores that are aneuploid, diploid, or contain a wtf duplication.
(A) Schematic of Sp strains crossed to make an Sk wtf4:kanMX4/Sk wtf28:hphMX6 heterozygote (diploid 24) and the possible spore phenotypes produced by that diploid. A similar control diploid (diploid 23) was created with empty vectors linked to drug resistant markers at the same locus. (B) Types of G418R HygR spores. We distinguished these classes using a series of phenotypic and molecular tests (see Materials and methods, Figure 4—figure supplement 3, Figure 4—figure supplement 4, and Figure 4—figure supplement 5). (C) Viable spores observed in control crosses (vector/vector) or with competing wtf meiotic drivers at the ade6 locus in a rec12+ (top) or rec12Δ (bottom) background. Percentages of G418R HygR (aneuploid, diploid, haploid with a duplication event) spores are shown. For statistical analyses, we compared diploid 24 to control diploid 23, and diploid 26 to control diploid 25. * indicates p-value<0.05 (G-test [G418R HygR] and Wilcoxon test [fertility]). Raw data can be found in Figure 4—figure supplement 5, Figure 4—source data 1, and Figure 4—source data 2. The data for diploid 23 [excluding inset analyses of G418R HygR spores] were previously published in Bravo Núñez et al., 2020.
-
Figure 4—source data 1
Raw data of allele transmission values reported in Figure 4C and Figure 4—figure supplement 2.
Each of the rows represents the relevant genotype and allele transmission of the indicated diploid. The first column matches the diploid number from Figure 4C and Figure 4—figure supplement 2. In columns 2–5 are the SZY strain number and relevant genotypes used to determine the allele transmission of the wtf genes or empty vector. Column six indicates if the diploid has a rec12+ or rec12- phenotype. Columns 7 and 8 indicate the genotype (ura+ or ura- spores). Columns 10 and 11 indicate the number of haploid spores that exhibited the indicated phenotype (G418R or G418S). Column 12 shows the number of spores that exhibited the G418R HygR phenotype. Column 16 indicates the total number of spores assayed excluding G418R HygR spores. Column 17 indicates the total number of spores assayed. Column 18 shows the total number of independent diploids assayed for each genotype. The last two columns show the p-values calculated using a G-test from the allele transmission at ade6 and the frequency of G418R HygR spores, respectively. To calculate the p-values, we compared diploid 24 to control diploid 23; diploid 26 to control 25; and diploid 52 to control diploid 53. The data for diploid 23 were previously published in Bravo Núñez et al., 2020. The raw data for diploid 23 and 24 is also presented in Figure 2—source data 1 and Figure 6—source data 1.
- https://cdn.elifesciences.org/articles/57936/elife-57936-fig4-data1-v1.xlsx
-
Figure 4—source data 2
Raw data of viable spore yield reported in Figure 4 and Figure 4—figure supplement 2.
Each column represents the diploid assayed, which matches the diploid number in Figure 4 and Figure 4—figure supplement 2. The first row shows the figure where the data are presented. The second row shows the diploid number. The third row shows the SZY strain numbers of both haploid parent strains. We present all of the viable spore yield values from independent assays. To calculate the p-value, we used the Wilcoxon test and compared diploid 24 to control diploid 23; diploid 26 to control diploid 25; and diploid 52 to control diploid 53. The data for diploid 23 were previously published in Bravo Núñez et al., 2020. The raw data for diploid 23 and 24 are also presented in Figure 2—source data 2 and Figure 6—source data 2.
- https://cdn.elifesciences.org/articles/57936/elife-57936-fig4-data2-v1.xlsx
Figure 4—figure supplement 1
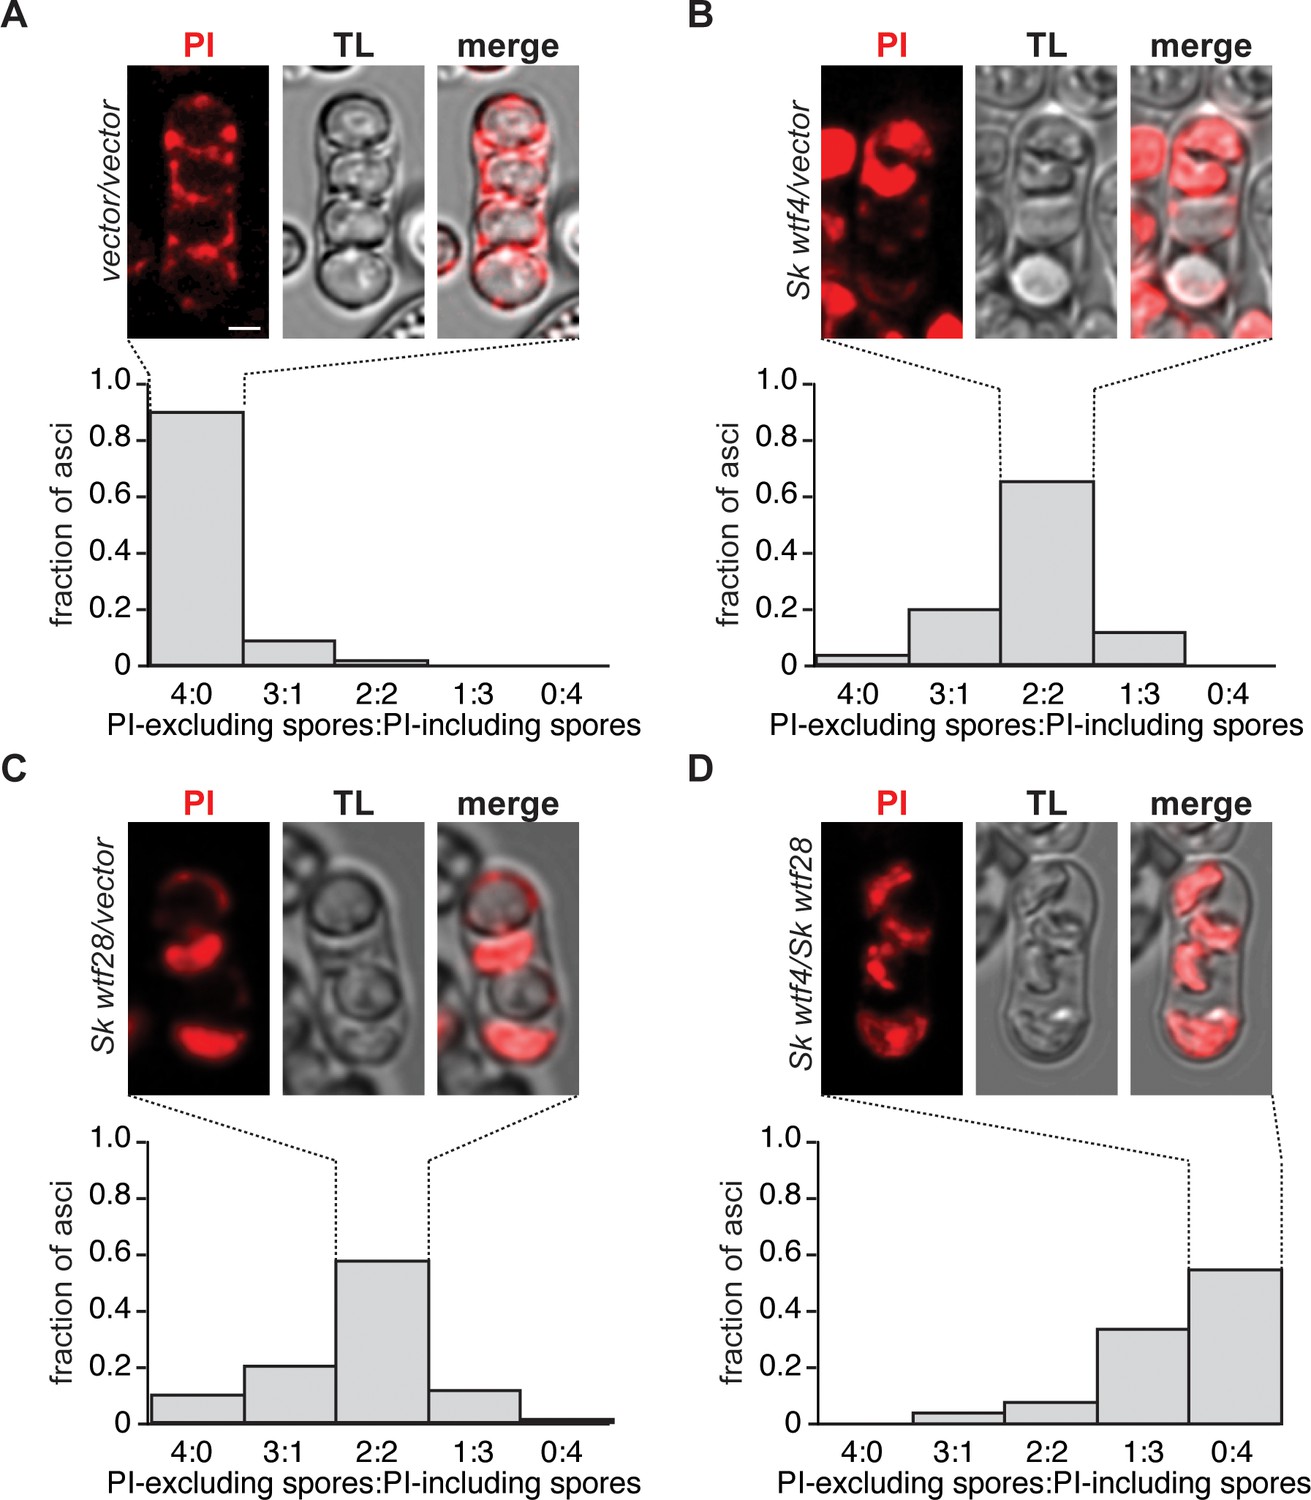
Most spores are destroyed by wtf driver competition.
Representative images of tetrads stained with propidium iodide (PI) of (A) control diploid (SZY2625/SZY1180) (n = 70 4-spore asci), (B) Sk wtf4/empty vector diploid (SZY2628/SZY1180) (n = 86 4-spore asci), (C) Sk wtf28/empty vector diploid (SZY1293/SZY2625) (n = 80 4-spore asci), and (D) Sk wtf4/Sk wtf28 diploid (SZY2628/SZY1293) (n = 53 4-spore asci). Underneath the images is quantification showing the overall staining pattern. PI penetrates the spores with compromised membranes (i.e. dead spores) (Nuckolls et al., 2017). The images were smoothed using Gaussian blur. The scale bar represents 2 μm.
Figure 4—figure supplement 2
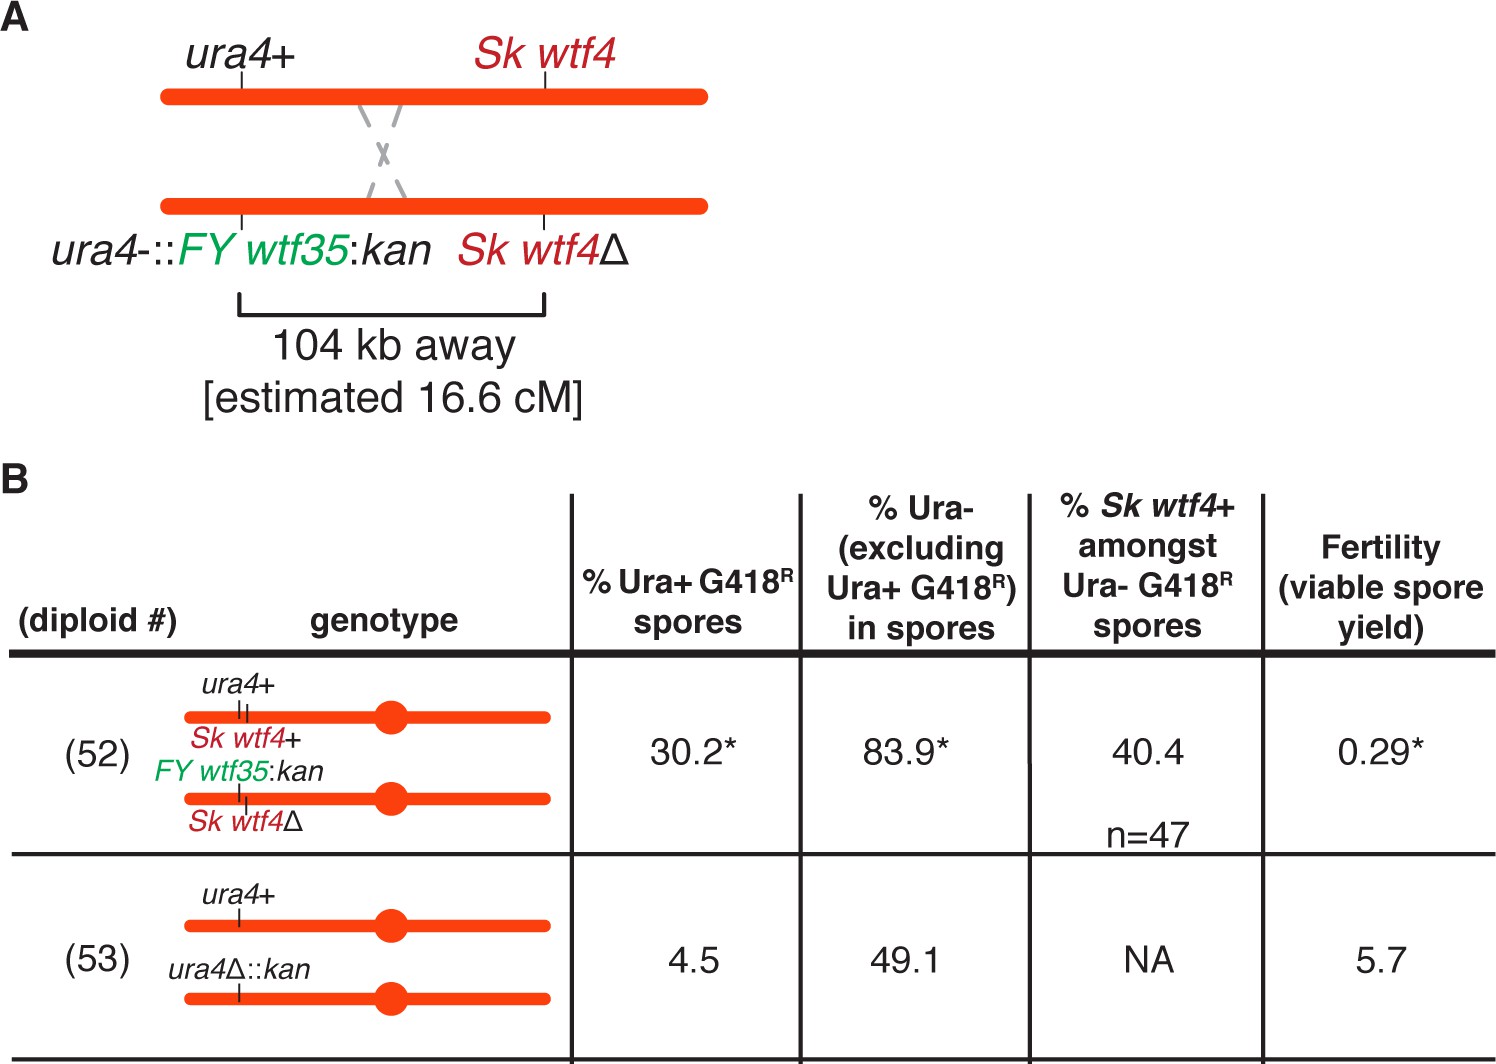
Competing wtf meiotic drivers enrich for spores that contain both wtf alleles in Sk.
Phenotypes of wtf competition and control diploids. Alleles were followed using the ura4+ and kanMX4 markers. We determined the presence of the wtf4+ allele amongst the ura- G418R spores via PCR with oligos 543+548. For statistical analyses of allele transmission, ura+ G418R frequency, and fertility, we compared diploid 52 to control diploid 53. * indicates p-value<0.05 (allele transmission and ura+ G418R [G-test], fertility [Wilcoxon test]). The raw data can be found in Figure 4—source data 1 and Figure 4—source data 2.
Figure 4—figure supplement 3
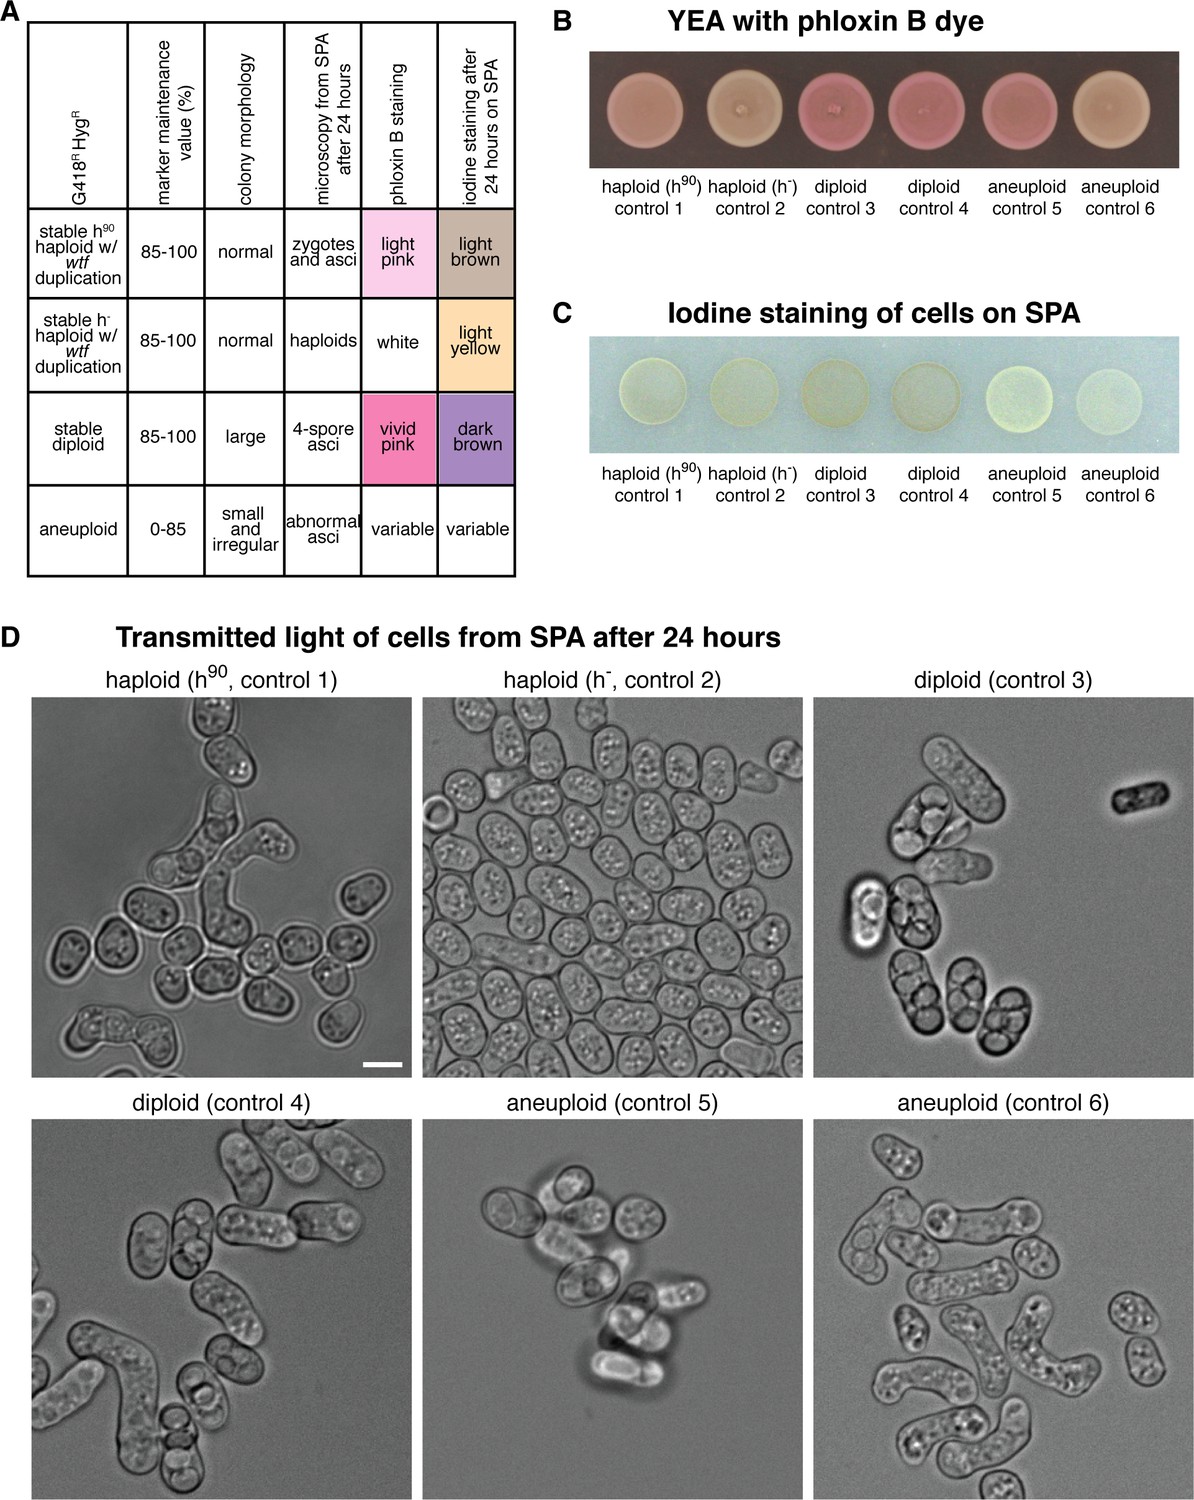
Methods to distinguish between haploid, diploid, and aneuploid spore colonies.
(A) Summary table of how the ploidy of the spore colonies was determined based on the distinct phenotypes is shown. The marker maintenance value reflects the percentage of cells containing both markers (kanMX4 and hphMX6) after passaging 1:10 diluted 650 μL cultures for 5 days. (B) Images of the controls spotted onto phloxin B-containing plates. Phloxin B is normally used in S. pombe to stain dead cells (Forsburg and Rhind, 2006). Due to the instability of S. pombe diploids, patches of diploid cells stain bright pink. In contrast, haploid cells do not stain and remain white. (C) Images of the controls spotted onto sporulation plates (SPA) and then stained with iodine vapors after 24 hr. Iodine vapors stain the starch in the spore wall (Forsburg and Rhind, 2006). Cells that made spores after 24 hr on sporulation plates will stain brown. Otherwise, the cells will stain yellow. (D) Representative images of the haploid, diploid, and aneuploid controls. The cells were taken from the sporulation plates after 24 hr. Scale bar represents 5 μm.
Figure 4—figure supplement 4
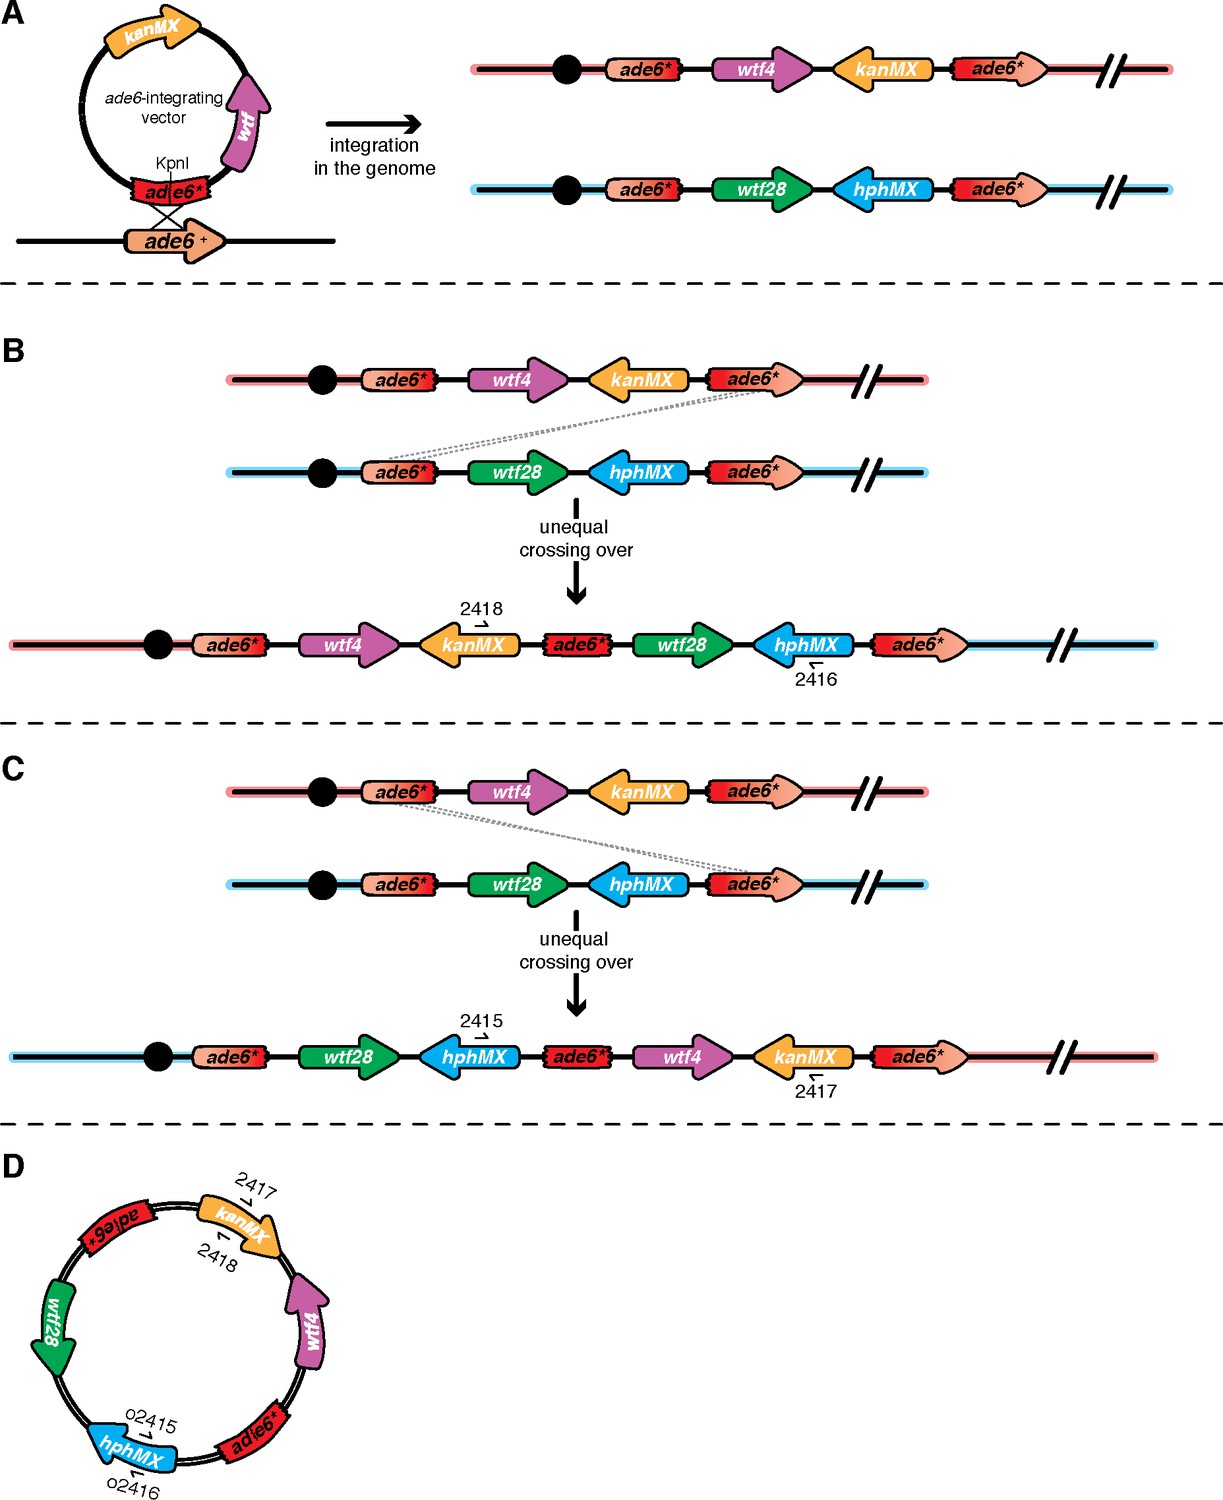
Unequal crossover event at ade6 leads to wtf duplication.
(A) Schematic of the ade6 locus before and after transformation of the ade6-integrating vector into the genome. (B) An example of unequal crossing over leading to a wtf duplication event is shown. To determine the presence of this duplication event in the G418R HygR haploids, we used oligos 2416 + 2418 found within the drug resistance cassettes. (C) An example of a second scenario of unequal crossing over leading to a wtf duplication is shown. To determine the presence of the duplication event in the G418R HygR haploids, we used oligos (2415 + 2417) within the drug resistance markers. (D) Schematic of circularization of duplicated ade6 transgenes. The ade6-integration vectors are prone to popping-out due to intrachromatid crossovers between the terminal ade6 cassettes. After the duplication event happened, the entire construct could have popped-out of the genome. The PCR results (i.e. amplification of a product with both pairs of oligos presented in Figure 4—figure supplement 5) are consistent with these pop-outs forming in most cases.
Figure 4—figure supplement 5
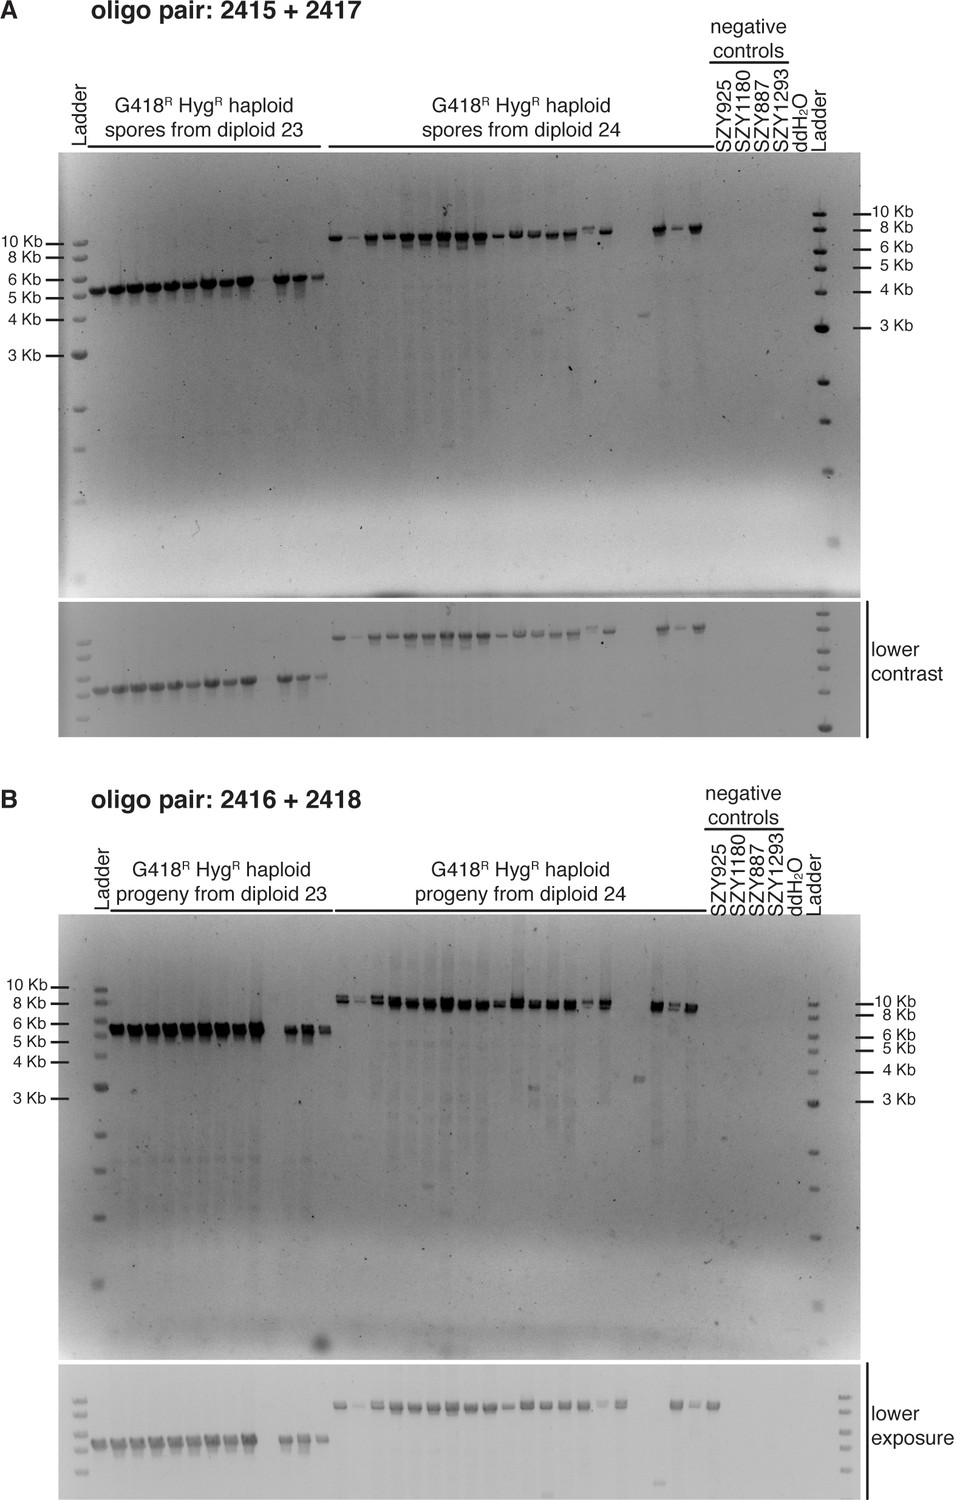
Evidence of unequal crossover events between transgenes inserted at ade6.
Ethidium bromide agarose gel (1%) of predicted haploids with duplication events using (A) oligos 2415 + 2417 and (B) oligos 2416 + 2418. Most of the haploids tested show both orientations of duplication events suggesting potential circularization of the duplicated transgenes as shown in Figure 4—figure supplement 4D. Below each gel, we show an image with lower contrast or exposure, respectively. The negative controls are the haploid parental strains.
Figure 5
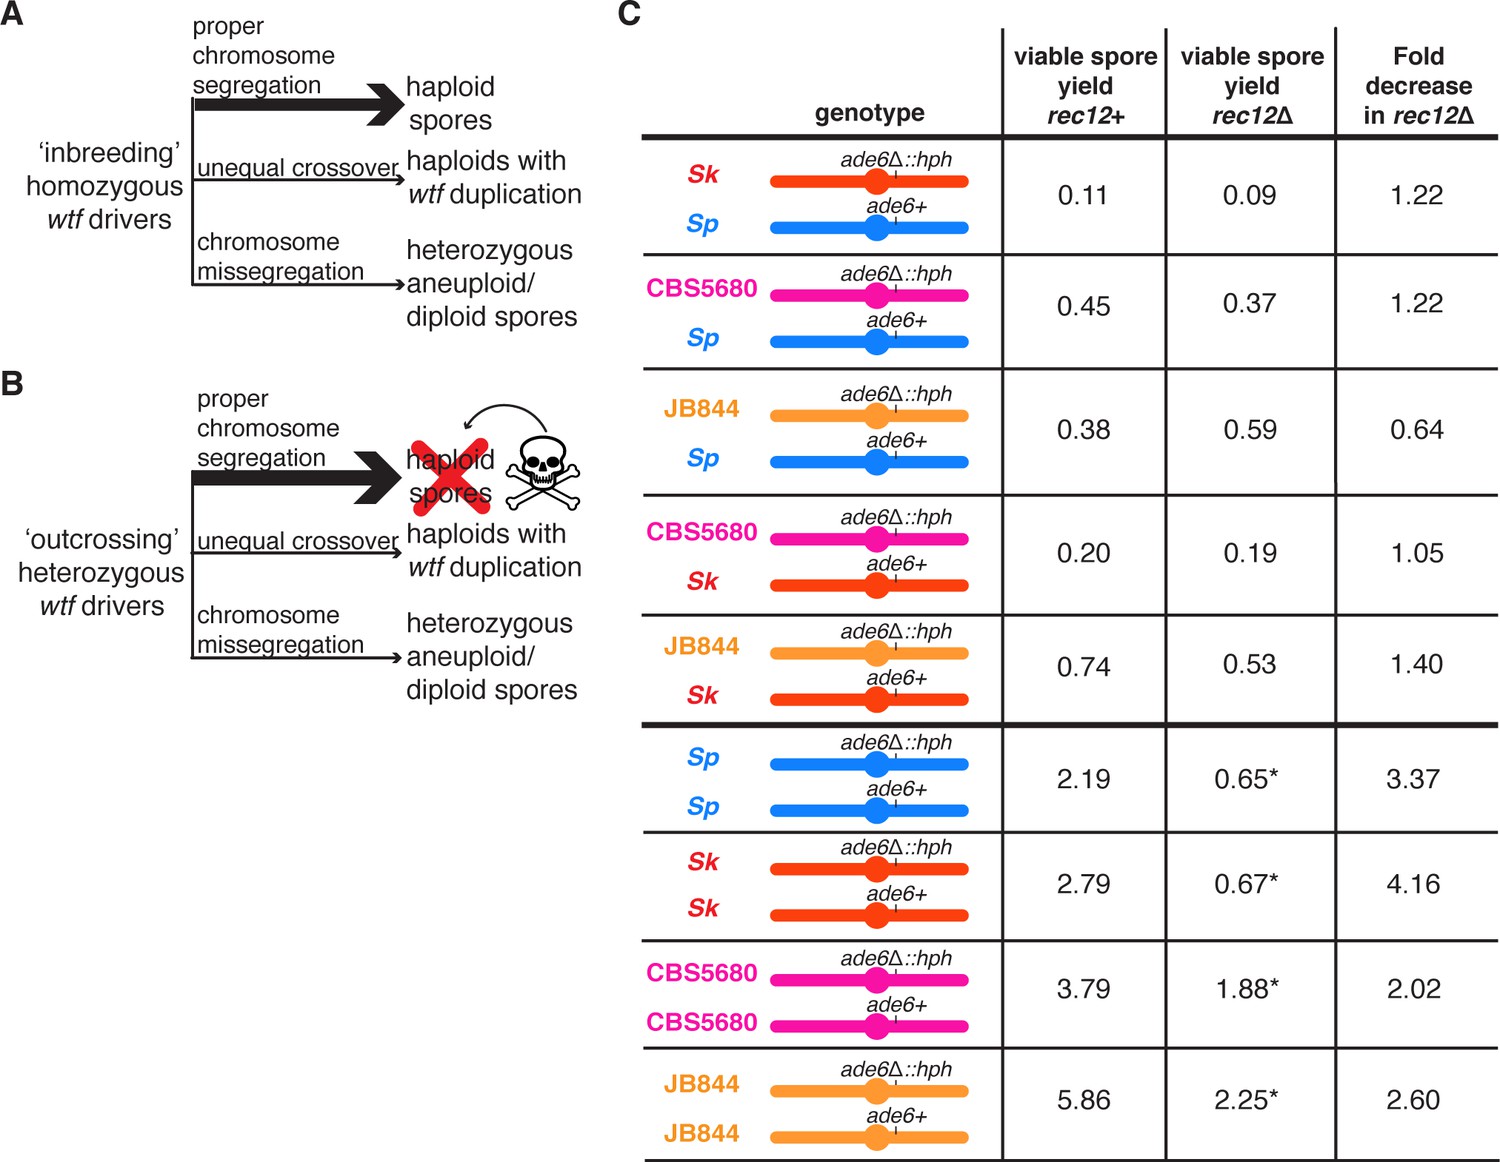
The Rec12 protein does not promote fertility in heterozygous S. pombe diploids.
(A) Schematic of viable spores resulting from an ‘inbreeding’ scenario. The three indicated types of spores are viable when wtf drivers are homozygous. (B) Schematic of viable spores resulting from an ‘outcrossing’ scenario where one set of wtf drivers is heterozygous. Haploid spores that only inherit one wtf allele will be killed by the poison of the wtf they did not inherit. Spores that inherit both wtf drivers due to a wtf duplication or disomy (aneuploidy or diploidy) will survive. Other outcomes of meiosis are not represented in this figure. (C) Viable spore yield values of heterozygous and homozygous S. pombe diploids in rec12+ and rec12Δ backgrounds. * indicates p-value<0.05 (Wilcoxon test) when comparing the rec12+ to rec12Δ fertility values. We compared the viable spore yield of each diploid in rec12+ and rec12Δ backgrounds. At least three, but usually more independent diploids were used to calculate viable spore yield. The data for rec12+ diploids is repeated from Figure 1. The data for Sk/Sk rec12Δ diploid (diploid 19) is repeated from Figure 3. The raw data are reported in Figure 5—source data 1.
-
Figure 5—source data 1
Raw data of the viable spore yield reported in Figure 5.
The top columns represent the S. pombe diploid assayed and the backgrounds in which it was tested (rec12+ or rec12Δ). The SZY strain numbers of both of the haploid parental strain are shown underneath the rec12 genotype. We present all of the viable spore yield values from independent assays. For statistical analyses, in every case, the rec12Δ diploid was compared to the rec12+ diploid. The raw data from the rec12+ crosses are also shown in Figure 1—source data 1. The raw data for the Sk rec12Δ are also presented in Figure 3—source data 2.
- https://cdn.elifesciences.org/articles/57936/elife-57936-fig5-data1-v1.xlsx
Figure 6 with 2 supplements
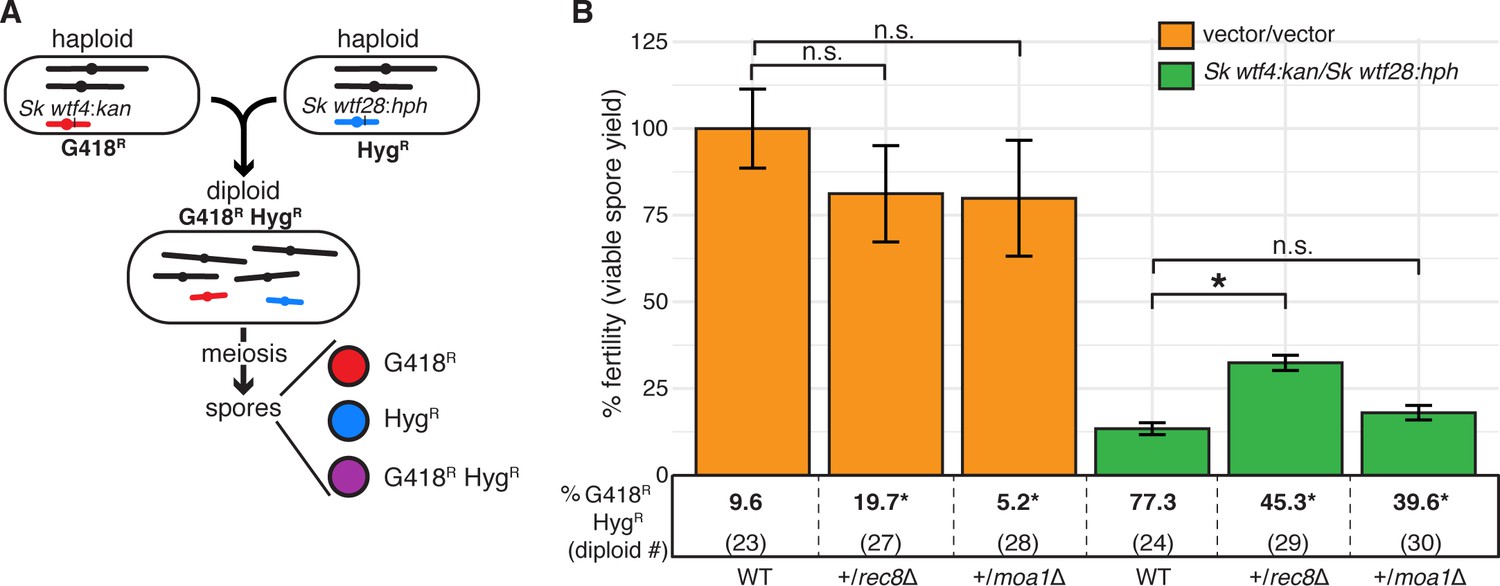
A heterozygous rec8 mutation increases fitness when wtf meiotic drivers are in competition.
(A) Schematic of diploid heterozygous for the HygR and G418R markers at the ade6 locus. (B) Fertility was measured using the viable spore yield assay in diploids with markers linked to competing wtf drivers (Sk wtf4/Sk wtf28) or empty vectors (vector/vector). Error bars represent the standard error of the mean. Underneath each bar graph is the % of G418R HygR (aneuploid, diploid, or haploid with duplication event) spores for each diploid. * indicates p-value<0.05 (G-test [G418R HygR] and Wilcoxon test [fertility]). For statistical analyses, diploids 27 and 28 were compared to diploid 23, and diploids 29 and 30 were compared to diploid 24. Data for diploids 23 and 24 are repeated from Figure 4. Raw data are found in Figure 6—source data 1 and Figure 6—source data 2.
-
Figure 6—source data 1
Raw data of allele transmission values reported in Figure 6 and Figure 6—figure supplement 1.
Each of the rows represents the relevant genotype and allele transmission of the indicated diploid. The first column matches the diploid number from Figure 6 and Figure 6—figure supplement 1. In columns 2–5 are the SZY strain number and relevant genotypes used to determine the allele transmission of the wtf genes or empty vector. Column six indicates if the diploid has a mutant or wild-type genotype. Columns 7 and 8 indicate the indicated genotype (ura+ or ura- spores) amongst haploids. Columns 10 and 11 indicate the number of haploid spores that exhibited the indicated phenotype (G418R or G418S) excluding G418R HygR spores. Column 12 shows the number of spores that exhibited the G418R HygR phenotype. Column 16 indicates the total number of spores assayed excluding G418R HygR spores. In diploid 53, we used the frequency of NatR G418R spores, instead of G418R HygR. Column 17 indicates the total number of spores assayed. Column 18 shows the total number of independent diploids assayed for each cross. The last two columns show the p-values calculated from the allele transmission at ade6 and G418R HygR spores, respectively. To calculate the p-values using a G-test, we compared diploids 25, 27, 28, 54, 56, 58, and 60 to control diploid 23; and diploids 26, 29, 30, 55, 57, 59, and 61 to control diploid 24. For comparison purposes, we included the data for diploids 23–26, which are also shown in Figure 2—figure supplement 5 and Figure 4—source data 1. The data for diploid 23 were previously published in Bravo Núñez et al., 2020.
- https://cdn.elifesciences.org/articles/57936/elife-57936-fig6-data1-v1.xlsx
-
Figure 6—source data 2
Raw data of the viable spore yield reported in Figure 6 and Figure 6—figure supplement 1.
Each column represents the diploid assayed, which matches the diploid number in Figure 6 and Figure 6—figure supplement 1. The diploid number and SZY strain numbers of both haploid parental strains are shown at the top. We present all the viable spore yield values from independent assays. We calculated the p-value using the Wilcoxon test by comparing diploids 25, 27, 28, 54, 56, 58, and 60 to control diploid 23; and diploids 26, 29, 30, 55, 57, 59, and 61 to control diploid 24. For comparison purposes, we included the data for diploids 23–26, which are also shown in Figure 2—source data 2 and Figure 4—source data 2. The data for diploid 23 were previously published in Bravo Núñez et al., 2020.
- https://cdn.elifesciences.org/articles/57936/elife-57936-fig6-data2-v1.xlsx
Figure 6—figure supplement 1
Fitness costs of some meiotic mutants are reduced in diploids with competing wtf meiotic drivers relative to a background without wtf competition.
(A) Schematic of diploid heterozygous for the HygR and G418R markers at the ade6 locus. Fertility measured by viable spore yield in (B) an inbreeding scenario (empty vector/empty vector) or (C) an outcrossing scenario with one set of heterozygous drivers (Sk wtf28/Sk wtf4) in wild-type, rec12Δ, sgo1Δ, rec10Δ, moa1Δ, and rec8Δ homozygous backgrounds. Underneath the bar graph is the % of G418R HygR (aneuploid, diploid, or haploid with duplication event) spores for each diploid. In the sgo1 mutant for the vector/vector diploid, we used the frequency of NatR G418R spores, instead of G418R HygR. Error bars represent the standard error of the mean. * indicates p-value<0.05 (G-test [G418R HygR, NatR G418R] and Wilcoxon test [fertility]). For statistical analyses of the frequency of G418R HygR (or NatR G418R) spores and fertility, we compared diploids 25, 54, 56, 58, and 60 to control diploid 23, and diploids 26, 55, 57, 59, and 61 to control diploid 24. At least three, but usually more, independent diploids were used to calculate viable spore yield. Additionally, more than 200 viable spores were scored for each diploid. The data for diploid 23 were previously published in Bravo Núñez et al., 2020. Data for some or all of diploids 23–26 are also shown in Figure 4 and Figure 6. Raw data are shown in Figure 6—source data 1 and Figure 6—source data 2.
Figure 6—figure supplement 2
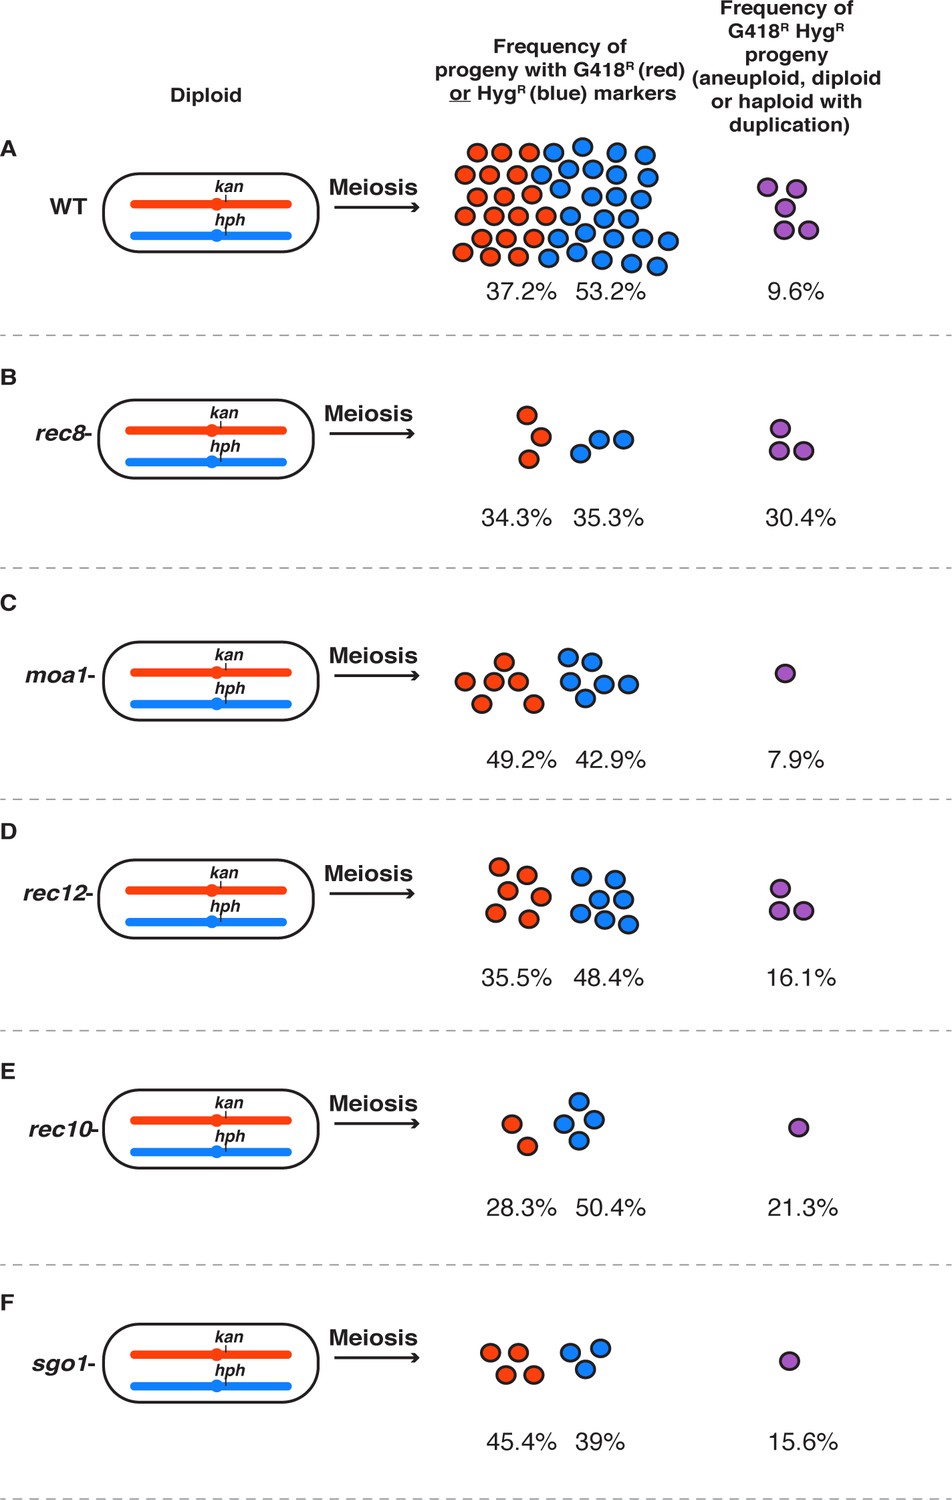
Pictorial description of mutant effects on fertility and the frequency of G418R HygR spores.
Summary figure depicting the percentage of haploids and abnormal spores (aneuploids, diploids, and haploids with duplications of (A) wild type, (B) rec8, (C) moa1, (D) rec12, (E) rec10, and (F) sgo1 based on viable spore yield and allele transmission values. If spore viability was wild type, there are 50 circles. Fewer circles represent a proportional drop in viable spore yield. The raw data used to generate this figure can be found in Figure 6—source data 1 and Figure 6—source data 2.
Figure 7

Population genetics of a meiotic mutant in response to meiotic drive.
(A) Schematic of the spore progeny generated by S. pombe diploids when the infidelity of chromosome segregation (f) is 0 or 1 and the strength of drive (t) is 0 or 1. (B) Critical drive strength (tcritical) for invasion of the segregation infidelity mutant given n drivers. This assumes that there is no cost of the meiotic mutant. (C) Trajectories of meiotic mutants starting at a frequency of 0.1. Note that the X-axis is a log scale.
Appendix 1—figure 1
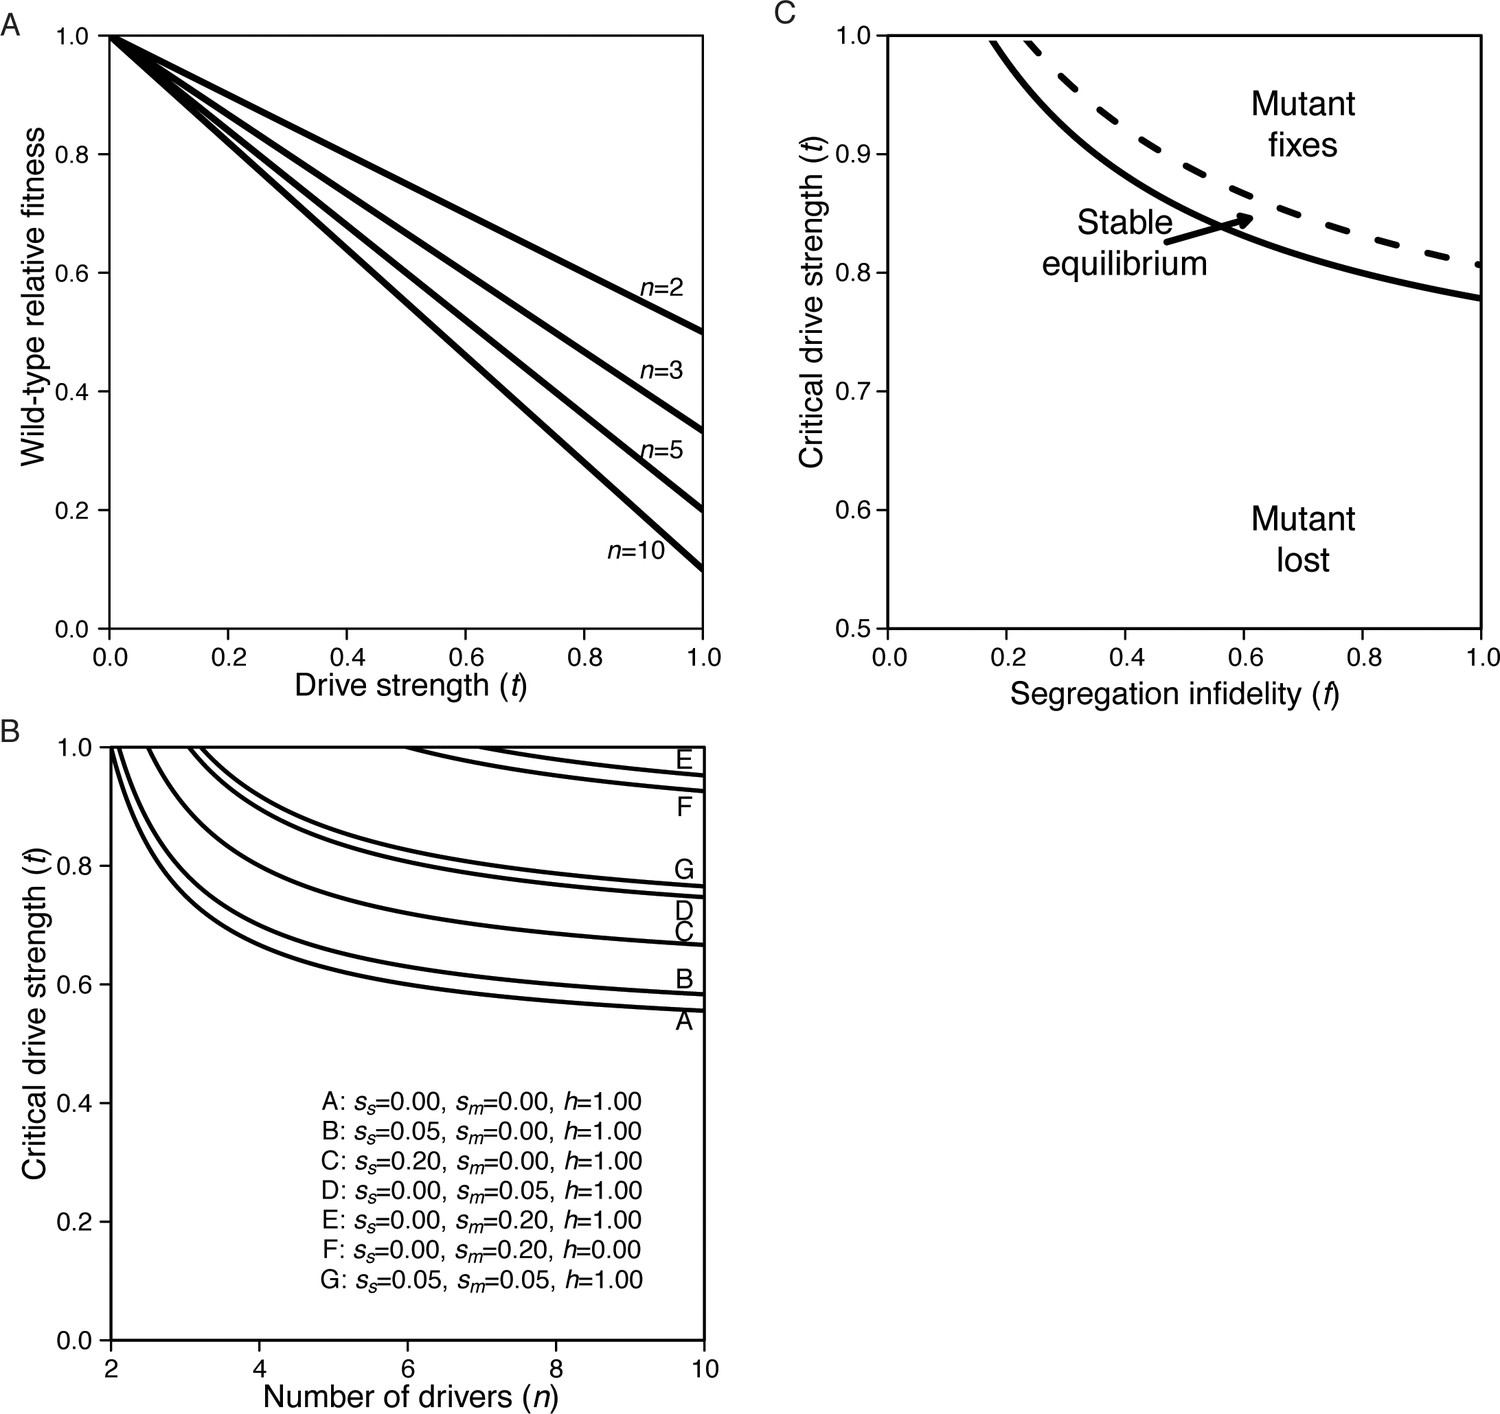
The drive load due to wtf segregating within populations.
(A) From Equation S.1, n is the number of drivers in the population and t is the strength of drive. Wild-type fitness is relative to a population without any drivers. (B) Meiotic mutant invasion criteria with extrinsic costs. All curves assume f = 0.1. Other parameters are listed in the plot. A mutant is expected to invade when the parameters for t and n fall above the line of interest. (C) Narrow parameter space allows for stable equilibrium. Solid line represents tcritical, below which the segregation mutant cannot invade. Dashed line represents tfixation, above which the mutant fixes. In the space between the lines, the equilibrium ranges from zero (solid line) to one (dashed line). n = 5, sm = 0.2, ss = 0.1, h = 1.
Additional files
-
Supplementary file 1
Yeast strains used in this study.
#Strains SZY1535 and SZY1537 are Ura+ because when the Sk wtf4 allele was originally made (described in Nuckolls et al., 2017), the strains retained the ura4+ cassette. The ura4 cassette is at an unknown location but linked to the wtf4 locus. *Strains SZY3910 and SZY3911 were generated via crossing. One of the parental strains had a wild-type ura4 allele and was thus Ura+. The other parental strain contained the ura4-D18, but had a rec12∆::ura4+, and thus was also Ura+. However, when we crossed the strains to generate SZY3910 and SZY3911, we confirmed the presence of the rec12 allele using PCR, but we did not determine if they contained the ura4-D18 or the ura4+ allele.
- https://cdn.elifesciences.org/articles/57936/elife-57936-supp1-v1.docx
-
Supplementary file 2
Plasmids used in this study.
- https://cdn.elifesciences.org/articles/57936/elife-57936-supp2-v1.docx
-
Supplementary file 3
Table summary of plasmid construction.
Column 1 lists the wtf gene cloned into each vector. Column 2 denotes the isolate from which each wtf was cloned. The DNA templates and oligos used in the PCR reactions to amplify the wtf alleles are shown in columns 3 and 4, respectively. We digested each of the amplified fragments with the enzymes reported in column 5 and then integrated into the target site listed in column 6. The strain number of each of the plasmids that we generated is reported in column 7. The description of each plasmid can be found in Supplementary file 2.
- https://cdn.elifesciences.org/articles/57936/elife-57936-supp3-v1.docx
-
Supplementary file 4
Oligo table.
- https://cdn.elifesciences.org/articles/57936/elife-57936-supp4-v1.docx
-
Transparent reporting form
- https://cdn.elifesciences.org/articles/57936/elife-57936-transrepform-v1.docx
Download links
A two-part list of links to download the article, or parts of the article, in various formats.
Downloads (link to download the article as PDF)
Open citations (links to open the citations from this article in various online reference manager services)
Cite this article (links to download the citations from this article in formats compatible with various reference manager tools)
Atypical meiosis can be adaptive in outcrossed Schizosaccharomyces pombe due to wtf meiotic drivers
eLife 9:e57936.
https://doi.org/10.7554/eLife.57936


